
2D numerical investigations derived from a 3D dragonfly wing captured with a high-resolution micro-CT
Abstract
BACKGROUND:
Due to their corrugated profile, dragonfly wings have special aerodynamic characteristics during flying and gliding.
OBJECTIVE:
The aim of this study was to create a realistic 3D model of a dragonfly wing captured with a high-resolution micro-CT. To represent geometry changes in span and chord length and their aerodynamic effects, numerical investigations are carried out at different wing positions.
METHODS:
The forewing of a Camacinia gigantea was captured using a micro-CT. After the wing was adapted an error-free 3D model resulted. The wing was cut every 5 mm and 2D numerical analyses were conducted in Fluent
RESULTS:
The highest lift coefficient, as well as the highest lift-to-drag ratio, resulted at 0 mm and an angle of attack (AOA) of 5
CONCLUSIONS:
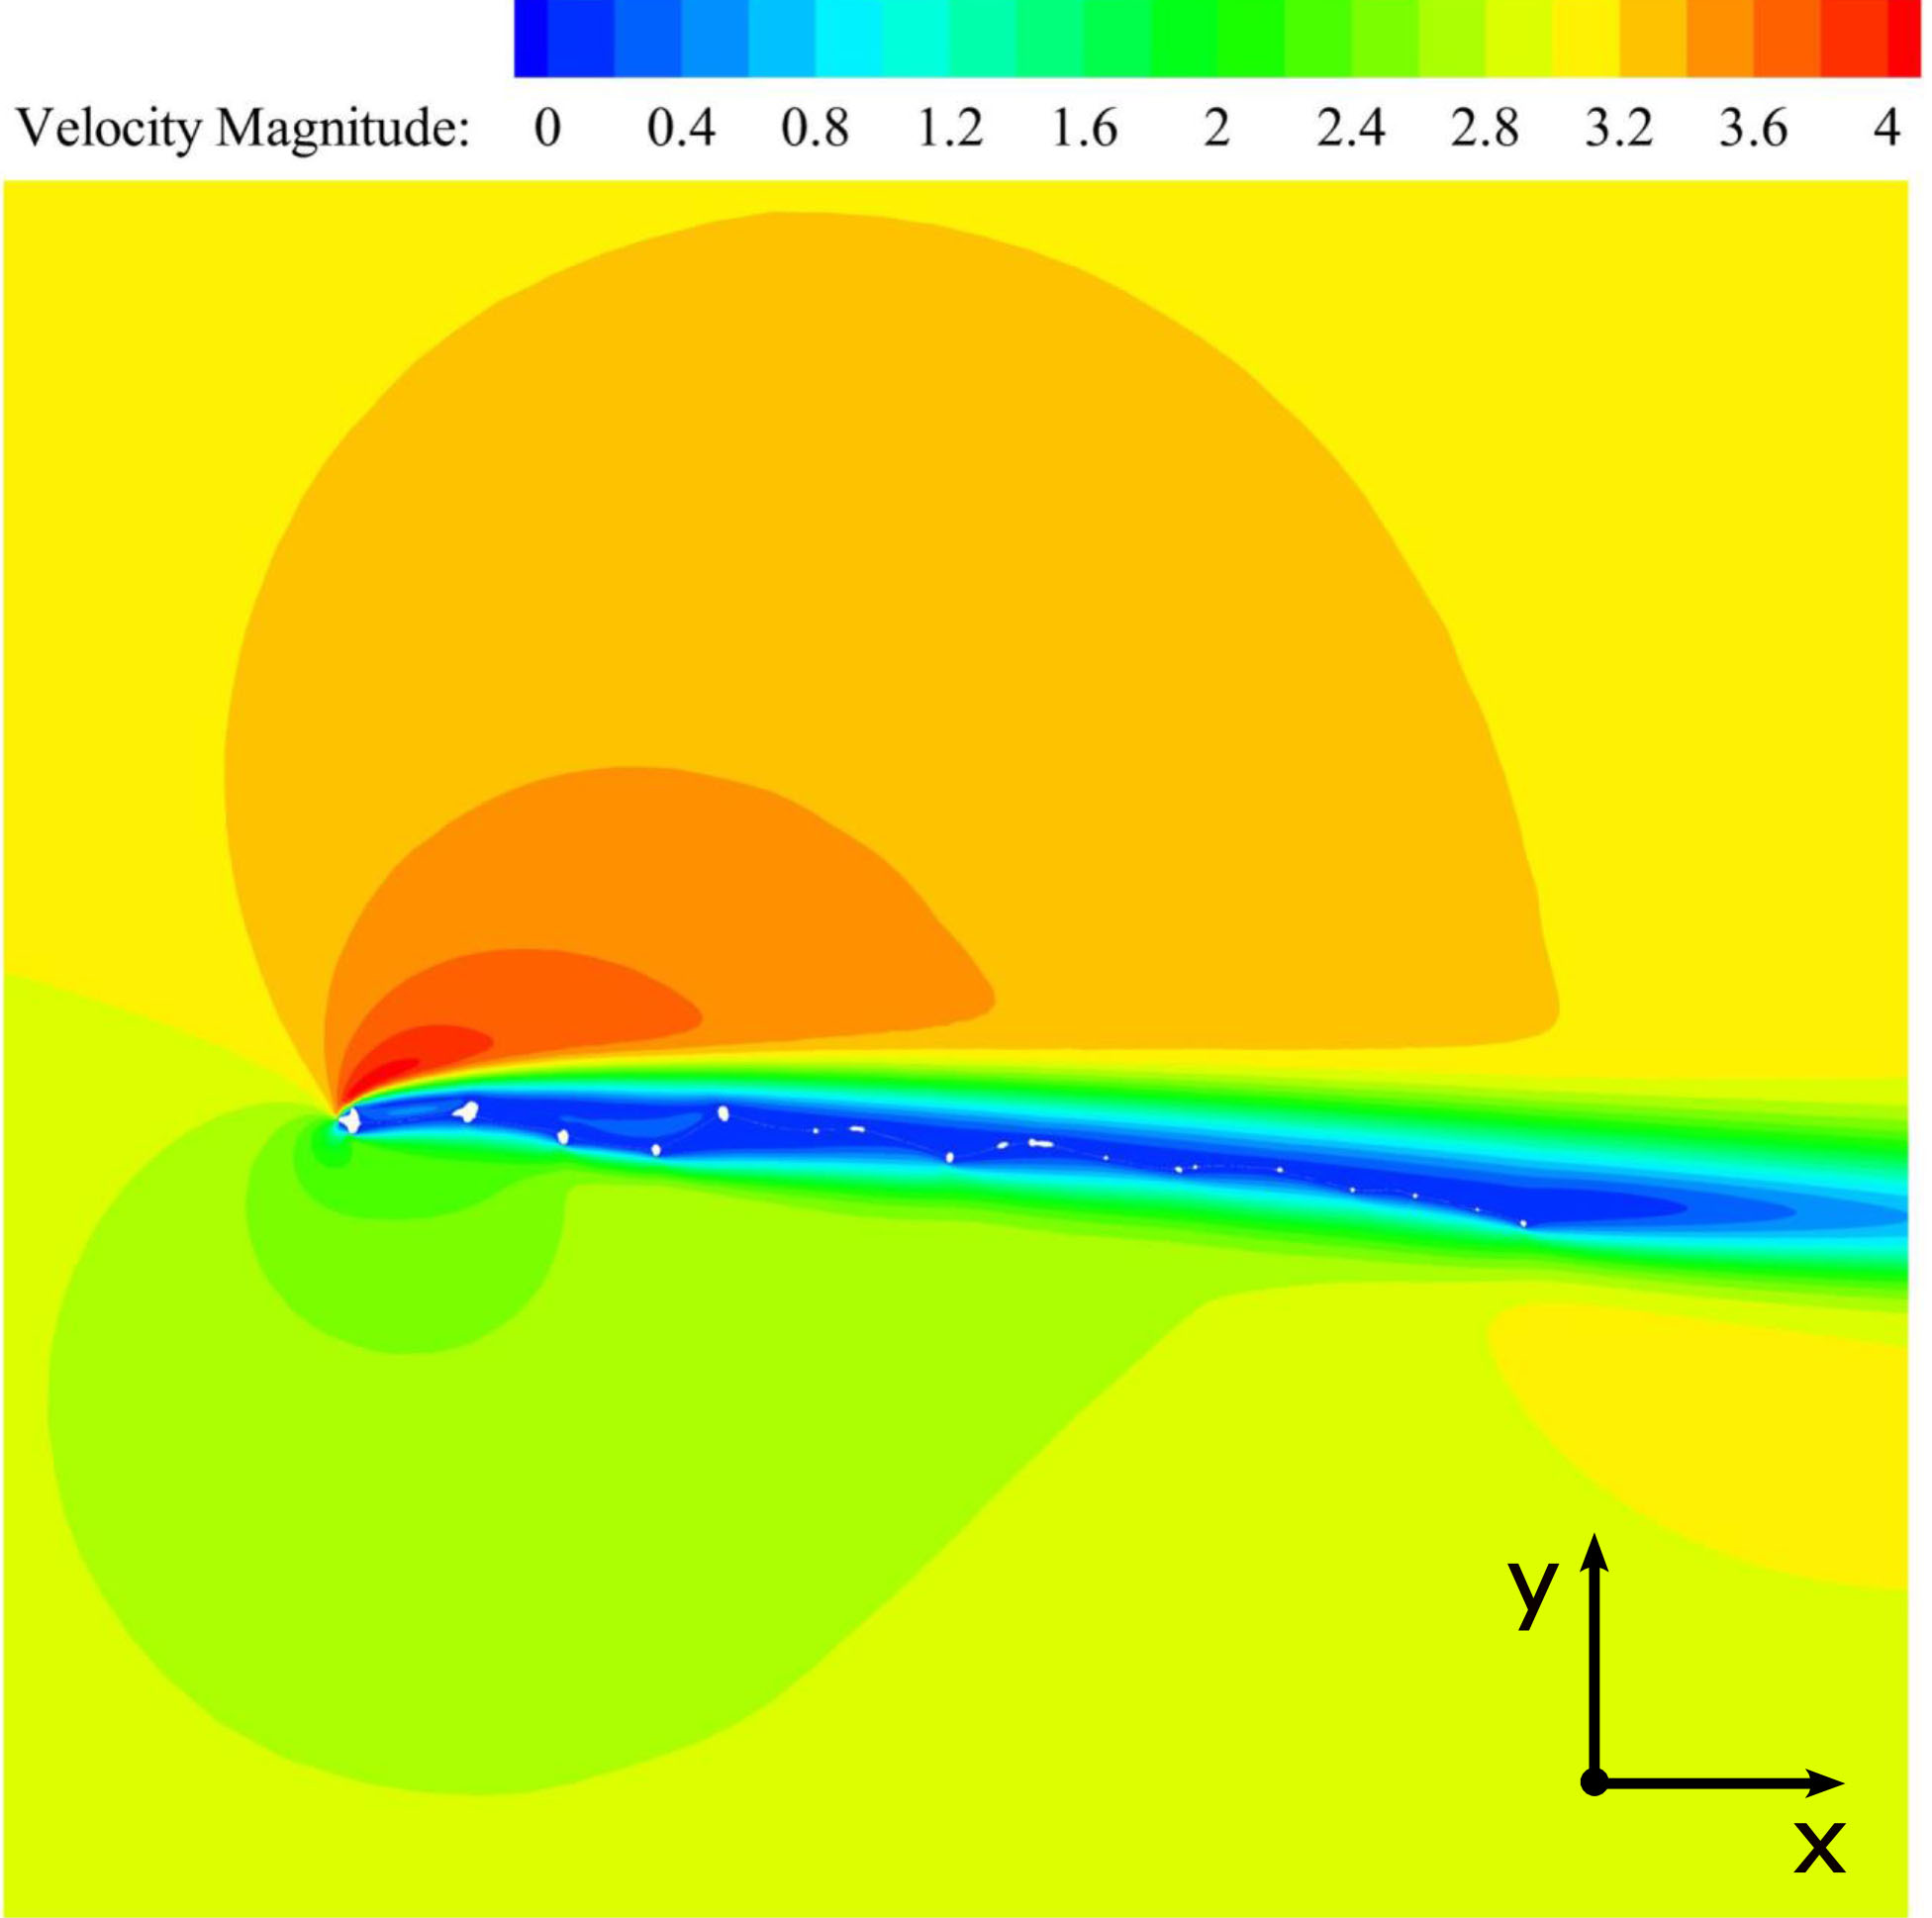
The velocity is higher on the upper side of the wing compared to the lower side. The pressure acts vice versa. Due to the recirculation zones that are formed in valleys of the corrugation pattern the wing resembles the form of an airfoil.
1.Background
Considering aerodynamic characteristics, the dragonfly with its special wing structure has one of the most interesting ways of flying and gliding. Its corrugated profile leads to special aerodynamic characteristics and manoeuvrability [1]. In previous studies, structural analyses were conducted to investigate the mechanical properties of the wing [1, 2, 3, 4, 5, 6]. Next to the structural influence of the corrugations, the aerodynamic effects of the corrugations also were investigated during gliding flight [7, 8, 9, 10, 11, 12]. Therefore, the aerodynamic performance of the pleated dragonfly wing was compared to streamlined airfoils [11, 12]. Furthermore, it was additionally compared to flat plates [9, 10]. Lift and drag coefficients were calculated under different flow conditions [9, 10, 11, 12]. Okamoto et al. compared two- and three-dimensional (2D and 3D) models during gliding flight in a wind tunnel [13]. The hindwing used by Okamoto et al. was reconstructed in Chen and Skote’s study [14]. Only the first corrugations were considered. The further wing structure in the direction of the chord length was neglected and assumed to be a membrane [14]. It was found that only a 3D model of the whole wing is able to capture the occurring changes in spanwise direction [14]. Next to gliding flight, flapping flight has also been investigated [15, 16, 17, 18]. Song et al. conducted numerical studies on a 3D forewing model neglecting small corrugated structures and small variations in the vein frame [15]. Dragonflies are a great role-model for bionic micro-air-vehicles (MAVs) [14, 19, 20]. MAVs and Biomimetic micro-air-vehicles (BMAVs) are very light and small features, which can imitate the movements of the wings of birds, insects, and bats [20]. To fully capture all aerodynamic effects during gliding flight, it is important not only to reconstruct and approximate a wing but to represent the actual geometry with its corrugations and real form of the vein structure. Therefore, the aim of this study is to create a model of a real dragonfly wing to perform Computational Fluid Dynamics (CFD) investigations.
2.Objective
This work aimed to create a 3D model of a dragonfly wing as it occurs in nature. The 3D wing was cut at several locations to represent geometry changes and their aerodynamic effects in span length and chord length. With these 2D cross-sections, numerical analyses were conducted.
3.Methods
The forewing of a Camacinia gigantea was captured using a micro-CT. Due to the limited resolution of the micro-CT with 7
The 3D wing was cut at several locations to represent geometry changes in chord length and span length as well as their aerodynamic effects. As an initial study, only 2D results are presented within this short communication. The origin of the coordinate system is located at half of the span length. Therefore, cross-sections were created at 5 mm intervals, starting at the wing root at
The cross-sections were converted to splines for meshing in CENTAUR™. Angles of attack (AOA) of 0
Figure 1.
a) Resulting geometry of the whole wing; The dashed lines mark the positions of the cross-sections in mm; b) Enlargement of the marked area in a); c) Detail of the mesh near the leading edge at location 5 mm.
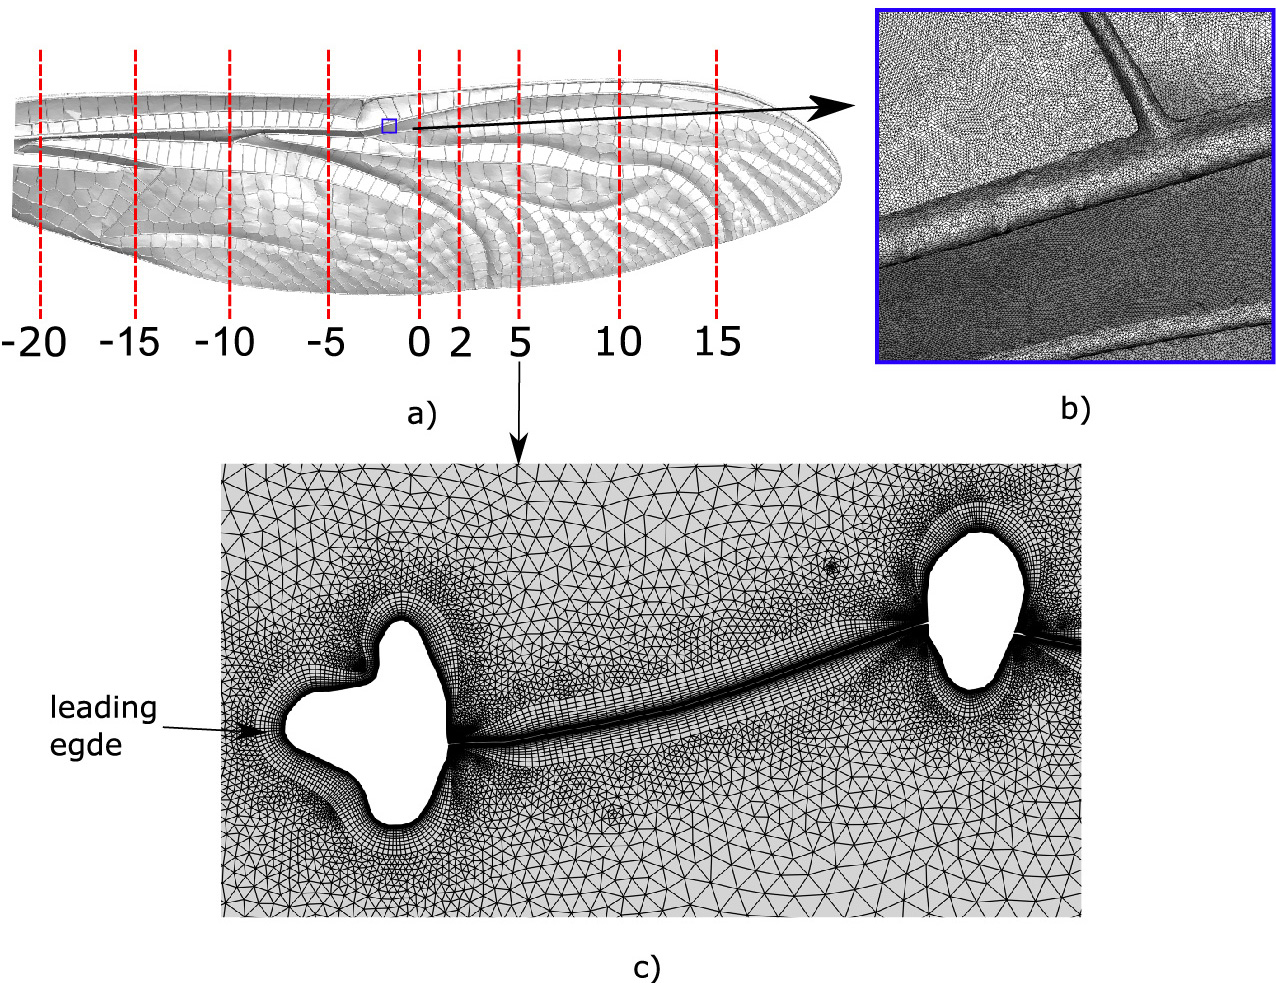
Figure 2.
a) Lift and Drag coefficient at the different cross sections (in mm) at angles of attack (AOA) of 0
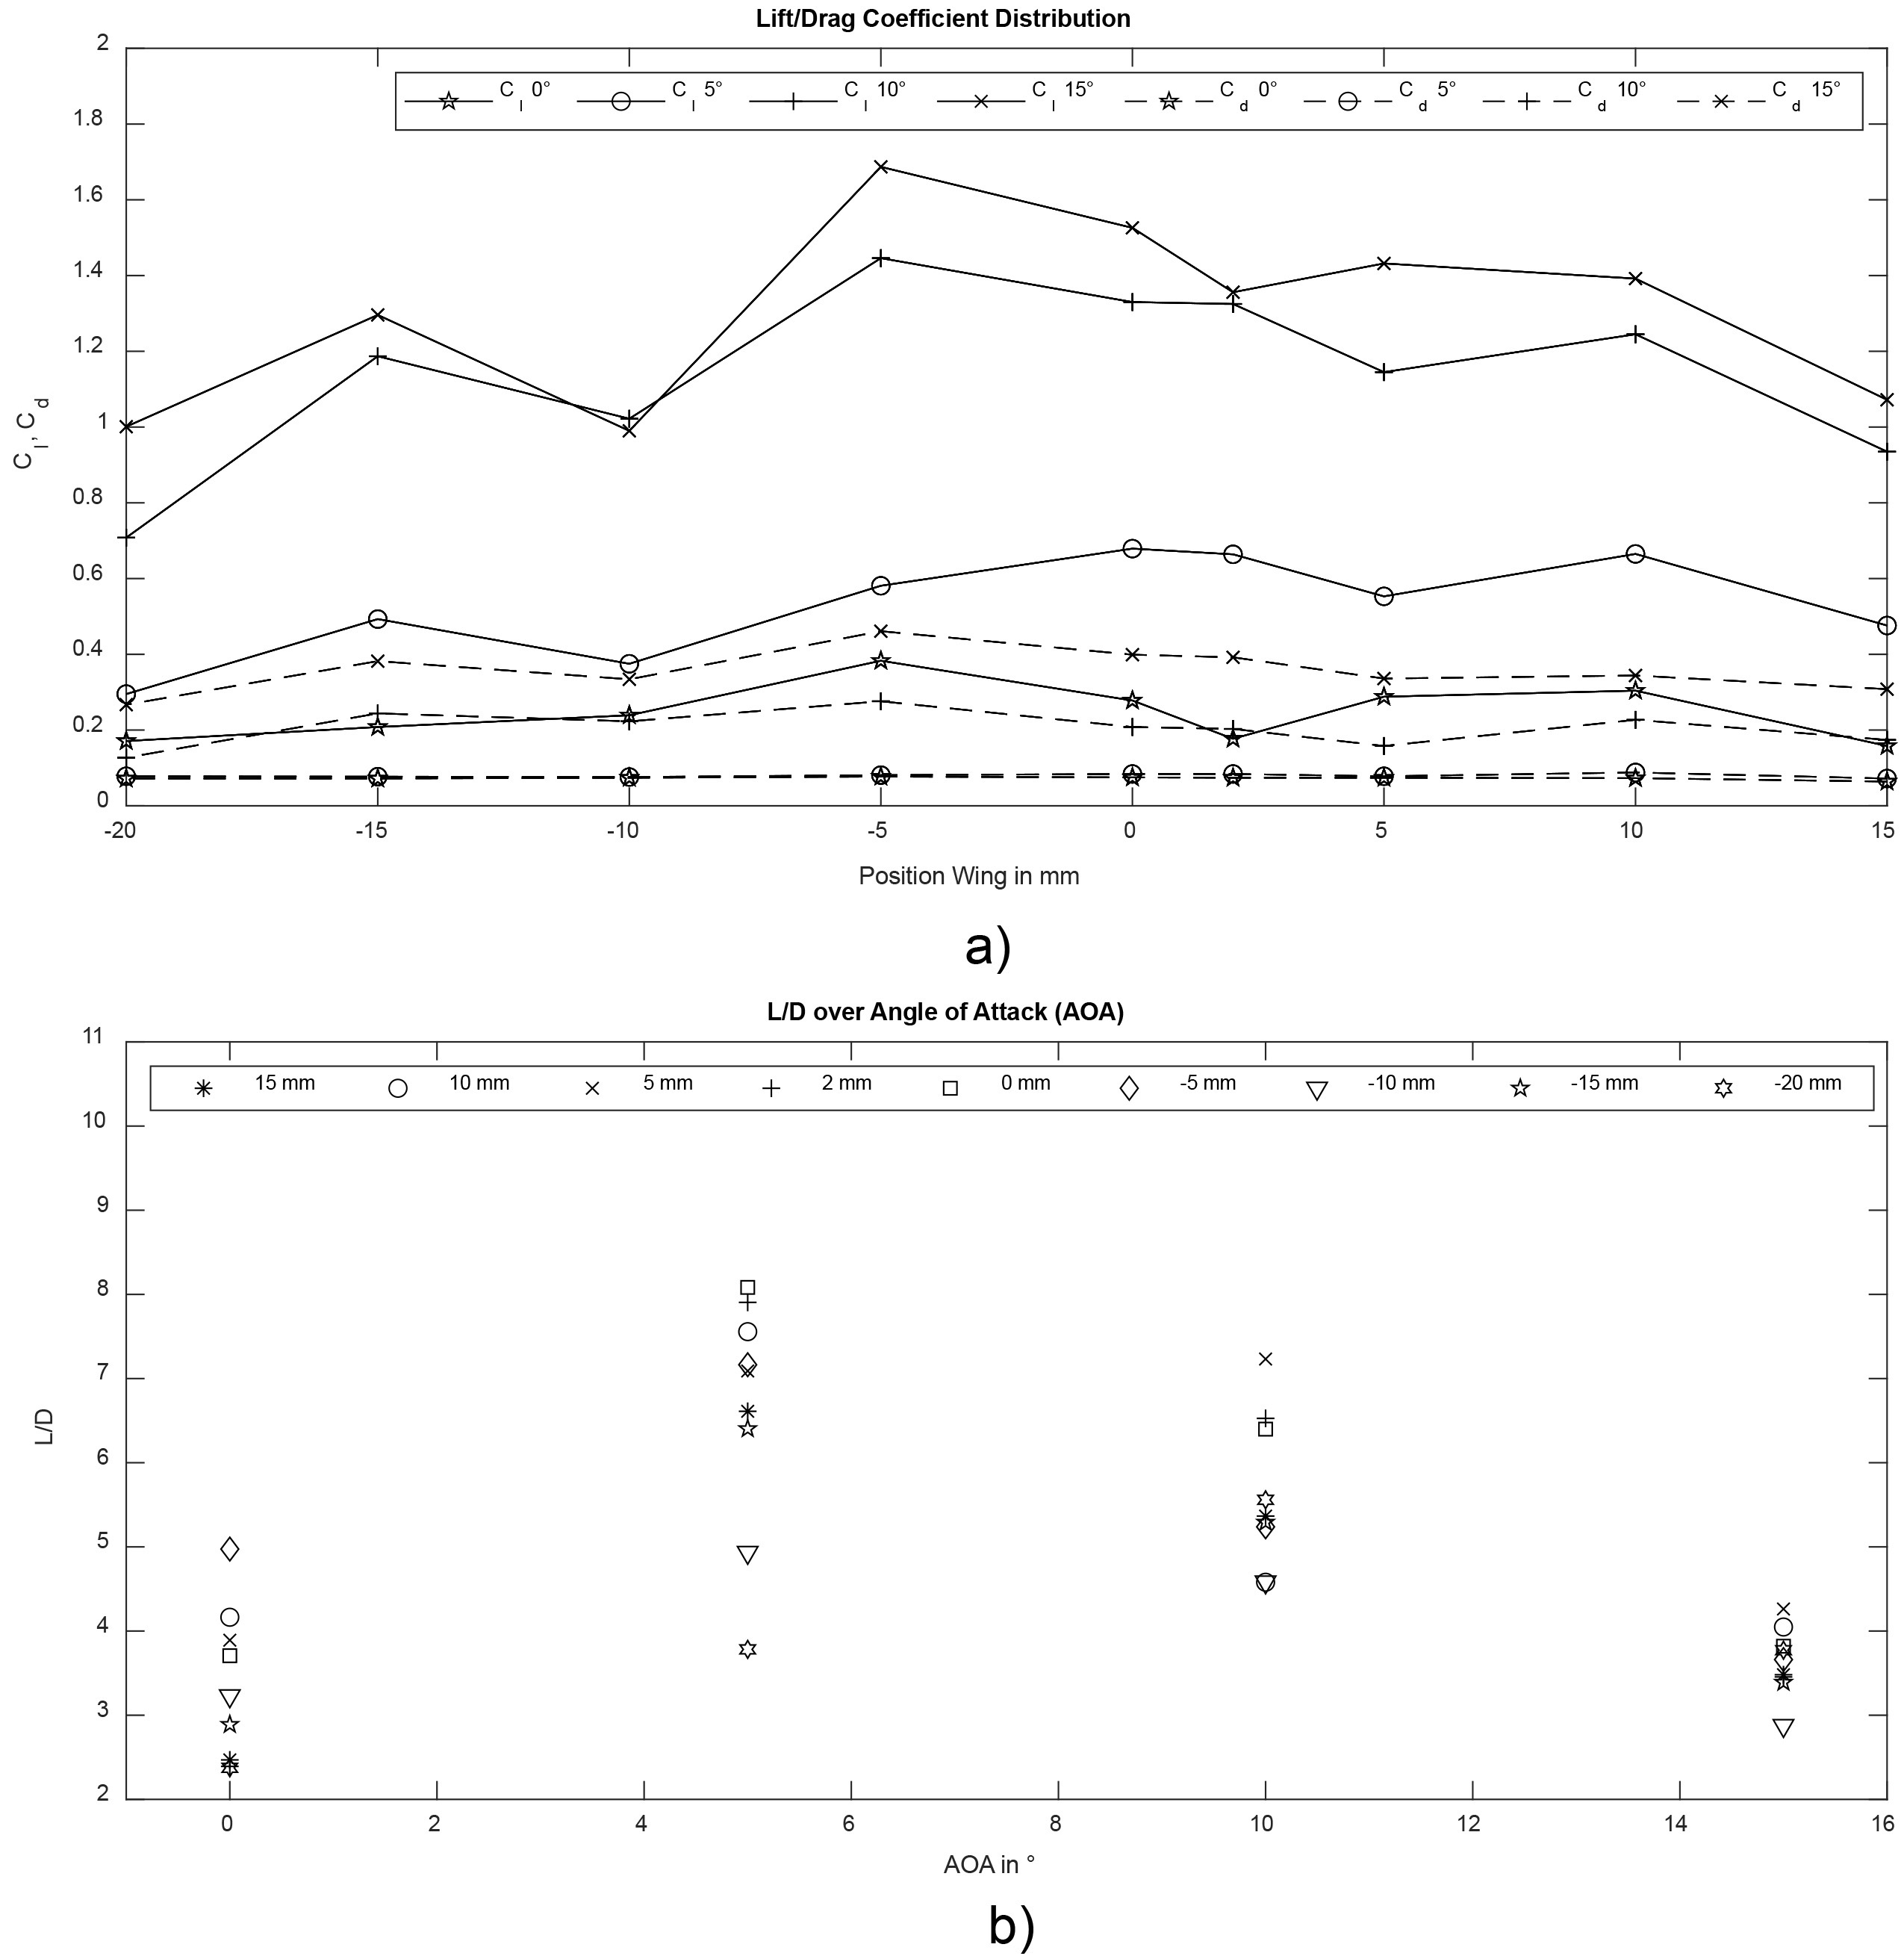
Figure 3.
Velocity magnitude distribution of the wing cross-section at 0 mm at an AOA of 5
For pressure-velocity coupling, the SIMPLEC scheme was used for the steady and transient calculations. To calculate the gradient, the Least Squares Cell Based method was chosen, for momentum second order upwind and second order implicit for the transient formulation. A grid convergence study was performed leading to an accuracy of one drag count. Convergence within the range of 1e-5 was reached. The results and images were plotted in Tecplot
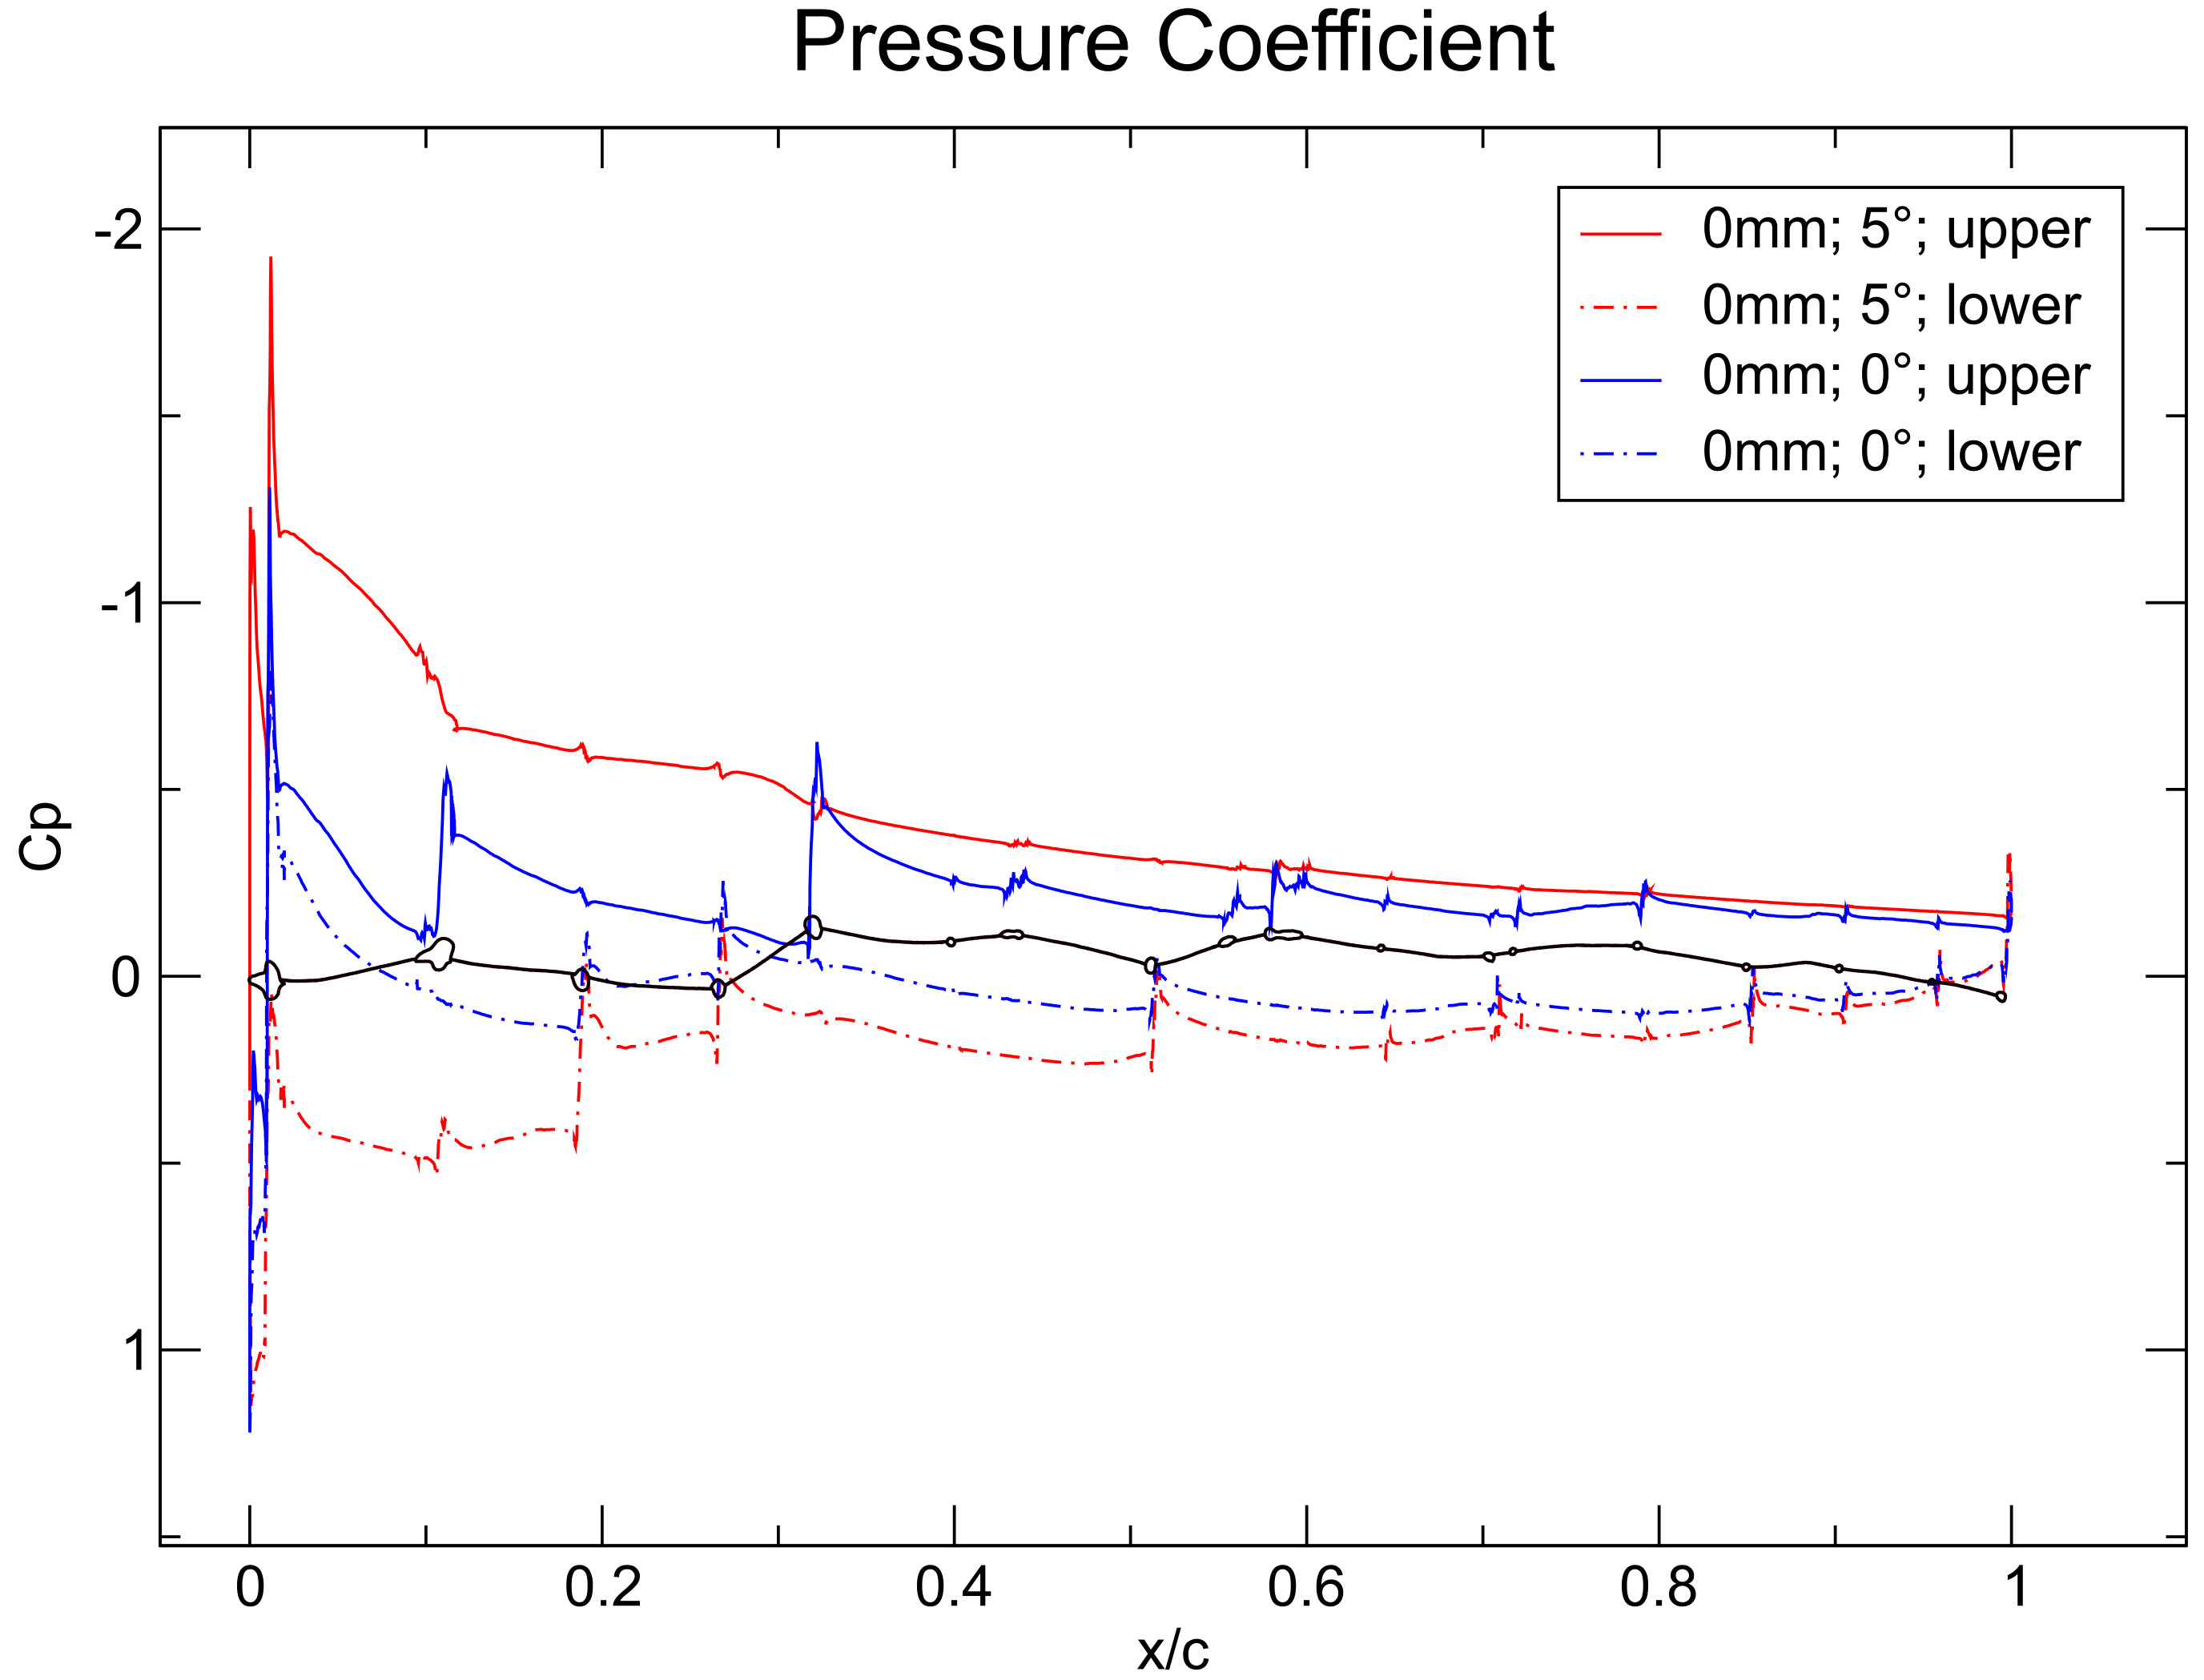
Figure 4.
Pressure coefficient of the wing cross-section at 0 mm at an AOA of 5
4.Results
Figure 1a and b show the resulting STL-geometry. Figure 1c shows a detail of the resulting mesh at location 5 mm. Steady analyses were conducted for the wing cross-sections at AOAs of 0
Figure 5.
Velocity magnitude distribution of the wing cross-section at 5 mm and an AOA of 10
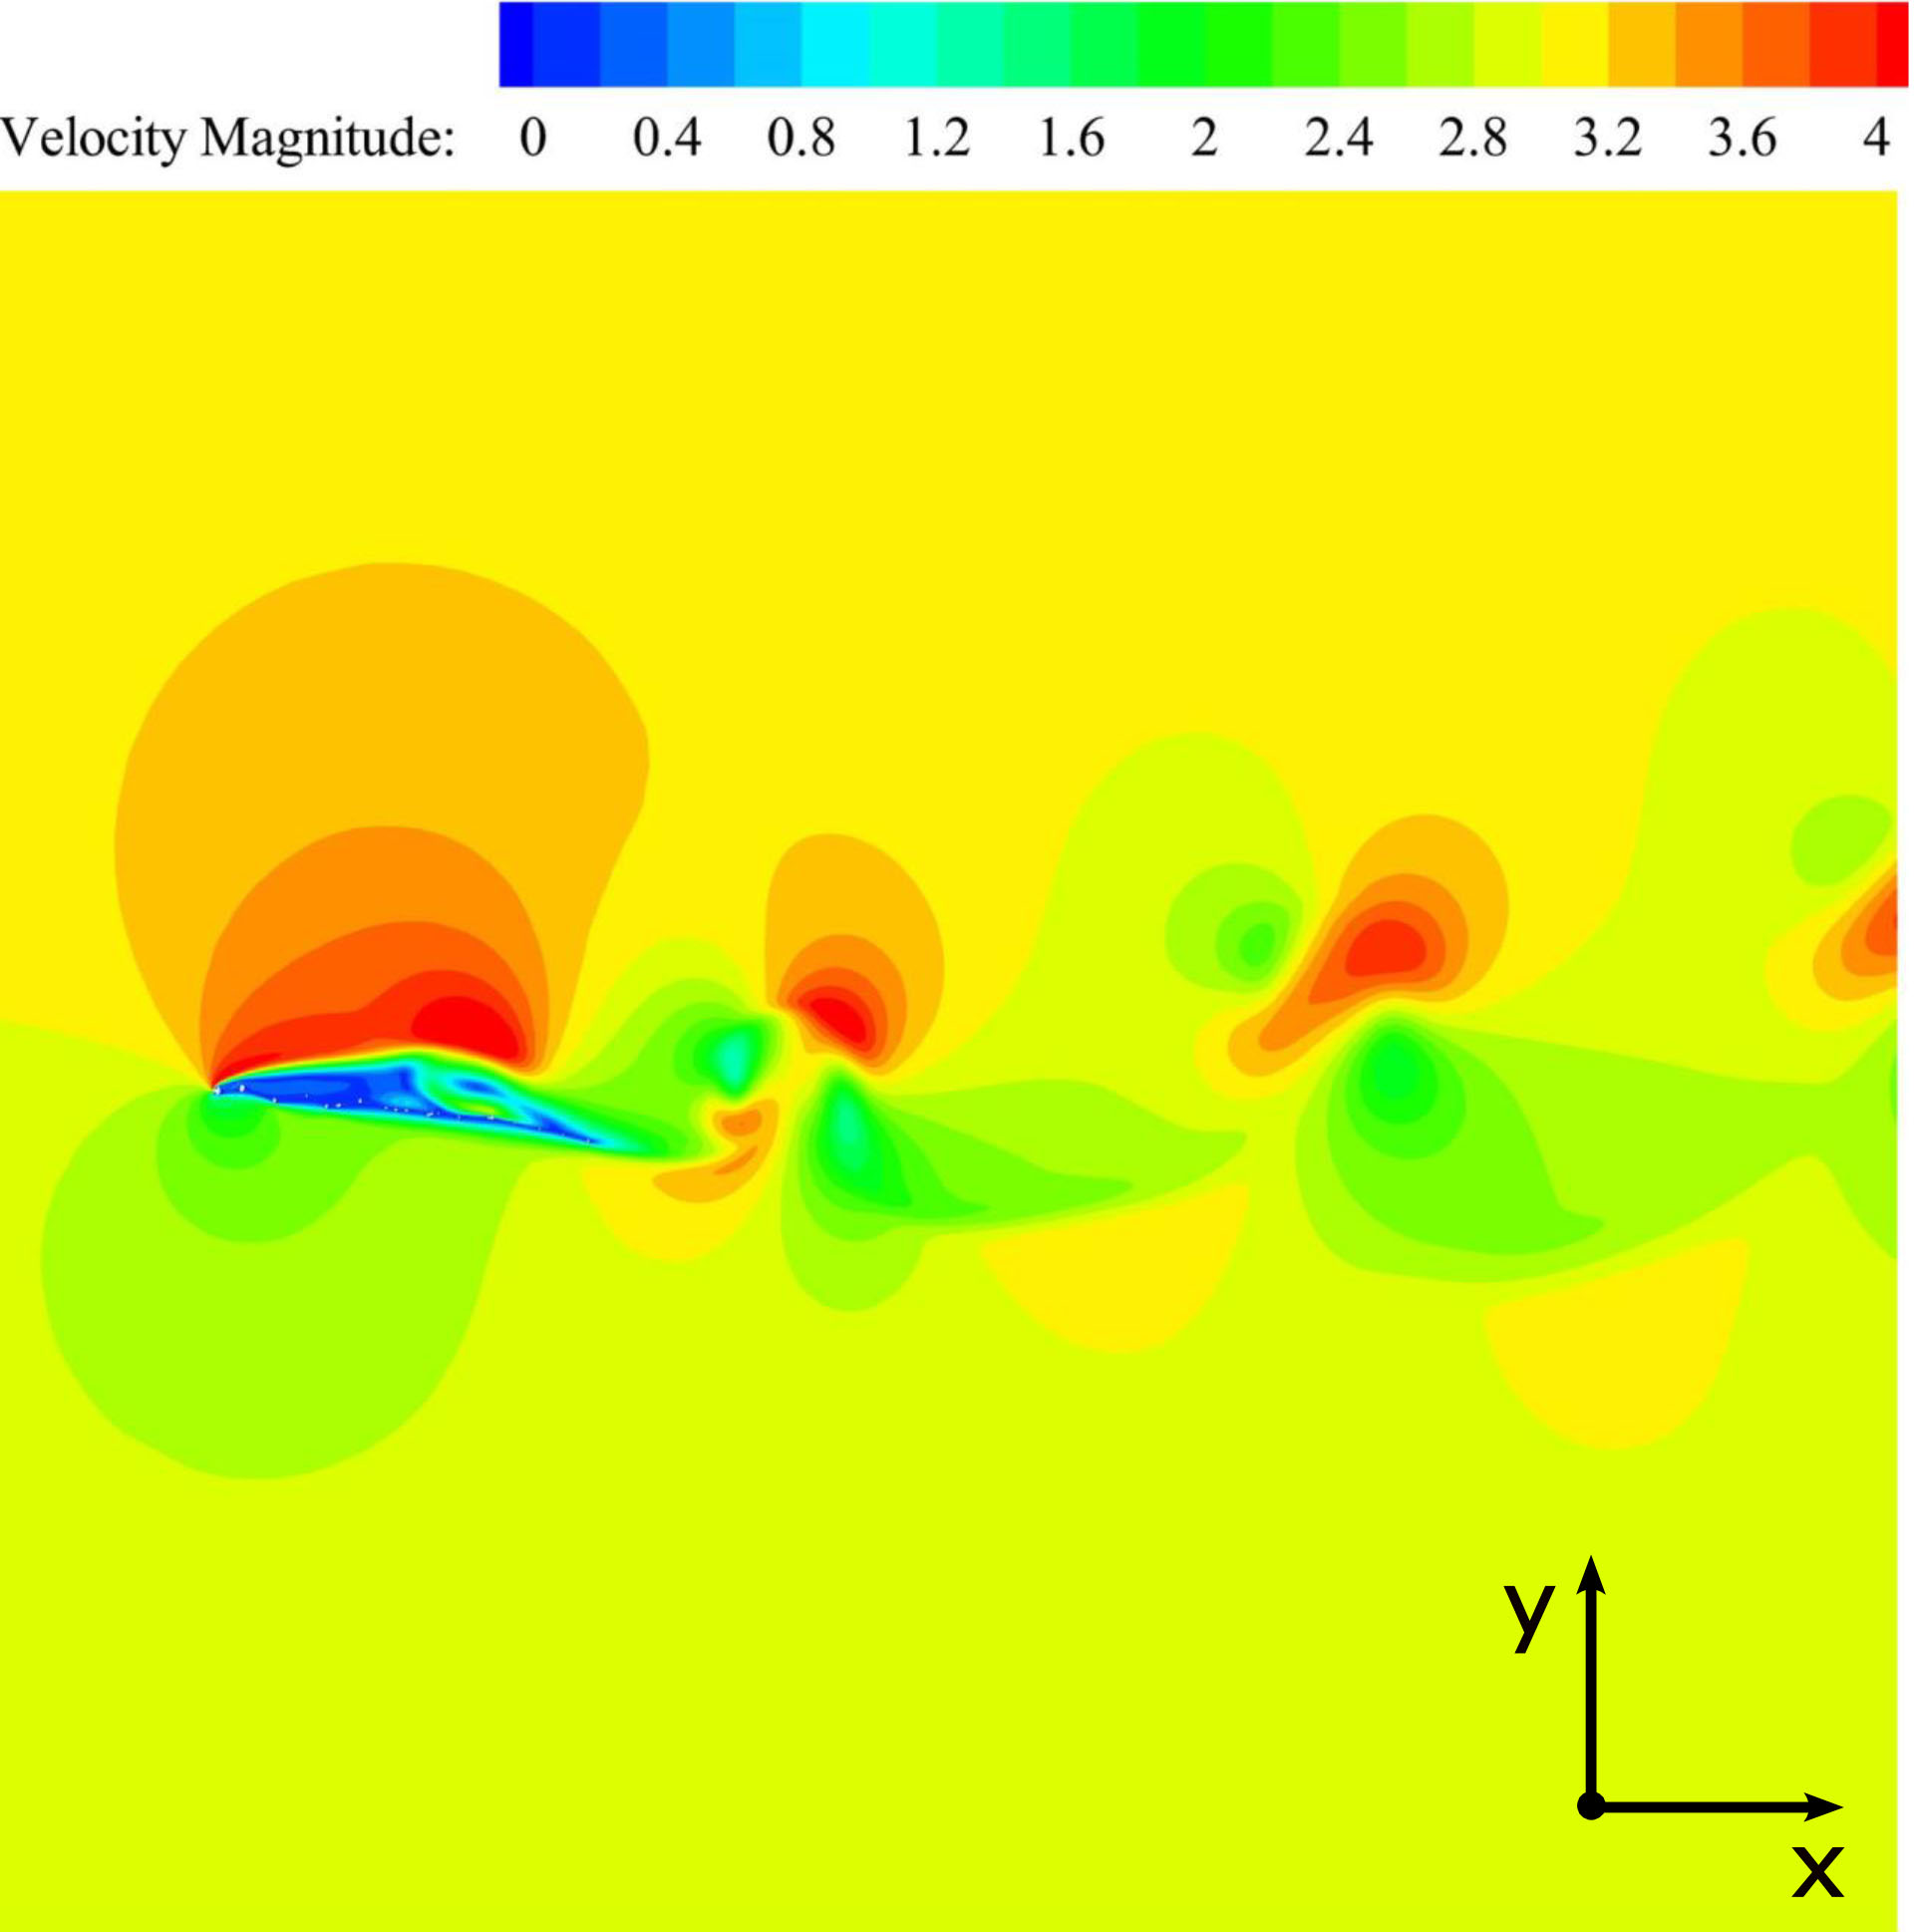
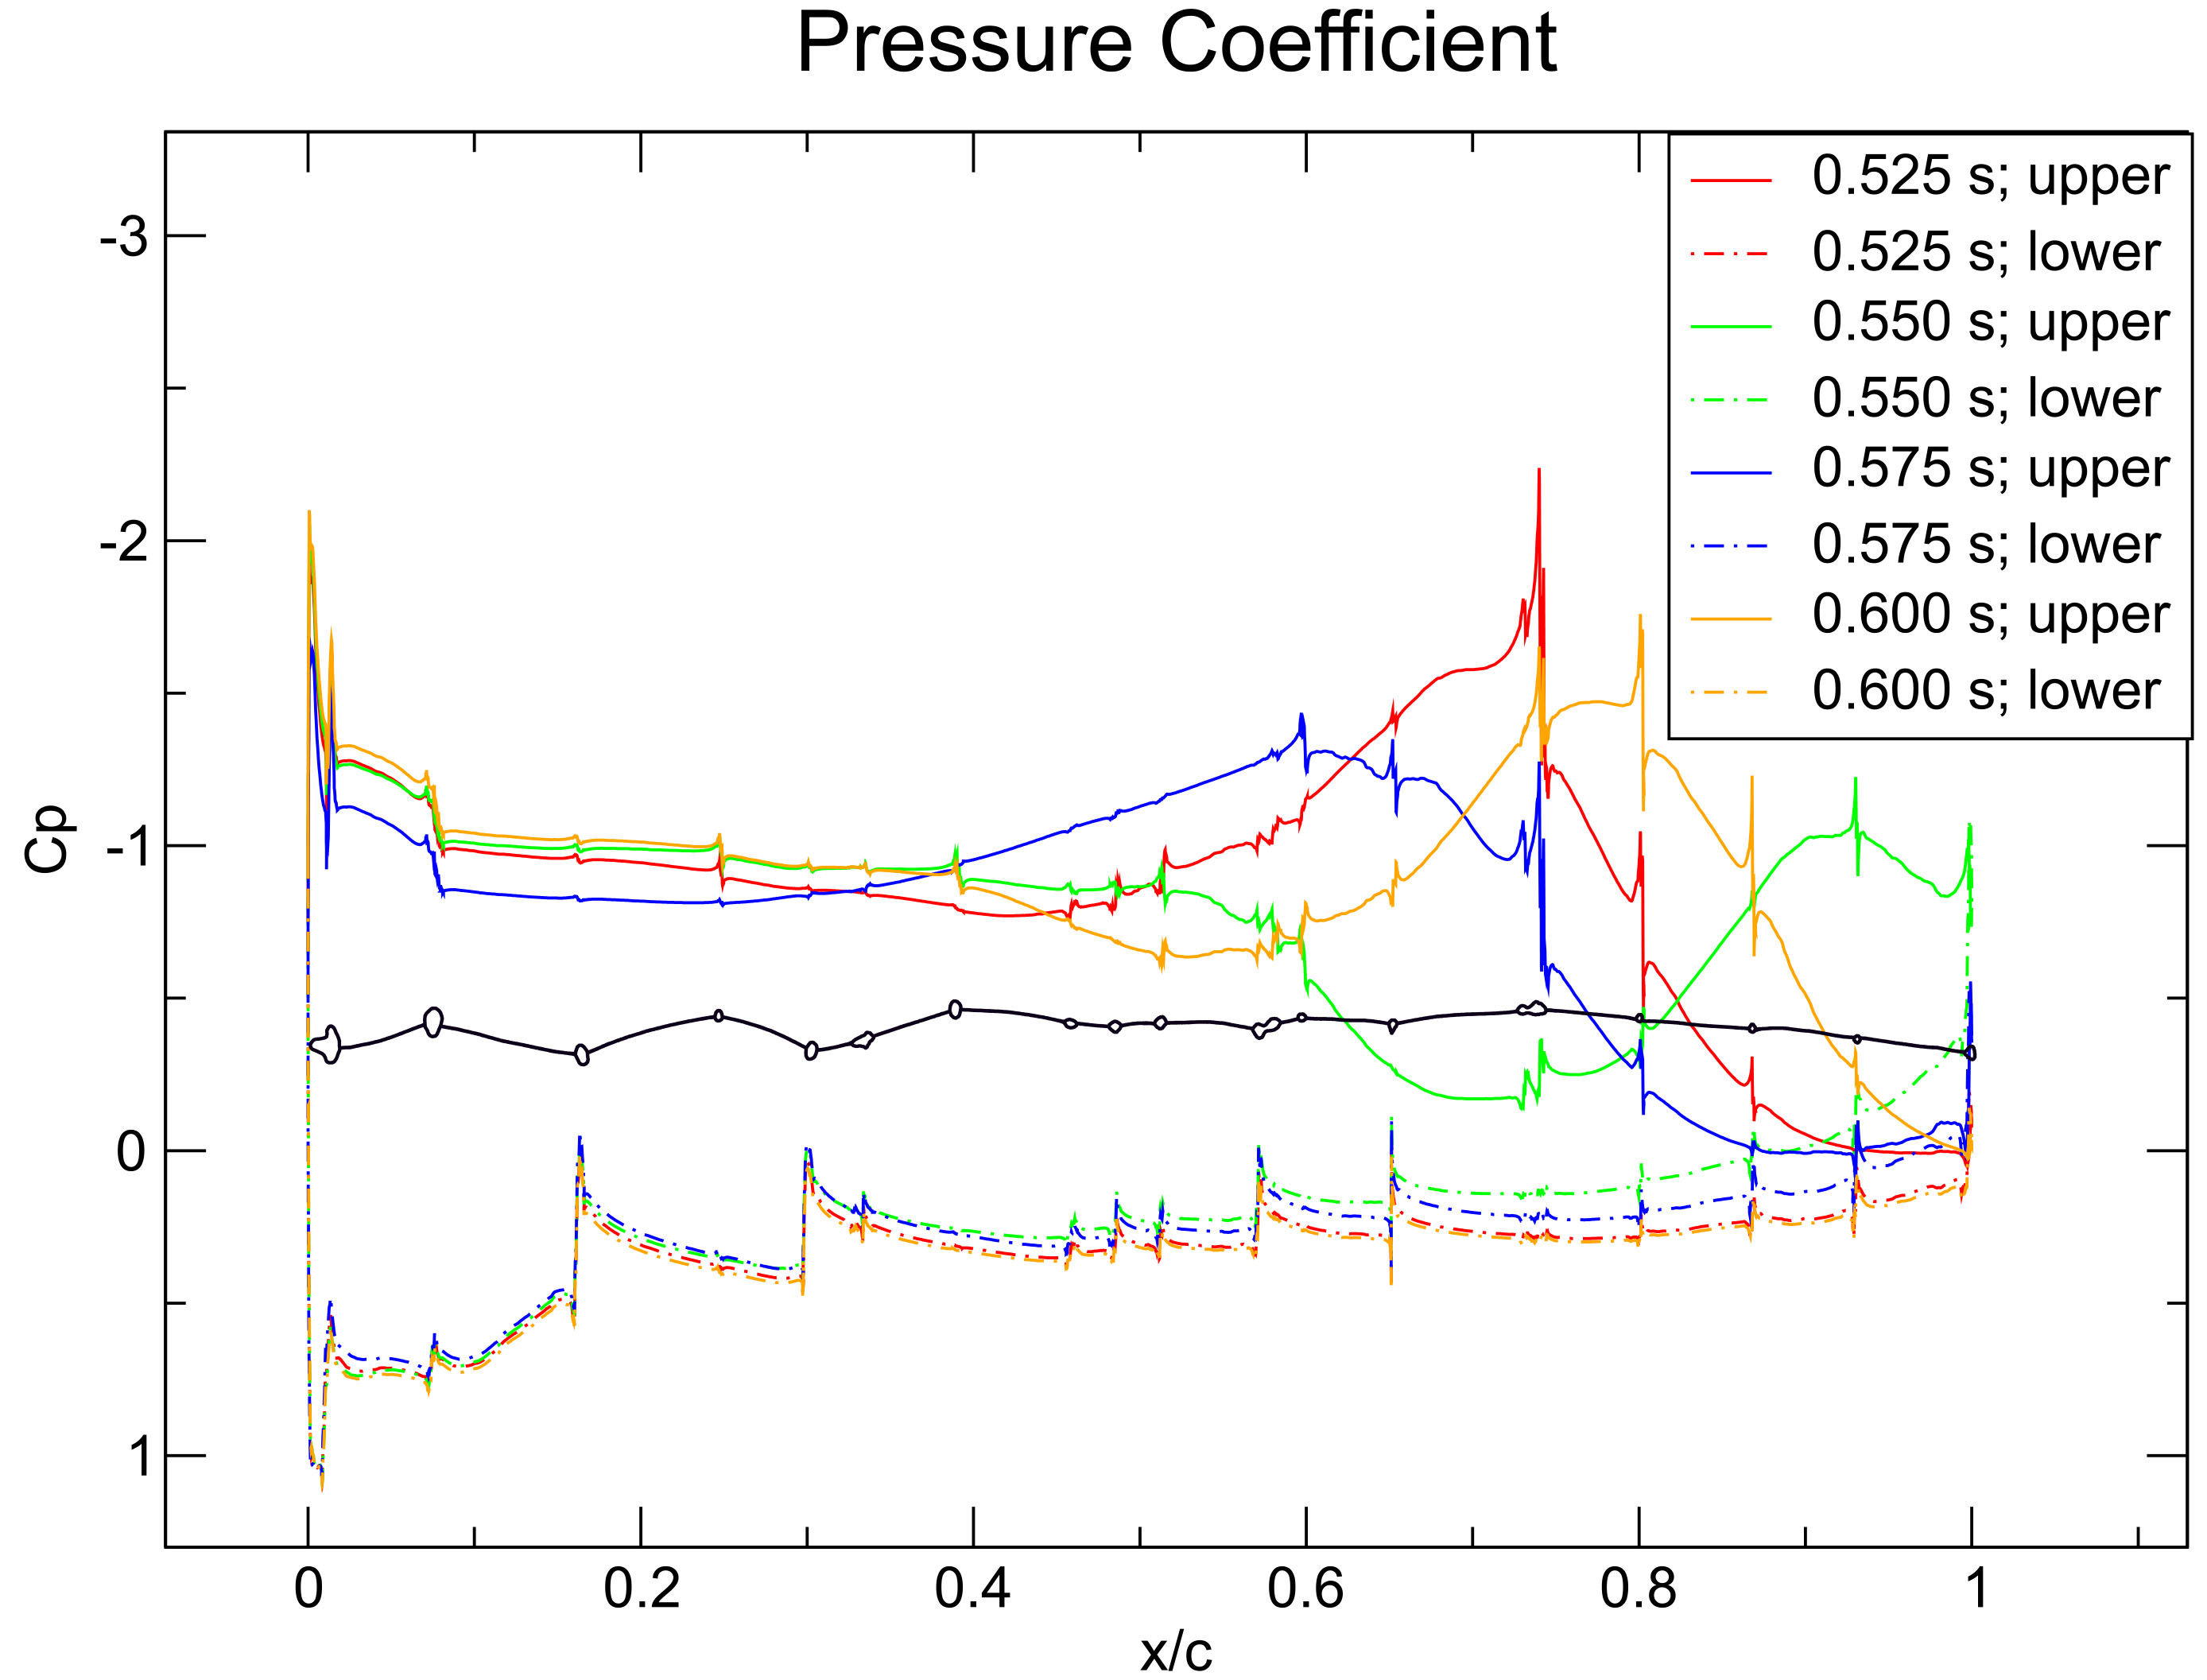
Figure 6.
Pressure coefficient of the wing cross-section at 5 mm and 10
Once the wing cross-sections were rotated about 10
5.Conclusions
Due to the steady vortices that occur in the valleys of the corrugated wing profile, recirculation zones are formed. Therefore, the flat wing’s profile resembles the profile of an airfoil. Due to the corrugations, especially on the upper side the pressure decreases more compared to that of an airfoil. This may lead to higher lift coefficients. The corrugations decrease in the direction of the wing tip. The more the wing is corrugated, the higher the drag coefficient. Therefore, the wing might have its lowest drag coefficient at 15 mm. However, the highest drag coefficient results at 10 mm. This could be explained, due to the also high lift coefficient.
After the wing cross-sections were rotated about 10
The spikes in the graphs of the pressure coefficients appear when the flow hits the vein structure. The flow stagnates when it hits a vein, therefore the pressure rises. During passing the vein the flow accelerates. The area between the pressure coefficient of the upper and the lower graph at 0 mm is higher at the AOA of 5
The orientation of the wing’s leading edge changes at the wing nodus. From the root to the nodus, the leading edge points upwards, from nodus to tip, it points downwards. This change in the orientation of the leading might influence the lift and drag coefficients. Okamoto et al. states, that the orientation change of the leading edge influences the aerodynamic performance [13]. In this study, especially considering the steady analyses the lift coefficient and the L/D – ratio are higher after the nodus at 5
Conflict of interest
None to report.
References
[1] | Sun J, Bhushan B. The structure and mechanical properties of dragonfly wings and their role on flyability. Comptes Rendus Mécanique. (2012) ; 340: : 3-17. doi: 10.1016/j.crme.2011.11.003. |
[2] | Ren H, Wang X, Li X, Chen Y. Effects of dragonfly wing structure on the dynamic performances. J Bionic Eng. (2013) ; 10: : 28-38. doi: 10.1016/S1672-6529(13)60196-1. |
[3] | Ren H-H, Wang X-S, Chen Y-L, Li X-D. Biomechanical behaviors of dragonfly wing: relationship between configuration and deformation. Chinese Phys B. (2012) ; 21: : 34501. doi: 10.1088/1674-1056/21/3/034501. |
[4] | Jongerius SR, Lentink D. Structural Analysis of a Dragonfly Wing. Exp Mech. (2010) ; 50: : 1323-34. doi: 10.1007/s11340-010-9411-x. |
[5] | Wootton RJ, Herbert RC, Young PG, Evans KE. Approaches to the structural modelling of insect wings. Philos Trans R Soc Lond B Biol Sci. (2003) ; 358: : 1577-87. doi: 10.1098/rstb.2003.1351. |
[6] | Song F, Xiao KW, Bai K, Bai YL. Microstructure and nanomechanical properties of the wing membrane of dragonfly. Materials Science and Engineering: A. (2007) ; 457: : 254-60. doi: 10.1016/j.msea.2007.01.136. |
[7] | Levy D-E, Seifert A. Parameter study of simplified dragonfly airfoil geometry at Reynolds number of 6000. J Theor Biol. (2010) ; 266: : 691-702. doi: 10.1016/j.jtbi.2010.07.016. |
[8] | Benedetti L, Bianchi G, Cinquemani S, Belloli M. A Numerical Study about the Flight of the Dragonfly: 2D gliding and 3D hovering regimes. International Journal of Engineering Research and Technology. (2020) ; 13: : 3310. doi: 10.37624/IJERT/13.11.2020.3310-3320. |
[9] | Kesel AB. Aerodynamic characteristics of dragonfly wing sections compared with technical aerofoils. Journal of Experimental Biology. (2000) ; 203: : 3125-35. doi: 10.1242/jeb.203.20.3125. |
[10] | Vargas A, Mittal R, Dong H. A computational study of the aerodynamic performance of a dragonfly wing section in gliding flight. Bioinspir Biomim. (2008) ; 3: : 26004. doi: 10.1088/1748-3182/3/2/026004. |
[11] | Kim W-K, Ko JH, Park HC, Byun D. Effects of corrugation of the dragonfly wing on gliding performance. J Theor Biol. (2009) ; 260: : 523-30. doi: 10.1016/j.jtbi.2009.07.015. |
[12] | Levy D-E, Seifert A. Simplified dragonfly airfoil aerodynamics at Reynolds numbers below 8000. Physics of Fluids. (2009) ; 21: : 71901. doi: 10.1063/1.3166867. |
[13] | Okamoto M, Yasuda K, Azuma A. Aerodynamic characteristics of the wings and body of a dragonfly. Journal of Experimental Biology. (1996) ; 199: : 281-94. |
[14] | Chen YH, Skote M. Gliding performance of 3-D corrugated dragonfly wing with spanwise variation. Journal of Fluids and Structures. (2016) ; 62: : 1-13. doi: 10.1016/j.jfluidstructs.2015.12.012. |
[15] | Song H, He GY, Wang Q, Chen LS. Numerical Study on the Aerodynamic Performance of the Rigid and Corrugated Forewing of Dragonfly in Flapping Flight. IOP Conf Ser Mater Sci Eng. (2020) ; 816: : 12005. doi: 10.1088/1757-899X/816/1/012005. |
[16] | Liu X, Hefler C, Fu J, Shyy W, Qiu H. Implications of wing pitching and wing shape on the aerodynamics of a dragonfly. Journal of Fluids and Structures. (2021) ; 101: : 103208. doi: 10.1016/j.jfluidstructs.2020.103208. |
[17] | Liu K, Li D, Xiang J. Reduced-order modeling of unsteady aerodynamics of a flapping wing based on the Volterra theory. Results in Physics. (2017) ; 7: : 2451-7. doi: 10.1016/j.rinp.2017.07.004. |
[18] | Ho S, Nassef H, Pornsinsirirak N, Tai Y-C, Ho C-M. Unsteady aerodynamics and flow control for flapping wing flyers. Progress in Aerospace Sciences. (2003) ; 39: : 635-81. doi: 10.1016/j.paerosci.2003.04.001. |
[19] | Chen YH, Skote M, Zhao Y, Huang WM. Dragonfly (Sympetrum flaveolum) flight: Kinematic measurement and modelling. Journal of Fluids and Structures. (2013) ; 40: : 115-26. doi: 10.1016/j.jfluidstructs.2013.04.003. |
[20] | Sivasankaran PN, Ward TA, Salami E, Viyapuri R, Fearday CJ, Johan MR. An experimental study of elastic properties of dragonfly-like flapping wings for use in biomimetic micro air vehicles (BMAVs). Chinese Journal of Aeronautics. (2017) ; 30: : 726-37. doi: 10.1016/j.cja.2017.02.011. |
[21] | Zhou Q, Grinspun E, Zorin D, Jacobson A. Mesh arrangements for solid geometry. ACM Trans. Graph. (2016) ; 35: : 1-15. doi: 10.1145/2897824.2925901. |


