
A computational method to differentiate rheumatoid arthritis patients using thermography data
Abstract
BACKGROUND:
The traditional rheumatoid arthritis (RA) diagnosis is very complicated because it uses many clinical and image data. Therefore, there is a need to develop a new method for diagnosing RA using a consolidated set of blood analysis and thermography data.
OBJECTIVE:
The following issues related to RA are discussed: 1) Which clinical data are significant in the primary diagnosis of RA? 2) What parameters from thermograms should be used to differentiate patients with RA from the healthy? 3) Can artificial neural networks (ANN) differentiate patients with RA from the healthy?
METHODS:
The dataset was composed of clinical and thermal data from 65 randomly selected patients with RA and 104 healthy subjects. Firstly, the univariate logistic regression model was proposed in order to find significant predictors. Next, the feedforward neural network model was used. The dataset was divided into the training set (75% of data) and the test set (25% of data). The Broyden-Fletcher-Goldfarb-Shanno (BFGS) and non-linear logistic function to transformation nodes in the output layer were used for training. Finally, the 10 fold Cross-Validation was used to assess the predictive performance of the ANN model and to judge how it performs.
RESULT:
The training set consisted of the temperature of all fingers, patient age, BMI, erythrocyte sedimentation rate, C-reactive protein and White Blood Cells (10 parameters in total). High level of sensitivity and specificity was obtained at 81.25% and 100%, respectively. The accuracy was 92.86%.
CONCLUSIONS:
This methodology suggests that the thermography data can be considered in addition to the currently available tools for screening, diagnosis, monitoring of disease progression.
1.Introduction
Rheumatoid arthritis (RA) is a chronic connective tissue disease manifested by pain, swelling, stiffness of the joints and elevated temperature [1]. Clinical evaluation of this disease is based on in-depth analysis and interpretation of symptoms, laboratory parameters and medical imaging examinations [2, 3]. The commonly used parameters are the erythrocyte sedimentation rate (ESR) and C-reactive protein (CRP). However, both of the parameters are non-specific to RA [8]. Indicators of disease activity look promising. They are a combination of disease activity parameters combined in one specific measure. The most commonly used test is DAS 28 [4], which is based on the assessment of 28 joints. Recently, some authors proposed automated screening systems by applying artificial intelligence methods for RA diagnosis [5, 6, 7, 8, 9, 10]. The dataset was used to train the neural network based on the diagnosis criteria of RA, supported by image techniques [11, 12, 13]. Murakami et al. [14] proposed a new quantitative method for automatically detecting bone erosion from hand X-ray images. The selected areas of interest were analysed in terms of presence or absence of bone erosion using a classifier based on deep neural networks. The percentage of true positive results and false-positive results was 80.5% and 0.84%, respectively. Helwan et al. [15] have attempted to develop a new intelligent system for identifying rheumatoid knee arthritis using X-ray image processing techniques and a neural classifier. The identification index was 95.5%. In turn, Naz et al. [16] presented RA classification methods using neural networks based on thermal patterns obtained from passive thermography. The multi-layer feed-forward perceptron algorithm with backpropagation was used for RA recognition. However, the experimenters did not take into account any clinical parameters of RA. Moreover, Umpathy et al. [17] used a k-means algorithm and fuzzy c means algorithm to classify patients with RA and healthy subjects based on the feature extracted from the segmented thermal image. The receiver operating characteristics (ROC) curve depicted a sensitivity of 86.6% and specificity of 79% achieved in the MCP region of the thermal hand image. Thus, there is a need to develop a method for diagnosing RA using a consolidated set of data from blood analysis and thermography. Herein the following issues related to RA disease are discussed: 1) Which clinical data are significant in the primary diagnosis of RA; 2) What parameters from thermograms should be addressed in differentiation patients with RA from the healthy; 3) Can artificial neural networks (ANN) differentiate patients with RA from the healthy?
2.Methods
2.1Subjects
The study was conducted between January 2017 and December 2018 and included 65 randomly selected patients with RA from the Department of Rheumatology and Internal Medicine (Poland) at the Medical University of Bialystok. The inclusion criteria were: age over 18 years old, disease duration over two years, biological therapy treatment, DAS28 over 2.0 and below 7.5 units at the start of biologic therapy. Exclusion criteria were as follows: age under 18 years, the duration of treatment under two years, a rheumatoid factor below 50 IU/mL, DAS28 below 2.0 units. The control group consisted of 104 healthy participants, which showed no physical signs of RA, and were questioned about personal and family history of arthritis. The Polish Regional Committees have approved this study for Medical and Health Research Ethics (No. R-I-002/16/2016). Blood samples were taken from the ulnar vein. The test material was serum obtained after isolation and separation from a clotted mass of blood. Serum samples were stored at
2.2Measurement protocol for thermography
The thermograms of both hands for each subject were taken with the thermal imaging camera (FLIR, E60bx, Systems Inc., USA) with a resolution of 320
Figure 1.
Region of interest (ROI) of each finger individually.
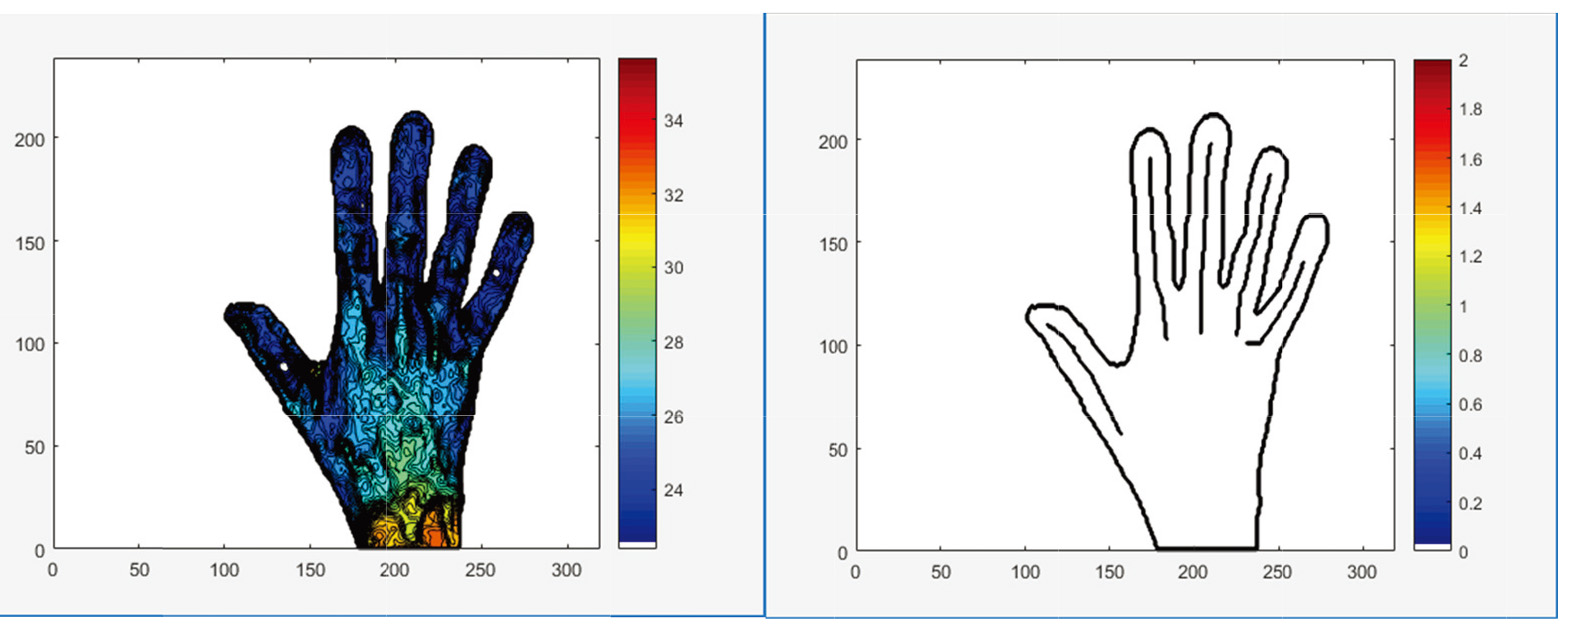
The outputs were: the mean temperature post-cooling; the mean temperature post-rewarming; and total change in the average temperature of all fingers due to rewarming
2.3ANN in differentiating RA from healthy subjects
Firstly, the univariate logistic regression model to find significant predictors was proposed. Then, the feedforward neural network model was used. The dataset was divided into the training set (75% of data) and the test set (25% of data). The Broyden-Fletcher-Goldfarb-Shanno (BFGS) and non-linear logistic function to transformation nodes in the output layer were used for training. The same dataset generated several training-validation sets. The 10 fold Cross-Validation was used to assess the predictive performance of the ANN model and to judge how it performs. The ten independent scores achieved by each instance were averaged to return the CV score of the model architecture. The number of neurons in the hidden layer was as small as possible while maintaining accuracy. Statistical analysis was performed with the R statistical software (version 3.5.2) [19].
3.Results
3.1Subjects
The subjects were predominantly female (84.38%). The mean age of all subjects was 53.7 (13.8) years old; the mean BMI was 25.1 (7.7) kg/m
Table 1
Demographic and clinical data for patients group (SD)
| Groups | Age [years] | BMI [kg/m | ESR [mm/h] | CRP [mg/L] | WBC [10 | PLT [10 | RBC [10 |
|---|---|---|---|---|---|---|---|
| RA | 53.8 (8.4) | 24.5 (3.5) | 41.0 (23.8) | 18.7 (15.8) | 7.2 (1.8) | 280.5 (113.5) | 4.4 (0.6) |
| Healthy | 44.4 (13.0) | 26.2 (4.4) | 18.2 (6.4) | 3.1 (1.3) | 5.1 (2.0) | 277.6 (88.2) | 4.4 (0.5) |
RA patients had significantly higher ESR, CRP, WBC, RBC, and PLT than healthy patients (
3.2Thermovision data
The outputs were: the temperature of all fingers post-cooling and post-rewarming, and
Table 2
The mean (SD) dynamic thermal imaging outcomes for healthy and RA subjects
| Parameters | Thumb | Index finger | Middle finger | Ring finger | Little finger |
|---|---|---|---|---|---|
| Healthy | |||||
| Mean temperature post-cooling [ | 25.1 (1.9) | 24.5 (2.3) | 24.9 (1.2) | 24.2 (1.8) | 23.9 (2.2) |
| Mean temperature post-rewarming [ | 30.6 (2.9) | 29.2 (2.8) | 29.8 (3.1) | 29.4 (3.2) | 29.1 (3.0) |
| 5.1 (1.1) | 4.5 (0.9) | 4.8 (1.7) | 5.0 (1.9) | 5.4 (1.9) | |
| RA patients | |||||
| Mean temperature post-cooling [ | 25.2 (2.0) | 24.4 (2.0) | 24.4 (1.9) | 24.2 (2.0) | 23.6 (2.1) |
| Mean temperature post-rewarming [ | 28.6 (3.3) | 27.4 (3.6) | 27.2 (3.3) | 26.9 (3.4) | 26.4 (3.3) |
| 3.4 | 3.1 | 2.8 | 2.8 | 2.8 | |
A smaller increase in joint temperature after reheating in patients with RA compared with healthy subjects was observed. It could be explained by the impaired vascular flow and characteristic features of ischaemia of the fingers skin, which was manifested by the much slower heating of these hand areas. The statistically significant difference between RA patients and the healthy was observed for
3.3ANN
Table 3
Results from multivariate logistic regression model containing all explanatory variables
| Parameters | Estimate | SE |
| |
|---|---|---|---|---|
| Thumb | 0.069 | 0.028 | ||
| Index finger | 0.081 | 0.002 | ||
| Middle finger [ | 0.088 | 0.002 | ||
| Ring finger | 0.087 | 0.020 | ||
| Little finger | 0.081 | 0.026 | ||
| Age [years] | 0.051 | 0.013 | 3.883 | 0.000 |
| BMI [kg/m | 0.043 | 0.017 | ||
| ESR [mm/h] | 0.143 | 0.026 | 5.579 | 0.000 |
| CRP [mg/L] | 0.478 | 0.097 | 4.935 | 0.000 |
| RBC [10 | 0.297 | 0.29 | 1.022 | 0.307 |
| WBC [10 | 0.372 | 0.077 | 4.804 | 0.000 |
| PLT [10 | 0.001 | 0.002 | 0.561 | 0.575 |
Figure 2.
The ANN model: a) architecture of ANN; b) receiver operating characteristic curves (ROC); c) model of differentiation patients with rheumatoid arthritis from the healthy.
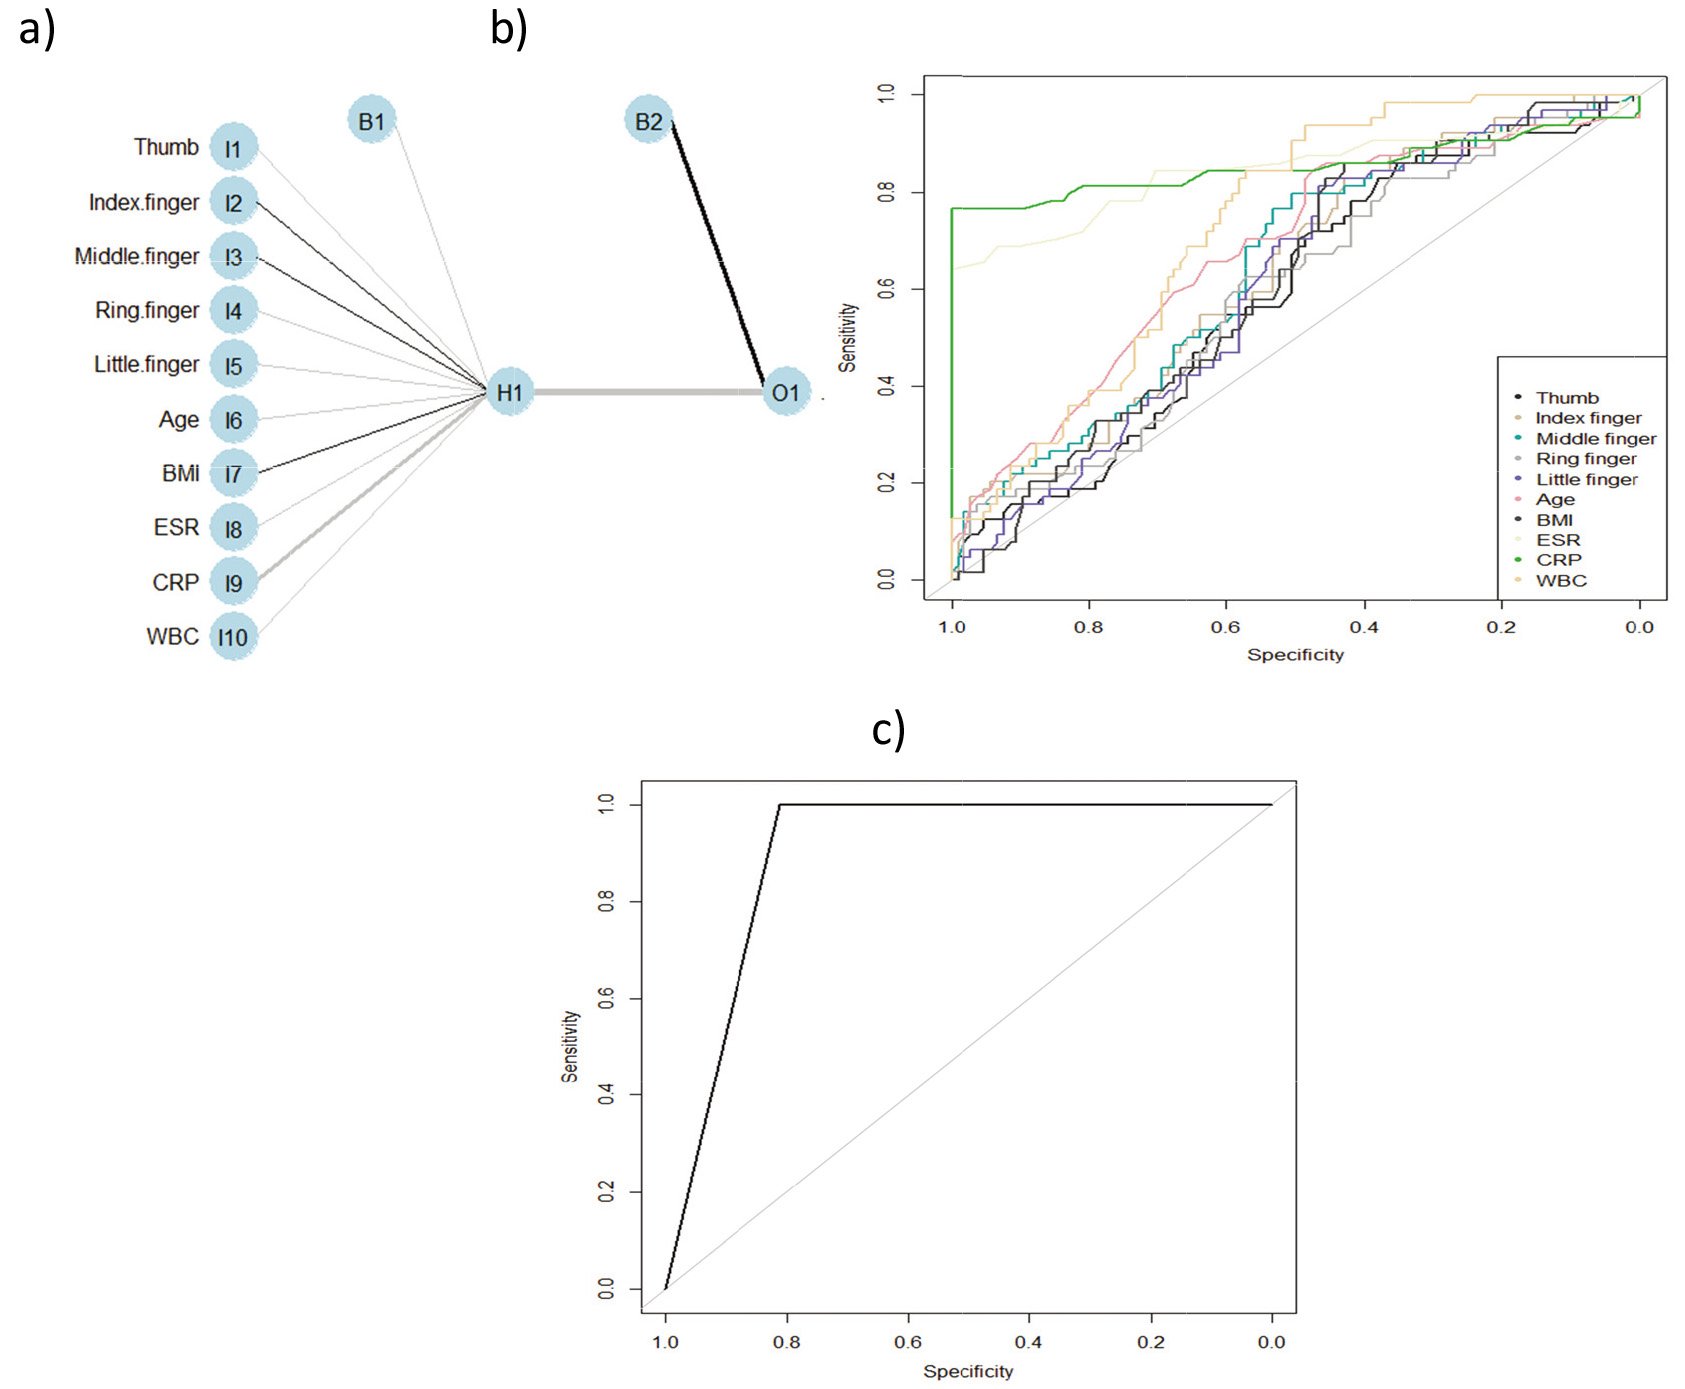
Firstly, the univariate logistic regression method to find significant predictors was used (Table 3). The following parameters were significant in RA prediction:
4.Discussion
RA is globally the most common inflammatory disease characterized by symmetrical arthritis, extraneous lesions, and systemic complications. It limits the daily functioning of the patient and leads to disability and premature death. The problem in the disease diagnosis is the lack of a generally available method of diagnosing RA that would allow for a quick and effective diagnosis and assessment of joint inflammation activity. Infrared thermographic examination opens up new diagnostic possibilities for RA due to the non-invasive method, low cost and availability of thermal imaging cameras. However, the lack of reliable and unambiguous criteria for quantifying changes in inflammatory joints most frequently affects correct disease diagnosis [23, 24, 25]. In clinical practice, inflammatory markers such as ESR and CRP are used to assess RA activity. We proved that ESR, CRP, WBC, RBC, and PLT are significant in RA diagnosis (
5.Conclusion
The proposed ANN model is characterised by high levels of sensitivity, specificity and accuracy. Therefore, we can state that using thermography data in the ANN model increases the method’s precision in differentiating the RA patients from the healthy, which is a new approach in diagnostic methods. In the literature two other studies investigated the thermal patterns between normal or pathological joints [27, 28]; however, the authors did not reach statistical significance. The proposed methodology suggests that the thermography data can be considered in addition to the currently available tools for screening, diagnosis, and monitoring of disease progression [29, 30]. Further studies should be devoted to the comparison of different methods in differentiation RA status.
Acknowledgments
This work was co-financed by the Ministry of Science and Higher Education of Poland (project no. W/WM-IIB/2/2021).
Conflict of interest
None to report.
References
[1] | VanRiel PL, Schumacher HR. How does one assess early rheumatoid arthritis in daily clinical practice? Best practice and research. Clinical Rheumatology (2001) ; 15: : 67-76. doi: 10.1053/berh.2000.0126. |
[2] | Pauk J, Wasilewska A, Ihnatouski M. Infrared thermography sensor for disease activity detection in Rheumatoid Arthritis patients. Sensors (2019) ; 19: (16): 1-14. doi: 10.3390/s19163444. |
[3] | Pauk J, Ihnatouski M, Wasilewska A. Detection of inflammation from finger temperature profile in rheumatoid arthritis. Medical & Biological Engineering & Computing (2019) ; 57: (12): 2629-2639. doi: 10.1007/s11517-019-02055-1. |
[4] | Prevoo ML, van’t Hof MA, Kuper HH, et al. Modified disease activity scores that include twenty-eightjoint counts. Development and validation in a prospective longitudinal study of patients with rheumatoid arthritis. Arthritis and Rheumatism (1995) ; 38: : 44-48. doi: 10.1002/art.1780380107. |
[5] | Heard BJ, Fritzler MJ, Wiley P, et al. Intra-articular and systemic inflammatory profiles identify patients with osteoarthritis. J. Rheumatol (2013) ; 40: : 1379-1387. doi: 10.3899/jrheum.121204. |
[6] | Wynsa B, Boullarta L, Setteb S, et al. Prediction of arthritis using a modified Kohonen mapping and case based reasoning. Engineering Applications of Artificial Intelligence (2004) ; 17: : 205-211. doi: 10.1016/j.artmed.2004.01.002. |
[7] | Tok K, Saritas I. The Usage of artificial neural networks method in the diagnosis of Rheumatoid Arthritis. International Journal of Intelligent Systems and Applications in Engineering (2016) ; 4: (4): 119-121. doi: 10.18201/ijisae.2016426382. |
[8] | Ali Aerer H, Mohannad A, Al-Ja’afari M, et al. Rheumatoid Arthritis diagnosis based on intelligent system. Journal of the University of Babylon for Pure and Applied Sciences (2018) ; 26: (7): 47-53. https://www.journalofbabylon.com/index.php/JUBPAS/article/view/1371. |
[9] | Heard BJ, Rosvold JM, Fritzler MJ, et al. A computational method to differentiate normal individuals. osteoarthritis and rheumatoid arthritis patients using serum biomarkers. J. R. Soc. Interface (2014) ; 11: : 20140428. doi: 10.1098/rsif.2014.0428. |
[10] | Shiezadeh Z, Sajedi H, Aflakie E. Diagnosis of Rheumatoid Arthrisis using an ensemble learning approach. ICAITA, SAI, CDKP, Signal, NCO (2015) : 139-148. doi: 10.5121/csit.2015.51512. |
[11] | Van Riel PL, Van de Putte LB. Clinical assessment and clinical trials in rheumatoid arthritis. Current Opinion in Rheumatology (1994) ; 6: : 132-139. doi: 10.1097/00002281-199403000-00003. |
[12] | American College of Rheumatology Committee on Outcome Measures in Rheumatoid Arthritis Clinical Trials. Reduced joint counts in rheumatoid arthritis clinical trials. Editorial. Arthritis and Rheumatism (1994) ; 37: : 463-464. doi: 10.1002/art.1780370406. |
[13] | Aletaha D, Smolen JS. The definition and measurement of disease modification in inflammatory rheumatic diseases. Rheum Dis Clin North Am (2006) ; 32: : 9-44. doi: 10.1016/j.rdc.2005.09.005. |
[14] | Murakami S, Hatanol K, Tan JK, et al. Automatic identification of bone erosions in rheumatoid arthritis from hand radiographs based on deep convolutional neural network. Multimed Tools Appl (2018) ; 77: : 10921-10937. doi: 10.1007/s11042-017-5449-4. |
[15] | Helwan A, Tantua DP, Adeola E. Intelligent knee rheumatoid arthritis identification. J. Intelligent Systems and Applications (2016) ; 8: (1): 18-24. doi: 10.5815/ijisa.2016.01.03. |
[16] | Naz R, Ahmad M, Karandikar M. Arthrisis prediction by thermal image processing and neural network. IOSR Journal of VLSI and Signal Processing (2015) ; 5: (4): 28-34. doi: 10.9790/4200-05422834. |
[17] | Umapathy S, Vasu S, Gupta N. Computer aided diagnosis based hand thermal image analysis: A potential tool for the evaluation of Rheumatoid Arthritis. Journal of Medical and Biological Engineering (2017) ; 38: : 666-677. |
[18] | Saputro DRS, Widyaningsih P. Limited memory Broyden-Fletcher-Goldfarb-Shanno (L-BFGS) method for the parameter estimation on geographically weighted ordinal logistic regression model (GWOLR). AIP Conference Proceedings (2017) : 1868. doi: 10.1063/1.4995124. |
[19] | Core Team ((2018) ). R: A language and environment for statistical computing. R Foundation for Statistical Computing, Vienna, Austria. https://www.R-project.org/. |
[20] | Deane KD, O’Donnell CI, Hueber W, et al. The number of elevated cytokines and chemokines in preclinical seropositive rheumatoid arthritis predicts time to diagnosis in an age-dependent manner. Arthritis Rheum (2010) ; 62: : 3161-3172. doi: 10.1002/art.27638. |
[21] | Randen I, Brown D, Thompson KM, Hughes-Jones N, Pascual V, Victor K, Capra JD, Førre O, Natvig JB. Clonally related IgM rheumatoid factors undergo affinity maturation in the rheumatoid synovial tissue. J. Immunol (1992) ; 148: : 3296-3301. |
[22] | Aletaha D, Neogi T, Silman AJ, et al. Rheumatoid arthritis classification criteria: An American College of Rheumatology/European League Against Rheumatism collaborative initiative. Arthritis Rheum (2010) ; 62: (9): 2569-2581. doi: 10.1002/art.27584. |
[23] | Alamanos Y, Drosos AA. Epidemiology of adult rheumatoid arthritis. Autoimmunity Reviews (2005) ; 4: : 130-136. doi: 10.1016/j.autrev.2004.09.002. |
[24] | Alasaarela E, Suramo I, Tervonen O, Lähde S, Takalo R, Hakala M. Evaluation of humoral head erosions in rheumatoid arthitis: A comparison of ultrasonography, magnetic resonance imaging, computed tomography and plain radiography. British Journal of Rheumatology (1998) ; 37: : 1152-1156. doi: 10.1093/rheumatology/37.11.1152. |
[25] | Aletaha D, Eberl G, Nell VP, Machold KP, Smolen JS. Practical progress in realisation of early diagnosis and treatment of patients with suspected rheumatoid arthritis: Results from two matched questionnaires within three years. Ann Rheum Dis (2002) ; 61: : 630-634. doi: 10.1136/ard.61.7.630. |
[26] | Gatt A, Mercieca C, Borg A, et.al. A comparison of thermographic characteristics of the hands and wrists of rheumatoid arthritis patients and healthy controls. Scientific Reports (2019) ; 25; 9(1): 17204. doi: 10.1038/s41598-019-53598-0. |
[27] | Gratt BM, Sickles EA, Wexler C. Thermographic characterization of osteoarthrosis of the 368 temporomandibular joint. Journal of Orofacial Pain (1993) ; 7: (4): 345-353. |
[28] | Borojević N, Kolarić D, Grazio S, Grubišić F, Antonini S, Nola IA. Thermography hand temperature 372 distribution in rheumatoid arthritis and osteoarthritis. Periodicum Biologorum (2011) ; 113: (4): 445-448. |
[29] | Calin MA, Mologhianu G, Savastru R, Calin MR, Brailescu CM. A review of the effectiveness of 450 thermal infrared imaging in the diagnosis and monitoring of knee diseases. Infrared Physics & Technology (2015) ; 69: : 19-25. doi: 10.1016/j.infrared.2015.01.013452. |
[30] | Ring EF. Thermographic and scintigraphic examination of the early phase of inflammatory disease. Scandinavian Journal of Rheumatology Supplement (1987) ; 65: : 77-80. doi: 10.3109/03009748709102180. |


