
Statistical analysis of age-related skin parameters
Abstract
BACKGROUND:
Due to the increasing interest in human anti-aging, demand for a higher quality of life, and technological advancement, the development of anti-aging skincare has great market prospects. Most cosmetic companies develop products driven by the market or focus on the mechanism of action of substances and the behavior of skin; however, little research utilizes skin parameters and large data methodology to develop skincare products.
OBJECTIVE:
To instruct consumers to purchase skincare products and to guide skincare research toward the development of customer-targeted products.
METHODS:
A total of 815 Chinese subjects (83 male; 732 female) from five different cities were included. We measured 14 indices in each subject, including moisture, transepidermal water loss (TEWL), and sebum levels. We performed multiple regression analysis to understand the relationship between skin indices and aging; a novel approach is shown using the R software.
RESULTS:
The exact age at which changes in each skin index occurred could be demonstrated by this method of analysis: 39, 38, 48, 46, and 56 years old with respect to the L value, Melanin, Rt, Rm, and Rz, respectively.
CONCLUSION:
With the use of statistical analysis, consumers can be more efficiently targeted and choose suitable products considering particular skin parameter changing points; thus, skincare companies will not only meet customer requirements but also better control budgets.
1.Introduction
The cosmetics industry is an important part of the beauty economy and many studies have been conducted to understand the characteristics of skin with a view to preventing skin aging. The characteristics of skin are defined by many different parameters, for instance, moisture, transepidermal water loss (TEWL), and sebum levels. The purpose of the present study was to determine the age at which each skin parameter change in order to efficiently prevent skin aging. These indices have been determined by many studies [1]; however, to date, no study has determined the exact age at which the skin condition begins to worsen. Knowledge of this exact age can help guide companies to scientifically develop better skincare products. Moreover, the differences in skin among individuals of various countries or races can be elucidated by comparison with results of other studies.
In our previous study [1], we investigated how skin parameters change during the aging process, determining that the moisture and sebum indices of human skin decrease with age. Different results have been obtained in other studies, for instance Luebberding et al. [2] evaluated age-related changes in skin barrier function, reporting that the moisture index does not significantly decrease with age. There is, however, a weak positive correlation between moisture and age. The TEWL index is also weakly correlated with age; in a study conducted by Qiu et al. [3], the skin moisture content was shown to decrease with age. Moreover, Firooz et al. [4]reported that the moisture content index is significantly affected by skin aging.
Kim et al. [5] demonstrated that the moisture index is influenced by many factors such as the season and frequency of cosmetic use. It is well-known that the sebum index decreases with age [2, 5]. Furthermore, certain studies have reported that the pH index decreases with age; however, the pH index of the skin has been shown to increase at 50 years old. In a study conducted by Kim et al. [5], menopause was determined to be the reason behind this phenomenon.
Certain indices are associated with skin color and roughness. Skin color indices include hemoglobin (red), melanin (black), and L, a, and b values. In the three-dimensional CIE-L*a*b space, the vertical L* axis (from 0 – black to 100 – white) represents luminance, the a* axis represents the red (
Skin roughness is represented by the indices, Rt, Rz, Rm, Rp, and Ra: Rt is the total height of the contour, which is calculated by the sum of the maximum profile peak height and valley depth within the assessed length; Rz is the mean of the maximum peak-to-valley height of five consecutive sections of the sampling line; Rm is the maximum contour valley depth within the assessed length; Rp is the maximum profile peak height within the assessed length; and Ra is the arithmetic mean roughness value from the profile mean along a defined sampling line. It is well-known that the skin roughness index increases with age, with many studies supporting this notion. Akazaki et al. [9] studied age-related changes in skin wrinkles, and Manuskiatti et al. [10] studied the influence of age on skin roughness, both concluding that skin roughness significantly increases with age.
According to existing reports, skin condition and parameters are only roughly related to patterns of aging. In the present study, we focused on determining the exact age at which skin parameters change with a view to efficiently preventing skin aging. Our main aim was to understand skin aging and to develop better cosmetic products.
2.Materials and methods
2.1Study design
The present study assessed the skin condition in a population of males and females from five different cities: Beijing, Shenzhen, Lanzhou Kunming, and Yantai. These five cities are located in different regions of China and their geographical features are different. Subsequently, we performed research to determine whether the condition of human skin is affected by various geographical features [11]. To ensure accuracy, the indoor study site was maintained at 22
2.2Subjects
A total of 815 (83 male and 732 female) subjects from five different cities were included in the present study. We measured numerous indices in each subject, including moisture, TEWL, sebum levels, melanin and hemoglobin index, skin color (L, a, b values), and roughness. Each index was measured at seven different anatomical sites in each subject. Prior to performing facial imaging and skin measurements, subjects were asked to clean their face and remove all makeup and sebum. Subsequently, subjects were asked to sit quietly for 30 minutes to allow equilibration of their skin in the ambient conditions. The day prior to the performance of measurements, subjects were asked not to use moisturizing cosmetics.
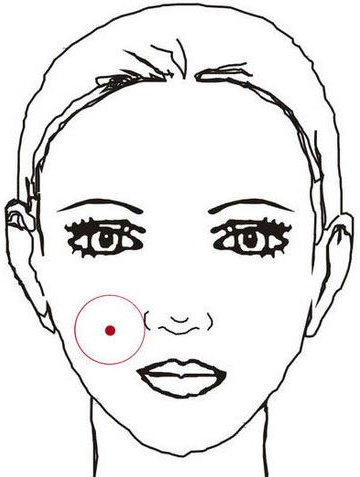
Figure 1.
Subjects’ test area.
2.3Moisture index
The skin moisture index was measured using a Corneometer
2.4Transepidermal water loss (TEWL)
The TEWL index was measured using a Tewameter
2.5Sebum index
The sebum index was measured using a Sebumeter
2.6Melanin and hemoglobin index
The melanin and hemoglobin index were measured using a Mexameter
2.7Skin color index (L, a, b values)
The skin color index (L, a, and b values) was measured using an MPA 9 workstation (Courage and Khazaka, Germany), which reflected the different skin tones – black, white, red, and yellow.
2.8Skin roughness index
The skin roughness index was measured using a VISIO 3D (DERMATOP V3, France), which is a rapid, three-dimensional, non-contact imaging technique that uses blue light. The measurement was completed within one second. High-resolution lenses and striped projectors were adjusted and fixed to ensure that the entire system was stable, accurate, and reliable.
2.9Definition of the best condition for each index
The values of different indices have different meanings; however, the specific thresholds have not yet been defined. Thus, we defined the best condition for each index (Table 1).
Table 1
Definition of the best condition for different indices [12]
| Index | Explanation of the best condition |
|---|---|
| Melanin Hemoglobin Moisture TEWL L* Skin roughness Sebum pH | Low value, good condition Low value, good condition High value, good condition Low value, good condition L, high value, light color close to 0, less roughness Close to median, good condition Best condition range is 6.0–7.0 |
3.Statistical analysis
3.1Regression analysis
Regression is a basic statistical analysis based on the ordinary least squares (OLS) method [12, 13, 14, 15, 16, 17]. To determine moisture, pH, hemoglobin index, skin color indices a* and b*, and skin roughness indices Rp and Ra, we used subset regression to select variables. Moreover, we used multiple regression methods to fit data, for instance, the sebum index and TEWL did not comply with the definition of normality; thus, these data were transformed such that the residual satisfied normality. Some indices still did not comply with residual analysis; therefore, a non-parametric method was used to analyze the melanin index, skin color index L*, and the skin roughness indices Rt, Rm, and Rz [18, 19, 20, 21, 22, 23, 24]. Table 2 displays the different methods used for the determination of the different indices.
Table 2
Different analysis methods for different indices
| Method | All subset and multiple regression | Non-parametric analysis | |
| No transformation | With transformation | ||
| Index | Moisture pH Hemoglobin Skin color index a* Skin color index b* Skin roughness index Rp Skin roughness index Ra | Sebum TEWL | Melanin Skin color index L* Skin roughness index Rt Skin roughness index Rm Skin roughness index Rz |
3.2Statistical analysis method
We used subset regression to explore the relationship among area, gender, age, and skin indices. The exact process of analysis was as follows:
1. Outliers seen at each age were removed using the box-plot method, and the median of the index was subsequently used to represent the age index.
2. The subset regression method was used to select variables with more explanatory ability.
3. Multiple regression analysis was performed on dependent and independent variables.
4. Regression diagnostics of the results of regression analysis were performed, and the significance of coefficients and linear relationships were tested.
5. The multiple terms of age and the interaction term between age and other variables were included in the multiple regression analysis, followed by performance of regression diagnostics to confirm whether the residual complied with normality.
Subsequently, we performed quantitative analysis on the results of multiple regression analysis. Based on the definition of the best condition for each mentioned index, we determined the age at which each of these indices changed. Finally, in combination with a good understanding of the skin, the age at which these skin indices changed was verified by identifying the inflection point in Fig. 3, which illustrates the results of multiple regression models.
4.Results
4.1Descriptive analysis
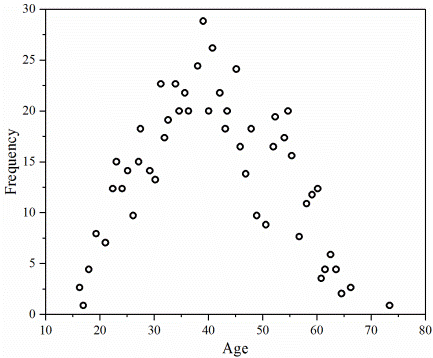
Figures 2 and 3 provide detailed information. Figure 2 shows the number of subjects in different areas by gender distribution, and Fig. 3 shows the frequency of age distribution of these subjects.
Figure 2.
Number of subjects in different areas and gender distribution.
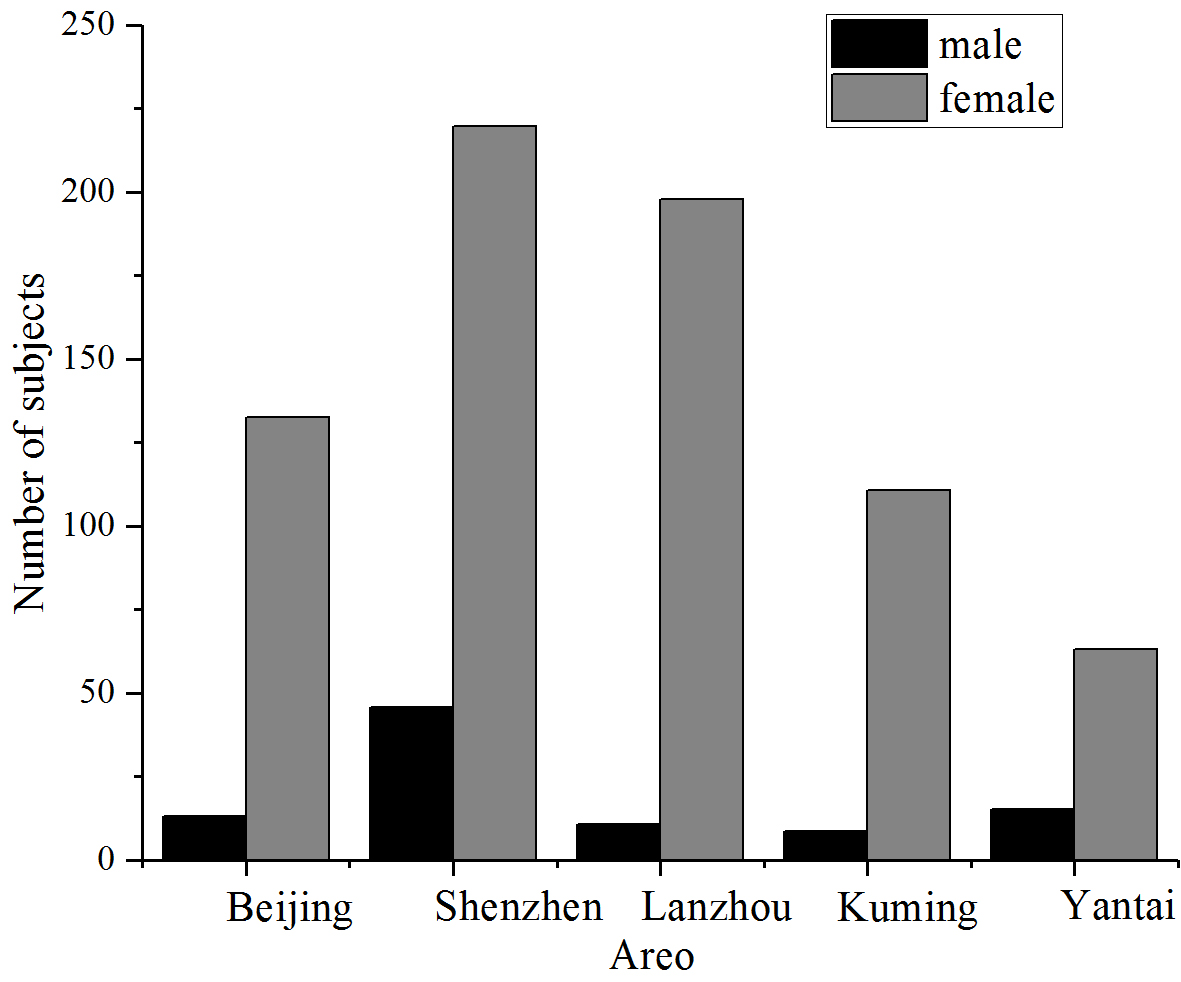
Figure 3.
The frequency of age-wise distribution.
We measured the skin condition of different areas of the body in each subject, including the forehead, cheek, chin, and surface of the hand. Since more attention is paid to the condition of facial skin, we chose to further analyze the skin condition of the left cheek. Table 3 provides detailed information regarding the results of descriptive statistical analysis of the 14 skin indices.
Table 3
Descriptive statistical analysis of 14 skin indices
| [height=0.8cm,width=2.4cm]Skin IndexStatistics | Min | Max | Range | Median | Mean | SE.mean | Var | Std.dev |
|---|---|---|---|---|---|---|---|---|
| a value | 7.9 | 61.97 | 54.07 | 12.74 | 12.93 | 0.09 | 6.36 | 2.52 |
| b value | 5.19 | 22.31 | 17.12 | 14.09 | 14.14 | 0.09 | 7.26 | 2.69 |
| L value | 45.41 | 133 | 87.59 | 61.26 | 61.12 | 0.16 | 19.62 | 4.43 |
| Melanin | 60 | 482 | 422 | 157 | 165.97 | 2 | 3264.73 | 57.14 |
| pH value | 4.5 | 7.5 | 3 | 5.9 | 5.9 | 0.01 | 0.12 | 0.35 |
| Ra | 7.64 | 25.44 | 17.8 | 14.21 | 14.39 | 0.1 | 7.72 | 2.78 |
| Rm | 16.6 | 536.27 | 519.67 | 54.1 | 56.12 | 0.67 | 370.48 | 19.25 |
| Rp | 15.28 | 53.05 | 37.77 | 28.43 | 28.85 | 0.2 | 32.79 | 5.73 |
| Rt | 4 | 55.74 | 51.74 | 8.14 | 8.53 | 0.1 | 8.6 | 2.93 |
| Rz | 13 | 220.6 | 207.6 | 20.51 | 21.12 | 0.27 | 60.46 | 7.78 |
| TEWL | 4.5 | 41.8 | 37.3 | 12.1 | 12.93 | 0.16 | 21.45 | 4.63 |
| Moisture index | 5.6 | 75.4 | 69.8 | 39.6 | 40.09 | 0.5 | 199.84 | 14.14 |
| Hemoglobin | 124 | 558 | 434 | 326 | 326.3 | 2.62 | 5591.68 | 74.78 |
| Sebum | 0 | 195 | 195 | 19 | 30.19 | 1.12 | 1014.49 | 31.85 |
4.2Definition of change in an index
In the present study, the main aim was to investigate the relationship between skin condition indices and the age of subjects, and to determine the age at which skin condition indices begin to worsen. We attempted to determine the point of change of all skin indices, since this parameter has great importance in various industries such as cosmetic formula development.
4.3Statistical analysis methods
To establish a quantitative relationship between age and skin indices, we used the method of multiple regression analysis. Subsequently, we determined whether gender and region affected skin condition indices. Table 4 displays the results of multiple regression analysis.
Table 4
Regression diagnosis of different skin indices
| Index | Regression model | R |
|---|---|---|
| Moisture |
| 0.47 |
| pH |
| 0.34 |
| Hemoglobin |
| 0.38 |
| a |
| 0.51 |
| b |
| 0.76 |
| Rp |
| 0.74 |
| Ra |
| 0.73 |
Some of the skin indices did not fit into regression diagnosis; thus, we used the Box-Cox method to transform the data, followed by multiple regression analysis. The results indicate that some indices could fit regression diagnosis after transformation (Table 5).
Table 5
Multiple regression analysis performed on sebum and TEWL indices using the Box-Cox method
| Index | Regression model | R |
|---|---|---|
| Sebum |
| 0.59 |
| TEWL |
| 0.41 |
Based on the definition of the best condition for each index mentioned above, we determined the age at which each of these indices changed. When the pH index was between 6 and 7, the condition of the skin was good, indicating that the point of change is the age at which the pH value begins to deviate from this range. A multiple regression model was used to determine this point of change. When the sebum index was close to the median value, the skin condition was good. The point of change is the age at which the sebum value begins to deviate from this median value. With the exception of the pH and sebum indices, the judgement standard of the skin indices was a better condition. The point of change in these skin indices was determined by identifying the inflection point in Fig. 3, which illustrates the results of multiple regression models.
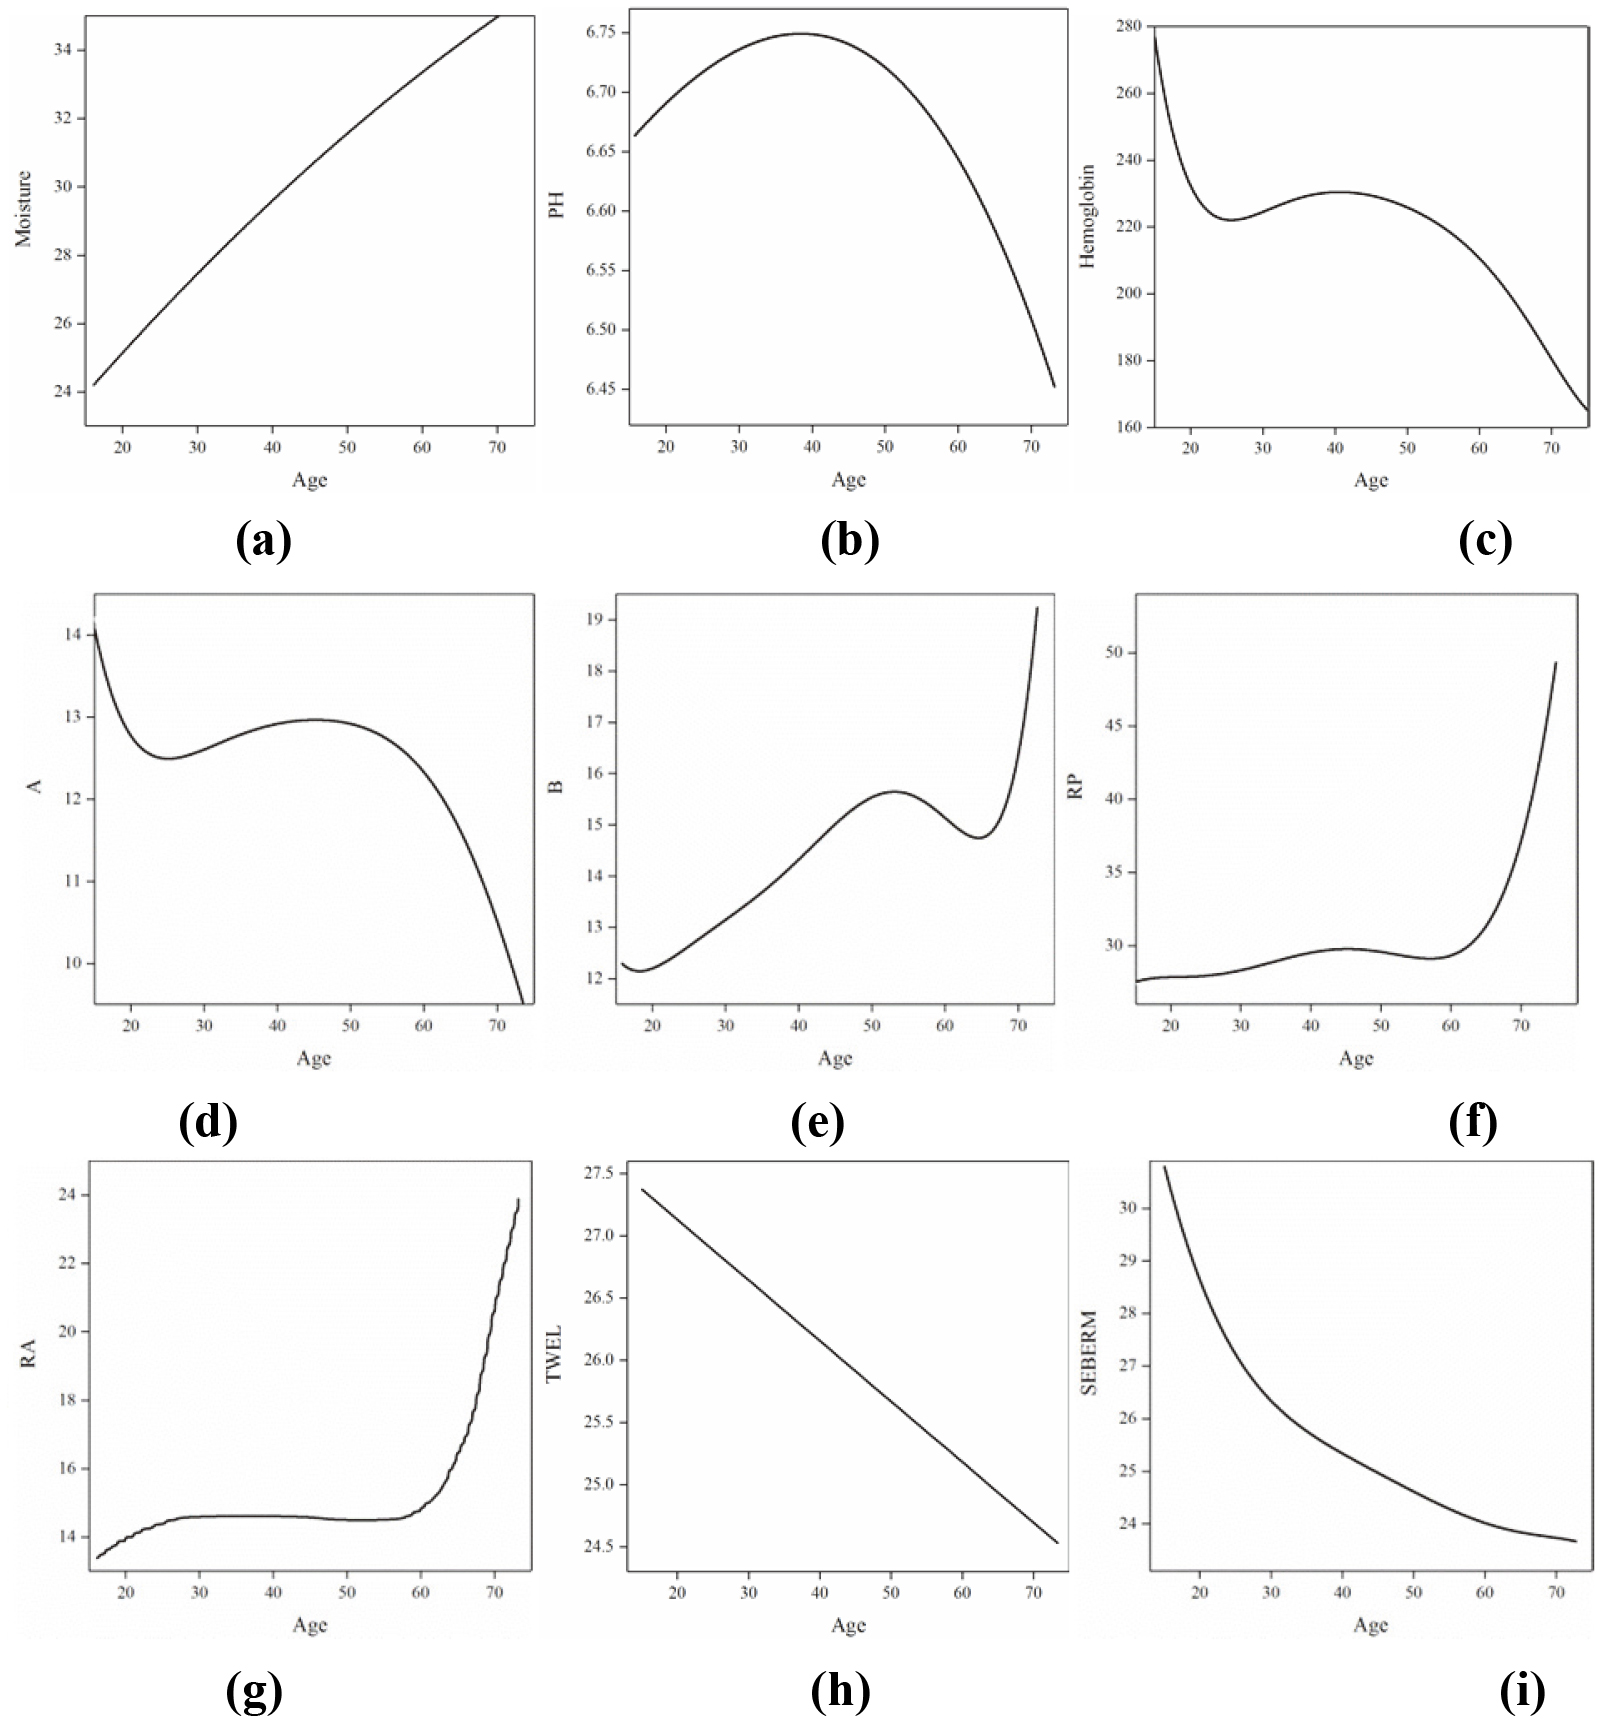
Figure 4.
Results of multiple regression analysis of different skin indices.
Multiple regression analysis could not be used to determine other skin indices, since it still could not fit regression diagnosis following Box-Cox transformation; thus, we divided the subjects into two groups. Subsequently, the Mann-Whitney U test was performed on subjects aged 18–75. Accordingly, we could determine whether there was a significant difference between the ages in the two groups with respect to all skin indices. This age is the point of change for each skin index.
4.4Results of multiple regression
The results of multiple regression analysis are presented in Fig. 4.
Figure 4 and the methods were combined to determine the points of change for the skin indices that could fit regression diagnosis. Table 6 shows the exact point of change for each skin index. Among these skin indices, sebum and TEWL had no point of change but did decrease with age, and the speed of change also decreased with age.
Figure 5.
Skin indices obtained by the Mann-Whitney U test.
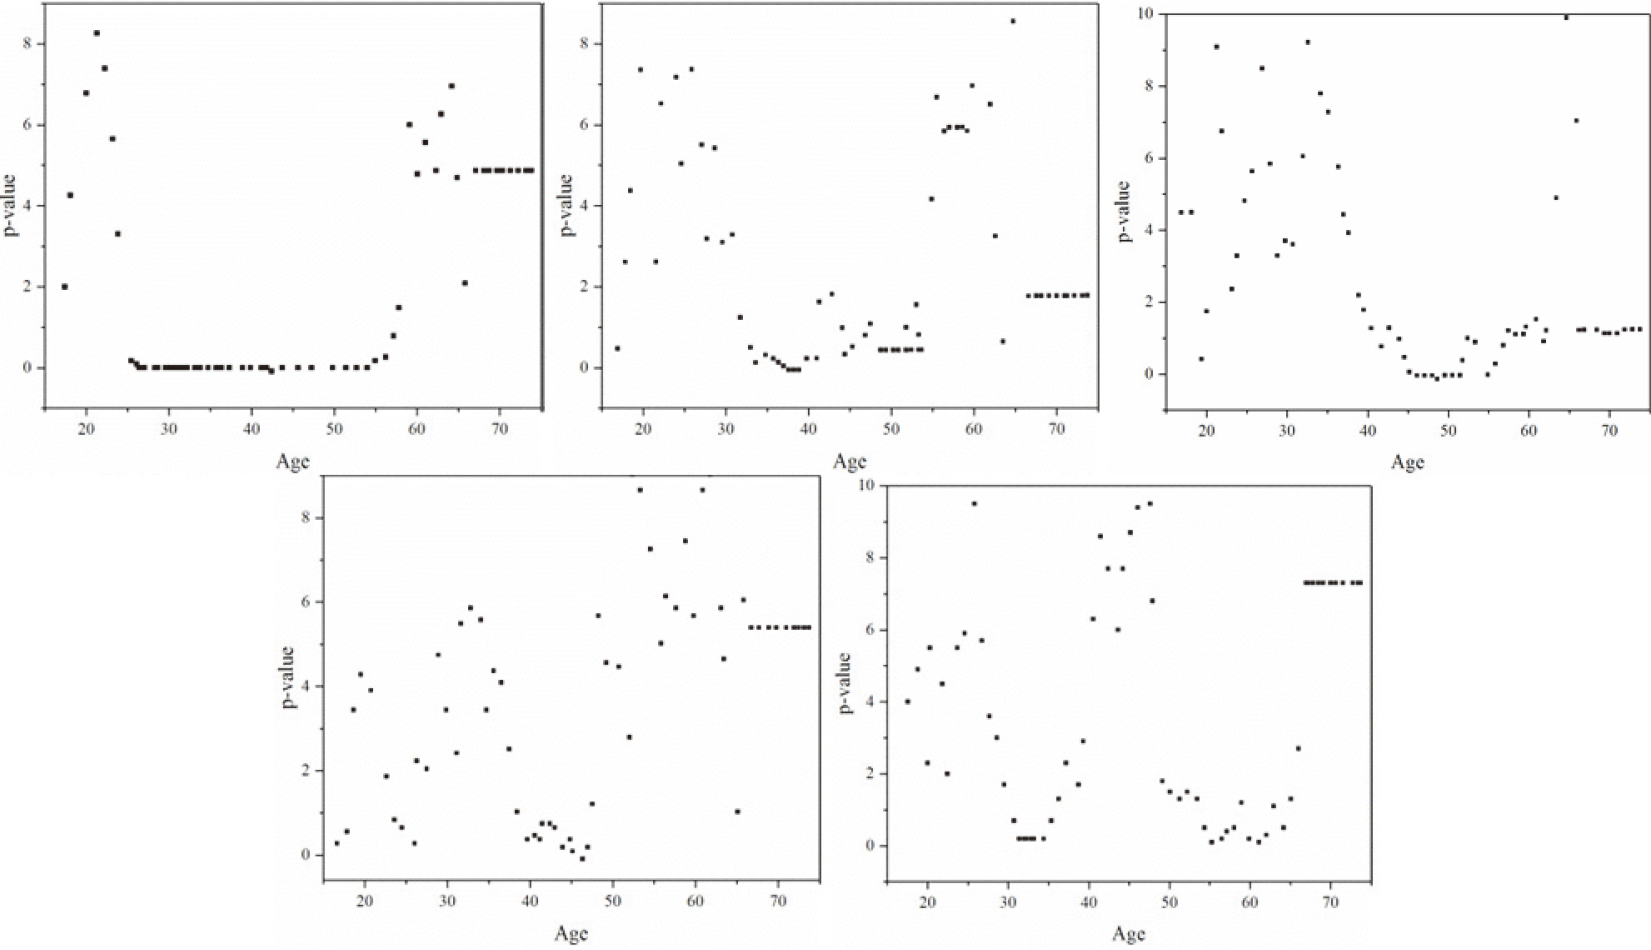
Figure 5 illustrates the results of the skin indices obtained by the Mann-Whitney U test. The X axis represents age and the Y axis represents the results of U tests in which the
Based on the above results, we determined the exact point of change for these skin indices by choosing the age at which the
5.Discussion
5.1Comparison between existing studies and the present study
5.1.1Results of regression analysis (moisture, TEWL, sebum, pH, L*, b*, Ra, and Rp)
Moisture and TEWL
In the present study, we found that, showed in Fig. 4, the moisture and TEWL indices had no age of change; however, they were positively and negatively related to age, respectively. The moisture and TEWL indices obtained in the present study are similar to those of previous studies. Luebberding et al. [2] and Hillebrand et al. [22] showed that the moisture index increases with age; however, conflicting results were obtained in a study conducted by Qiu et al. [3]. In another research study, it was found that, illustrated in the Fig. 4 the moisture index was highest in the 40–50 age group. One of the reasons for these results may be a different in race. In the studies by Luebberding et al. and Hillebrand et al., the subjects were Caucasian, whereas in the study by Qiu et al., the subjects were Asian. Further, Luebberding et al., reported that the TEWL index has the same trend as the moisture index, also increasing with age. A positive relationship between the moisture index and the TEWL index has been proposed; however, our results indicate otherwise. Moreover, another potential reason for the difference is the methodology used; previous research has used the average value and one-way ANOVA to analyze age-related skin parameters, whereas our study is based on the ordinary least squares. The moisture and TEWL indices were influenced by the condition of the stratum corneum, which should be studied more comprehensively in the future. In the present study, a negative correlation exists between the moisture index and the TEWL index [26].
Table 6
Age of the change in each skin index
| Skin index | pH | Hemoglobin | a | b | Rp | Ra |
|---|---|---|---|---|---|---|
| Age of change | 39 | 27, 42 | 27, 47 | 54, 66 | 48, 56 | 39, 53 |
Table 7
Age of change in each skin index
| Skin index | L | Melanin | Rt | Rm | Rz |
|---|---|---|---|---|---|
| Age | 39 | 38 | 48 | 46 | 56 |
Sebum and pH
As Fig. 4 and Table 6 showed, the sebum index decreased with age. Hillebrand et al. [22] reported that the sebum index is highest in the 25–35 age group; however, it decreases with age thereafter. Qiu et al. [3] obtained similar results; however, they found the sebum index to be highest in the 36–42 age group. Kim et al. [5] also determined a sebum index similar to ours. In the present study, we investigated the relationship between the sebum index and age, which is in accordance with that reported in previous studies. There was no point of change in the regression analysis results; however, we identified the age of change according to the definition of the best condition for the sebum index. Existing studies have not considered the best condition for the sebum index, only the changing trend with respect to age. In the present study, we determined the age at which the sebum index begins to worsen, which is a novel approach to studying the process of skin aging.
The results of the pH index were similar to those obtained in the study conducted by Luebberding et al. [2]; however, the age group with the highest value for the pH was different. Man et al. [25] reported that the pH index increases with age, but the values were different. Moreover, Man et al. [25] reported that the pH and sebum indices were influenced by hormonal changes at menopause; therefore, to improve accuracy, the influence of menopause with respect to the age of subjects should be determined.
Skin color indices L* and b*
The skin color indices L* and b* represent the whitening and yellowing index, respectively. In the present study, showed in the Fig. 4, Tables 6 and 7, we found that the L* index decreased from the age of 24 to 55 years old, after which it began to increase. Jean de Regal et al. [8] determined that the skin color index L* in Chinese subjects decreased with age. In the present research, the skin color index b* was the highest at age 56 and began to decrease with age thereafter; however, in the study conducted by Jean de Regal et al. [8], the skin color index b* increased with age.
Skin roughness indices Ra and Rp
The lower the value for the skin roughness index, the better the condition of human skin. The skin roughness indices Ra and Rp had two points of change, 44 and 58 years old, illustrated in Table 6 and Fig. 4. Tsukahara et al. [23] and Hillebrand et al. [22] reported that the skin roughness indices are positively related to age. The present results are different from existing results. Tsukahara et al. [23] mentioned that the skin roughness indices are influenced by sun exposure and smoking.
5.1.2Results of non-parametric analysis (melanin, hemoglobin, a*, Rt, Rm, and Rz)
The melanin and hemoglobin, skin color a*, and skin roughness R
5.2Regression analysis method
In the present study, subset and multiple regression were performed using the ordinary least squares (OLS) method. There are no existing reports containing instructions to analyze skin indices using regression; however, almost all studies have analyzed their data using descriptive statistical methods such as ANOVA,
6.Conclusion and limitations
According to the above results, the age at which the skin condition changes can be detected: 39, 38, 48, 46, and 56 years old with respect to the L value, Melanin, Rt, Rm, and Rz. Regarding the customer-oriented skincare development route, clients can more easily choose suitable skincare products, as compared with the marketing-oriented development route. For skincare enterprise, customer-oriented design not only makes delivery more precise and increases market competitiveness, but it also strengthens customers loyalty. For example, a product targeted toward customers aged 45–60 will need to consider Rt, Rm, and Rz, rather than the L value and melanin; therefore, active ingredients that influence Rt, Rm, and Rz will be added in comparison for with those affecting whitening, which guarantees product budget control.
In the regression analysis method, some errors occurred at the residual analysis step, since the wrong standards were used to collect data. Moreover, the volume of data was very different for males and females and was collected from different areas. In follow-up studies, we must collect data that is more accurate and from a larger population. Certain indices are influenced by many external factors, such as tester proficiency and testing environment stability with respect to humidity and temperature, which must be controlled to achieve more accurate results. Although the skin color index values were clearly defined, we still do not know the best conditions, only the age at which skin color begins to become more white or yellow. We cannot acknowledge that this age is a point of change at which the skin color condition begins to worsen.
Conflict of interest
None to report.
References
[1] | He YF, Wang RZ, Meng H, et al. Establishment of a PCA model for skin health evaluation. Biotechnology & Biotechnological Equipment. 2018: (462): 1–5. |
[2] | Luebberding S, Kerscher M, Krueger, N. Age-related changes in skin barrier function – Quantitative evaluation of 150 female subjects, Int. J. Cosmet. Sci., (2012) . |
[3] | Qiu H, Bazin R, Long X, Ye J, Hou J, Senee J, Laurent A, Flament F, Adam A, Coutet B, Piot J. Influence of season on some skin properties: winter vs. summer, as experienced by 354 Shanghaiese women of various ages, Int. J. Cosmet. Sci., (2011) . |
[4] | Alireza F, et al. Variation of biological parameters of the skin with age, gender and body region, Sientific world journal, (2012) . |
[5] | Kim B. Biophysical properties of facial skin in 20 to 40 age korea women: correlation with age and seasons. Kor. J. Aesthet. Cosmetol. 11: (4) (8 (2013) ): 709–714. |
[6] | Hiroshi O, et al. Melanin and facial skin fluorescene as markers of yellowish discoloration with aging. Skin Research and Technology. 15: ((2009) ): 469–502. |
[7] | Hawkins WW, et al. Variation of the Hemoglobin Level with Age and Sex, National Research Council of Canada, Halifax, N.S, (1954) . |
[8] | Rigal JD, et al. The effect of age on skin color and color heterogeneity in four ethnic groups. Skin Research and Technology. 16: ((2010) ): 168–178. |
[9] | Akazaki S, et al. Age-related changes in skin wrinkles assessed by a novel three-dimensional morphometric analysis. British Journal of Dermatology. 147: ((2002) ): 689–695. |
[10] | Manuskiatti W, Schwindt DA, Maibach HI. Influence of age, anatomic site and race on skin roughness and scaliness. Dermatology. 196: ((1998) ): 401–407. |
[11] | He YF, et al. Comparison of the skin biophysical parameters of females living in Beijing versus Kunming. Asian Journal of Beauty and Cosmetology. 16: ((2018) ): 299–308. |
[12] | |
[13] | Chatfield C, Collins AJ. Introduction to multivariate analysis. New York (NY): Chapman and Hall; (1980) . |
[14] | Dunteman GH. Introduction to multivariate analysis. 4: (78) ((1984) ), 221–225. |
[15] | Van de Geer JP. Introduction to multivariate analysis for the social sciences. Contemp Sociol. 2: (1) ((1973) ). |
[16] | Anderson BTW. An introduction to multivariate analysis. (2010) . |
[17] | Kobayashi H. An introduction to multivariate analysis. Nara Womens University Sociological Studies. 6: ((1999) ): 143–157. |
[18] | Atkinson AC. Plots, transformations and regression. New York (NY): Oxford University Press; (1985) . |
[19] | Greenland S, Maclure M, Schlesselman JJ, et al. Standardized regression coefficients: a further critique and review of some alternatives. Epidemiology. 2: (5) ((1991) ): 387–392. |
[20] | Nimon KF, Oswald FL. Understanding the results of multiplelinear regression beyond standardized regression coefficients. Organizational Research Methods. 16: (4) ((2013) ): 650–674. |
[21] | Hillebrand GG, et al. Quantitative evaluation of skin condition in an epidemiological survey of females living in northern versus southern Japan. Journal of Dermatological Science. 27: (Suppl. 1) ((2001) ): S42–S52. |
[22] | Tsukahara K, et al. Comparison of age-related changes in facial wrinkles and sagging in the skin of Japanese, Chinese and Thai women. Journal of Dermatological Science. 47: ((2007) ): 19–28. |
[23] | Roh KY, et al. Pigmentation in Koreans: study of the differences from Caucasians in age, gender and seasonal variations. British Journal of Dermatology. 144: ((2001) ): 94–99. |
[24] | Man MQ, et al. Variation of skin surface ph, sebum content and stratum corneum hydration with age and gender in a large Chinese population. Skin Pharmacol Physiol. 22: ((2009) ): 190–199. |
[25] | Deegan J. On the occurrence of standardized regression coefficients greater than one. Edu Psychol Measurement. 38: (4) ((1978) ): 873–888. |
[26] | Tippavajhala VK, Magrini TD, Matsuom DC, et al. In vivo determination of moisturizers efficacy on human skin hydration by confocal raman spectroscopy. AAPS PharmSciTech. 19: (7) ((2018) ): 3177–86. |


