
Gestational diabetes mellitus prediction model: A risk factors analysis of pregnant women with gestational diabetes mellitus but have normal oral glucose tolerance test results in the second trimester of pregnancy
Abstract
BACKGROUND:
Oral glucose tolerance test (OGTT) is a standard for the diagnosis of gestational diabetes mellitus (GDM). However, clinically, some cases with normal results were diagnosed as GDM in the third trimester.
OBJECTIVE:
To establish a risk model based on energy metabolism, epidemiology, and biochemistry that could predict the GDM pregnant women with normal OGTT results in the second trimester.
METHODS:
Qualitative and quantitative data were analyzed to find out the risk factors, and the binary logistic backward LR regression was used to establish the prediction model of each factor and comprehensive factor, respectively.
RESULTS:
The risk factors including the rest energy expenditure per kilogram of body weight, oxygen consumption per kilogram of body weight, if more than the weight gain criteria of the Institute of Medicine, the increase of body mass index between the second trimester and pre-pregnancy, and fasting blood glucose. By comparison, the comprehensive model had the best prediction performance, indicating that 85% of high-risk individuals were correctly classified.
CONCLUSION:
Energy metabolism, epidemiology, and biochemistry had better recognition ability for the GDM pregnant women with normal OGTT results in the second trimester. The addition of metabolic factors in the second trimester also improved the overall prediction performance.
1.Introduction
Gestational diabetes mellitus (GDM) is a metabolic disease that is a threat to pregnant women and fetal health risk factors, because it may be associated with a variety of perinatal complications, such as ketoacidosis, gestational hypertension, polyhydramnios, macrosomia, fetal congenital malformation, fetal intrauterine death, dystocia, urogenital infection, puerperal infection and neonatal hypoglycemia, respiratory distress syndrome, neonatal low blood calcium disease, and high blood bilirubin [1, 2, 3]. The current diagnostic criteria for GDM are an oral glucose tolerance test (OGTT) at 24–28 weeks of gestation. Pregnant women diagnosed with GDM will make timely dietary adjustments and take medication if necessary [4]. In pregnant women with normal OGTT results but at high risk of GDM during pregnancy, blood glucose testing is repeated in the third trimester. Many risk factors for GDM have been identified and incorporated into clinical practice recommendations [5, 6], including age, race, BMI, family history of diabetes, previous history of GDM, and multiple pregnancies [7], insulin, fasting glucose, free fatty acids, triglycerides, hepatic lipase, and low-density lipoprotein [8]. Like a metabolic disease, the energy metabolism factor of pregnant women also plays a key role in the control of GDM [9, 10].
The object of this study is for GDM pregnant women with normal OGTT results in the second trimester. These data are more clinically meaningful. Meanwhile they are diagnosed by the existing test and non-invasive energy metabolism test. It improves the accuracy of GDM prediction, reduces unnecessary detection, and provides more time for a clinical intervention of GDM. For early prevention and treatment, it is necessary to find a risk model that can accurately and comprehensively predict the risk of the GDM pregnant women with normal OGTT results in the second trimester.
2.Materials and methods
2.1Background, population, exclusion, and inclusion criteria
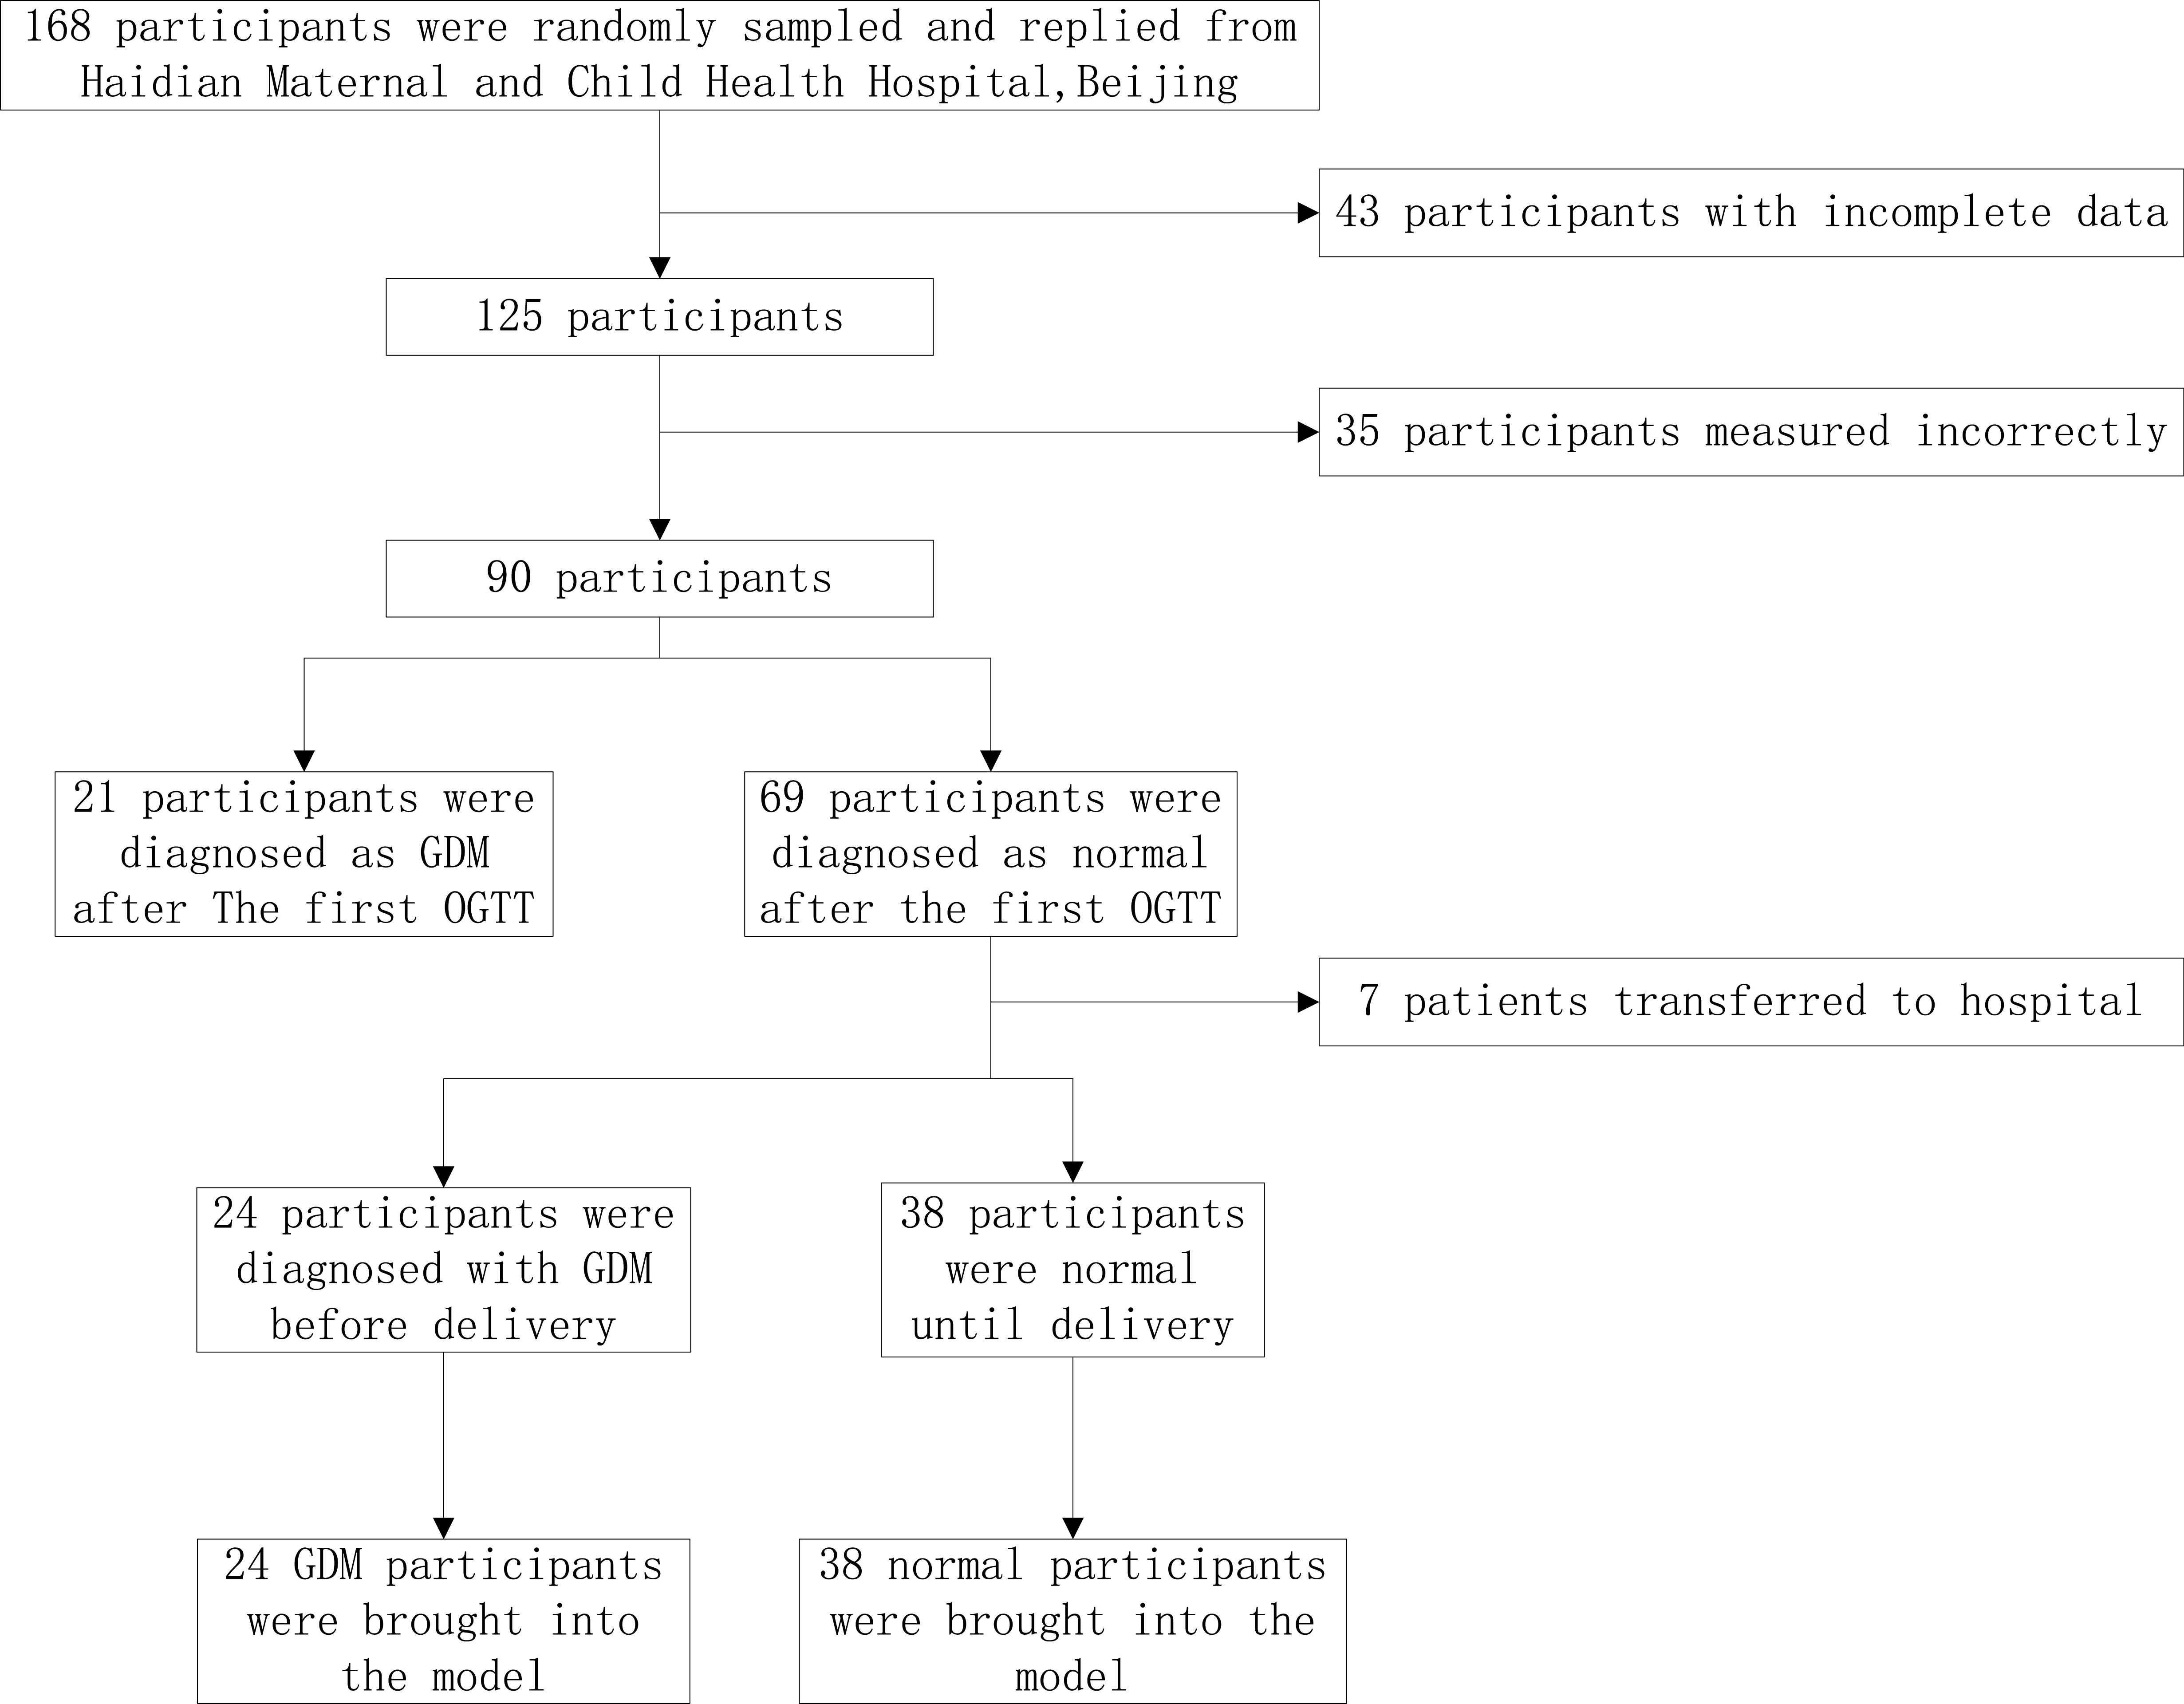
This is a cross-sectional retrospective study. One hundred and sixty-eight pregnant women were randomly recruited from July 2018 to April 2019 for routine prenatal examinations and delivery in Haidian Maternal and Child Health Hospital of Beijing. According to the inclusion and exclusion criteria, a prospective observational cohort was established after obtaining informed consent, and metabolic conditions were detected according to the experimental design until the end of delivery. Ninety pregnant women completed oral glucose tolerance tests and energy metabolic tests at 24–28 weeks. The specific filter flowchart is shown in Fig. 1.
Figure 1.
Flowchart of research object selection.
Inclusion criteria: (1) Single pregnancy; (2) Regularity of the menstrual cycle; (3) Fetal development and gestational week consistent; (4) No chronic hypertension, diabetes, anemia, and other cardiovascular diseases, normal liver and kidney function; (5) Normal thyroid function, no obvious symptoms of acute or chronic infection, no other obstetric complications and complications; and (6) Pregnant women must not take blood pressure-lowering drugs and cardiovascular drugs. Exclusion criteria: (1) Multiple pregnancy; (2) Pregnancy complications, fetal malformation, and thyroid dysfunction occur during this pregnancy; (3) Termination of pregnancy; and (4) According to the record, during the measurement of metabolic parameters, the mask leakage occurred.
2.2Data collection
2.2.1Physical measurement
Height in the pre-pregnancy. Weight and body mass index (BMI) of the subjects in the pre-pregnancy and second trimester were recorded. The body surface area (SA) was calculated by Stevenson’s formula [11] at the same time.
2.2.2Biochemical measurements
In this study, the 75 g OGTT (fasting blood glucose , 1 h and 2 h blood glucose after drinking oral 75 g anhydrous glucose) was performed at 24–28 weeks of gestation, and the diagnosis was made according to the Health Industry Standard of the People’s Republic of China (WS331-2011) diagnostic criteria and the results were recorded. After 30 weeks of gestation to the high risk of normal pregnant women in glucose inspection again. Until delivery, according to the diagnosis, the pregnant women were divided into the GDM pregnant women with normal OGTT results in the second trimester (GDM group) and those who were normal until delivery were analyzed (Normal group).
2.2.3Metabolic measurement
Energy metabolism was measured at 24–28 weeks of gestation. In this study, indirect energy measurement instrument (Breezing, USA) was used to measure rest energy expenditure (REE), oxygen consumption (Vo
The energy metabolism parameters met the following conditions: (1) Fasting for 12 hours; (2) No vigorous exercise and no caffeine intake within 12 hours; (3) Sit quietly for 30 minutes before measurement; and (4) The room temperature should be kept at about 25
2.3Statistical analysis
SPSS 20.0 software was used for statistical analysis of the data in this study. Participant characteristics are displayed as mean with SD, or frequencies with percentages. To develop the prediction model, firstly, independent-samples
The binary logistic backward LR regression was used to establish the prediction model of the three factor groups, the model without energy metabolism and the overall factor model to choose the best threshold performance comparison, and test whether after joining energy metabolic parameters model performance ascension with AUC [12, 13]. In binary multivariable logistic regression analysis with stepwise backward selection, a covariate was retained if the statistical significance of 15% was reached because of avoiding the inaccurate exclusion of potential predictive variables [14, 15].
3.Results
A total of 62 pregnant women were included in this study, including 24 normal and 38 GDM pregnant women with normal OGTT results in the second trimester, and the basic baseline information was shown in Table 1. The age of pregnant women in the GDM group was higher than that in the normal group (29.5
Table 1
Baseline characteristics of pregnant women
| Characteristic | GDM group | Normal group |
|
|---|---|---|---|
| Age (years) | 31.3 | 29.5 | 0.007 |
| Height (m) | 1.63 | 1.63 | 0.060 |
| Pre-pregnancy weight (kg) | 58.1 | 55.2 | 0.303 |
| Pre-pregnancy BMI (kg/m | 21.9 | 20.9 | 0.259 |
| First pregnancy, n yes (%) | 18 (29.0) | 27 (43.5) | 0.485 |
| Family history of diabetes, n yes (%) | 3 (4.8) | 3 (4.8) | 0.438 |
| History of spontaneous abortion, n yes (%) | 11 (17.7) | 13 (21.0) | 0.258 |
| Family history of GDM, n yes (%) | 4 (6.5) | 3 (4.8) | 0.428 |
Continuous variables are presented as mean
Table 2
Potential predictors of GDM and their Odds ratios, coefficients, and
| GDM group | Normal group | Univariate model | |||
|---|---|---|---|---|---|
| OR |
|
| |||
| Intercept | |||||
| Vo | 247.42 | 255.32 | 1.00 (0.99–1.00) | 0.00 | 0.506 |
| Vo | 3.66 | 4.04 | 0.38 (0.15–0.95) | 0.039 | |
| Vco | 180.58 | 177.34 | 1.00 (0.99–1.01) | 0.00 | 0.758 |
| REE (kcal/day) | 1715.79 | 1718.16 | 1.00 (0.99–1.00) | 0.00 | 0.974 |
| REE/kg (kcal/kg/day) | 25.52 | 27.18 | 0.89 (0.77–1.03) | 0.127 | |
| RMR (kcal/m | 1005.05 | 1040.18 | 1.00 (0.99–1.00) | 0.998 | |
| RMR/kg (kcal/kg/m | 15.07 | 16.57 | 0.82 (0.67–1.01) | 0.066 | |
| BMI | 25.38 | 24.10 | 1.20 (1.01–1.46) | 0.18 | 0.079 |
| BMI-LP | 3.62 | 3.43 | 1.19 (0.73–1.94) | 0.17 | 0.494 |
| IOM recommendations, n within (%) | 8 (33.3) | 26 (68.4) | 2.04 (1.18–3.54) | 0.71 | 0.011 |
| GLU ( | 4812 | 4531 | 1.01 (1.00–1.01) | 0.01 | 0.003 |
| Plasma glucose 1 h after 75 g anhydrous | 7621 | 7068 | 1.00 (1.00–1.01) | 0.00 | 0.120 |
| glucose ( | |||||
| Plasma glucose 2 h after 75 g anhydrous | 6343 | 6152 | 1.00 (1.00–1.01) | 0.00 | 0.461 |
| glucose ( | |||||
Vo
Table 2 shows the correlation of energy metabolism factors, epidemiological factors, and biochemical factors with GDM. Due to the small amount of experimental data, the predictive variables of OR
Table 3
Comparison of single factor and multiple factor models
| Model | Performance evaluation indicators | ||||||
|---|---|---|---|---|---|---|---|
| AUC | P | AC | SE | SP | PPV | NPV | |
| Model-M | 0.64 (0.49–0.79) | 0.001 | 0.710 | 0.417 | 0.895 | 0.714 | 0.708 |
| Model-E | 0.71 (0.59–0.85) | 0.030 | 0.677 | 0.583 | 0.737 | 0.583 | 0.737 |
| Model-B | 0.77 (0.64–0.90) | 0.001 | 0.774 | 0.625 | 0.868 | 0.750 | 0.785 |
| Model-E+B | 0.80 (0.68–0.92) | 0.001 | 0.790 | 0.625 | 0.895 | 0.789 | 0.791 |
| Model-M+E+B | 0.85 (0.76–0.95) | 0.000 | 0.820 | 0.750 | 0.865 | 0.783 | 0.842 |
Model-M, model based on energy metabolism factors; Model-E, model based on epidemiological factors; Model-B, model based on biochemical factors; Model-E+B, model based on epidemiological and biochemical factors; Model-M+E+B, model based on all factors.
Table 4
Risk variables factors in the multivariate logistic model
| Variables | Multivariate model | ||
|---|---|---|---|
| OR |
|
| |
| Intercept | 0.00 | 0.006 | |
| Vo | 0.08 (0.00–0.40) | 0.015 | |
| REE/kg (kcal/kg/day) | 2.01 (1.01–7.07) | 0.70 | 0.026 |
| IOM recommendations | 2.67 (1.09–3.72) | 0.98 | 0.048 |
| BMI-LP (kg/m | 0.51 (0.21, 1.23) | 0.135 | |
| GLU ( | 1.01 (1.00, 1.01) | 0.01 | 0.003 |
Vo
Table 3 shows the performance comparison results of the five models. By comparison, for GDM pregnant women with normal OGTT results in the second trimester, the model with the combined performance of the three factors was the most stable, with better prediction accuracy and ability. The models with and without energy metabolism factors were compared. After the addition of energy metabolism factors, the performance of the model is more stable, the sensitivity is higher, and the accuracy is better than the model without energy metabolism. It has been proved that energy metabolism is valuable for the inclusion of predictive models.
Table 4 shows the results of the comprehensive model. After the reverse elimination method is adopted, 5 variables are taken in the model. Including the Vo
The prediction model of the GDM pregnant women with normal OGTT results in the second trimester was:
4.Discussion
The decisive factors for GDM pregnant women with normal OGTT result in the second trimester are various. In this study, Vo
Acknowledgments
This research was funded by the National Key R&D Program of China (2019YFC0119700), the Bill & Melinda Gates Foundation (OPP1148910), the Beijing Science and Technology Project (Z161100000116005), and the Intelligent Physiological Measurement and Clinical Translation, Beijing International Base for Scientific and Technological Cooperation.
Conflict of interest
None to report.
References
[1] | Mitanchez D. Fetal and neonatal complications of gestational diabetes: perinatal mortality, congenital malformations, macrosomia, shoulder dystocia, birth injuries, neonatal outcomes. J Gynecol Obstet Biol Reprod (Paris). (2010) ; 39: (8 Suppl 2): S189-S199. |
[2] | Werbrouck A, Schmidt M, Putman K, et al. A systematic review on costs and cost-effectiveness of screening and prevention of type 2 diabetes in women with prior gestational diabetes: exploring uncharted territory. Diabetes Res Clin Pract. (2019) ; 147: : 138-148. |
[3] | Pinsker JE, Shank T, Dassau E, et al. Comment on american diabetes association. Approaches to glycemic treatment. Diabetes Care. (2015) ; 38: (suppl.1): s41-s48. |
[4] | Crowther CA, Hiller JE, Moss JR, et al. Effect of treatment of gestational diabetes mellitus on pregnancy outcomes. N Engl J Med. (2005) ; 352: (24): 2477-2486. |
[5] | Jaffee KD, Shires DA, Stroumsa D. Discrimination and delayed health care among transgender women and men: implications for improving medical education and health care delivery. Med Care. (2016) ; 54: (11): 1010-1016. |
[6] | Hoffman L, Nolan C, Wilson JD, et al. Gestational diabetes mellitus-management guidelines. The australasian diabetes in pregnancy society. Med J Aust. (1998) ; 169: (2): 93-97. |
[7] | Ferrara A. Increasing prevalence of gestational diabetes mellitus: a public health perspective. Diabetes Care. (2007) ; 30: (Suppl.2): S141-S146. |
[8] | David RH, Ciara M, et al. Normal and abnormal maternal metabolism during pregnancy. Seminars in Fetal & Neonatal Medicine. 14: (2009): 66-71. |
[9] | Eleftheria Taousani, Dimitra Savvaki, Efrosini Tsirou, Pavlos Poulakos, et al. Regulation of basal metabolic rate in uncomplicated pregnancy and in gestational diabetes mellitus. HORMONES. (2017) ; 16: (3): 235-250. |
[10] | Eto E, Maki J, Tamada S, et al. Assessment of resting energy expenditure and body composition in japanese pregnant women with diabetes. J Diabetes Investing. (2018) ; 9: (4): 959-966. |
[11] | Stevenson PH. Calculation of the body2surface area of Chinese. Chin J Physiol, Report Series. (1928) ; 1: : 13-24. |
[12] | Lindstrom J, Tuomilehto J. The diabetes risk score a practical tool to predict type 2 diabetes risk. Diabetes Care. (2003) ; 26: (3): 725-31. |
[13] | Ramachandran A, Snehalatha C, Vijay V, Wareham N, Colagiuri S. Derivation and validation of diabetes risk score for urban asian indians. Diabetes Res Clin Pract. (2005) ; 70: (1): 63-70. |
[14] | Bursac Z, Gauss CH, Williams DK, Hosmer DW. Source code for biology and medicine. Source Code Biol Med (2008) ; 3: : 17. |
[15] | Moons KG, Kengne AP, Woodward M, Royston P, Vergouwe Y, Altman DG, et al. Risk prediction models: I. Development, internal validation, and assessing the incremental value of a new (bio) marker. Heart. (2012) ; 98: (9): 683-90. |


