
Role of patient-specific blood properties in computational fluid dynamics simulation of flow diverter deployed cerebral aneurysms
Abstract
BACKGROUND:
Hemodynamics and their clinical outcome of cerebral aneurysms treated with flow diverter (FD) stents have thus far been investigated using computational fluid dynamics (CFD) simulations. Although human blood is characterized as a non-Newtonian patientspecific fluid, non-patient-specific blood properties (PSBP) were applied in most extant studies.
OBJECTIVE:
To investigate the hemodynamic effects caused by PSBPs in aneurysms treated with FD stents.
METHODS:
We measured blood properties (density and viscosity) for 12 patients who underwent FD stent deployment. We conducted CFD simulations with the measured PSBPs and non-PSBPs quoted from previous studies. The average blood flow velocity and wall shear stress within the aneurysms were calculated and two simulation patterns were compared.
RESULTS:
The velocity and wall shear stress changed by 2.93% and 3.16% on average, respectively, without an FD stent deployed. Conversely, with the FD stents deployed, the change rates increased to 11.1% and 9.06% on average, respectively.
CONCLUSIONS:
The change in hemodynamic parameters if PSBPs are considered, may not be negligible when conducting CFD simulations of FD stent deployed aneurysms To obtain an adequate hemodynamic environment for cerebral aneurysms with FD stents deployed, it is recommended to use PSBPs for CFD simulations.
1.Introduction
Flow diverter (FD) stent treatment is based on a concept that induces thrombosis by altering the hemodynamics of a cerebral aneurysm, and various investigations using computational fluid dynamics (CFD) simulations have been carried out on this topic. In previous studies, hemodynamic parameters such as wall shear stress (WSS) and blood flow velocity in the aneurysm have been investigated using CFD simulations, to explore factors that contribute to aneurysm occlusion with FD stents [1, 2, 3, 4].
In these studies, blood was assumed to be a Newtonian fluid without patient-specific constant density and viscosity. In reality, the blood density naturally varies between patients; human blood is a non-Newtonian fluid, and its viscosity depends on shear rate. When the shear rate increases, the blood viscosity approaches a constant value. In contrast, when the shear rate decreases, blood exhibits a non-Newtonian behavior, indicating that the viscosity increases because of bio-related mechanisms such as red blood cell aggregation [5, 6]. However, according to a meta-analysis conducted by Saqr et al., almost 90% of studies on aneurysm hemodynamics employed the Newtonian viscosity assumption [7]. The hemodynamic effects caused by the non-Newtonian viscosity assumption in the CFD simulation have been also investigated. Gambaruto et al. reported that the WSS value of a non-Newtonian viscosity model differed by approximately 5% from that of the Newtonian viscosity model [8]. Xiang et al. suggested that the WSS value is overestimated if a Newtonian viscosity model is applied [9]. Schirmer et al. conducted CFD simulation for coil embolized basic aneurysm models with non-Newtonian viscosity and showed the viscosity increased in the distal region of the aneurysm [10]. Otani et al. also showed that the Newtonian viscosity model underestimated the degree of shear rate reduction in the low shear rate region, which is a known trigger of thrombosis formation for coil embolized aneurysms [11]. Morales et al. introduced a non-Newtonian viscosity model to simulate the blood flow with coil embolized aneurysms and demonstrated that the viscosity values increased in certain regions. They concluded that the Newtonian model can be employed for CFD simulations because the high viscosity region slightly influenced the flow structure in the aneurysm [12]. Consequently, it is still unclear whether the Newtonian or non-Newtonian model should be applied to CFD simulations of cerebral aneurysms. Additionally, the non-Newtonian effect has not been fully investigated in aneurysms with FD stents deployed Although it was pointed out in the literature that FD stent implantation induces a lower shear rate within the aneurysm and raises the viscosity value, previous studies applied mostly the non-patient-specific Newtonian viscosity to perform blood flow simulation with FD stent deployment [1, 2, 3, 4, 13].
In this study, we obtained whole blood samples from patients who underwent FD stent deployment and measured their blood properties (density and viscosity), conducting CFD simulations with and without the patient-specific blood properties (PSBPs). We investigated differences in hemodynamic parameters caused by introducing PSBPs into CFD simulations and compared the differences between the CFD simulations with and without FD stents deployed, to clarify hemodynamic effects related to the introduction of PSBPs and the deployment of FD stents, respectively.
2.Materials and methods
2.1Patient-selection and measurement of blood properties
This study was approved by the Ethics Committee of the Jikei University School of Medicine in Japan. We obtained written consent from each patient participating in this study. From 39 cases treated with FD stents from October 2016 till January 2020 at the Jikei University School of Medicine, we selected the cases for this study based on the following criteria: (1) blood sample was collected during the treatment (20/39 cases), (2) aneurysm was
Blood density and viscosity were used as PSBPs. Whole blood samples were collected from each patient right before the surgery, using an EDTK-2K coated evacuated tube (Japan Becton Dickinson CO., Ltd., Tokyo, Japan) to prevent blood coagulation during the measurement. Since blood properties are believed to be altered by its components and the environment such as its temperature [14, 15], the temperature of the blood samples was kept at 37
(1)
where
(2)
In this equation, the constant
2.2CFD simulation procedure
All patients underwent three-dimensional digital subtraction angiography (3D-DSA; Artis Q biplane, Siemens Healthcare GmbH, Forchheim, Germany) before the FD stent deployment. The images were reconstructed to stereolithography (STL) format using Amira 5.6 (Thermo Fisher Scientific, Waltham, MA, USA). Deployed FD stents were reproduced with our in-house code in the Tokyo University of Science based on a methodology described by Bouillot et al. as follows [21]: (1) extraction of the parent artery by separating the aneurysmal sac from the original image voxel data and conversion of its surface into STL format; (2) calculation of a centerline of the parent artery and a minimum inscribed sphere radius corresponding to the centerline by using VMTK (Vascular Modeling Toolkit, www.vmtk.org); (3) reproduction of the FD stent wires based on the information computed above. We reproduced the geometry of the Pipeline with the design parameters described in a previous study [22], and used the value of 0.03 mm also described in another previous study as the diameter of each wire constituting the Pipeline to reproduce the FD stent geometry [23]. Coil deployment was not considered and only the stent geometry was used to perform the blood flow simulations.
Computational meshes were generated using ANSYS ICEM CFD 18.1 (ANSYS Inc., Canonsburg, PA, USA). In this study, we created a cross-sectional plane at 1 mm proximally from the aneurysm neck and defined an aneurysmal inlet. Similarly, an aneurysmal outlet was set at 1 mm distally from the neck. A computational domain was defined as a region enclosed by the arterial wall and both the aneurysmal inlet and outlet. We defined the aneurysm region as the area of the aneurysmal sac, not including FD stent structures. The mesh type used was set as unstructured, and the meshes consisted of both tetrahedral and prism meshes. In the vicinity of the vessel wall, seven prism mesh layers were aligned at a height of 0.3 mm, and the size of the elements varied depending on the diameter of the vessel where each element was located. The tetrahedral mesh size in the vicinity of the FD stent wires was set at 0.008 mm dividing the wire diameter by an approximate factor of 12, based on a previous study [24]. With those computational mesh settings, the mesh convergence was accomplished. The total number of generated elements was 10.3 million on average, for cases without FD stent, and 197 million for cases with FD stent. Finally, extension tubes with a length of 75 mm were connected to all inlets and outlets to reduce the effect caused by boundary conditions and develop the flow.
We conducted the blood flow simulations assuming incompressible laminar flow. Both the vessel wall and the FD stent wire were assumed to be rigid non-slip walls. Although the vessel wall is originally viscoelastic [25], the characters and mechanical properties of the vessel wall and the FD stent were not considered in this study. As non-PSBPs related, density and Newtonian viscosity were assumed as 1,050 kg/m
2.3Quantitative evaluation
We calculated the absolute change rate of the average blood flow velocity and the WSS within the aneurysms, because these parameters are subject to change. The absolute change rate is described as follows:
(3)
where
Table 1
Specific viscosity values for each shear rate
| Apparent viscosity [mPa | |||||||||
| Shear rate | 10 | 50 | 100 | 200 | 300 | 400 | 500 | 600 | |
| Newtonian | 3.60 | 3.60 | 3.60 | 3.60 | 3.60 | 3.60 | 3.60 | 3.60 | |
| Case | A | 6.23 | 4.44 | 4.06 | 3.80 | 3.69 | 3.62 | 3.58 | 3.55 |
| B | 6.51 | 4.26 | 3.80 | 3.49 | 3.36 | 3.28 | 3.23 | 3.19 | |
| C | 7.87 | 4.99 | 4.40 | 4.01 | 3.84 | 3.74 | 3.68 | 3.63 | |
| D | 7.94 | 4.85 | 4.23 | 3.82 | 3.64 | 3.54 | 3.47 | 3.42 | |
| E | 4.66 | 3.70 | 3.49 | 3.35 | 3.28 | 3.25 | 3.22 | 3.20 | |
| F | 5.04 | 3.61 | 3.31 | 3.10 | 3.01 | 2.96 | 2.92 | 2.90 | |
| G | 8.56 | 5.21 | 4.54 | 4.09 | 3.90 | 3.79 | 3.71 | 3.66 | |
| H | 7.48 | 5.06 | 4.56 | 4.22 | 4.07 | 3.98 | 3.92 | 3.88 | |
| I | 5.24 | 4.06 | 3.81 | 3.63 | 3.55 | 3.51 | 3.48 | 3.45 | |
| J | 4.16 | 3.62 | 3.50 | 3.42 | 3.38 | 3.36 | 3.35 | 3.33 | |
| K | 8.25 | 5.39 | 4.80 | 4.40 | 4.23 | 4.13 | 4.07 | 4.02 | |
| L | 7.48 | 5.06 | 4.56 | 4.22 | 4.07 | 3.98 | 3.92 | 3.88 | |
| Range | Max | 8.56 | 5.39 | 4.80 | 4.40 | 4.23 | 4.13 | 4.07 | 4.02 |
| Min | 4.16 | 3.61 | 3.31 | 3.10 | 3.01 | 2.96 | 2.92 | 2.90 | |
Figure 1.
Relationship between shear rate and apparent viscosity. Each patient-specific viscosity decreases when the shear rate increases and asymptotes to a constant value, while the Newtonian viscosity has a constant value regardless of the shear rate.
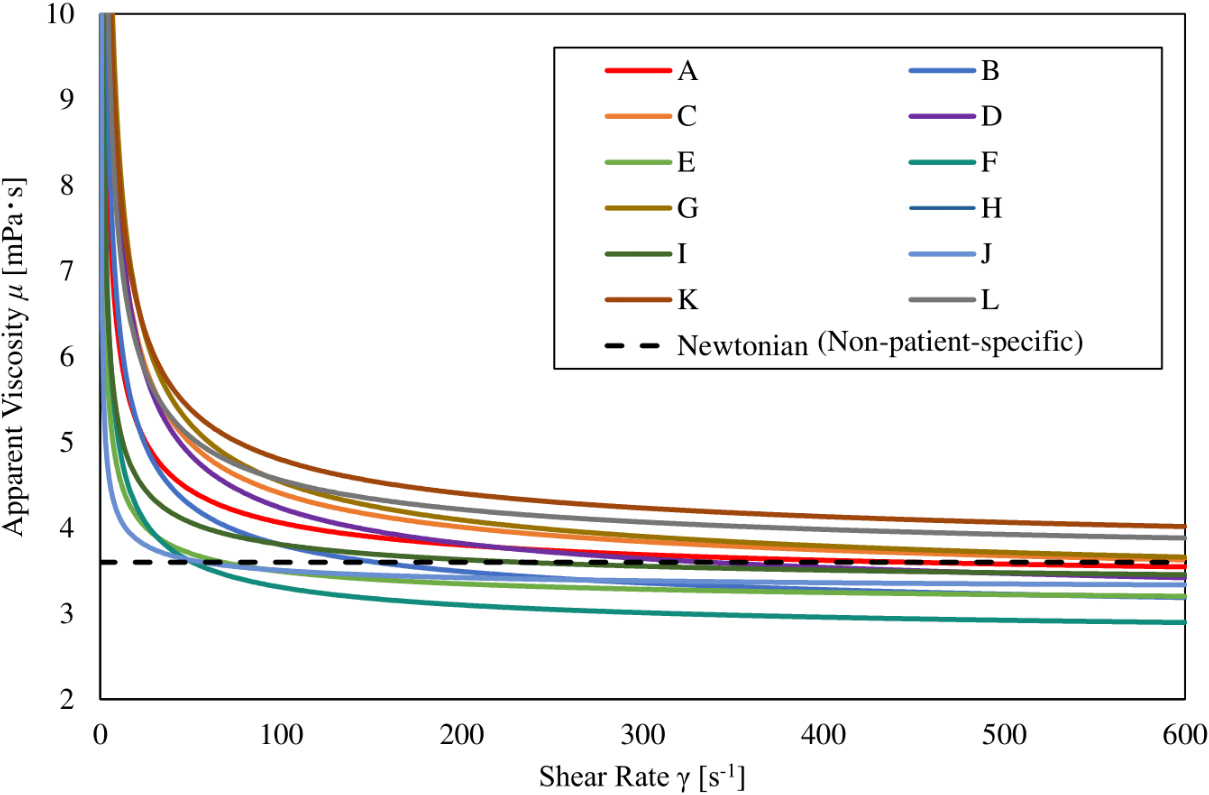
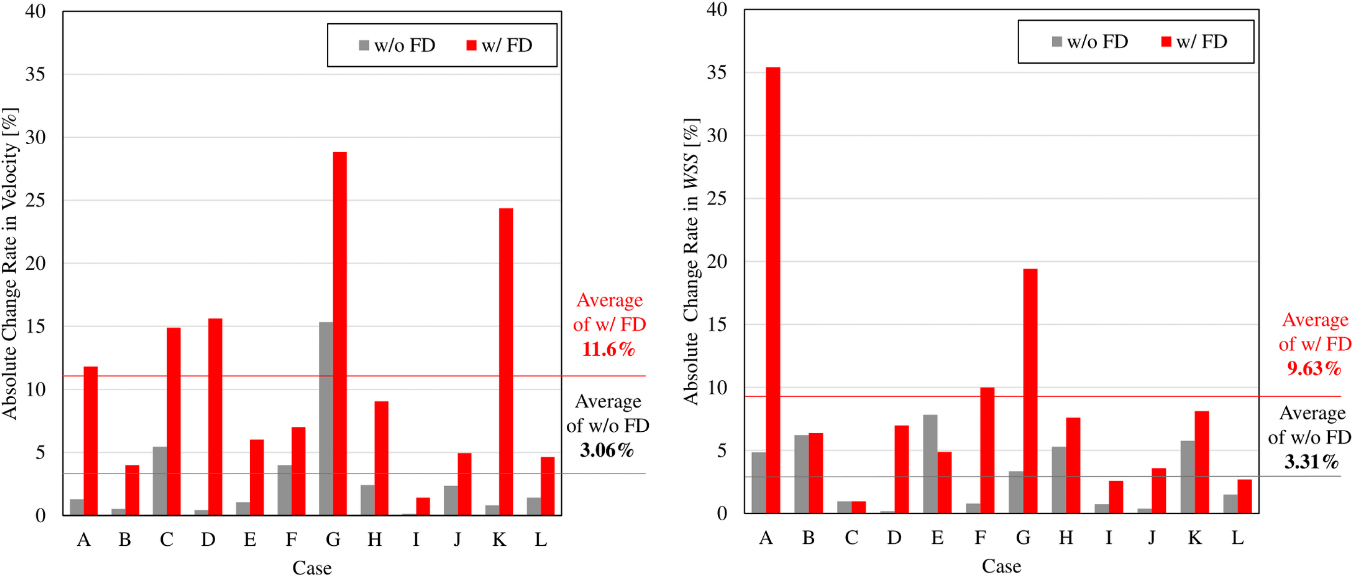
Figure 2.
Bar graphs showing absolute change rate of velocity and WSS caused by introducing PSBPs. The rate with an FD stent implanted exceeds the rate without an FD stent implanted, in almost all cases.
3.Results
3.1Measured values for patient-specific blood properties
The average measured blood density was 1043.1
3.2Qualitative and quantitative difference in CFD simulations
The absolute change rates of velocity and WSS calculated in our CFD simulations, with and without PSBPs, are illustrated in Fig. 2. The average absolute change rate of aneurysmal velocity for all cases was 3.06% without FD stent deployment, and 11.6% with FD stent deployment. Additionally, the average absolute change rate of WSS at aneurysmal dome was 3.31% in the cases without FD stent deployment, and 9.63% for cases with FD stent deployment. The calculated absolute change rate of each parameter tended to be greater in the cases with FD stent deployment.
Figure 3 depicts a streamline and color contour map of WSS for the illustrative Case G which had the largest absolute change rate in velocity and the second largest absolute change rate in WSS, among aneurysms with FD stent deployed (see Fig. 2). A different flow structure circled by the dashed line was observed in Fig. 3, and flow appeared to be stagnant in the CFD simulations while considering PSBPs. The average flow velocity in the aneurysm was 0.0134 m/s without considering PSBPs, and 0.00949 m/s while considering PSBPs. Therefore, a 28.8% difference was observed between the two simulation results. Also, a locally high WSS region appeared in the simulation without the PSBPs pattern (circled by a continuous line in Fig. 3). The region appeared to be smaller in size in the simulation with PSBPs pattern, however, the WSS value increased in the entire aneurysmal wall reflecting the increase in the apparent viscosity. The average WSS value was 0.0674 Pa without considering PSBPs and 0.0804 Pa while considering PSBPs, leading to a 19.4% difference between the two simulation results.
Because the patient-specific blood viscosity increased when the shear rate decreased, as shown in Fig. 1, we calculated the spatial average shear rate and viscosity values in the aneurysm. The computed shear rate and viscosity values are shown in Table 2. As shown in Table 2, the mean shear rate for all cases was 128 s
Table 2
Aneurysmal average shear rate and viscosity values
| Shear rate [s | Viscosity [mPa | ||||
|---|---|---|---|---|---|
| w/o FD | w/FD | w/o FD | w/FD | ||
| Case | A | 112 | 58.9 | 4.29 | 4.61 |
| B | 53.8 | 39.5 | 4.96 | 6.18 | |
| C | 83.4 | 34.7 | 4.99 | 11.7 | |
| D | 56.3 | 22.9 | 5.53 | 7.17 | |
| E | 153 | 72.2 | 3.53 | 3.77 | |
| F | 72.0 | 24.6 | 3.75 | 4.78 | |
| G | 16.6 | 4.48 | 9.02 | 68.2 | |
| H | 238 | 134 | 3.40 | 3.67 | |
| I | 112 | 42.7 | 3.93 | 4.75 | |
| J | 201 | 122 | 3.53 | 3.54 | |
| K | 49.2 | 20.4 | 6.56 | 17.5 | |
| L | 394 | 210 | 4.12 | 4.38 | |
| Mean | 128 | 65.5 | 4.80 | 11.7 | |
| Standard deviation | 101 | 57.8 | 1.56 | 17.5 | |
Figure 3.
Streamlines and WSS color contour map with PSBPs and without PSBPs.
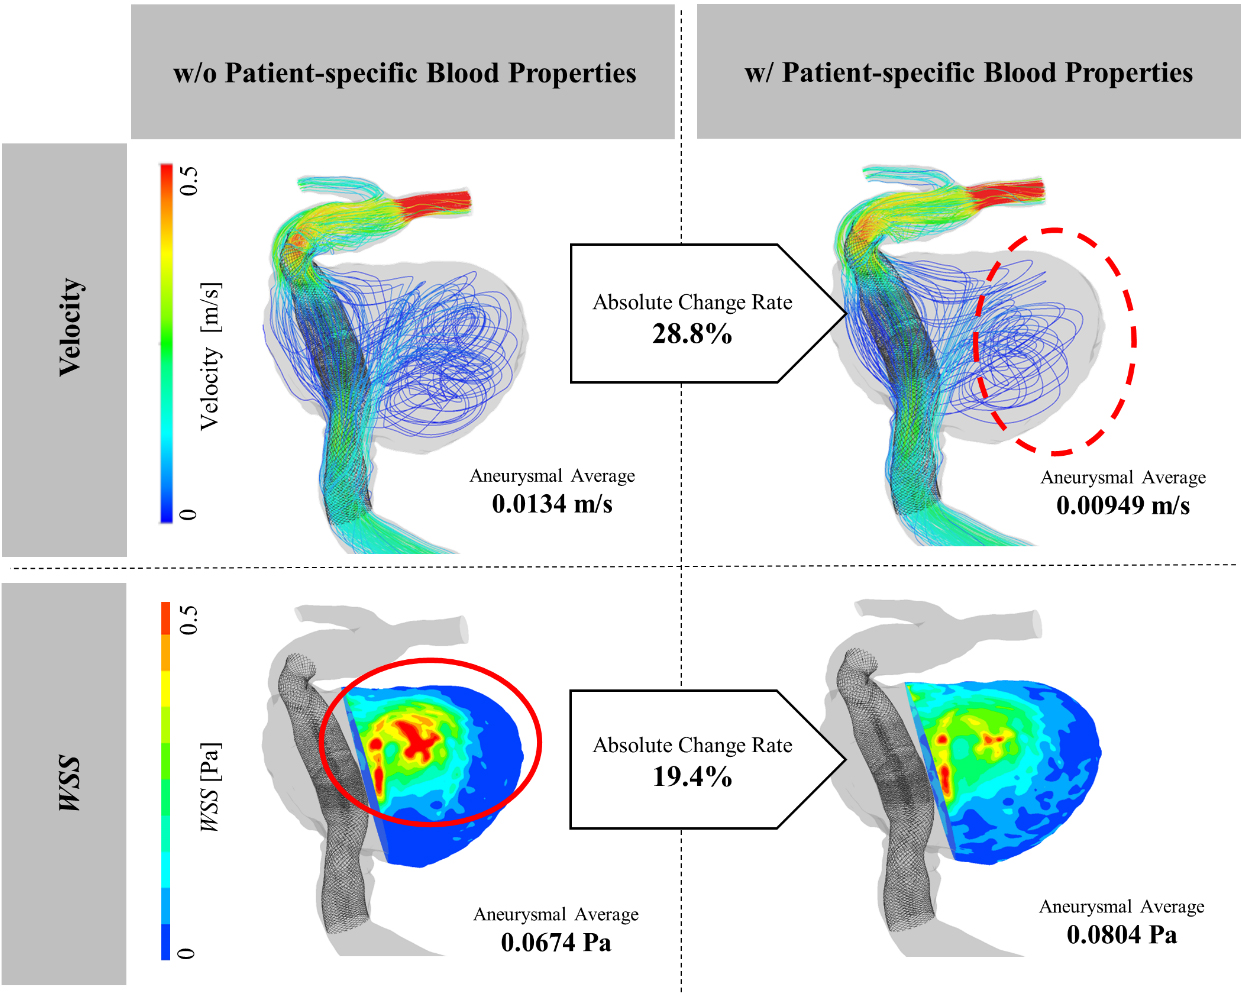
Figure 4.
A color contour map of shear rate for an illustrative case (Case A). The shear rate value is considerably higher in the vicinity of the FD stent mesh (marked by a square).
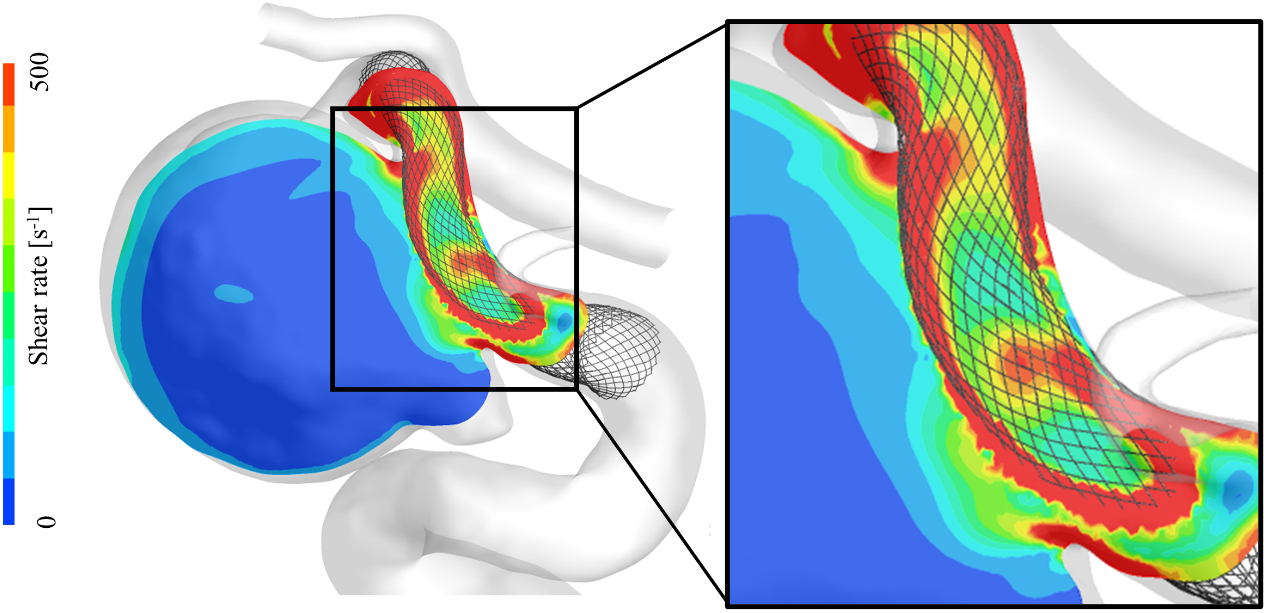
As a further investigation of the shear rate, we captured a contour map of the shear rate in Fig. 4 taken from the illustrative Case A, which depicts its state in the aneurysmal dome and the vicinity of the FD stent. This illustrative figure indicates that the shear rate tends to increase in the vicinity of the FD stent, as indicated by a square shown in this figure, and because of the dense mesh of the FD stent, the main flow of the parent artery had high velocity.
4.Discussion
4.1Differences between patient-specific and non-patient-specific blood properties
We measured patient-specific whole blood properties including density and viscosity and found that patient-specific viscosity had a specific curve for each patient (see Fig. 1). The average measured density was 1043.1 kg/m
4.2Relationship between hemodynamic influence of blood properties and presence of FD stents
Hemodynamic effects caused by the introduction of PSBPs in the simulation were greater in the presence of FD stents. An average WSS difference of 3.06% was observed in comparison with the simulation without FD stents, which is close to the value reported by Gambaruto et al. [8]. However, this difference became 9.63% in the simulation with FD stents deployed. The effect of the PSBPs on the aneurysm hemodynamics became larger for the FD stent deployed pattern in relation to the shear rate value in the aneurysm. In Table 2, the shear rate values in the aneurysm were generally lower than 200 s
As can be seen in Fig. 4, the shear rate increases in vicinity of the FD stent wires. Blood viscosity had a Newtonian behavior in this region because its values did not vary in the high shear rate range (
In contrast, we observed a specific shear rate decrease in the aneurysmal sac which implies that PSBPs considering a non-Newtonian viscosity ought to be used in the blood flow simulation of an aneurysm with a deployed FD stent. Although we did not follow the clinical outcomes of the cases considered in this study the investigated hemodynamic parameters (velocity and WSS) were also used in previous studies as factors facilitating aneurysm thrombosis by FD stent deployment 1̧,2,3,4. Our results imply that these hemodynamic parameters might not reflect the actual state without introducing PSBPs. Clauser et al. conducted in Vitro particle image velocimetry (PIV) measurements using several kinds of fluids having different properties [30]. They reported that the flow diversion effect caused by the FD stent deployment is influenced by the fluid properties and that the velocity reduction caused by FD stent deployment was larger in the case of a fluid that had a non-Newtonian viscosity. Additionally, Gijsen et al. experimentally investigated the effect of the non-Newtonian fluid in the carotid bifurcation models with laser Doppler anemometry and reported that there were striking differences in the flow field between experiments with the Newtonian fluid and non-Newtonian fluid [31]. These experimental results show us a necessity of the non-Newtonian viscosity to investigate the hemodynamics in arteries including a cerebral aneurysm. Particularly the in Vitro results from Clauser et al. concur with our findings that the effects of considering PSBPs in CFD simulations are stronger when FD stents are deployed. Our study might be a first one to investigate the hemodynamic effects caused by introducing PSBPs in CFD simulations, evaluating the effect of an FD stent placement in Silico, and leading to similar results than the in Vitro measurements
4.3Limitations and further investigations
This study presents some limitations. We considered 12 cases adapted to our case selection criteria. Morales et al. investigated the hemodynamic influences in 3 coil embolized aneurysms, using the non-Newtonian viscosity model [12]. Thus we also believe that conducting a statistical analysis was not necessary, as the number of cases considered was sufficient to examine the hemodynamic effects of the PSBPs on blood flow simulations of FD deployed aneurysms. However, we would need a larger sample size and a statistical evaluation, for more detailed investigations.
Additionally, as mentioned in Section 2, inflow conditions do not affect the flow pattern in the aneurysm; however, hemodynamic parameters can be quantitatively affected by these inflow conditions. Evju et al. investigated how the hemodynamic parameter WSS was altered by introducing 4 viscosity models and 3 boundary conditions [32]. They concluded that the WSS are strongly correlated to the boundary conditions, rather than the viscosity models. Khan et al. also investigated the impact of rheology models against the impact of a CFD solution strategy for predictions of aneurysm flow instabilities [33]. They indicated that solution strategy and other likely “first-order” effects such as vessel lumen segmentation and choice of flow rates appear to be more important than the effect of the rheology. Particularly, patient-specific inflow boundary conditions are desirable for blood flow simulations and methodology for acquisition the conditions have been developing. 2D magnetic resonance imaging (MRI) and 4D phase-contrast MRI are being used to measure patient-specific inflow conditions, and these techniques should be adopted in future investigations to perform CFD simulations reflecting more accurately the actual patient’s state [34, 35].
5.Conclusions
We obtained whole blood samples from 12 patients who underwent FD stent deployment, and measured patient-specific blood density and viscosity. We introduced these blood properties into CFD simulations. The average differences caused by introducing the blood properties were 11.6% and 9.63% for aneurysmal velocity and WSS at aneurysmal dome, respectively, with an FD stent already placed. These differences were larger than the values without any FD stent deployed. Our results imply that consideration of PSBPs is recommended when conducting CFD simulations with an FD stent deployed, to obtain an accurate hemodynamics assessment and a proper prognosis of the aneurysm occlusion.
Acknowledgments
This work was supported by the JSPS KAKENHI under Grant JP20J30001 and approved by the Ethics Committee of the Jikei University School of Medicine.
Conflict of interest
None to report.
References
[1] | Cebral JR, Mut F, Raschi M, Scrivano E, Ceratto R, Lylyk P, et al. Aneurysm rupture following treatment with flow-diverting stents: computational hemodynamics analysis of treatment. AJNR Am J Neuroradiol. (2011) ; 32: (1): 27-33. |
[2] | Kulsár Z, Augsburger L, Reymond P, Pereira VM, Hirsch S, Mallik AS, et al. Flow diversion treatment: Intra-aneurismal blood flow velocity and WSS reduction are parameters to predict aneurysm thrombosis. Acta Neurochir (Wien). (2012) ; 154: (10): 1827-1834. |
[3] | Mut F, Raschi M, Scrivano E, Bleise C, Chudyk J, Ceratto R, et al. Association between hemodynamic conditions and occlusion times after flow diversion in cerebral aneurysms. J Neurointerv Surg. (2015) ; 7: (4): 286-290. |
[4] | Paliwal N, Jaiswal P, Tutino VM, Shallwani H, Davies JM, Siddiqui AH, et al. Outcome prediction of intracranial aneurysm treatment by flow diverters using machine learning. Neurosurg Focus. (2018) ; 45: (5): E7. |
[5] | Chien S, Usami S, Dellenback RJ, Gregresen MI, Nanninga LB, Guest MM. Blood viscosity: Influence of erythrocyte aggregation. Science. (1967) ; 157: (3790): 829-831. |
[6] | Dupont PA, Sirs JA. The relationship of plasma fibrinogen, erythrocyte flexibility and blood viscosity. Thromb Haemost. (1977) ; 38: (3): 660-667. |
[7] | Saqr KM, Rashad S, Tupin S, Niizuma K, Hassan T, Tominaga T, et al. What does computational fluid dynamics tell us about intracranial aneurysms? A meta-analysis and critical review. J Cereb Blood Flow Metab. (2020) ; 40: (5): 1021-1039. |
[8] | Gambaruto AM, Janela J, Moura A, Sequira A. Sensitivity of hemodynamics in a patient specific cerebral aneurysm to vascular geometry and blood rheology. Math Biosci Eng. (2011) ; 8: (2): 409-423. |
[9] | Xiang J, Tremmel M, Kolega J, Levy EI, Natarajan SK, Meng H. Newtonian viscosity model could overestimate wall shear stress in intracranial aneurysm domes and underestimate rupture risk. J Neurointerv Surg. (2012) ; 4: (5): 351-357. |
[10] | Schirmer CM, Malek AM. Critical influence of framing coil orientation on intra-aneurysmal and neck region hemodynamics in a sidewall aneurysm model. Neurosurgery. (2010) ; 67: (6): 1692-1702. |
[11] | Otani T, Ii S, Hirata M, Wada S. Computational study of the non-Newtonian effect of blood on flow stagnation in a coiled cerebral aneurysm. Nihon Reoroji Gakkaishi. (2017) ; 45: (5): 243-249. |
[12] | Morales HG, Larrabide I, Geers AJ, Aguilar ML, Frangi AF. Newtonian and non-Newtonian blood flow in coiled cerebral aneurysms. J Biomech. (2013) ; 46: (13): 2158-2164. |
[13] | Mut F, Cebral JR. Effects of flow-diverting device oversizing on hemodynamics alteration in cerebral aneurysms. AJNR Am J Neuroradiol. (2012) ; 33: (10): 2010-2016. |
[14] | Rand PW, Lacombe E, Hunt HE, Austin WH. Viscosity of normal human blood under normothermic and hypothermic conditions. J Appl Physiol. (1964) ; 19: : 117-122. |
[15] | Cinar Y, Senyol AM, Duman K. Blood viscosity and blood pressure: role of temperature and hyperglycemia. (2001) ; 14: (5 Pt 1): 433-438. |
[16] | Yamamoto H, Kawamura K, Omura K, Tokudome S. Development of a compact-sized falling needle rheometer for measurement of flow properties of fresh human blood. Int J Thermophys. (2010) ; 31: : 2361-2379. |
[17] | Yamamoto H, Yabuta T, Negi Y, Horikawa D, Kawamura K, Tamura E, et al. Measurement of human blood viscosity a using Falling Needle Rheometer and the correlation to the Modified Herschel-Bulkley model equation. Heliyon. (2020) ; 6: (9): e04792. |
[18] | Matsunaga N, Suzuki T, Araki S, Tamura E, Kawamura K, Yamamoto H. Evaluation of uncertainty in viscosity measurement using compact-sized falling needle rheometer. Netsu Bussei. (2015) ; 28: (4): 173-178. |
[19] | Cebral JR, Castro MA, Appanaboyina S, Putman CM, Millan D, Frangi AF. Efficient pipeline for image-based patient-specific analysis of cerebral aneurysm hemodynamics: Technique and sensitivity. IEEE Trans Med Imaging. (2005) ; 24: (4): 457-467. |
[20] | Suzuki T, Takao H, Suzuki T, Suzuki T, Masuda S, Dahmani C, et al. Variability of hemodynamic parameters using the common viscosity assumption in a computational fluid dynamics analysis of intracranial aneurysms. Technol Health Care. (2017) ; 25: (1): 37-47. |
[21] | Bouillot P, Brina O, Ouared R, Yilmaz H, Farhat M, Erceg G, et al. Geometrical deployment for braided stent. Med Image Anal. (2016) ; 30: : 85-94. |
[22] | Ma D, Dargush GF, Natarajan SK, Levy EI, Siddiqui AH, Meng H. Computer modeling of deployment and mechanical expansion of neurovascular flow diverter in patient-specific intracranial aneurysms. J Biomech. (2012) ; 45: (13): 2256-2263. |
[23] | Shapiro M, Raz E, Becske T, Nelson PK. Variable porosity of the pipeline embolization device in straight and curved vessels: A guide for optimal deployment strategy. AJNR Am J Neuroradiol. (2014) ; 35: (4): 727-733. |
[24] | Larrabide I, Aguilar ML, Morales HG, Geers AJ, Kulcsár Z, Rüfenacht D. Intra-aneurysmal pressure and flow changes induced by flow diverters: Relation to aneurysm size and shape. AJNR Am J Neuroradiol. (2013) ; 34: (4): 816-822. |
[25] | Isaksen JG, Bazilevs Y, Kvamsdal T, Zhang Y, Kaspersen JH, Waterloo K, et al. Determination of wall tension in cerebral artery aneurysms by numerical simulation. Stroke. (2008) ; 39: (12): 3172-3178. |
[26] | Zhang Y, Chong W, Qian Y. Investigation of intracranial aneurysm hemodynamics following flow diverter stent treatment. Med Eng Phys. (2013) ; 35: (5): 608-615. |
[27] | Ford MD, Alperin N, Lee SH, Holdworth DW, Steinman DA. Physiol Meas. (2005) ; 26: (4): 477-488. |
[28] | Amili O, Schiavazzi D, Moen S, Jagadeesan B, Van de Moortele P-F, Coletti F. Hemodynamics in a giant intracranial aneurysm characterized by in vitro 4D flow MRI. PLoS One. (2018) ; 13: (1): e0188323. |
[29] | Hippelheuser JE, Lauric A, Cohen AD, Malek AM. Realistic non-Newtonian viscosity modelling highlights hemodynamic differences between intracranial aneurysms with and without surface blebs. J Biomech. (2014) ; 47: (15): 3695-3703. |
[30] | Clauser J, Knieps MS, Büsen M, Ding A, Schmitz-Rode T, Steinseifer U, et al. A novel plasma-based fluid for particle image velocimetry (PIV): In-vitro feasibility study of flow diverter effects in aneurysm model. Ann Biomed Eng. (2018) ; 46: (6): 841-848. |
[31] | Gijsen FJ, van de Vosse FN, Janssen JD. The influence of the non-Newtonian properties of blood on the flow in large arteries: Steady flow in a carotid bifurcation model. J Biomech. (1999) ; 32: (6): 601-608. |
[32] | Evju Ø, Valen-Sendstad K, Mardal K-A. A study of wall shear stress in 12 aneurysms with respect to different viscosity models and flow conditions. J Biomech. (2013) ; 46: (16): 2802-2808. |
[33] | Khan MO, Steinman DA, Valen-Sendstad K. Non-Newtonian versus numerical rheology: Practical impact of shear-thinning on the prediction of stable and unstable flows in intracranial aneurysms. Int J Numer Method Biomed Eng. (2017) ; 33: (7): e2836. |
[34] | Jansen IGH, Schneiders JJ, Potters WV, van Ooij P, van den Berg R, van Bavel E, et al. Generalized versus patient-specific inflow boundary conditions in computational fluid dynamics simulations of cerebral aneurysmal hemodynamics. (2014) ; 35: (8): 1543-1548. |
[35] | Jiang J, Johnson K, Valen-Senstad K, Mardal K-A, Wieben O, Strother C. Flow characteristics in a canine aneurysm model: A comparison of 4D accelerated phase-contrast MR measurements and computational fluid dynamics simulations. Med Phys. (2011) ; 38: (11): 6300-6312. |


