
A coronary artery segmentation method based on region growing with variable sector search area
Abstract
BACKGROUND:
Coronary artery image segmentation is an important auxiliary method for coronary artery disease diagnosis.
OBJECTIVE:
The classical region growing algorithms, which only consider the intensity of pixels, are noise-sensitive and require manual interaction. To this end, recent methods simultaneously consider the intensity of pixels and multi-scale analysis with the region growing. Nevertheless, these methods are not fully optimized and they suffer from the drawbacks of over- or under-segmentation in many cases.
METHODS:
In this paper, we propose a region growing based coronary artery segmentation method. Different from the existing methods, the variable sector search area is considered in the region growing technique. A growing rule is proposed to segment the vessel, which combines the Hessian vector and the region growing with the variable sector search area. To further improve the quality of segmentation, we propose an optimization of removing some small disconnected regions.
RESULTS:
Our proposed method can search more branches while segmenting the vessel, even the small ones. It keeps an acceptable performance when dealing with stenosis and large curvature of blood vessels.
CONCLUSIONS:
Quantitative evaluations are conducted on coronary angiography and the results show that the proposed method achieves a higher DSC ratio and a more reliable sensitivity ratio.
1.Introduction
X-ray coronary angiography (XCA) is an effective method for the diagnosis of coronary artery disease (CAD). It is considered to be the “gold standard” for the diagnosis of CAD [1]. Coronary artery segmentation is an important step in the diagnosis of CAD. There are several difficulties in vascular segmentation. For example, the projection of coronary angiography will lead to overlap between blood vessels and organs and even overlap between blood vessels due to the complexity of vascular structure. As well as the uneven distribution of the contrast agent will affect the imaging quality seriously.
Many methods for vascular segmentation have been proposed and evaluated [2, 3, 4]. In Ref [5, 6], the active contour model is used to segment the important branches of blood vessels. Although it has achieved good results, the algorithm needs many iterations and the complexity of the algorithm is high. Ref [7, 8] uses the graph cutting technique to segment blood vessels by finding the minimum cost of the energy function. However, they need more space storage and computing time since the graph cutting are computed on-the-fly. The algorithms using the supervised machine learning technique in vascular segmentation are reviewed in Ref [9]. They generally require a large amount of data to build the training dataset, and most of the training datasets are drawn manually by experts, which are seriously affected by subjective factors.
The region growing technique has been widely used in the field of vascular segmentation because of its simplicity and effectiveness. The basic idea of region growing is to search the intravascular pixels from the selected seed points, then add the suitable pixels iteratively to the blood vessel regions according to a predefined growth criterion. The intensity similarity is a basic growing criterion for the image segmentation, which considers the pixels with similar intensities to be from the same object. The drawbacks of the native region growing technique are that (1) it requires manual interaction to obtain seed points; (2) it is sensitive to noise and; (3) the problem of over-segmentation will occur in the case of partial volume effect. In recent years, more algorithms for vascular segmentation are proposed, which combine multi-scale analysis with region growing algorithm, rather than only consider the intensity of pixels. In Ref [10], Frangi constructs a multi-parameter similarity function for vascular enhancement to segment blood vessels by analyzing the properties of the eigenvalue of the Hessian matrix with tubular, blob-like structures and plate-like structures at a certain scale. Ref [11] defines multi-scale filtering to acquire feature maps and combines region growing algorithms to extract blood vessels. This method leads to over-segmentation when there are complex backgrounds. In Ref [12], a method of region growing and multi-scale analysis is proposed to extract coronary artery vessels. The direction vector of pixels is obtained by multi-scale analysis. The algorithm incorporates the angle between the direction vectors of neighborhood pixels in the region growing criterion. This method can avoid the problem of vascular loss when the intensity of blood vessels is low caused by plaques. The algorithm removes the pixels with larger angles of the direction vector from the growing process, but ignores the fact that the angle between the direction vectors of the pixels at the branch of the vessel, and the curvature of the vessel will be large. This will result in over- or under-segmentation.
To segment the coronary artery and its branches more effectively, a region growing method based on variable sector region searching is proposed in this paper, which combines multi-scale analysis and region growing algorithm. There are two advantages to using the variable sector search with Hessian matrix vectors. Firstly, when the stenosis has a low vesselness response function value, searching for blood vessels by direction vector leads to the rupture of vascular trees. But the stenosis vessel and its distal connected parts can be found by using the variable sector region under this case. Secondly, the direction vectors vary greatly when the blood vessels have a branch or a larger curvature. The adjacent area may be ignored by using direction vectors. Vascular branches and vessels with large curvatures can be easily found by expanding the variable sector search area. Besides, the proposed method will segment complicated coronary structures successfully.
2.Segmentation method and process
The entire process is briefly described below: Firstly, the seed point set is extracted automatically by the value of vascular response function in Ref [10]. Then the variable sector region is established according to the Hessian eigenvector; the search process was carried out to determine the intravascular pixel set. Finally, the non-vascular area is removed from the image after the segmentation.
2.1Extraction of the seed points
According to the Frangi vesselness response function constructed by the eigenvalue of Hessian matrix, the corresponding vesselness functions at different scales of each pixel in the image are calculated. The pixels whose response values are greater than the specified threshold is used as the seed points. The principles are described in the following paragraphs.
Coronary arteries present tubular structures locally in the angiography image. In Ref [10], Frangi detects the vascular structure in 2D and 3D images by using the multi-scale enhancement method of Hessian matrix eigenvalue, as follows.
A common way to analyze the local behavior of an image I is to consider its Taylor expansion in the point
The Hessian matrix of pixel
(1)
Frangi uses eigenvalue of Hessian to build vesselness measure function
(2)
The setting of parameters is described in Ref [10].
The value of the vesselness function of tubular structure is between 0 and 1. When the value of
Calculate the value of
(3)
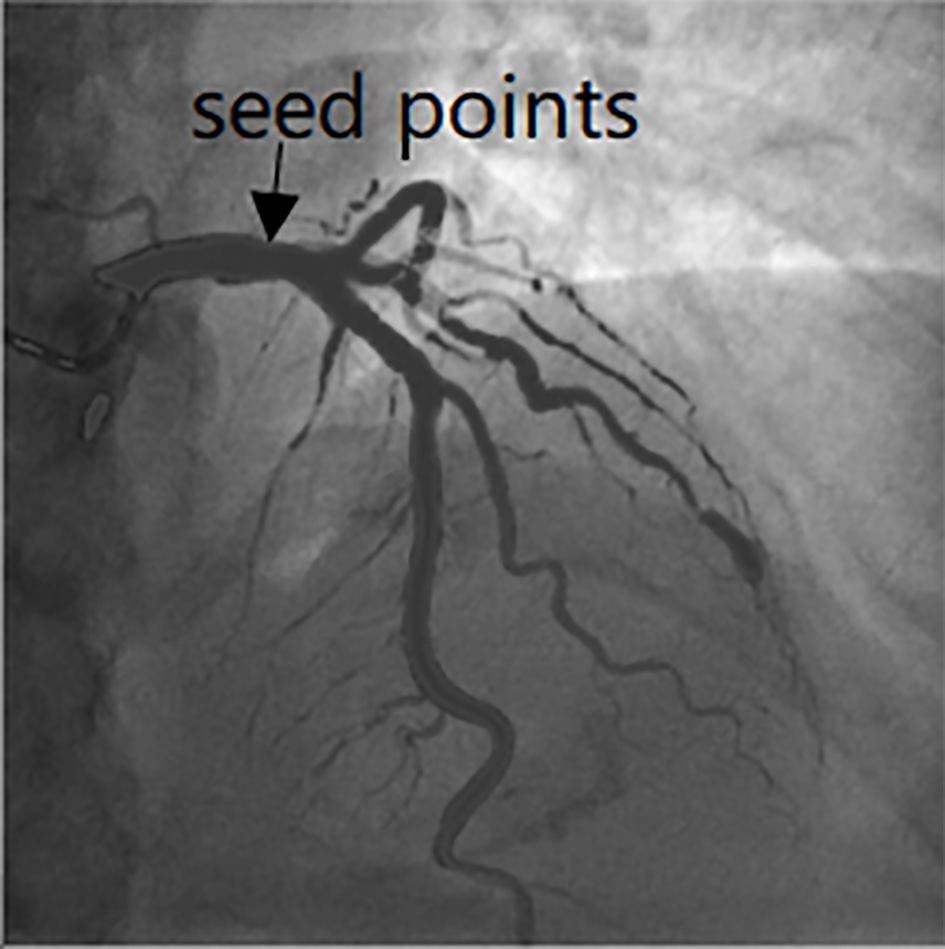
The pixel which is satisfies Eq. (3) is taken regarded as the initial seed points. Furthermore, we will select the seed points in the case of thin blood vessels. The eigenvector
Figure 1.
Seed points selection in the image.
2.2Segmentation of the coronary artery based on variable sector search region
The variable sector search region is constructed according to the seed point and its Hessian matrix eigenvector, which is the smaller one. The variable sector is composed of the initial sector region and the extending adjacent sector and bisection sector. The seed point is known to be
Figure 2.
Variable sector search region.
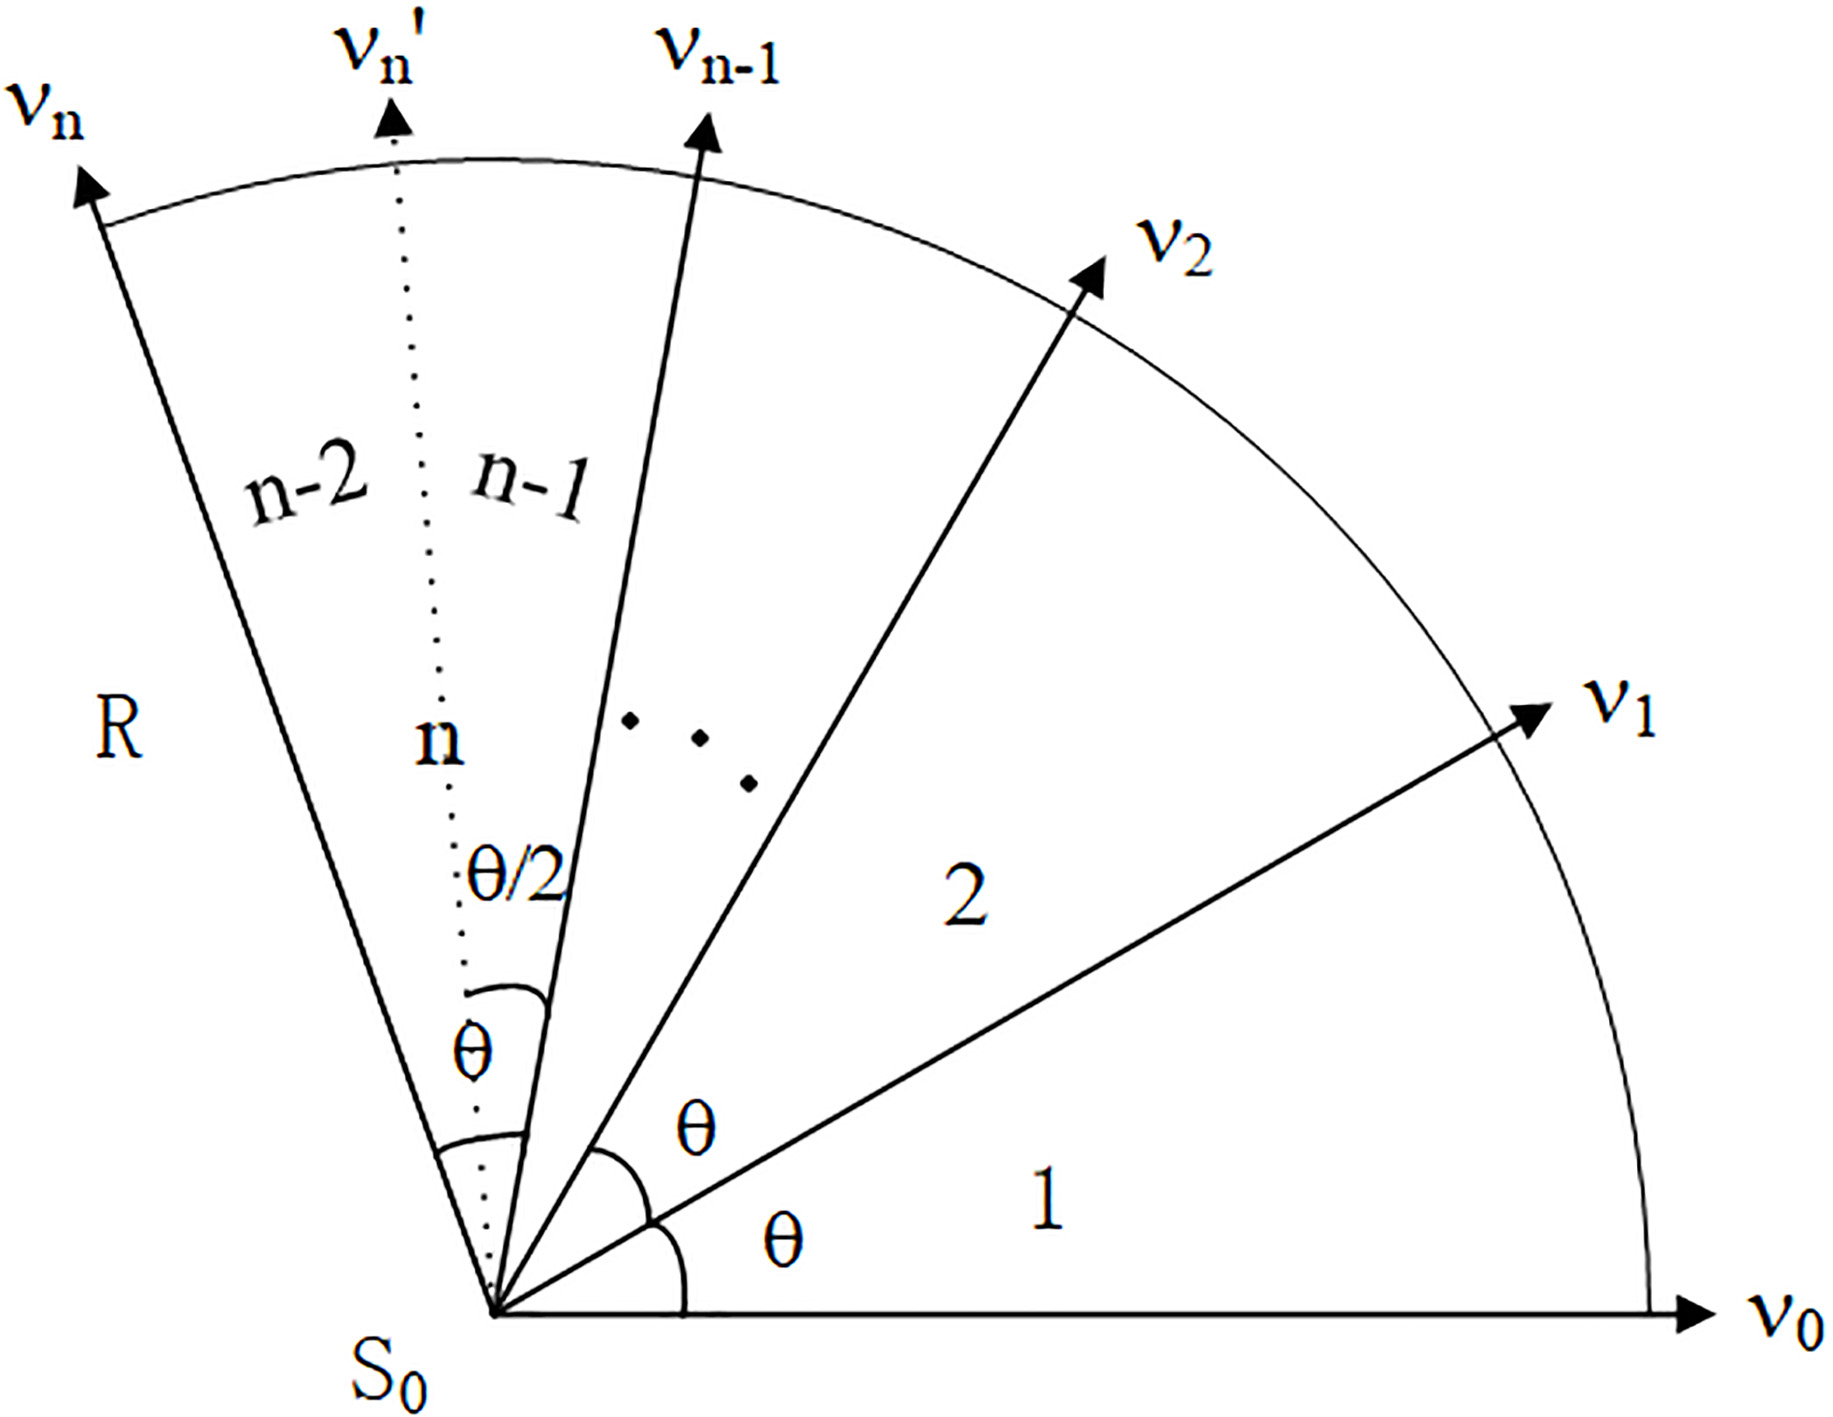
As shown in Fig. 2, the initial sector region 1 is a sector with a central point
The searching idea within a sector region is as follows:
Step 1. The sector region is constructed according to the seed point
(4)
Then, the pixel is added into the effective pixel set of the sector.
Step 2. Count the ratio of effective pixels to all the pixels in the sector area, do different processes according to the ratio.
(5)
If Eq. (5) is correct, it is determined that the effective pixel set is a selected pixel in the blood vessel and then added them into the selected pixel set. Continue to search for the same circumferential adjacent sector region with the same seed point as the central point.
(6)
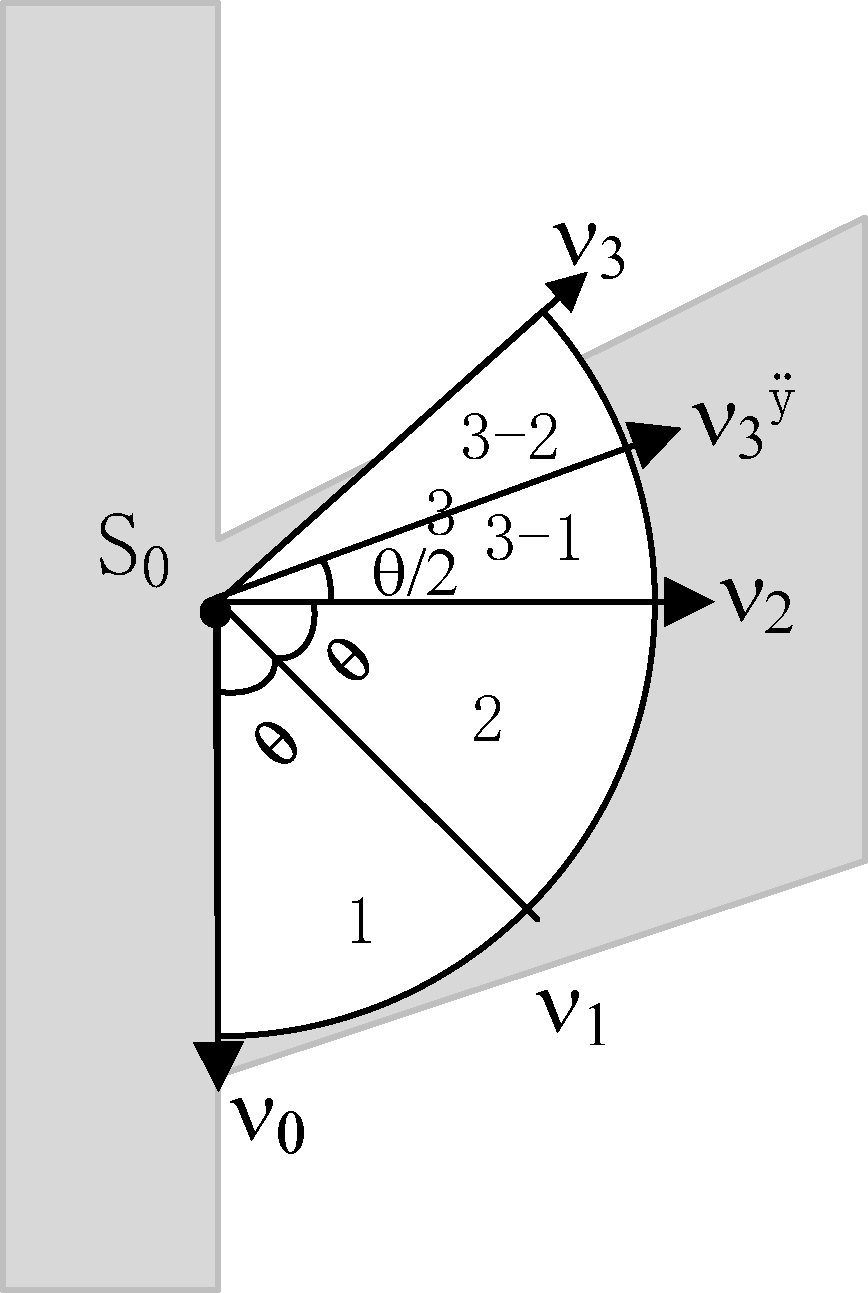
Figure 3.
Application example.
If Eq. (6) is correct, the effective pixels are not sure whether it can be merged into the selected pixel set. It generally indicates that the sector area already contains a large number of vascular walls or branches. At this point, the backtracking will be carried out. The current search area will be split into the bisection sector along the angular bisection line. Do the above process once again.
If the Eqs (5) and (6) is not satisfied, all these pixels are added to the invalid voxel set. End the search for this sector area.
The algorithm iterates over all seed points and effective pixels. All effective pixel sets founded are merged into intravascular pixel sets.
For example, as shown in Fig. 3, light gray shape is a Y-shaped blood vessel,
The advantage of this is that when the direction of the vessel cannot be accurately judged by the eigenvector alone, for example, the curvature of the blood vessel is large; the angle of the vessel branch is small, and the blood vessels overlap; the intravascular pixels can be accessed effectively according to the extended sector area.
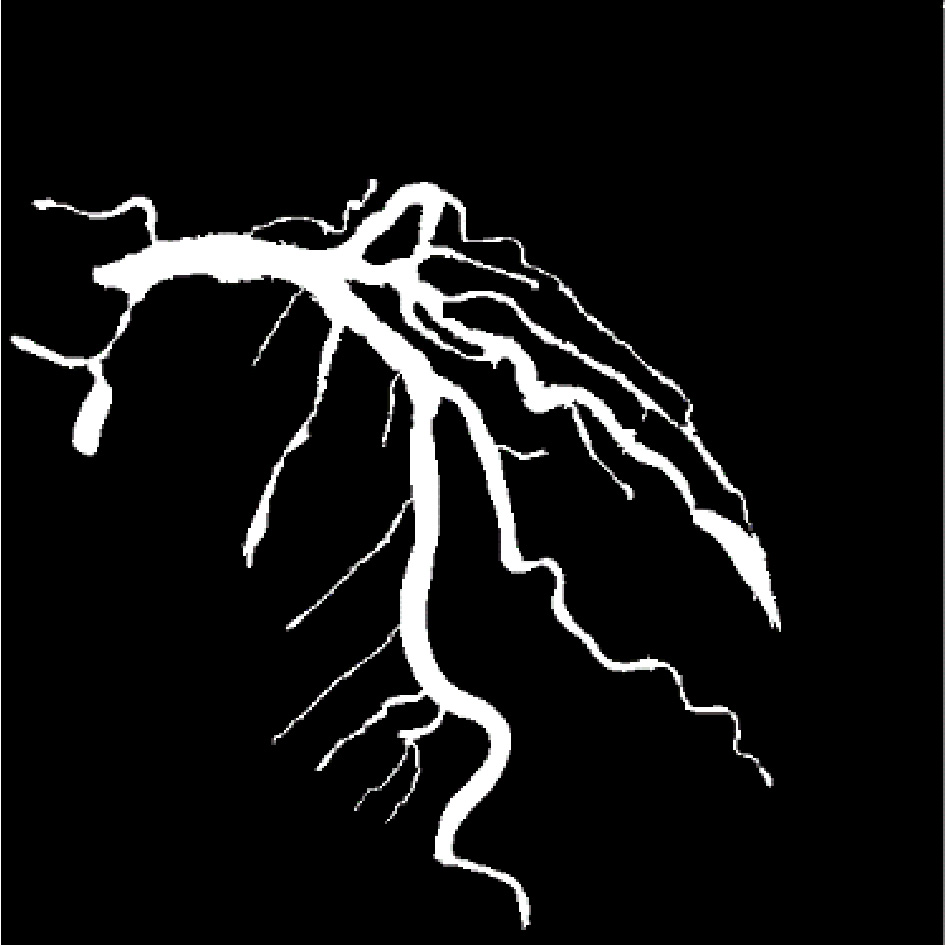
2.3Subsequent processing image
Since the seed points with large response function value may exist in the non-vascular structure according to the method in Ref [10], the result of segmentation is bound to have noise points. According to the connectivity of the blood vessels, the isolated regions are eliminated from the segmented results. The main idea of removing isolated points is to count the pixels in each connected region of the image. The largest connected area is preserved, which is taken regard as the final segmented vessel. The segmentation result can be seen in Fig. 4.
Figure 4.
The result of the segmentation.
3.Experimental result
The algorithm is simulated by MATLAB. The images obtained from six patients were selected. Each image has a size of 512
3.1Parameters setting
In Eq. (3),
In Eq. (4),
The initial angle of the variable sector
3.2Performance measures
To evaluate the segmentation results of our method quantitatively, the Dice Similarity Coefficient (DSC) and sensitivity metrics were used. The gold standard was outlined by extraction software and corrected manually.
DSC is a measure of overlap rate between the segmentation method (PV
(7)
where |
Sensitivity measures the portion of positive pixels in the gold standard that are also identified as positive by the segmentation being evaluated. It is given by:
(8)
TP is the number of true positive, i.e. correctly segmented pixels in the vessel whereas FN is the number of false negatives, i.e. incorrectly rejected pixels.
Figure 5.
The result of the segmentation. (a) Original image; (b) Ref [10] method; (c) Ref [12] method; (d) Proposed method.
![The result of the segmentation. (a) Original image; (b) Ref [10] method; (c) Ref [12] method; (d) Proposed method.](https://content.iospress.com:443/media/thc/2020/28-S1/thc-28-S1-thc209047/thc-28-thc209047-g005.jpg)
![The result of the segmentation. (a) Original image; (b) Ref [10] method; (c) Ref [12] method; (d) Proposed method.](https://content.iospress.com:443/media/thc/2020/28-S1/thc-28-S1-thc209047/thc-28-thc209047-g006.jpg)
3.3Result of segmentation
The segmentation results compared with the Ref [10] method and Ref [12] method are shown in Figs 5–7. Figures 5 and 7 show the segmentation of the left coronary artery, while Fig. 6 shows the segmentation of the right coronary artery.
Figure 7.
Result of the segmentation. (a) Original image; (b) Ref [10] method; (c) Ref [12] method; (d) Proposed method.
![Result of the segmentation. (a) Original image; (b) Ref [10] method; (c) Ref [12] method; (d) Proposed method.](https://content.iospress.com:443/media/thc/2020/28-S1/thc-28-S1-thc209047/thc-28-thc209047-g007.jpg)
Figure 8.
DSC ratio of the three methods.
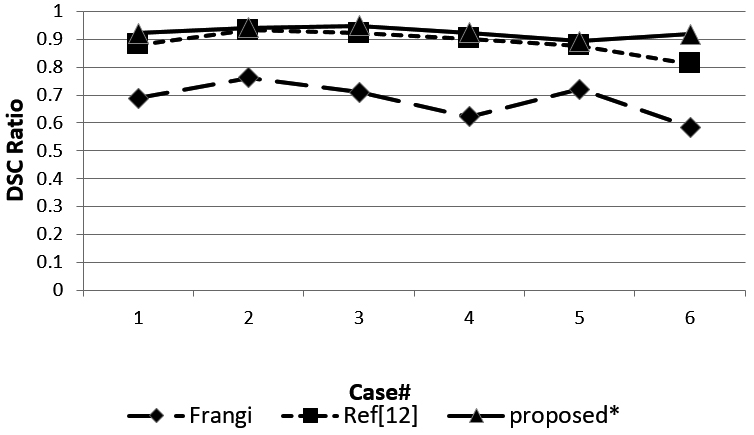
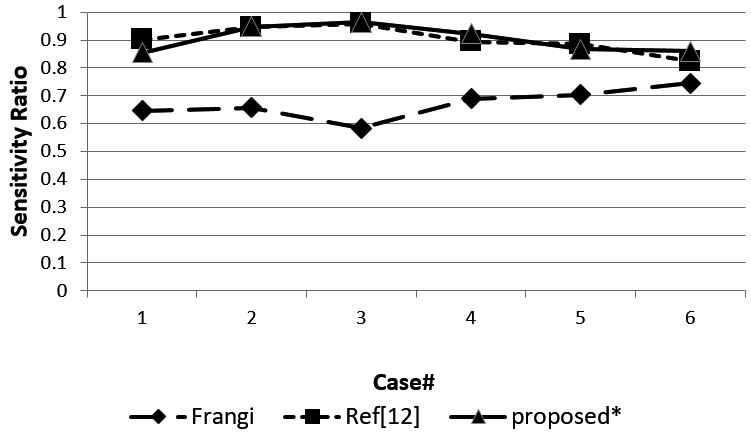
Figure 9.
Sensitivity of the three methods.
The advantage of our approach is that most of the coronary arteries are segmented, even some small branches. It can be seen obviously in Figs 5–7 that the Ref [10] method segmented the blood vessels incompletely, especially in the presence of stenosis and small blood vessels. As can be seen in Figs 5 and 6, our approach takes more branches than Ref [12] method. But in Fig. 5d, the result gets over-segmentation in circles when the intensity of the surrounding pixel is similar to that of the intravascular pixels, and the vascular structure is too complicated.
In Fig. 7, which the image is selected from Ref [12]. The circle in the image shows a stenosis in the vessel. Our proposed method and Ref [12] can reach distal parts located after the stenosis successful. The rectangle in the image shows the larger curvature of the blood vessel. Our methods can segment it successfully while Ref [12] gets over-segmentation. Our method is robust in dealing with a moderated stenosis and large curvature vessels.
Figure 8 shows the DSC ratio for the three methods. The DSC ratio of the method we proposed obtained a higher value than the Ref [12] and Ref [10] methods. Figure 9 shows sensitivity for the three methods. Most of the sensitivity values of our proposed method are higher than the other two methods, but case 1 and case 5 obtained a lower sensitivity value than Ref [12].
It can be seen from the experimental results that compared with Ref [10] and Ref [12] method, the proposed method can effectively extract coronary angiography images, and segment blood vessels in the area of vascular stenosis successfully.
4.Conclusion
In this paper, we have presented a coronary segmentation method based on region growing with variable sector search area. We get the seed points through Frangi vesselness function automatically, then design a growing rule combining both pixels vector and variable sector search area to segment the coronary artery successfully. The average DSC ratio is close to 0.9133 and the average sensitivity ratio is close to 0.9171. Further validation studies of stenoses detection and catheter removal will be carried out in the next phase of this work.
Acknowledgments
This research was supported by the National Natural Science Foundation of China (nos 61602101 and 61502091).
Conflict of interest
None to report.
References
[1] | Li Z, Zhang Y, Liu G, Shao H, Li W, Tang X. A robust coronary artery identification and centerline extraction method in angiographies. Biomed Signal Process Control. (2015) ; 16: : 1-8. doi: 10.1016/j.bspc.2014.09.015. |
[2] | Kirbas C, Quek F. A review of vessel extraction techniques and algorithms. J ACM Comput Surv. (2004) ; 36: (2): 81-121. doi: 10.1145/1031120.1031121. |
[3] | Lesage D, Angelini ED, Bloch I, Funkalea G. A review of 3d vessel lumen segmentation techniques: Models, features and extraction schemes. J Med Image Anal. (2009) ; 13: (6): 819-45. doi: 10.1016/j.media.2009.07.011. |
[4] | Moccia S, Momi DeE, Hadji ElS, Mattos LS. Blood vessel segmentation algorithms – Review of methods, datasets and evaluation metrics. Comput Meth Programs Biomed. (2018) ; 158: : 71-91. doi: 10.1016/j.cmpb.2018.02.001. |
[5] | Zhang K, Zhan L, Lam KM, Zhang D. A level set approach to image segmentation with intensity inhomogeneity, IEEE T Cybern. (2017) ; 46: (2): 546-57. doi: 10.1007/s11042-018-6154-7. |
[6] | Zeng Y, Liao S, Tang P, Zhao Y, Liao M, Chen Y, et al. Automatic liver vessel segmentation using 3D region growing and hybrid active contour model. Comput Biol Med Oxford. (2018) ; 7: : 63-73. doi: 10.1016/j.compbiomed.2018.04.014. |
[7] | Zhao B, Cao Z, Wang S. Lung vessel segmentation based on random forests. J Electronics Letters. (2017) ; 53: (4): 220-2. doi: 10.1049/el.2016.4438. |
[8] | Mabrouk S, Oueslati C, Ghorbel F. Multiscale graph cuts based method for coronary artery segmentation in angiograms. J Irbm (2017) ; 38: : 167-75. doi: 10.1016/j.irbm.2017.04.004. |
[9] | Zhao F, Chen Y, Hou, Y, He X. Segmentation of blood vessels using rule-based and machine learning based methods: a review. Multimedia Systems. (2017) ; 25: (2): 109-18. doi: 10.1007/s00530-017-0580-7. |
[10] | Frangi AF, Niessen WJ, Vincken KL, Viergever MA. Multiscale vessel enhancement filtering. In: Wells WM, Colchester A, Delp S, editors. Proceeding of the 1th International Conference on Medical Image Computing and Computer Assisted Intervention; MA, US: Cambridge; (1998) . pp. 130-7. doi: 10.1007/BFb0056195. |
[11] | Li Y, Zhou S, Wu J, Ma X, Peng K. A Novel Method of Vessel Segmentation for X-ray Coronary Angiography Images, Proceeding of the 4th International Conference on Computational & Information Sciences; Chongqing, China; (2012) . pp. 468-71. doi: 10.1109/ICCIS.2012.34. |
[12] | Kerkeni A, Benabdalla A, Manzanera A, Mohamed HB. A coronary artery segmentation method based on multiscale analysis and region growing. J Comput Med Imag Grap. (2016) ; 48: : 49-61. doi: 10.1016/j.compmedimag.2015.12.004. |


