
Development of an fMRI-compatible driving simulator with simultaneous measurement of physiological and kinematic signals: The multi-biosignal measurement system for driving (MMSD)
Abstract
BACKGROUND:
A system that comprehensively analyzes a complex perceptual-motor behavior such as driving, by measuring changes in the central and autonomic nervous systems integrated with measurement of changes in vehicle operation, is lacking.
OBJECTIVE:
We aimed to develop a functional magnetic resonance imaging (fMRI)-compatible driving simulator to enable simultaneous measurement of physiological, kinematic, and brain activations.
METHODS:
The system mainly comprises a driving simulator and physiological/kinematic measurement. The driving simulator comprises a steering wheel, an accelerator, a brake pedal, and a virtual-reality optical system. The physiological system comprises a skin-conductance-level and a photoplethysmographic meter. The kinematic system comprises a 3-axis accelerometer and a 2-axis gyroscope attached to the accelerator foot. To evaluate the influence of the MR system on the MMSD, physiological and kinematic signals were measured.
RESULTS:
The system did not blur or deform the MR image. Moreover, the main magnetic field, the gradient magnetic field, and the RF pulse of the MR system did not introduce noise into the physiological or kinematic signals.
CONCLUSION:
This system can enable a comprehensive evaluation of cognitively complex behaviors such as driving, by quantitatively measuring and analyzing concurrent brain activity, autonomic nervous system activity, and human movement during simulated driving.
1.Introduction
Various studies related to driving that employ driving simulators have recently been published, indicating great interest in this field [1, 2, 3, 4, 5, 6, 7, 8]. Driving simulators are virtual reality devices that have a steering wheel, accelerator, and brake pedal similar to actual vehicles, and can show diverse and changing road situations to give the participant a sense of actual driving. Experiments using driving simulators have the advantages of experiment control, convenient data collection, and high safety compared with actual on-road driving [9]. Due to these merits, driving simulators have enabled studies on driving in dangerous situations and on people who have difficulty with actual driving. Thus, studies evaluating driving skills in situations of distraction [4, 10], drinking [11, 12, 13], lack of sleep [7, 14], heavy traffic [15], and driver impairment due to advanced age [16], or brain damage [17] have become possible.
Driving is a complex process that requires systematic perceptual-motor behavior, in which the driving environment is sensed by recognition, awareness, learning, and memory, and decisions are made and acted upon [18]. Therefore, to permit adequate quantitative observation of a complex perceptual-motor behavior such as driving, various biosignals such as central or autonomic nervous system reactions and human body movements must be measured and analyzed. For this purpose, various attempts have been made to measure these signals in a driving-simulator environment as outlined below.
First, there have been attempts to measure and analyze the central nervous system and brain activity when participants drive in a simulation. These studies rely on functional magnetic resonance imaging (fMRI). In early studies, brain activity was observed during simple driving using a controller that could replace a driving device in an MR environment such as joysticks due to the restrictions of the magnetic-resonance (MR) environment (i.e., strong magnetic fields and limited space) [19]. However, Kan et al. recently developed an MR-compatible driving simulator that has a steering wheel, an accelerator pedal, and a brake pedal. By observing active brain activity in the primary motor cortex, cerebellum, visual cortex, and parietal lobe while driving in simulation, the related brain activity could be measured [18].
In addition, studies measuring autonomic nervous system reactions and driving behavior in simulation are currently underway. Studies have observed autonomic nervous-system variables that change during driving, such as skin conductance level (SCL) and photoplethysmographic (PPG) readouts of heart activity, via sensors attached to the hands or wrists [20, 21]. Moreover, ultra-high speed cameras and inertial measurement units (IMUs; i.e., sensors) are now available to extract variables related to human body movement while driving, measure the manipulation angle and acceleration of steering wheels, and measure the variability of accelerator- and brake-pedal [22, 23].
Similarly, several technologies that can measure various individual driving-related biosignals in a simulator environment have been developed. However, system development to comprehensively analyze a complex perceptual-motor behavior such as driving, by measuring changes in the central and autonomic nervous systems integrated with measurement of changes in vehicle operation, is lacking. In this study, we developed an fMRI-compatible driving simulator, which is a multi-biosignal measurement system for driving (MMSD) that can be used to concurrently measure autonomic nervous system reactions, human body movements, and patterns of brain activity, by strict shielding of components for minimization of interference from the electromagnetism produced in an MR environment. In addition, the feasibility of the system is evaluated through testing. This system succeeded in extracting information on autonomic nervous-system reactions from SCL and PPG signals, and human-body movement information from acceleration and angular velocity signals, parallel with fMRI brain-activity patterns that occur while driving.
2.Development of a multi-biosignal measurement system for driving (MMSD)
2.1Overall structure of the MMSD
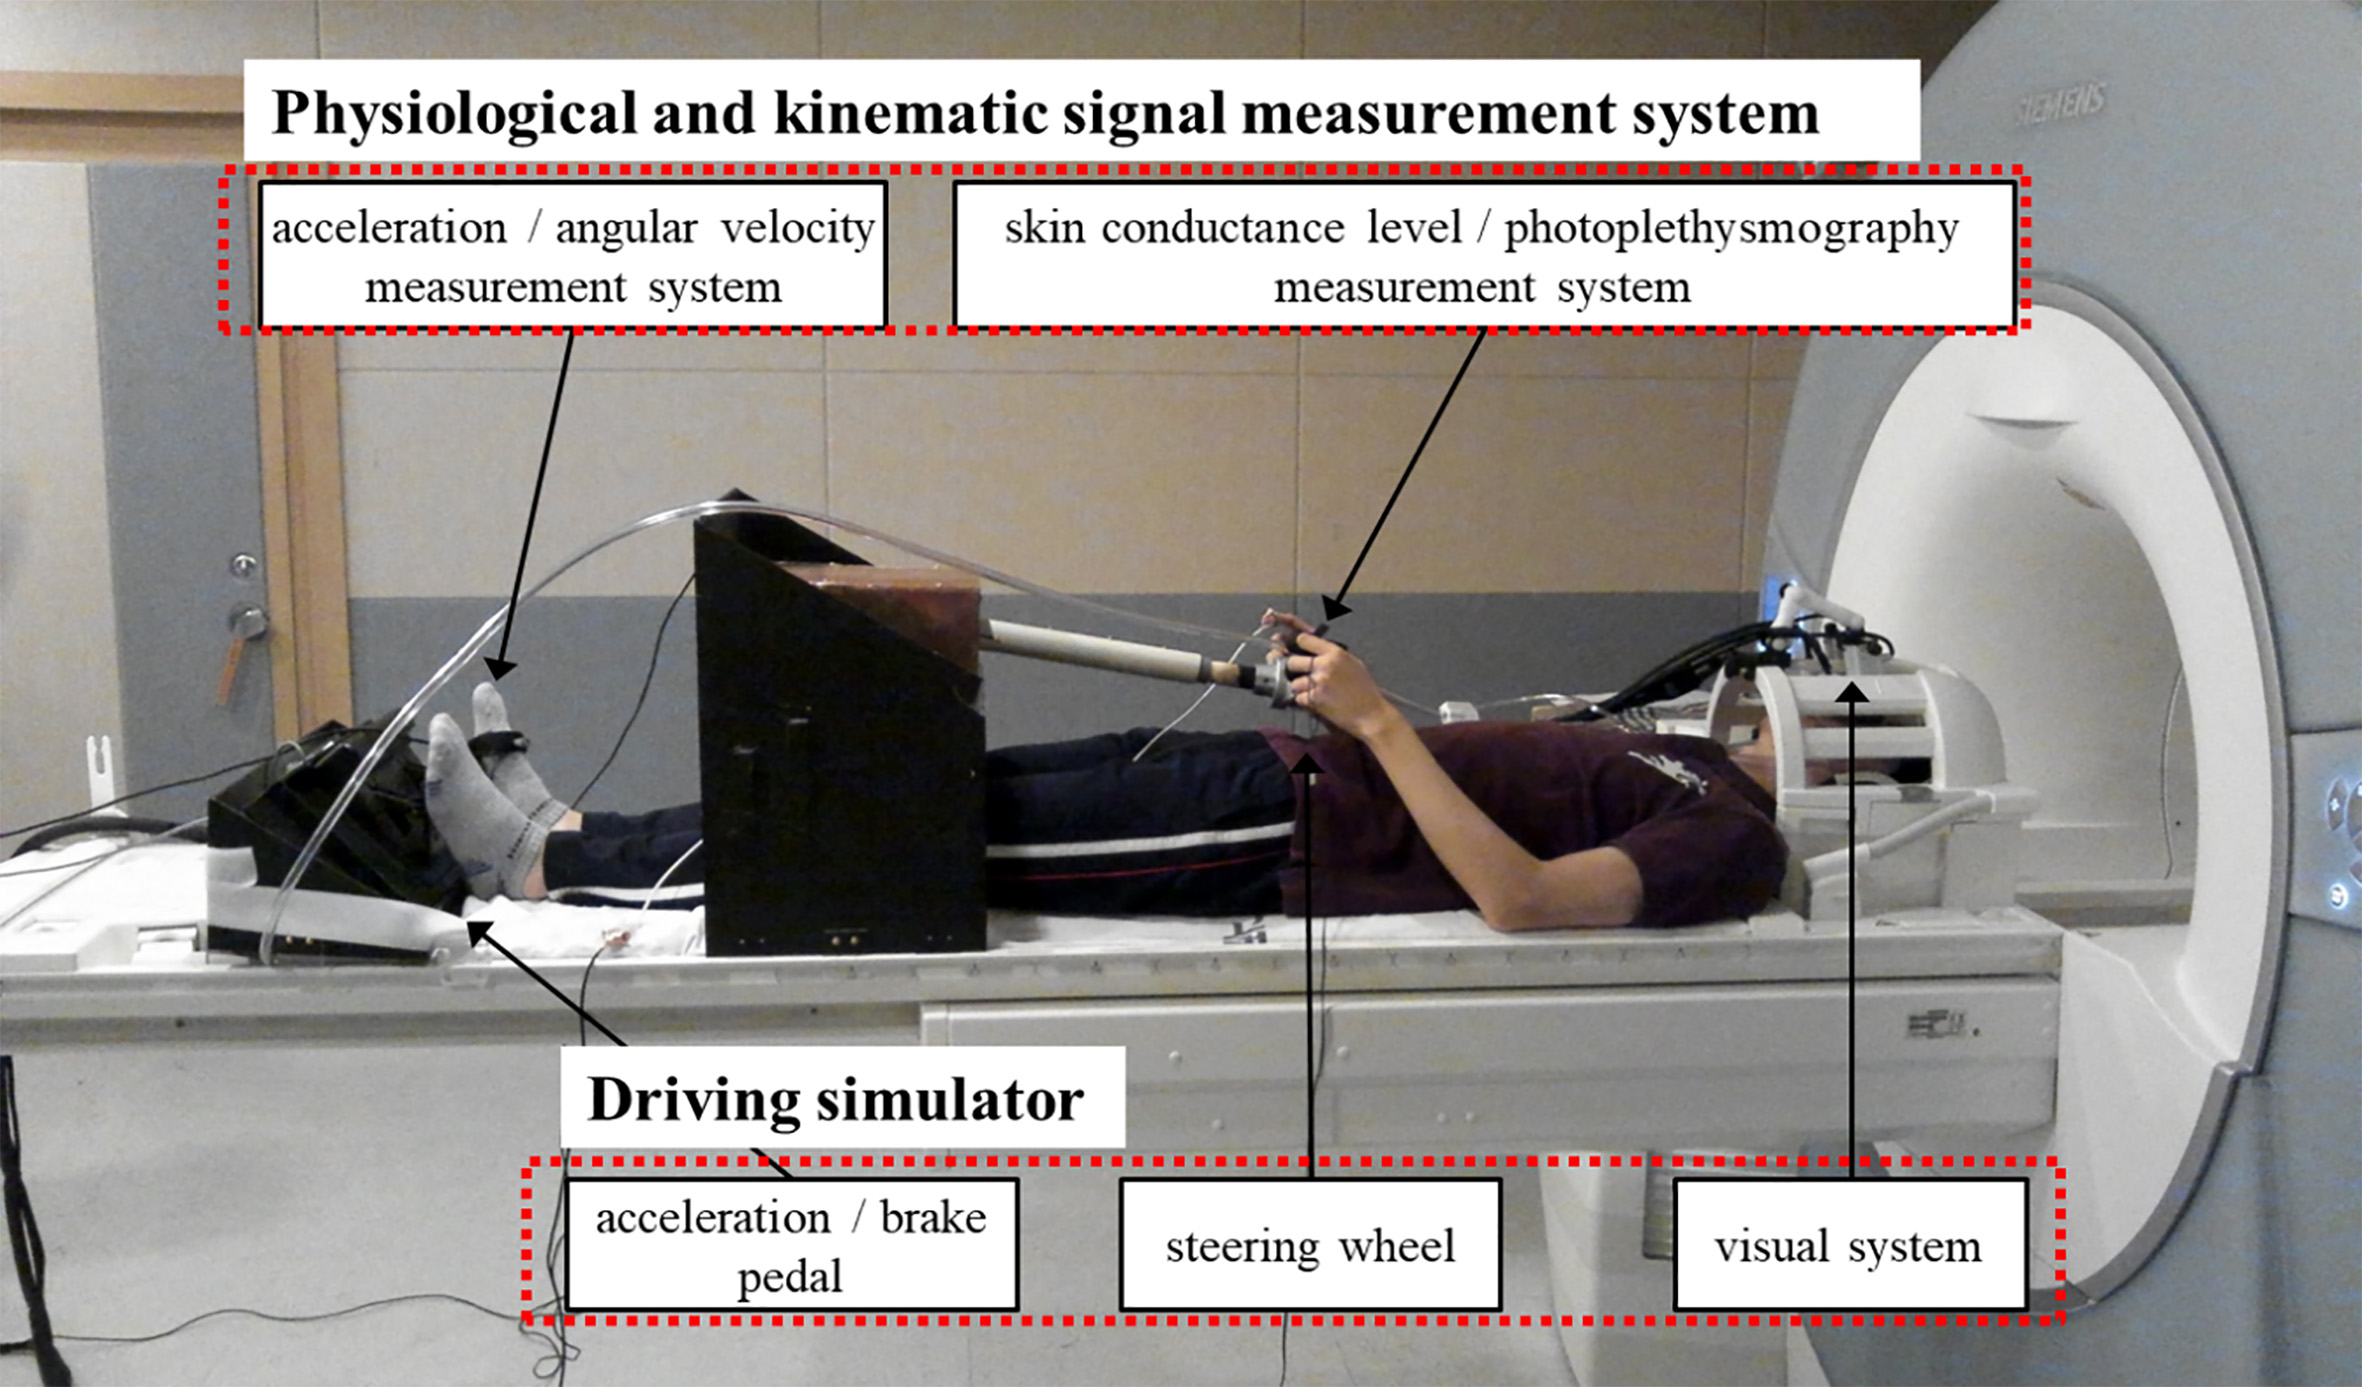
The MMSD system is shown in Fig. 1. The MMSD is largely composed of a driving simulator part and measurement systems for physiological and kinematic signals. The driving simulator is composed of a steering wheel, an accelerator, a brake pedal, and a visual system providing driving images. The steering wheel length and height and pedal position can be adjusted to compensate for differences in the subject’s height. The emergency button was placed on the subject’s stomach to inform the operator when a dangerous situation occurred during the experiment. The physiological measurement system is composed of measurement devices for skin conductance level (SCL) and photoplethysmographic (PPG; heart rate) signals, attached to the hands. The kinematic measurement system is composed of a 3-axis accelerometer and a 2-axis gyroscope attached to the accelerator foot, for measuring acceleration and angular velocity. The output signals of all systems are transmitted through the optical fiber to the main controller and the PC in the operation room and can be recorded. The specific components of each system are described in the following sections.
Figure 1.
Overall structure of the multi-biosignal measurement system for driving.
2.2Driving simulator
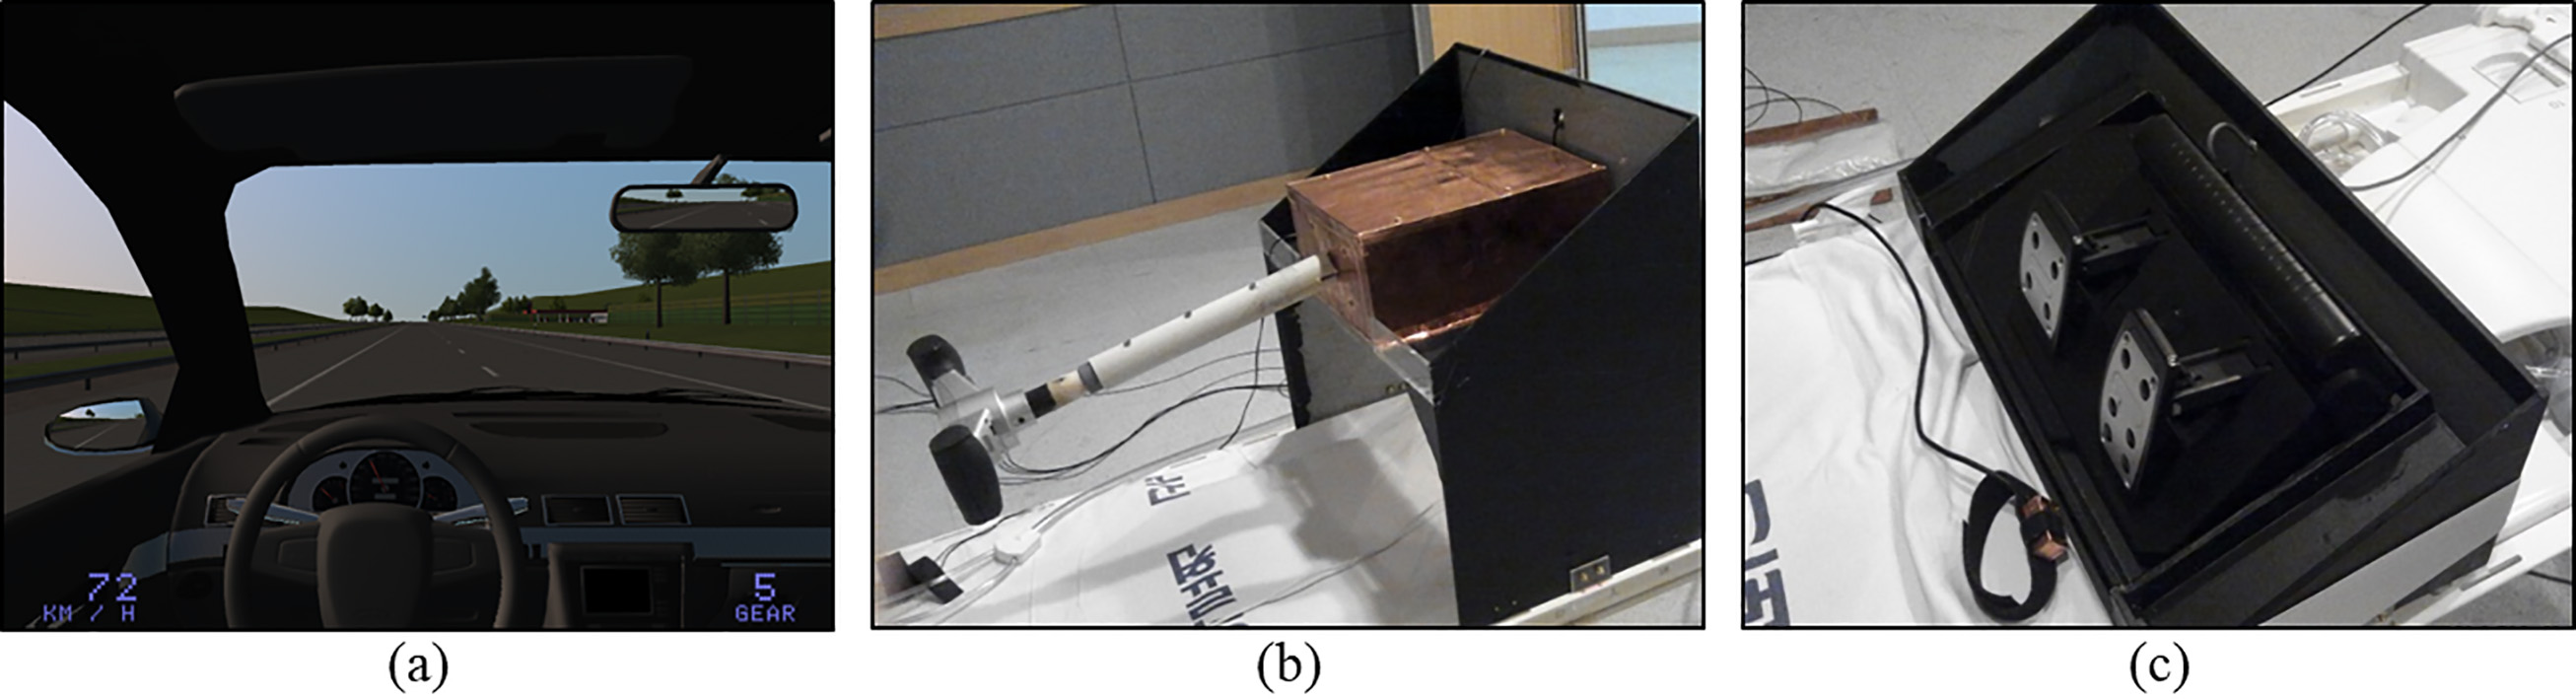
The driving simulator is composed of a steering wheel, an accelerator, a brake pedal, and a visual system running a software application used in driving games (Driving simulator 2011 ver. 1.46, Astragon Software, Mönchengladbach, Germany). This system can simulate both city driving and highway driving conditions. Various parameters, including amount of traffic, weather, and time zone, can be controlled during simulation (Fig. 2a). The participants could adjust steering wheel gradient and length for subjective comfort despite variable individual physical features, and it was manufactured in a size that allowed it to be manipulated even inside the MR bore (Fig. 2b). The steering angle was restricted to
Figure 2.
Driving simulator components. (a) Virtual-reality image generated by game software, (b) steering wheel, and (c) acceleration and brake pedals.
Driving images were provided through a separate display by attaching the visual system (NordicNeuroLab Corp., Bergen, Norway), which can be used in an MR environment, to the head coil (Fig. 1). In addition to visual display, this system can measure eye gaze by using its integrated eye tracking camera in the visual system. The image is adjustable to the preferences and eyesight of the participant by adjusting the angle of view, pupil distance, and diopter.
2.3Physiological and kinematic signal measurement system
The physiological and kinematic signal-measurement system is composed of sensors, modulator circuits that amplify measured signals and modulate them onto an optical carrier, optical cable that transmits the optical signals outside the MR room, and demodulator circuits that convert the optical signals back into electrical signals at the far end. Each sensor is connected to an independent modulator, optical cable, and demodulator (Fig. 3).
Figure 3.
Components of the physiological and kinematic signal measurement systems. (a) Skin conductance level system, (b) photoplethysmographic (PPG) system, and (c) 3-axis accelerometer plus 2-axis gyroscope. Sensors, modulators, optical cables, and demodulators are common to all.
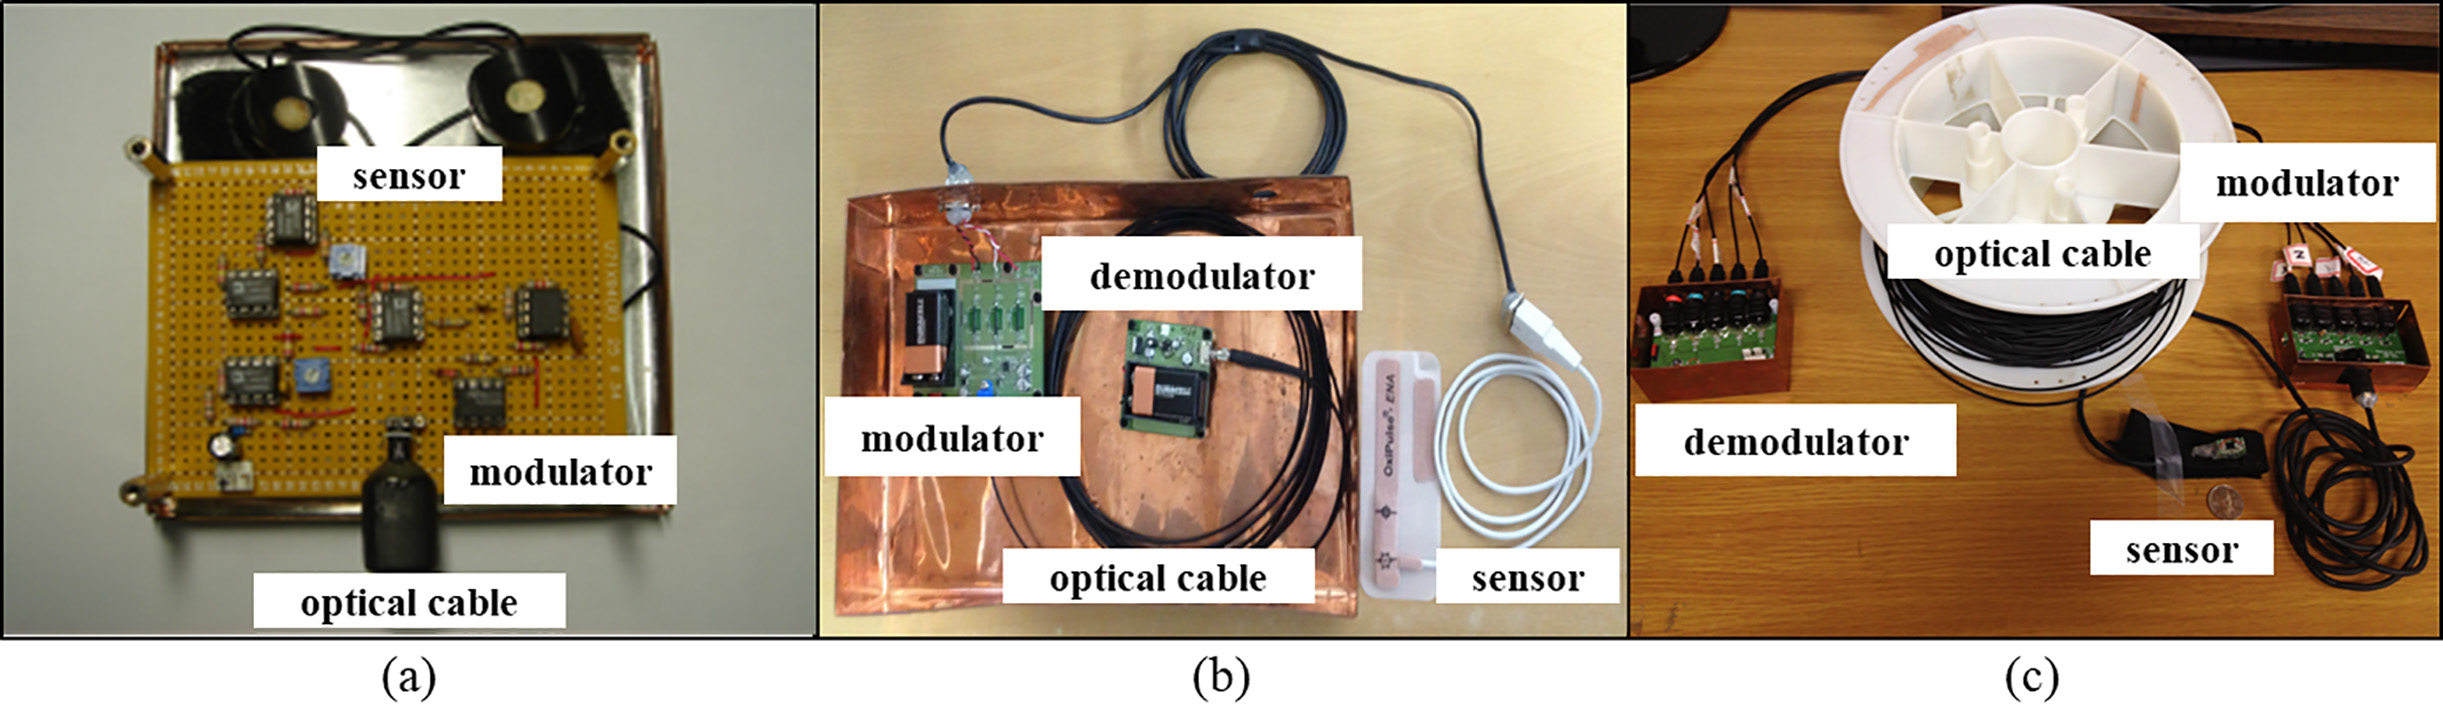
The physiological signal measuring sensor is composed of SCL (Fig. 3a) and PPG (Fig. 3b) sensors that are used to measure autonomic nervous system reactions in various driving situations. SCL and PPG signals were measured from changes in skin conductivity and differences in light absorption, respectively, through sensors attached to the fingers of the participant. SCL sensors (AD Instruments, New Zealand) and PPG sensors (Oxipulse-ENA, Hurev co., Korea) were built in band form to minimize the noise that can be caused by movement during the measurements.
The kinematic signal-measuring sensor is composed of a 3-axis acceleration sensor (MMA7260Q, Freescale Semiconductor, USA) and a 2-axis gyrosensor (IDG-650, InvenSense Inc., USA) (Fig. 3c). Anterior-posterior, medio-lateral, and vertical accelerations can be measured by the 3-axis acceleration sensor, and sagittal and frontal plane angular velocities can be measured by the 2-axis gyrosensor. The sensor module was fixed to the hand or foot of the participant in preparation for measurements using a hook-and-loop fabric fastener (popularly known by the trademark “Velcro”). The sensor module was compact, measuring 10
The modulator circuit was designed to amplify measured signals and modulate them onto an optical carrier wave. By combining the data in a comparator with triangular waves of frequency 10 kHz, higher than the measured frequency band, the measured signal is converted to pulse-width modulated (PWM) form. This signal is then changed into an optical signal by using it to switch a high-intensity light emitting diode (LED) and the optical signal is transmitted outside the MR room using an optical cable. The demodulator circuit detects the optical signal transmitted from the MR room with a phototransistor and demodulates it with a low-pass filter. The reverted signal is transmitted to the PC after analog-to-digital conversion (ADC) through a data acquisition board (DAQPad-6015, National Instruments, USA) and the measured signals are displayed or saved using Labview (version 7.1) and Matlab (version 7.3). Batteries were used as the power supply device. The batteries were isolated more than 3 m from the system because mutual interference with the MR magnet is substantial when the batteries are located inside the system. In addition, all components of the circuits located in the MR room were nonmagnetic to minimize interaction with the MR system. A shielding case was used to protect the circuits, and noise that can be generated by data transmission/reception through the optical cable was minimized.
3.System evaluation
3.1Effects of MMSD on MR image
Phantom images and actual human-brain images were obtained to investigate the influence of MMSD on MR images. Phantom images were obtained under two conditions: MMSD not installed (“without MMSD”) and MMS installed (“with MMSD”). Echo planar images were recorded with a 3.0-Tesla MR system (Siemens Magnetom TrioTim Syngo MR B17) with the following image parameters: repetition time/echo time (TR/TE)
Human brain images were also obtained using equivalent image parameters. MR images were obtained from one participant under three conditions: MMSD not installed (“without MMSD”), MMSD installed (“with MMSD”), and during actual simulated driving (“with MMSD
Figure 4.
Experimental protocol to evaluate the effects of the magnetic resonance system on the physiological and kinematic signals recorded from the multi-biosignal measurement system for driving. (a) Kinematic analysis interval, and (b) physiological analysis interval.
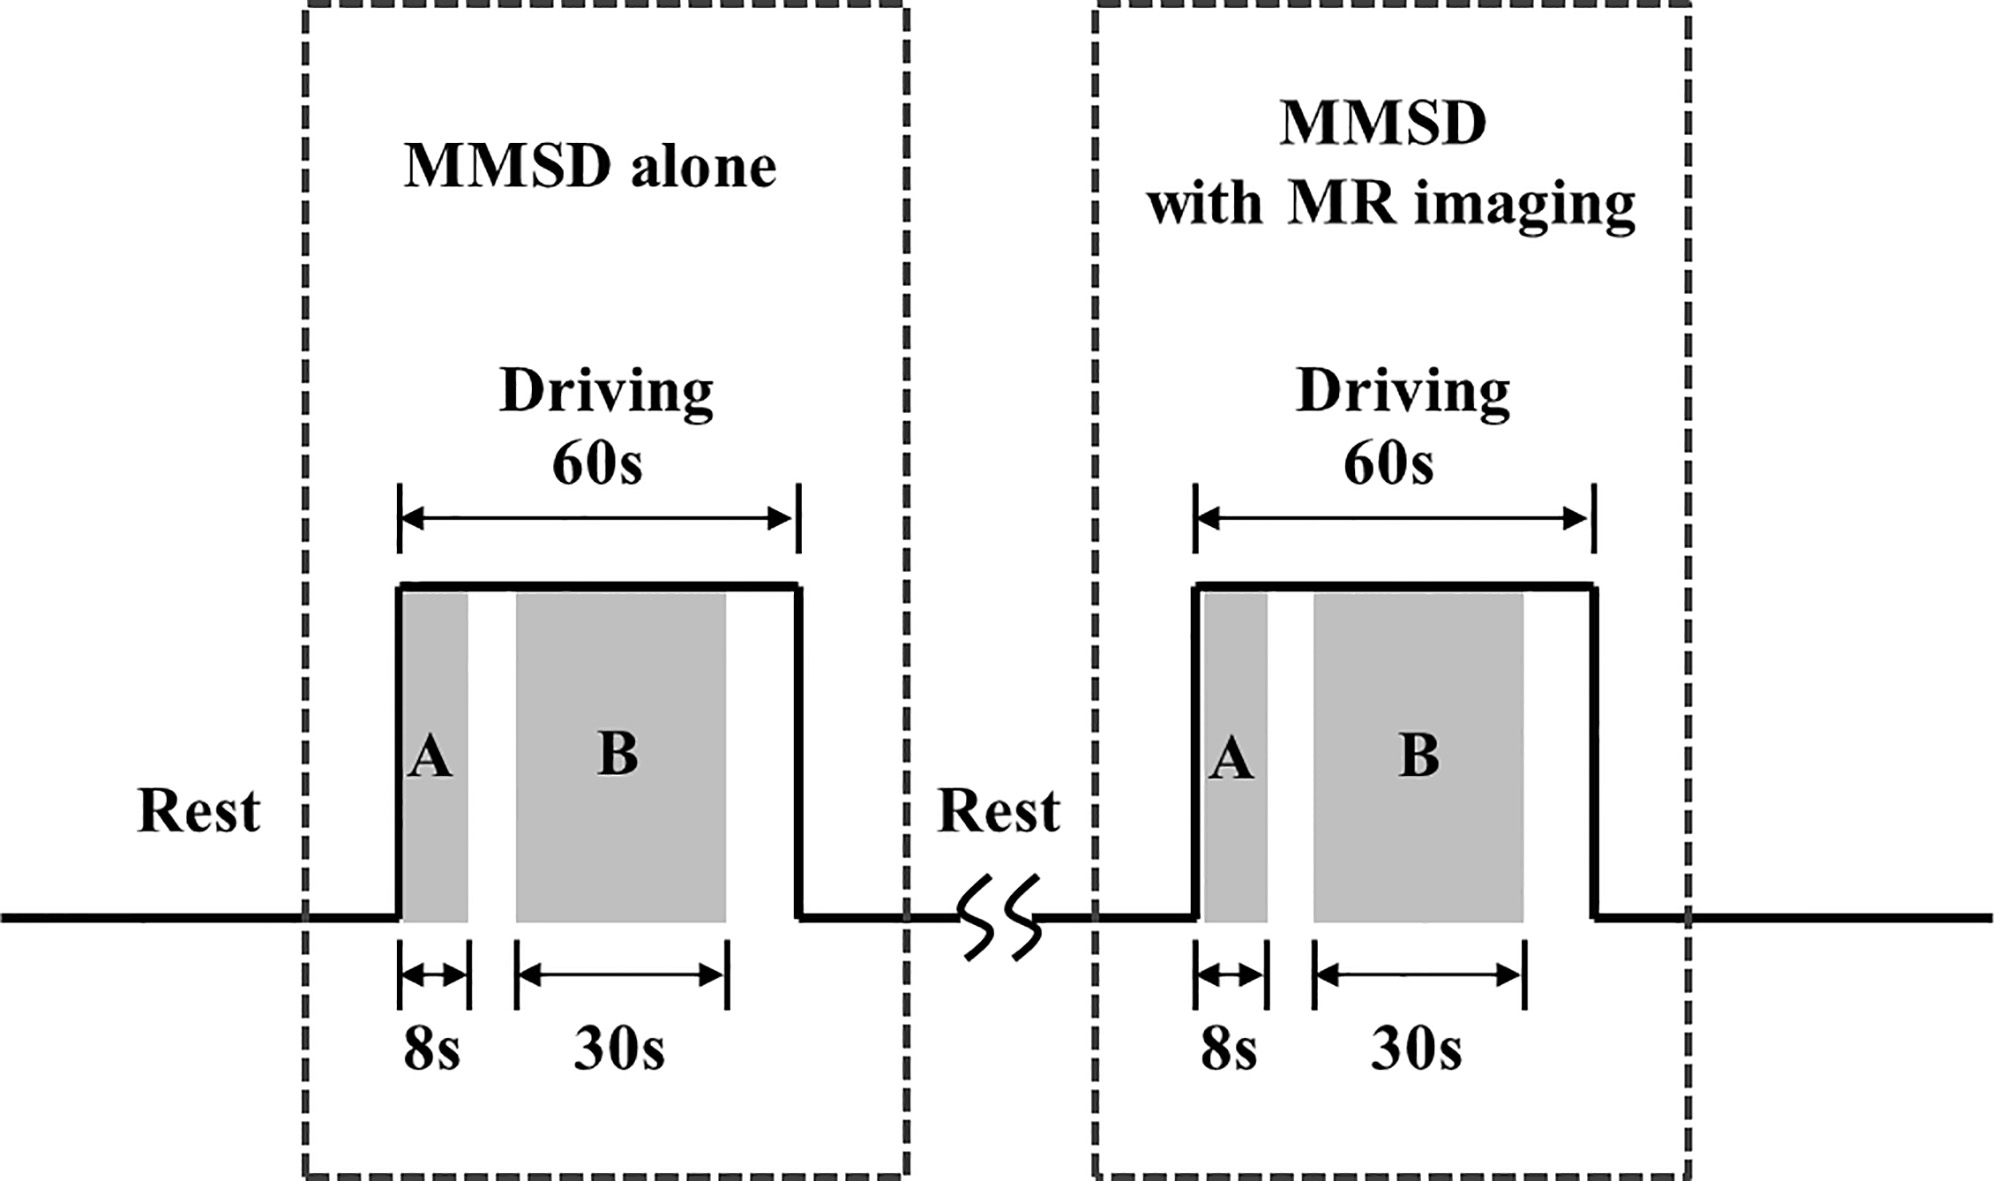
Figure 5.
Intensity of phantom image at cut views A and B.
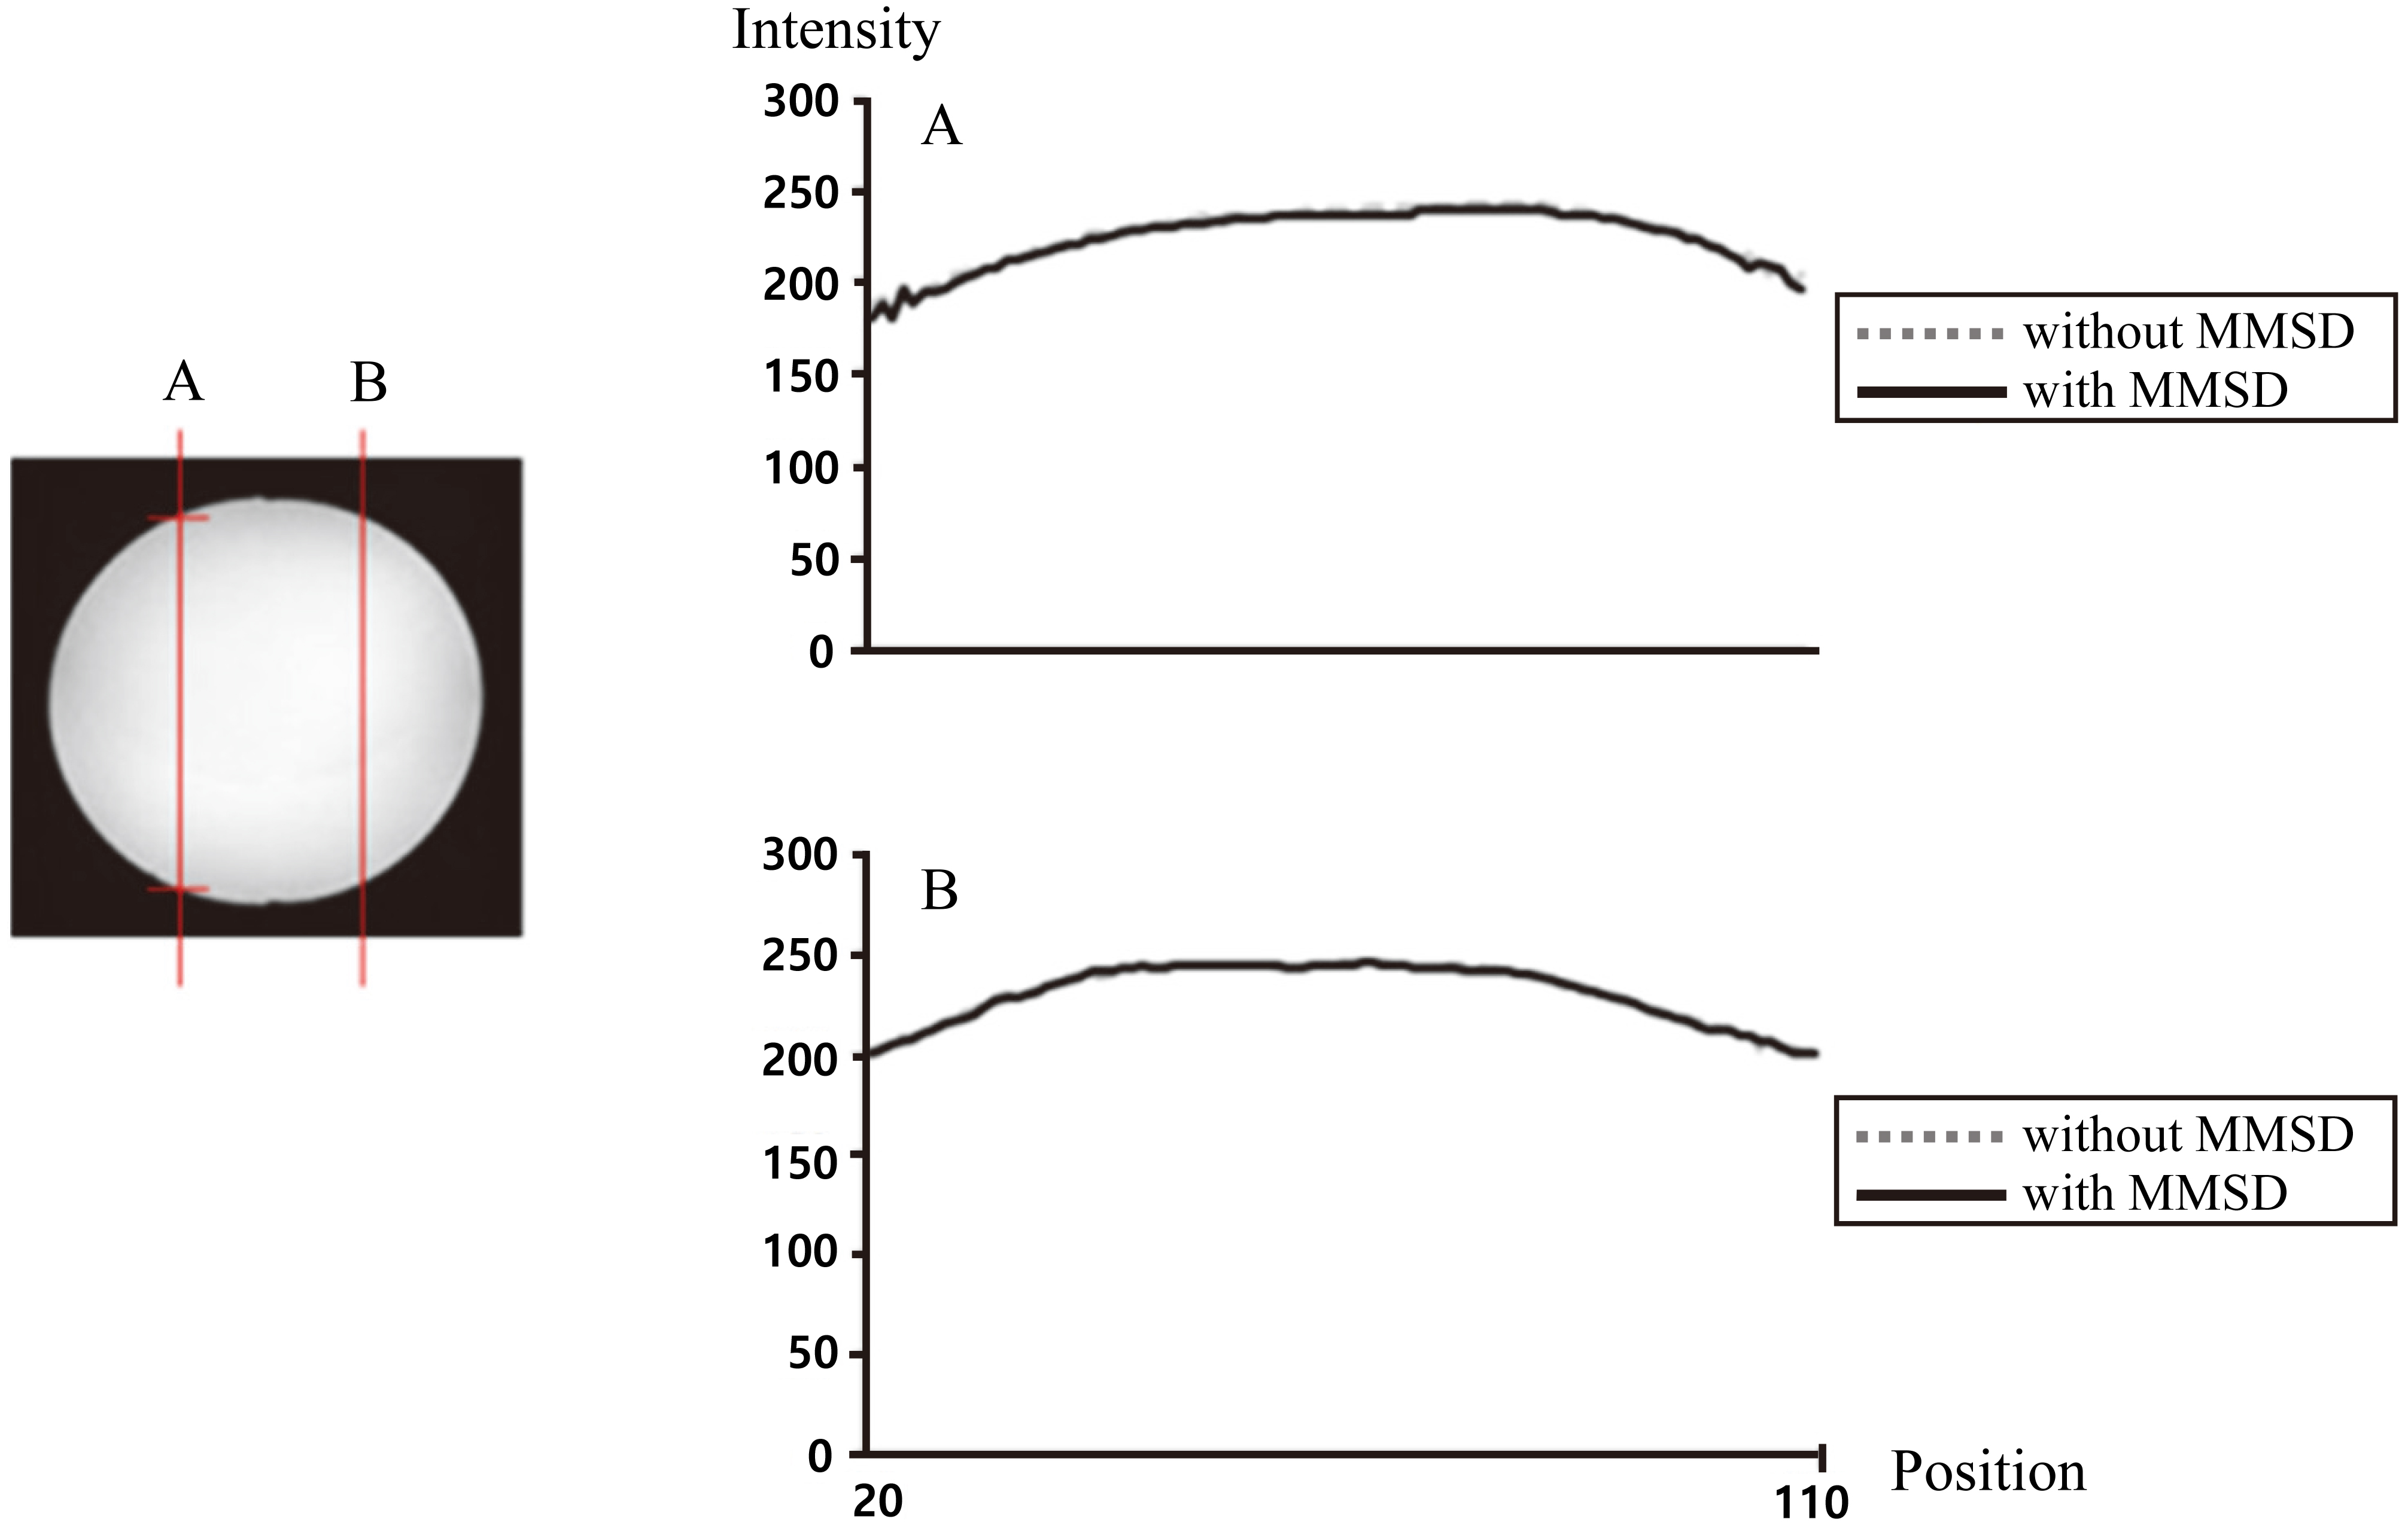
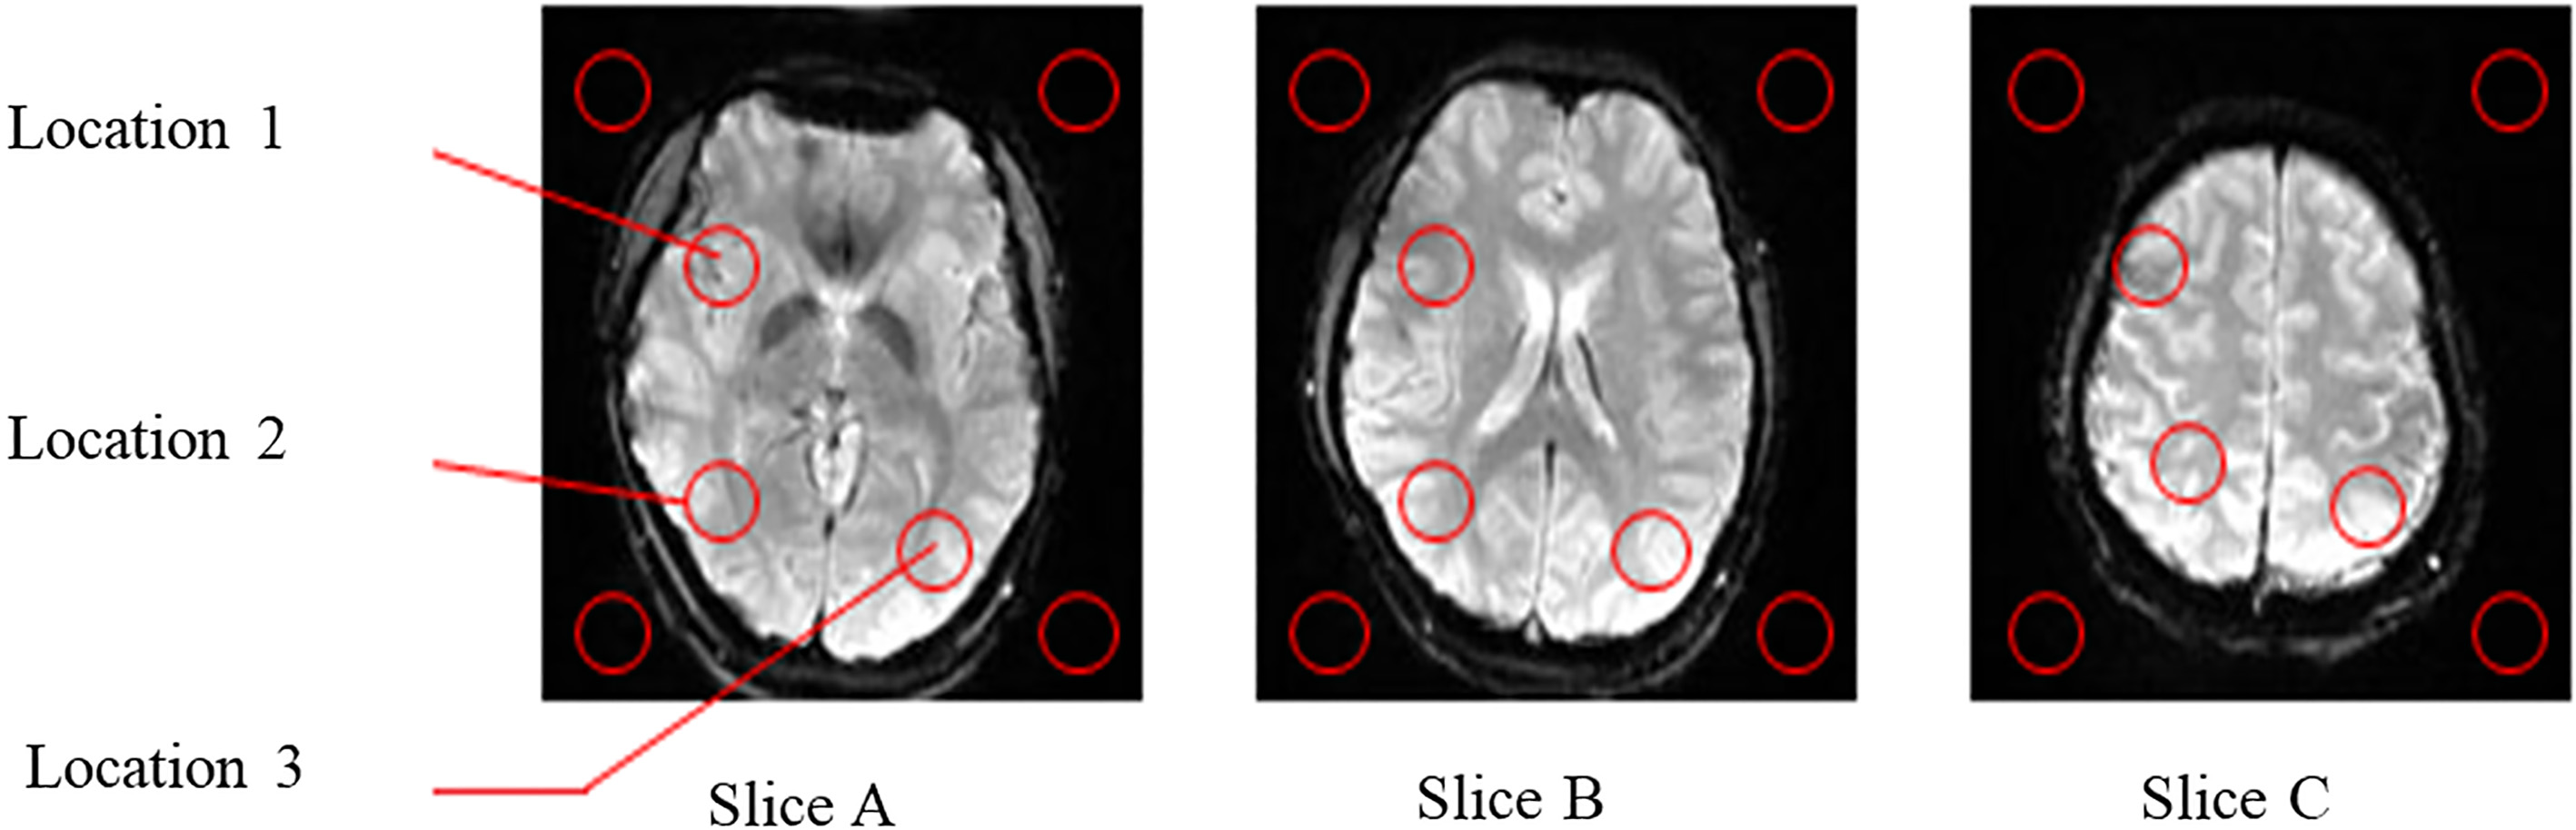
Figure 6.
MR brain images of slices A, B, and C.
3.2Effects of MRI on physiological and kinematic signals recorded by the MMSD
Tests were performed on one participant to investigate the influence of the MR system on the physiological and kinematic signal measurement systems of the MMSD. As shown in Fig. 4, an MMSD-alone session, where physiological and kinematic signals were measured without MR imaging (setup of Fig. 1), was followed by an MMSD
Table 1
Signal-to-noise ratio (SNR) of MR brain images with STD. Shown are three cases (i.e., without MMSD, with MMSD, and with MMSD
| Slice A | Slice B | Slice C | ||||||||||
|---|---|---|---|---|---|---|---|---|---|---|---|---|
| L1 | L2 | L3 | Avg. | L1 | L2 | L3 | Avg. | L1 | L2 | L3 | Avg. | |
| Without MMSD | 145.1 | 165.0 | 188.4 | 166.2 | 151.0 | 192.6 | 168.4 | 170.7 | 187.6 | 197.4 | 225.0 | 203.3 |
| With MMSD | 150.8 | 164.0 | 202.8 | 172.5 | 150.7 | 190.5 | 165.5 | 169.9 | 188.0 | 187.8 | 217.7 | 197.8 |
| With MMSD | 152.7 | 164.0 | 200.3 | 172.3 | 152.0 | 191.3 | 165.0 | 169.4 | 188.7 | 183.5 | 218.6 | 196.9 |
| driving | ||||||||||||
Figure 7.
The skin conductance level signal in microvolts, measured with MMSD-alone and with MMSD
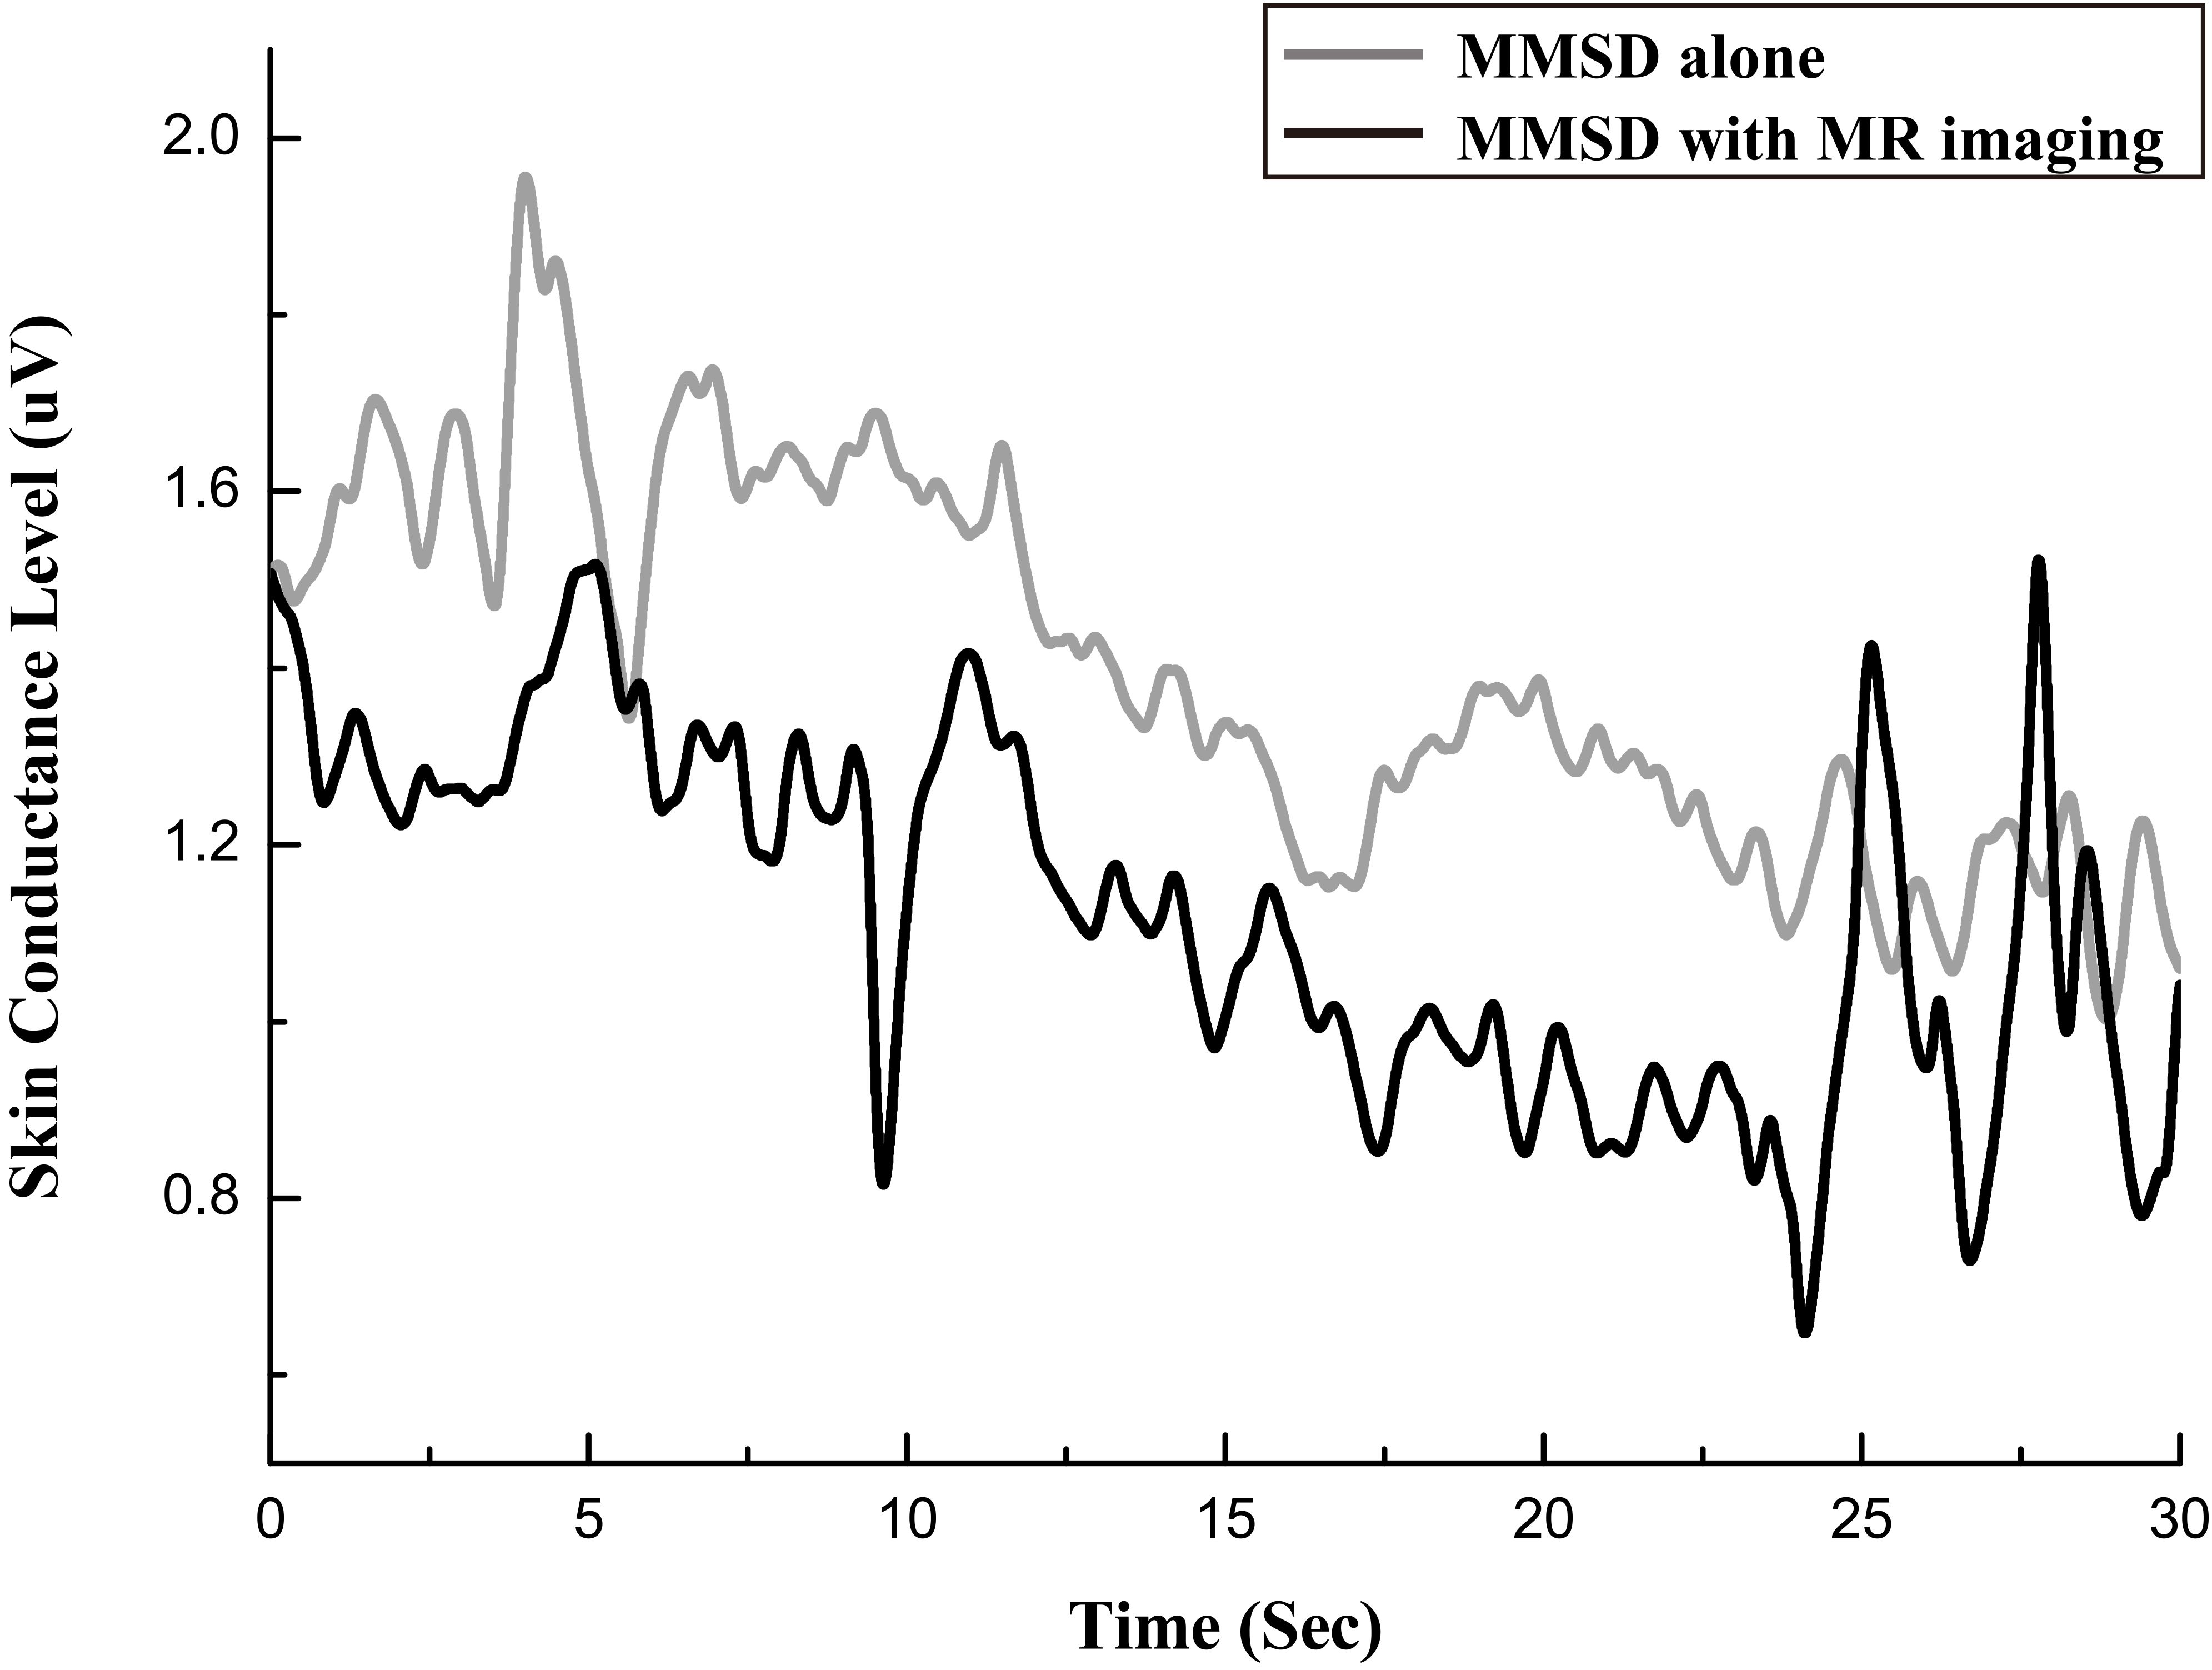
Figure 8.
Photoplethysmographic signal in microvolts, measured with MMSD-alone and with MMSD
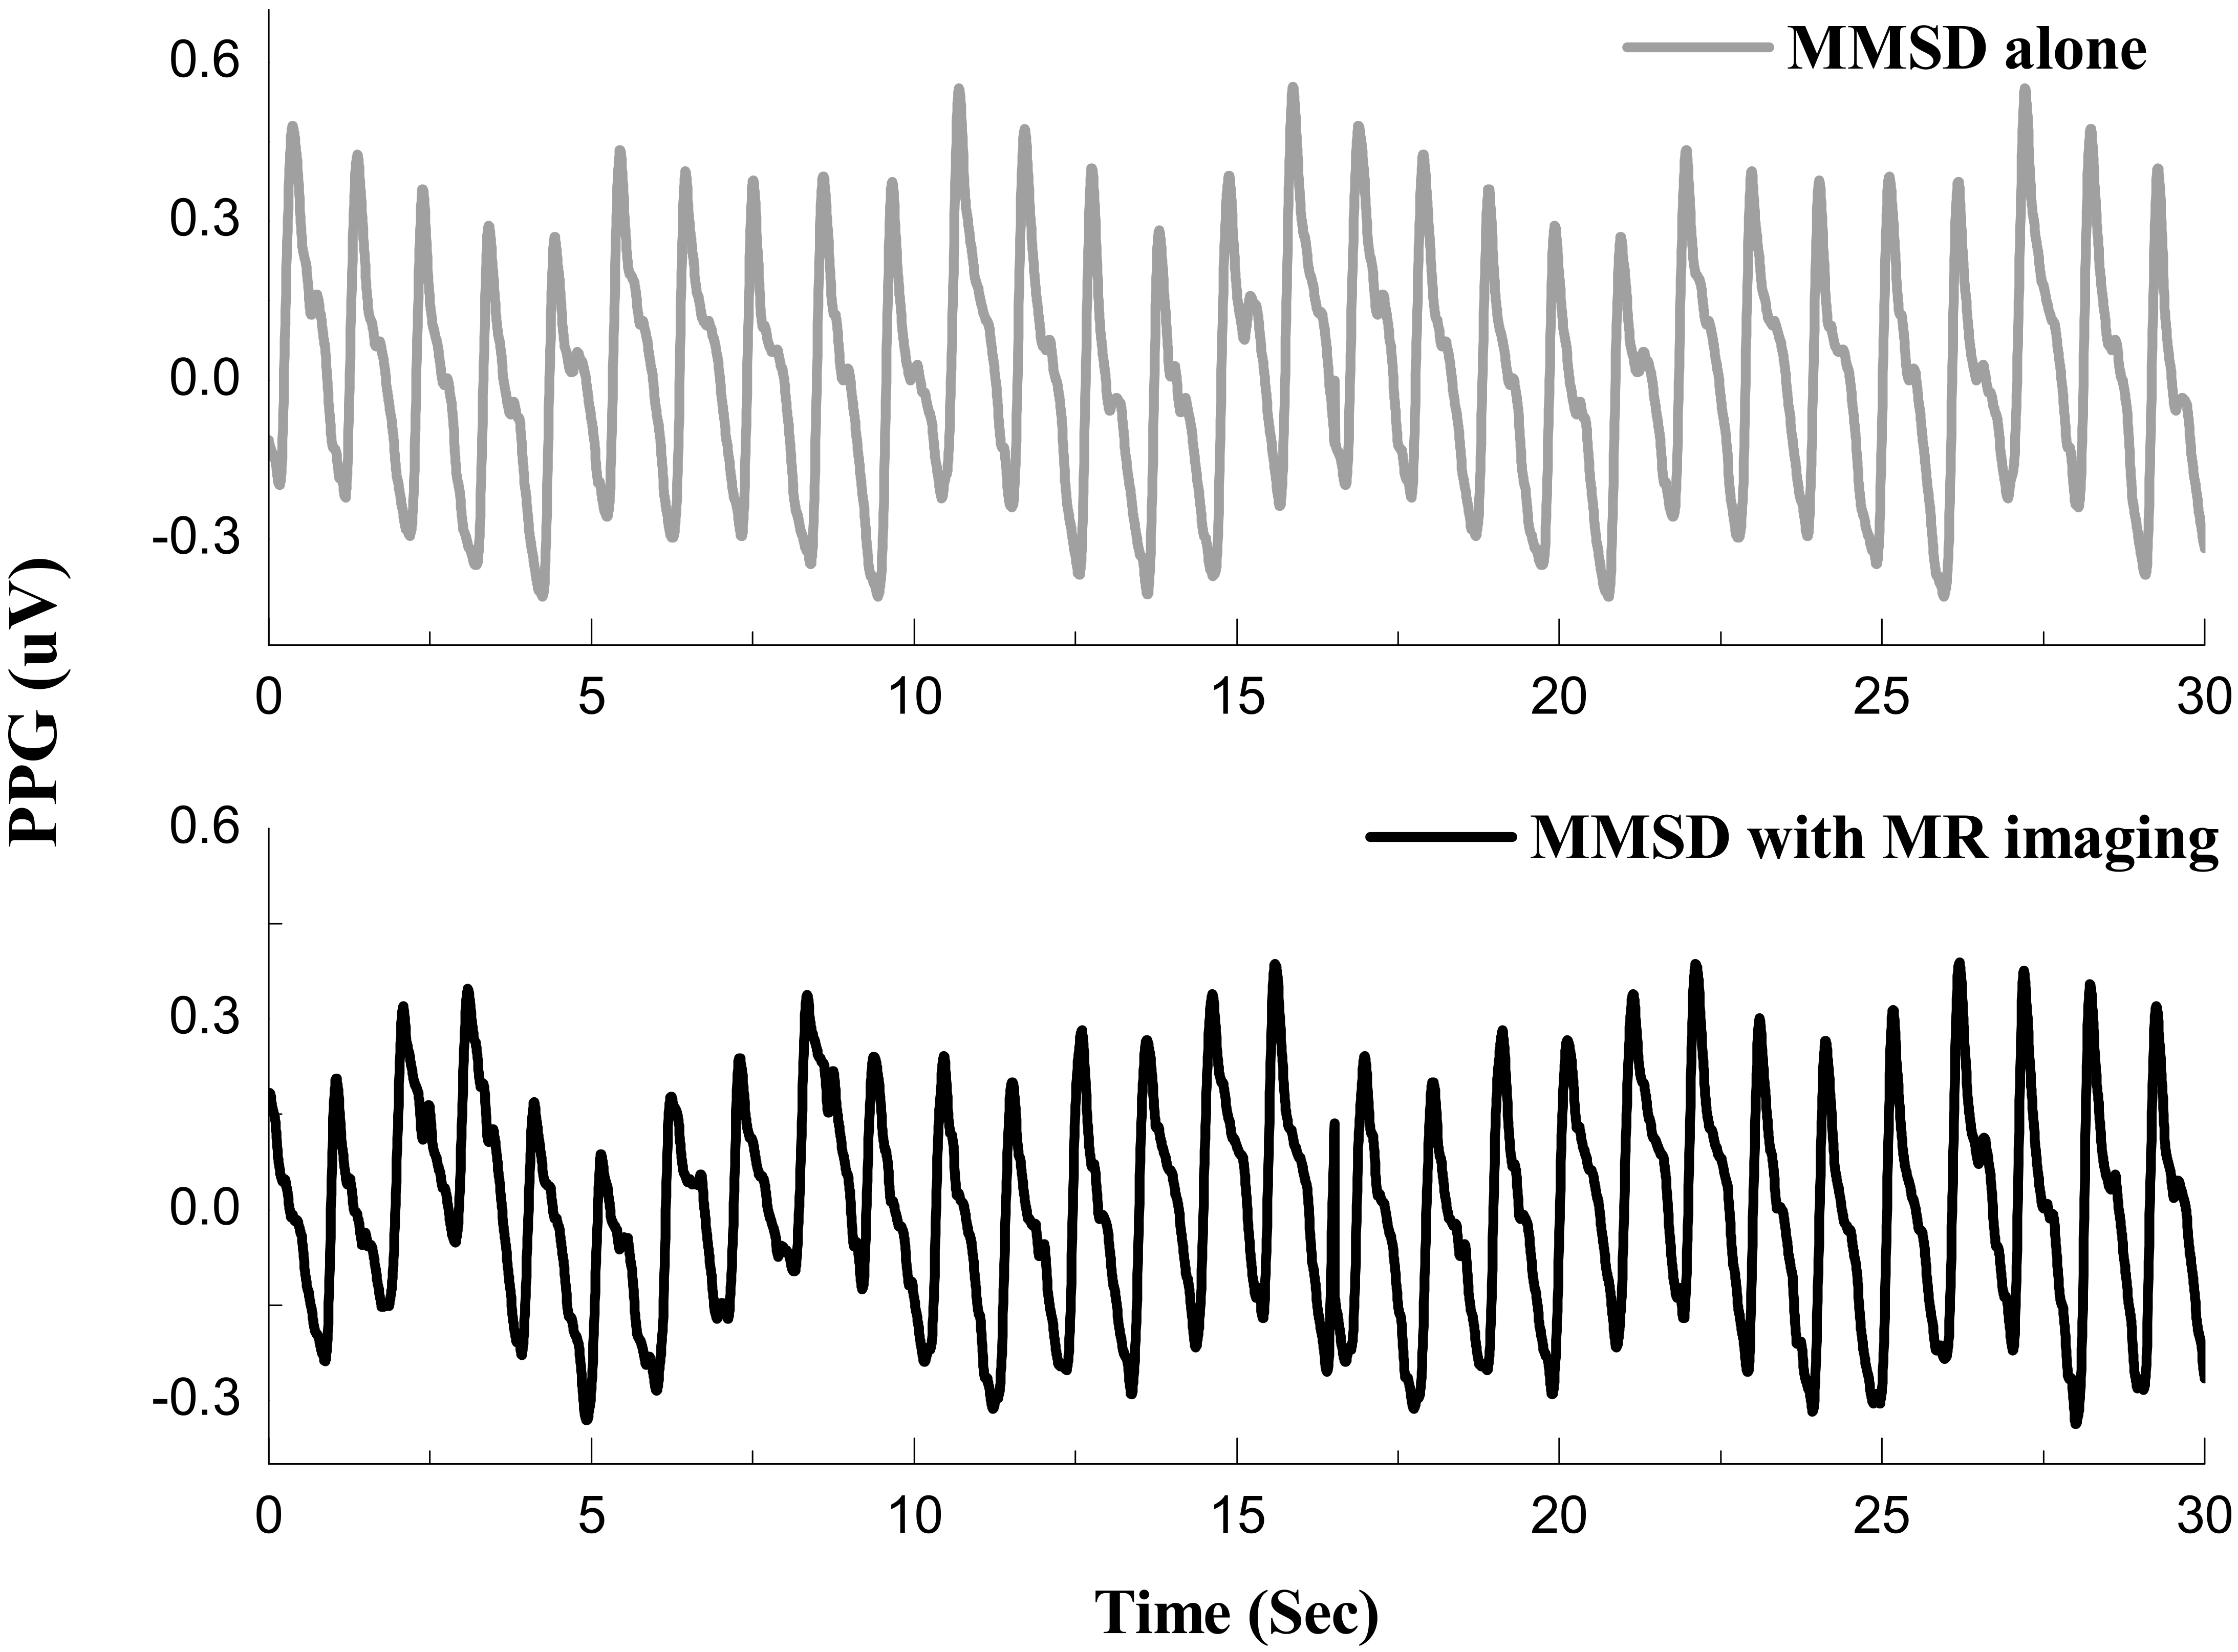
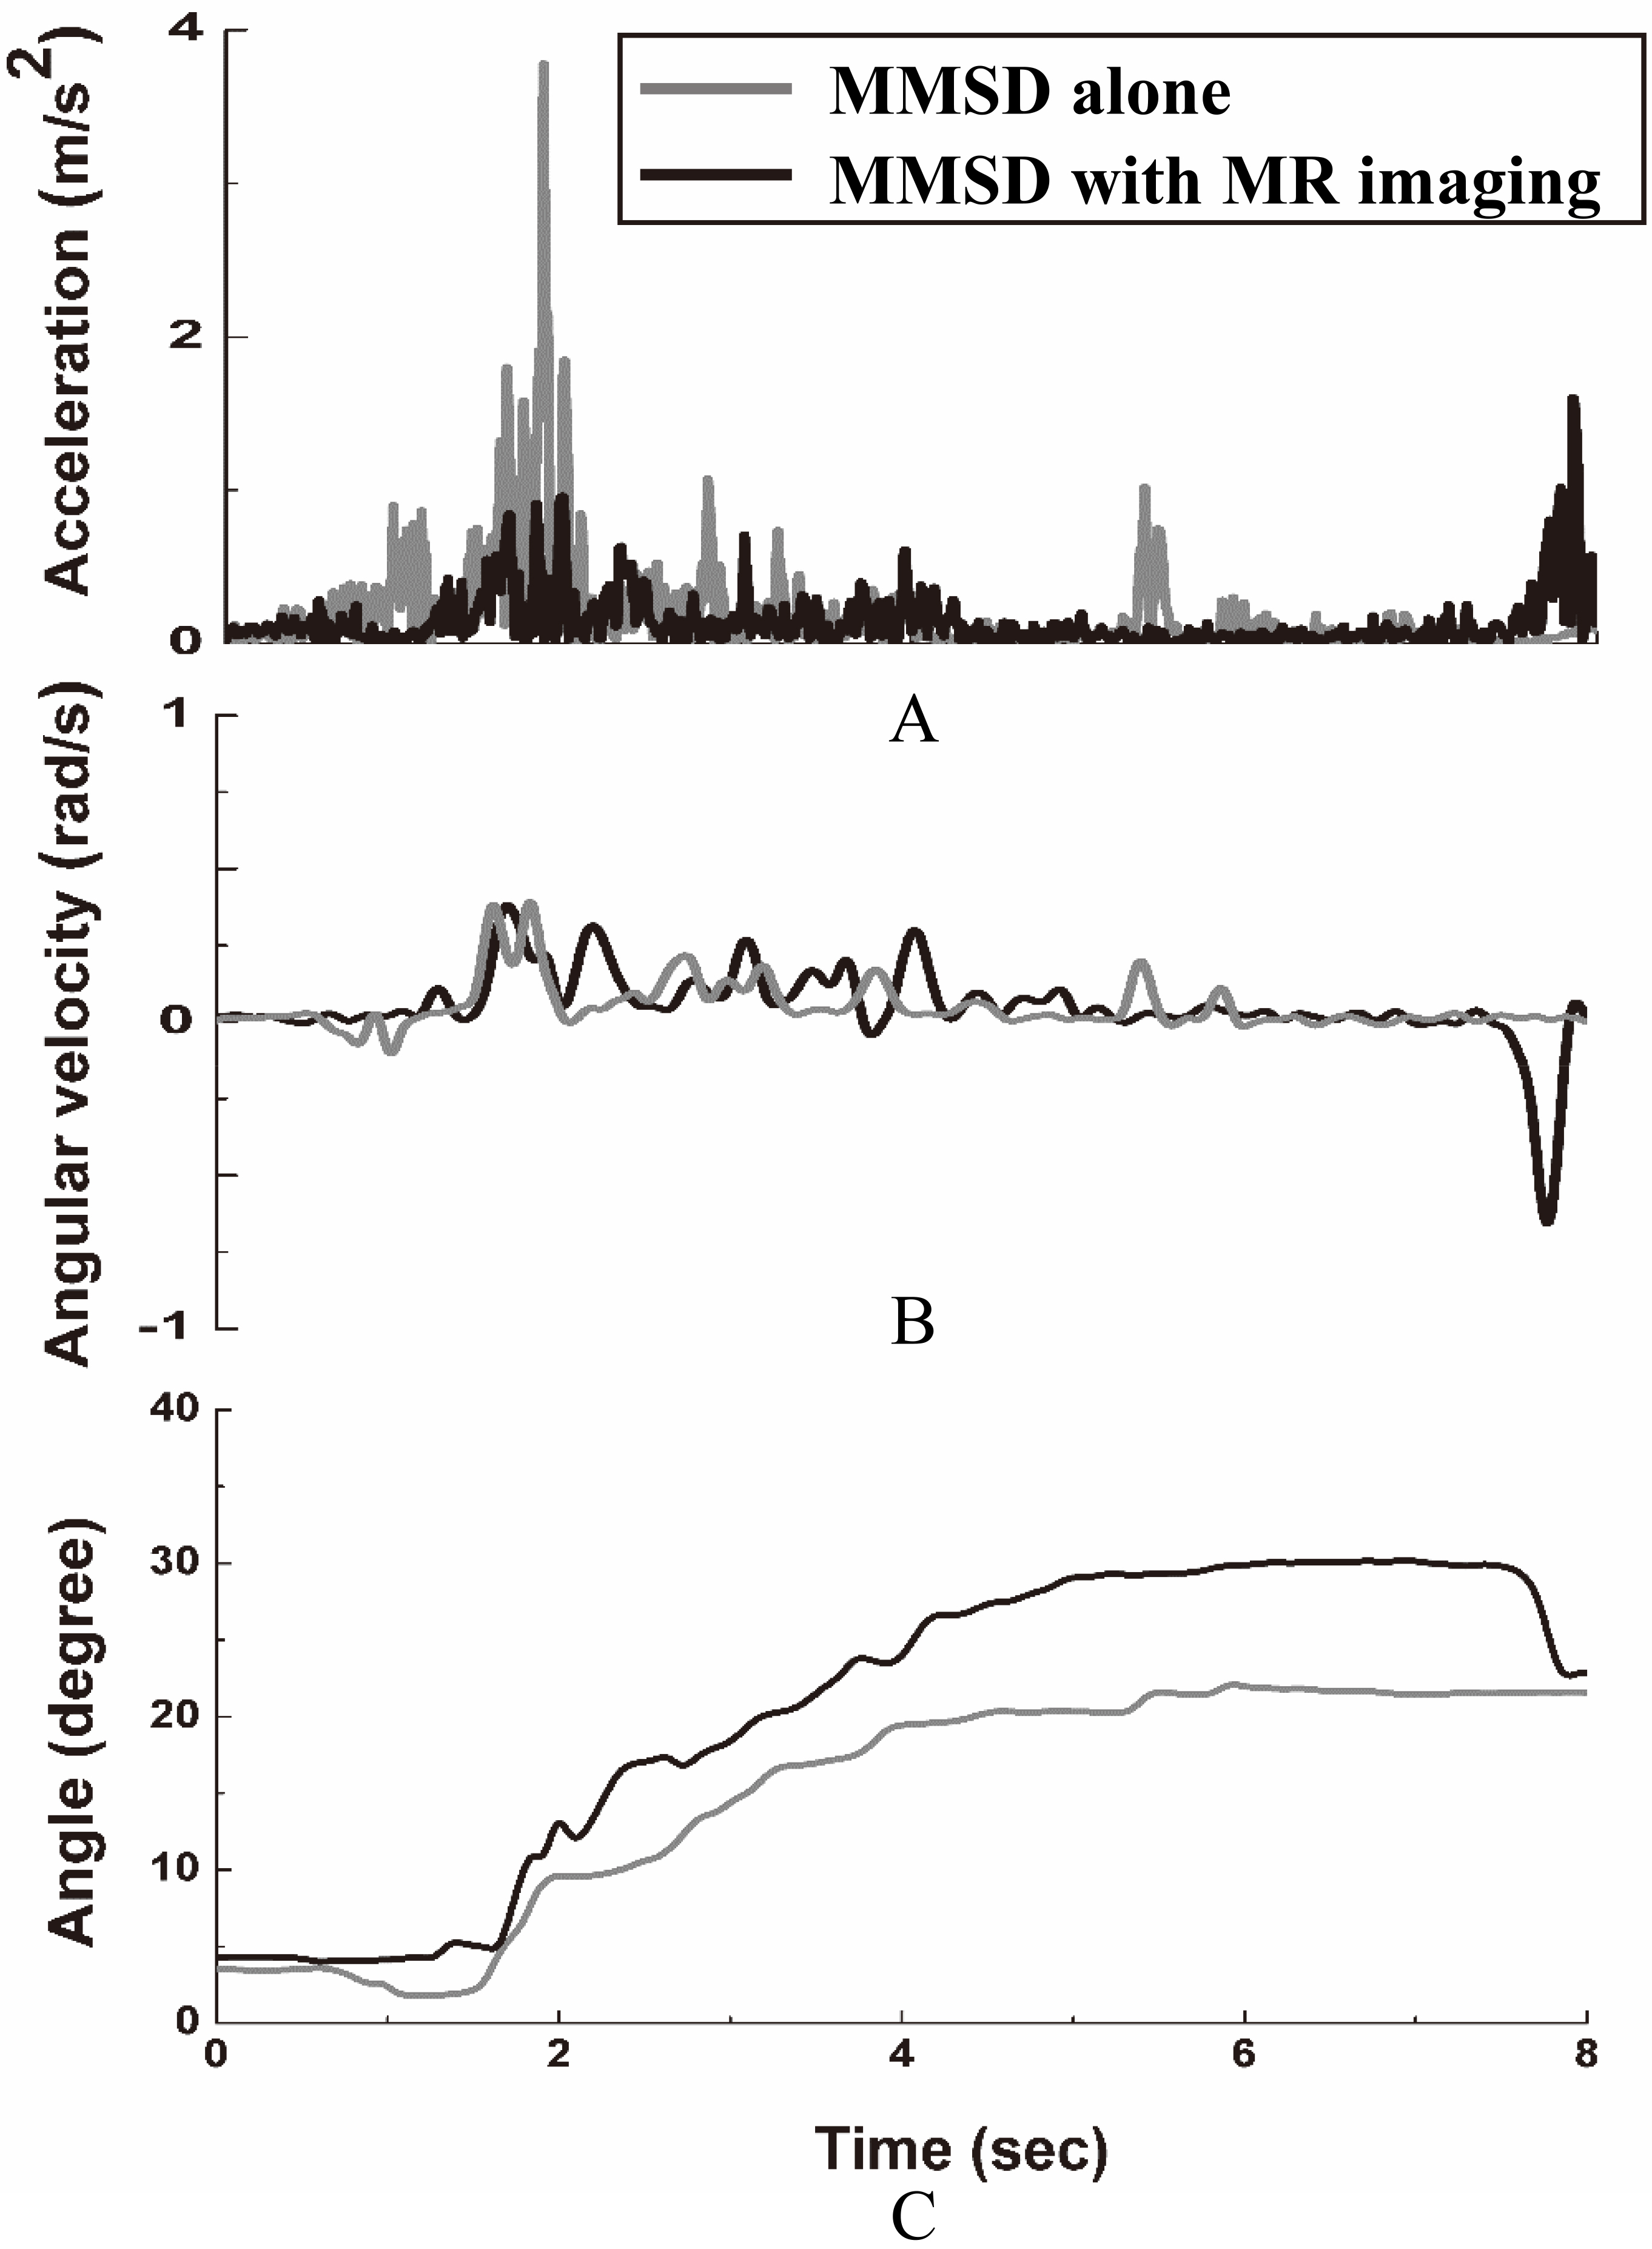
Figure 9.
Kinematic signal at ankle measured with MMSD-alone and with MMSD
4.Results
4.1MR images
The intensities of the phantom images recorded under “without MMSD” and “with MMSD” conditions at two cross-sectional positions (A, B) are shown in Fig. 5. There was almost no difference in intensity attributable to the presence of the MMSD.
Figure 6 shows three human-brain images, namely the lower axial image (slice A), the middle axial image (slice B), and the upper axial image (slice C). As shown in Fig. 6, the signal-to-noise ratios (SNR) based on the intensities of four locations corresponding to the background were calculated by extracting the intensity in locations 1, 2, and 3 without MMSD, with MMSD, and with MMSD
4.2Physiological and kinematic signals
Figure 7 shows the SCL signal measured during the B interval in the “MMSD-alone” and “MMSD
The acceleration and angular velocity signals measured during the A interval and the angle information calculated from these results are shown in Fig. 9. Due to dorsiflexion and plantarflexion motion of the ankle, the motion required to depress the accelerator to increase speed until 80 km/h is reached. Figure 9a shows the acceleration while pedaling, Fig. 9b shows angular velocity, and Fig. 9c shows angle. As shown in the figures, stable changes in acceleration and angular velocity of the ankle are observed in both sessions, and the angle of the ankle increases as the participant depresses the accelerator after starting to drive.
5.Discussion and conclusions
In this study, we developed an fMRI-compatible driving simulator, the MMSD, which can simultaneously measure autonomic nervous system reactions and changes in driving movements and established its feasibility through tests. The developed driving simulator was composed of subcomponents (steering wheel, accelerator, brake pedal, and visual system) that provided a simulated driving environment similar to the actual environment, and all subcomponents were extensively customized for the spatial restrictions of the MR environment. In addition, the simulator was designed so that it could be adjusted to fit the participant’s individual physical features in order to minimize inconvenience in the narrow MR environment.
The MR compatibility of the developed MMSD was judged by the extent to which the MMSD preserved the MR image resolution and accuracy. Moreover, the main magnetic field, gradient magnetic field, and RF pulse of the MR environment must not cause noise in the physiological or kinematic signals captured by the MMSD, and this was mostly found to be the case.
First, in the test to investigate the influence of the developed MMSD on the MR image, there was no significant difference in phantom image intensity with or without the MMSD system. Moreover, we found no significant differences in the calculated SNR values that were clearly outside the scanner fluctuation range in the three actual human brain slices and at the three locations (L1, L2, L3) examined. Thus, the MMSD had almost no influence on the MR image. Through this result, the reliability of the obtained brain images and the possibility of measuring brain activity while driving in simulation were confirmed.
Second, in the test to investigate the influence of the MR system on the physiological signal-measurement system of the MMSD, SCL signals showed no noticeable difference between the MMSD
There were a few limitations to this research. The MMSD developed through this study is for a limited environment inside MRI. Therefore, it is inevitable to restrict drivers’ position, which means driving with the MMSD would be different from real-world driving and natural driving behavior might not be possible. Also, it would be difficult to employ it for experiments which require head movement, like looking at the mirrors in and out of the car while changing lanes, observing the surroundings, or backing the car as the MMSD strongly restricts head movement and only allows drivers to stare center field so that it can gain their brain images. However, when using this system, it is possible to measure kinematic movement of the arms and legs, closely related to driving, as well as biological reaction in their autonomic and central nervous systems. Therefore, it can be widely used for experiments whose major variables are controlling wheels (steering systems) or an accelerator. In other words, the MMSD can contribute to research which observes the overall impact of various factors on driving, such as distracted driving, caused by cellphones, verbal action, addition, or n-back task, doing secondary task, drinking, dozing off, or suffering neuropsychological diseases, including Alzheimer or dementia.
In conclusion, an fMRI-compatible driving simulator was developed that can not only measure physiological and kinematic signals at the same time, but can also be used in fMRI studies to concurrently observe central nervous-system reactions such as brain activity. It is expected that in the future, this system will be used in various studies to quantitatively measure and analyze brain activity, autonomic nervous system, and human movement in driving activities to comprehensively evaluate complex perceptual-motor behavior in driving-challenged patients and in the elderly, as well as in persons of average ability.
Acknowledgments
This paper was supported by Konkuk University in 2019.
Conflict of interest
The authors have no conflict of interest to report.
References
[1] | Min YK, Chung SC, You JH, et al. Young adult drivers’ sensitivity to changes in speed and driving mode in a simple vehicle simulator. Percept Mot skills. (2006) ; 103: (1): 197-209. |
[2] | Choi JS, Kim HS, Kang DW, et al. The effects of disruption in attention on driving performance patterns: Analysis of jerk-cost function and vehicle control data. Appl Ergon. (2013) ; 44: (4): 538-543. |
[3] | Kim HS, Choi MH, Yoon HJ, et al. Cerebral activation and lateralization due to the cognition of a various driving speed difference: An fMRI study. Biomed Mater Eng. (2014) ; 24: (1): 1133-1139. |
[4] | Chung SC, Choi MH, Kim HS, et al. Effects of distraction task on driving: A functional magnetic resonance imaging study. Biomed Mater Eng. (2014) ; 24: (6): 2971-2977. |
[5] | Choi JS, Kim HS, Shin YH, et al. Differences in driving performance due to headway distances and gender: The application of jerk cost function. Int J Occup Saf Ergon. (2015) ; 21: (1): 111-117. |
[6] | Kim HJ, Yi JH, Kim HS, et al. Change of neuronal activations induced by the passive perception of driving speed difference. BioMed Mater Eng. (2015) ; 26: (s1): 833-840. |
[7] | Findley LJ, Fabrizio MJ, Knight H, et al. Driving simulator performance in patients with sleep apnea1-3. Am Rev Respir Dis. (1989) ; 140: (2): 529-530. |
[8] | Zhao C, Zhao M, Liu J, Zheng C. Electroencephalogram and electrocardiograph assessment of mental fatigue in a driving simulator. Accid Anal Prev. (2012) ; 45: : 83-90. |
[9] | Bernardi G, Cecchetti L, Handjaras G, et al. It’s not all in your car: Functional and structural correlates of exceptional driving skills in professional racers. Front Hum Neurosci. (2014) ; 8: : 888. |
[10] | Schweizer TA, Kan K, Hung Y, et al. Brain activity during driving with distraction: an immersive fMRI study. Front Hum Neurosci. (2013) ; 7: : 53. |
[11] | Meda SA, Calhoun VD, Astur RS, et al. Alcohol dose effects on brain circuits during simulated driving: An fMRI study. Hum Brain Mapp. (2009) ; 30: (4): 1257-1270. |
[12] | Allen AJ, Meda SA, Skudlarski P, et al. Effects of alcohol on performance on a distraction task during simulated driving. Alcohol Clin Exp Res. (2009) ; 33: (4): 617-625. |
[13] | Helland A, Jenssen GD, Lervag LE, et al. Comparison of driving simulator performance with real driving after alcohol intake: A randomised, single blind, placebo-controlled, cross-over trial. Accid Anal Prev. (2013) ; 53: : 9-16. |
[14] | Poudel GR, Innes CR, Jones RD. Distinct neural correlates of time-on-task and transient errors during a visuomotor tracking task after sleep restriction. NeuroImage. (2013) ; 77: : 105-113. |
[15] | Tango F, Montanari R, Marzani S. Present and future of simulation traffic models. In Cacciabue PC, ed.; London: Springer-Verlag; (2007) . pp. 99-142. |
[16] | Hirth VA, Davis B, Fridriksson J, et al. Cognitive performance and neural correlates of detecting driving hazards in healthy older adults. Dement Geriatr Cogn Disord. (2007) ; 24: (5): 335-342. |
[17] | Hung Y, Vetivelu A, Hird MA, et al. Using fMRI virtual-reality technology to predict driving ability after brain damage: A preliminary report. Neurosci Lett. (2014) ; 558: : 41-46. |
[18] | Kan K, Schweizer TA, Tam F, Graham SJ. Methodology for functional MRI of simulated driving. Med Phys. (2013) ; 40: (1): 012301. |
[19] | Uchiyama Y, Toyoda H, Sakai H, et al. Suppression of brain activity related to a car-following task with an auditory task: An fMRI study. Transp Res Part F Traffic Psychol Behav. (2012) ; 15: (1): 25-37. |
[20] | Lim DW, Park JR, Choi MH, et al. Development of a magnetic resonance-compatible galvanic skin response measurement system using optic signal. Int J Neurosci. (2009) ; 119: (9): 1337-1345. |
[21] | Chung SC, Kwon JH, Lee N, et al. Development of a magnetic-resonance-compatible photoplethysmograph amplifier for behavioral and emotional studies. Behav Res Methods. (2008) ; 40: (1): 342-346. |
[22] | Chung SC, Kim HS, Yang JW, et al. A simple 5-DoF MR-compatible motion signal measurement system. Behav Res Methods. (2011) ; 43: (3): 897-901. |
[23] | Kim HS, Yeon HW, Choi MH, et al. Movement measurement systems for fMRI motion studies. Adv Mat Res. (2013) ; 684: : 473-476. |
[24] | Hong SK. Fuzzy logic based closed-loop strapdown attitude system for unmanned aerial vehicle (UAV). Sens Actuators A Phys. (2003) ; 107: (2): 109-118. |
[25] | Murthy VS, Ramamoorthy S, Srinivasan N, et al. Analysis of photoplethysmographic signals of cardiovascular patients. In Proceeding of 23rd Annual International Conference of the IEEE Engineering in Medicine and Biology Society, Istanbul, Turkey, 25–28 October (2001) ; pp. 2204-2207. |

