
A simple method for removing initial irregularity of an electrocardiogram during a transient state of a power supply in a defibrillator
Abstract
BACKGROUND:
The defibrillator is a device that instantaneously discharges the high energy stored in the capacitor to the human body to help revitalize the heart. The circuit for charging the capacitor uses the same power source as the biosignal measurement unit. Therefore, variation in main power supply voltage, ground noise, and electromagnetic interference from the charging circuit can induce distortion into the biosignal at the initial stage of charging.
OBJECTIVE:
In this study, a simple method is proposed for removing the initial irregularity of an electrocardiogram due to the transient state of a power supply.
METHODS:
To evaluate the method, a 1-channel electrocardiogram measurement unit and peripheral units were separated from the main control module using galvanic isolation. An isolated push-pull converter was designed to power the secondary side. The method was tested under steady-state and transient conditions.
RESULTS:
The obtained results proved that biosignal distortion can be significantly reduced.
CONCLUSION:
This method could be another simple implementation approach for solving signal distortions due to the transient status of power supplies used in medical devices.
1.Introduction
Sudden cardiac arrest refers to a state in which the heart unexpectedly stops beating [1, 2, 3]. Depending on the cause of the heart attack, when the heart has been stopped for a period of three minutes, irreversible neurological disorder occurs. After four to six minutes of heart stoppage, the risk of death is high [4, 5, 6]. Thus, it is very important that rapid first aid and treatment can be applied in an emergency situation when the heart has stopped beating [2, 3, 7, 8, 9]. If emergency treatment is delayed, the patient may be resuscitated; however, they would not recover full brain function [9, 10] resulting in life-long dependency on others and requiring ongoing treatment [7, 8, 9]. Therefore, the long-term healthcare burdens and subsequent socio-economic costs increase. Recently, heart-related diseases have increased resulting in a rise in the use of defibrillators [11, 12]. According to statistics, the rate of hospital discharges after cardiac arrests in the United States was 10.5% in 2015; for Seoul, Korea the discharge rate was 7.6% in 2015; and for Japan, the discharge rate was 9.0% in 2016. If there were bystanders during the emergency, resuscitation rates increased in the three countries by 34.6%, 12.5%, and 14.5%, respectively [13, 14, 15, 16]. Hence, the propagation of automated external defibrillators (AED) has been expanded and is now required to be installed in public places [17, 18, 19]. In addition, as interest in favorable health and improving quality of life increases, the installations of AEDs in the home have been gradually increasing [20, 21]. Most defibrillators discharge the energy stored in the capacitor to the patient through the power switch with sufficient energy for defibrillation for a very short time. The energy required by a defibrillator for proper operation is typically in range of 100 Joule to 360 Joule for an adult and 30 Joule to 150 Joule in the case of children. Since skin impedance is different between humans, high-voltage energy between 1,100 V to 1,700 V has been used in certain situations. However, for electrical safety concerns, the high-voltage capacitor is not always charged. For manual defibrillation, the amount of energy required to charge the capacitor depends on the physician; while for the case of an AED, the energy to be charged is determined from the electrocardiogram analysis algorithm. It is implemented in software and uses different algorithms developed for each company that sells AEDs.
The defibrillator has a separate charging circuit for quick energy delivery into the patient after the decision has been made regarding shockable ECG rhythm. The charging module is designed with a switched-mode power supply (SMPS) for size, weight, and efficiency of the power supply itself. However, there is a short, instantaneous period during the early stage of the charging process where the surge current flows into the high-voltage capacitor. Therefore, fluctuations in the main supply can create potential electromagnetic interference from the charging circuit. Additionally, possible induction of ground noise and small variations in the grounding circuit can occur when the voltage level in the capacitor is highly charged. In addition, an ECG signal can become distorted because of the biosignal measurement unit using the same power source as the main operating unit. These phenomena are more prevalent in AEDs that are powered by a battery than a manual defibrillator using an alternate current (AC) power from the wall. Since the AED determines the delivery of energy based on the ECG signal, the distortion in an electrocardiogram signal can cause critical false operations such as a false-positive state that delivers the shock to the patient even with a normal ECG signal. Alternately, a true-negative state could occur where the person does not receive the necessary shock even when a shockable rhythm condition is present. Methods for improving the ECG diagnostic algorithm have been proposed to solve such a phenomenon [22, 23, 24, 25]. However, this method requires significant time and financial resources for developing and validating the software algorithms, also, recruitment of relevant high-quality software engineer is difficult. Thus, small and medium-sized companies use a diagnostic algorithm for licensing, but they are not competitive due to rising product cost. Although there are other approaches including applying an additional circuit and module as well as detailed designing of print circuit boards (PCB) [26], the system is larger and heavier and not user-friendly. Therefore, it is necessary to develop a system that is immune to the irregularity of the biosignal generated during the initial charging phase of the energy charging cycle while not significantly increasing the size, weight, appearance and cost of the conventional defibrillator.
In this study, we propose a simple method for removing the initial irregularity of the ECG signal through separation by galvanic isolation from the main power supply and main operation unit including the biosignal measurement unit. For this method, an isolation power converter and peripheral circuits were implemented and a coupler was used to communicate with the main operation unit.
2.Materials and methods
The overall concept of the proposed method is shown in Fig. 1. The main operating unit is controlled by a RB-STM32F103C6 standalone board (Green Chips, Korea). A 32-bit CortexTM-M3 ARM family microcontroller STM32F103C6 (ST Microsystems, USA) was integrated into this board which has the ability to boot from a flash drive or a PC. Additionally, a Timer PWM port, SPI interface, RS-232 communication channel, USB 2.0 full speed connection, CAN 2.0, GPIOs, 12-bit ADC, DMA (direct memory access) channels, and 12-bit ADC of 12 channels were developed and incorporated into the overall design.
Figure 1.
Overall concept of the proposed method (LC and SC represent the lead check and start conversion, respectively).
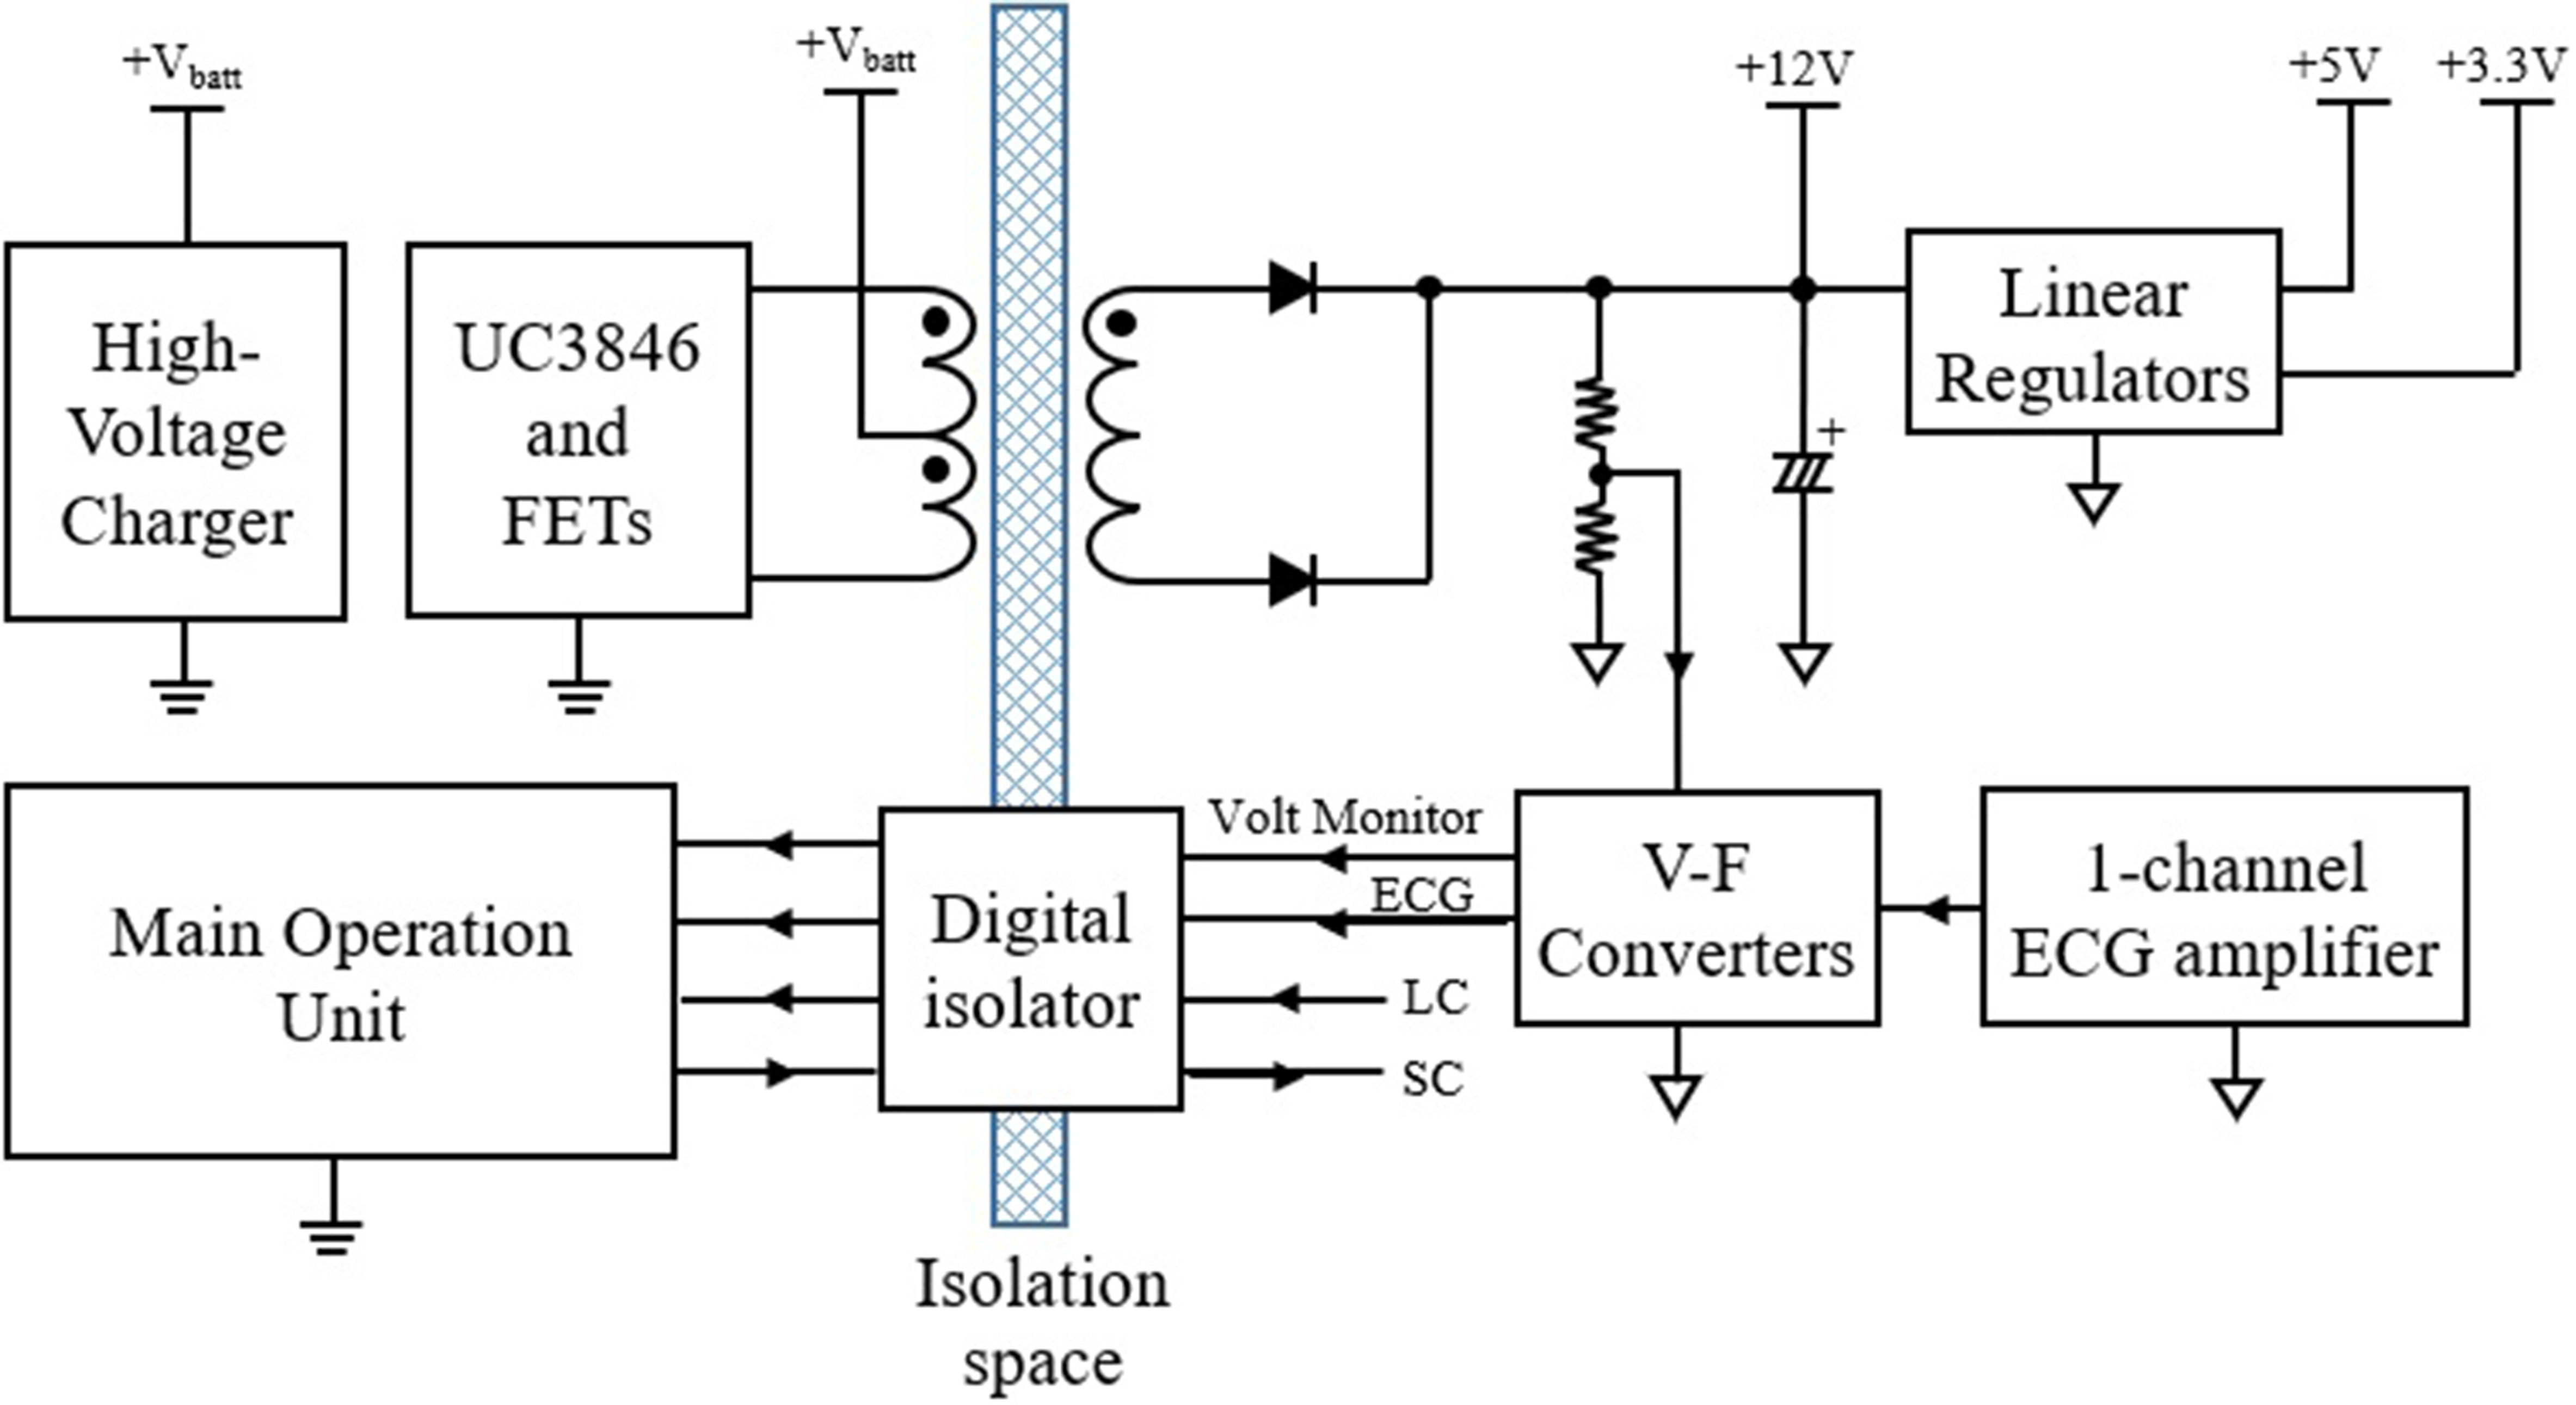
The main operation unit controls the entire system operations such as processing internal and external signals, controlling peripheral devices, monitoring functional safety and safety functions related to stable operation. In addition, the main operation unit turns the power converter on and off that is used to generate the high-voltage in the range of 1,100 V to 1,700 V, which is used for an internal charging capacitor. The power converter was designed as a type of flyback switched-mode power supply topology.
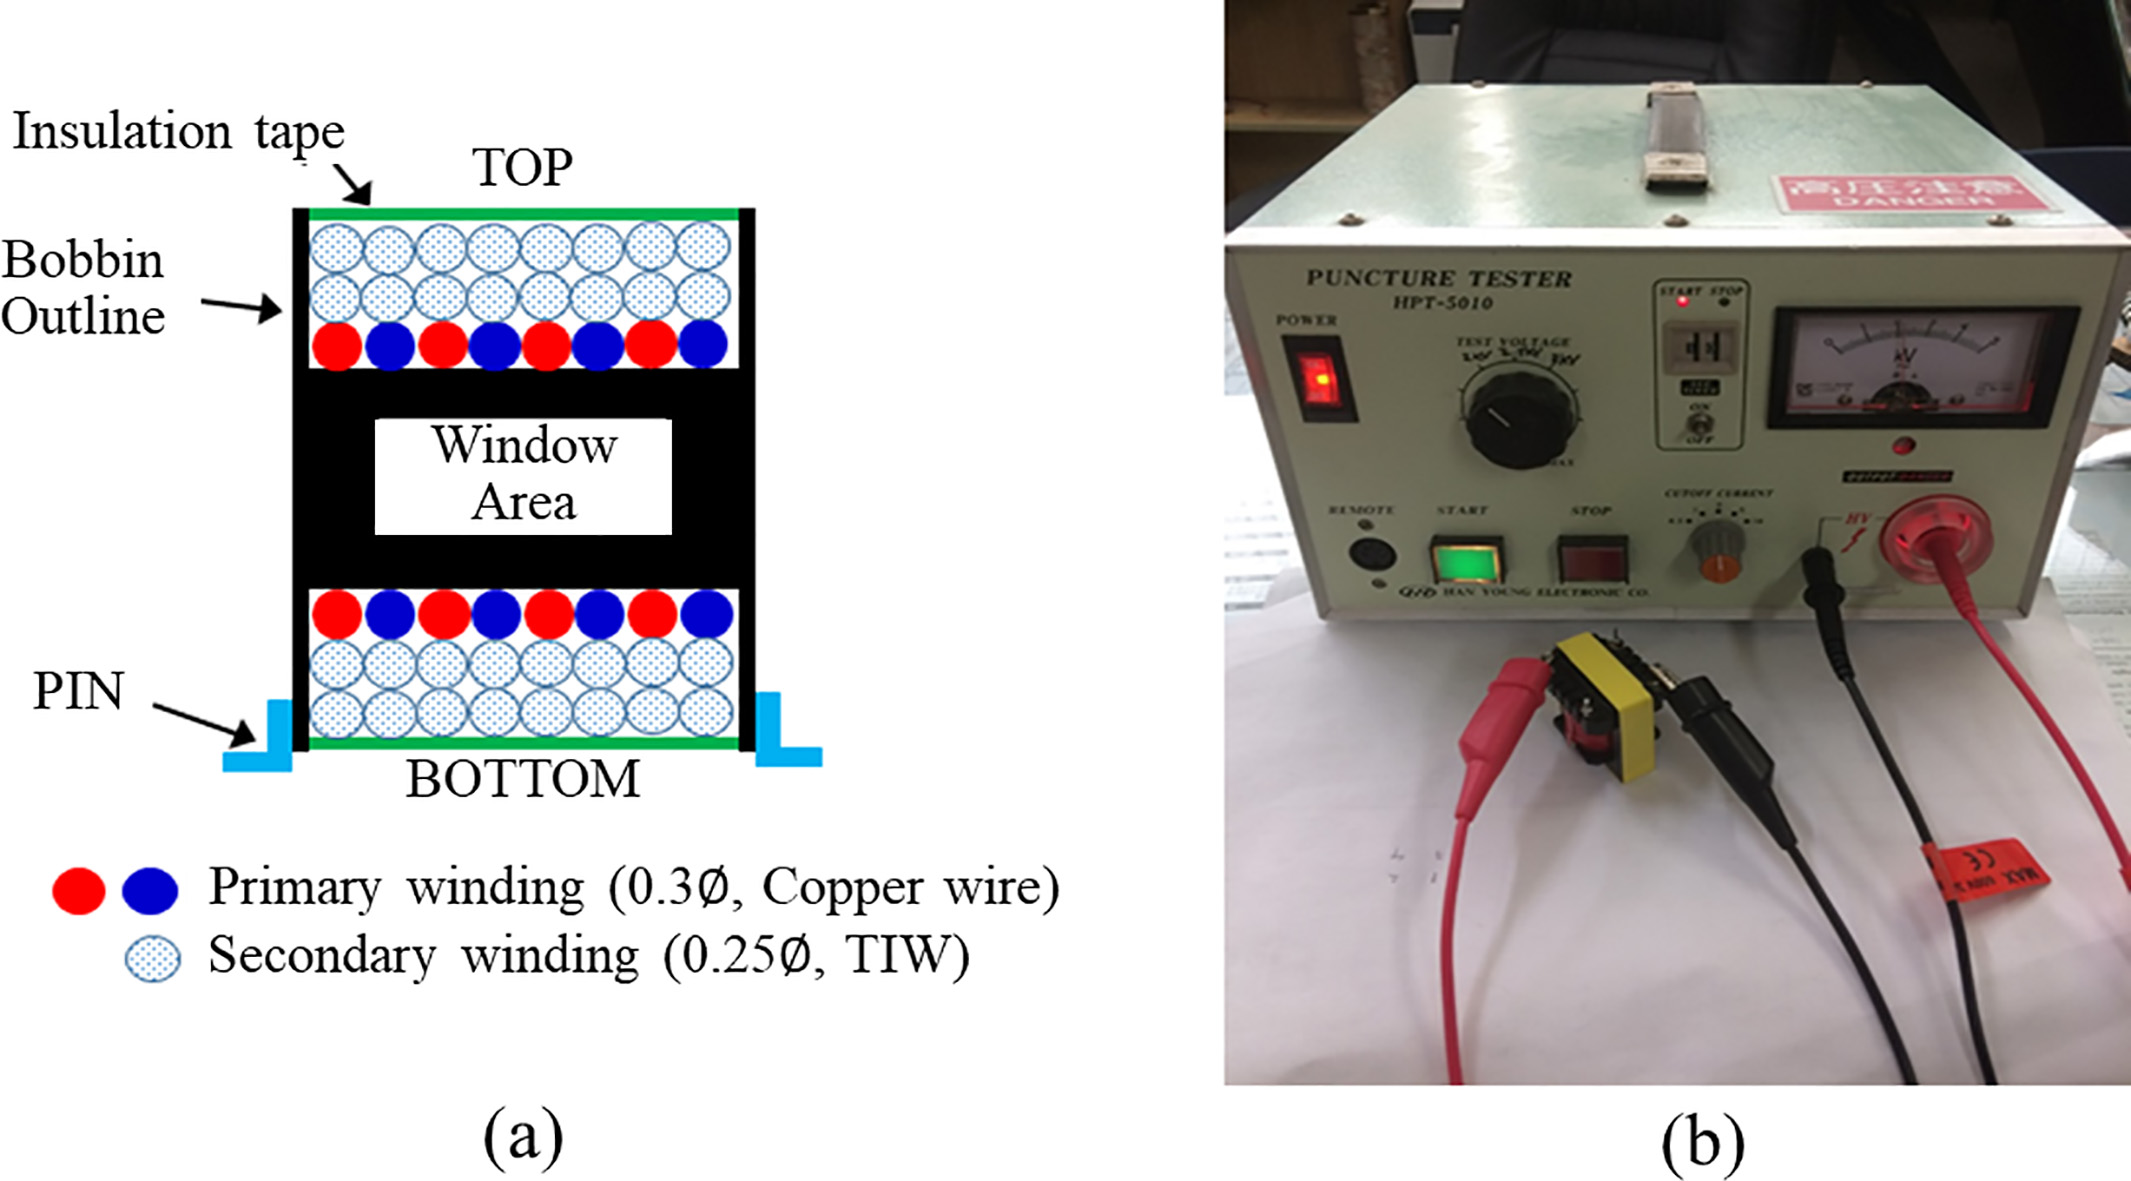
A galvanic isolation circuit with different references was applied between two circuit units consisting of the main operation unit and the biosignal measurement unit. Because the maximum generated voltage in the proposed circuit is 1.7 kilo-volts, creepage distances and clearances between two units for galvanic isolation are set to 5.3 mm and 3.8 mm respectively to follow IEC/EN 60065 and 60950-1 international regulations. An isolated push-pull converter was designed for supplying power to the secondary side. This converter was simply configured using only two switching transistors and a small size isolation transformer. Battery voltage of 10.8 V dropped instantaneously to 8.5 V due to current surge back to the high-voltage charger when generation started. Therefore, the push-pull converter was considered input voltage range and configured to generate a stable
The encoded digital signal was transmitted to primary side using an ADuM2401 (Analog Device, USA) quad-channel digital isolator. The transmitted signal was input into the STM32, which was then encoded and stored in a micro-SD card using the DMA channel. The stored ECG data can be viewed on a PC using a custom-made viewer. A small size EE1816 type bobbin and ferrite magnetic core (TDK, Japan) were used for configuring an isolation transformer. Figure 2A shows the winding method of the primary and secondary sides of the isolation transformer. On the primary side, two copper wires of 0.3
Figure 2.
Design and evaluation of the isolation transformer. a. Winding method of the primary and secondary side, b. Actual view of verification the insulation performance.
The LM7805 and TPS79533 linear regulators (Texas Instrument, USA) were used to convert
The proposed method was tested in two operational modes, Start charge (SC) and Recharge (RC), with the patient simulator, Model 217A (Dynatech Nevada Inc., USA). The SC status is a period in which the step-up circuit operates and charges energy to a high-voltage capacitor start from 0 volt, which lasts for about 12 seconds up to 1,700 volts. The RC status is a period in which a charged voltage regulation is performed in order to recharge the high-voltage capacitor when the voltage decreases to 5% or more from the initial charged voltage, and the period is operated for about 0.2 seconds. The charging state of the energy is monitored by using a voltage divider circuit which is consisted of resistors. Therefore, for each experiment, the SC status occurs only once for the first time. The RC status occurred once every 12 seconds during the whole experiment. The output terminals of the proposed system are connected to the patient simulator. Also, the output terminals of the proposed system are connected to the patient simulator and defibrillator tester IMPULSE 7000D (Fluke, USA). The patient simulator was set to operate in normal patient mode and simulated ECG waveforms were generated once per every one second. The defibrillator tester was used for simulated patient load at 50
Figure 3.
Testing environment. The patient simulator generated an ECG signal and the defibrillator tester provided 50
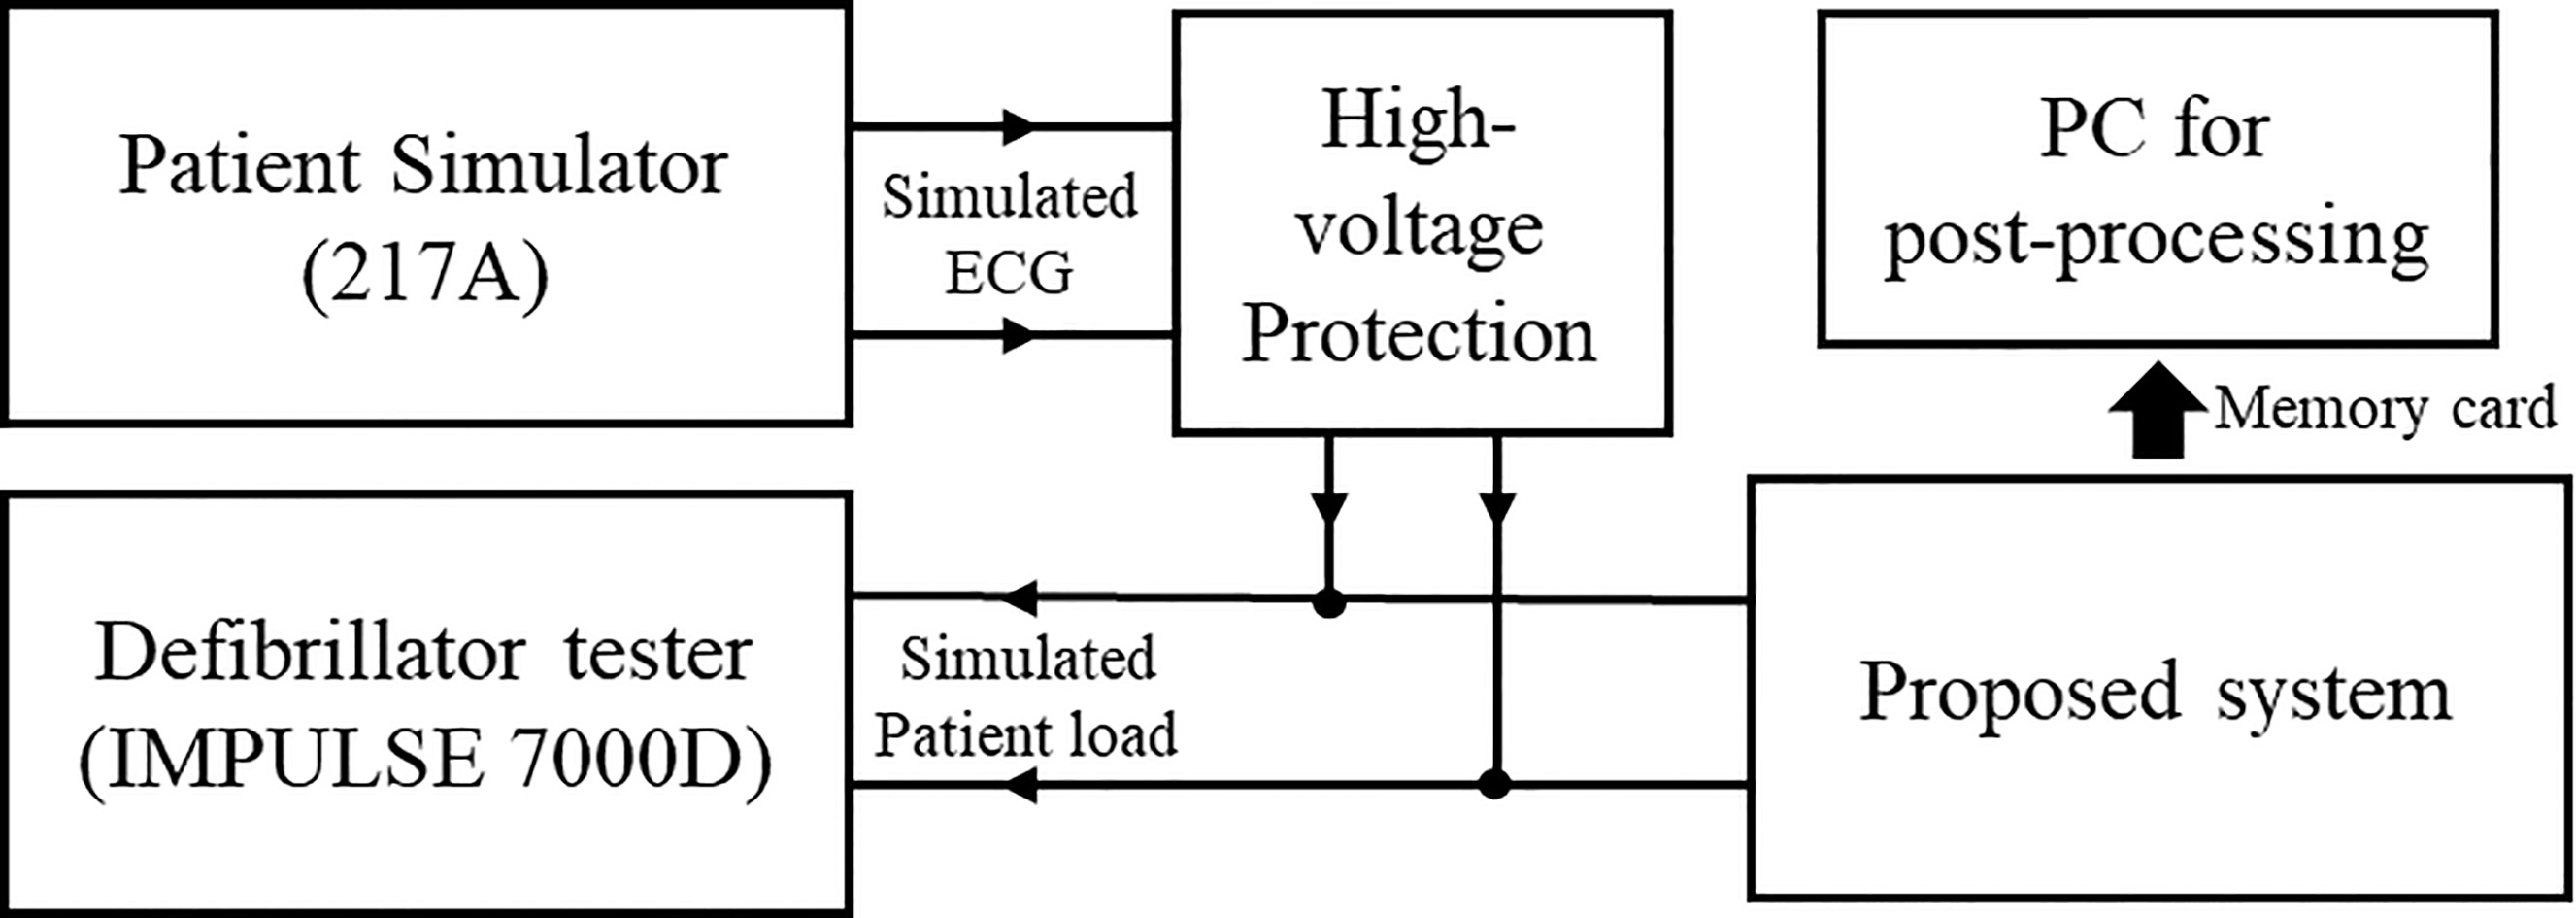
Figure 4.
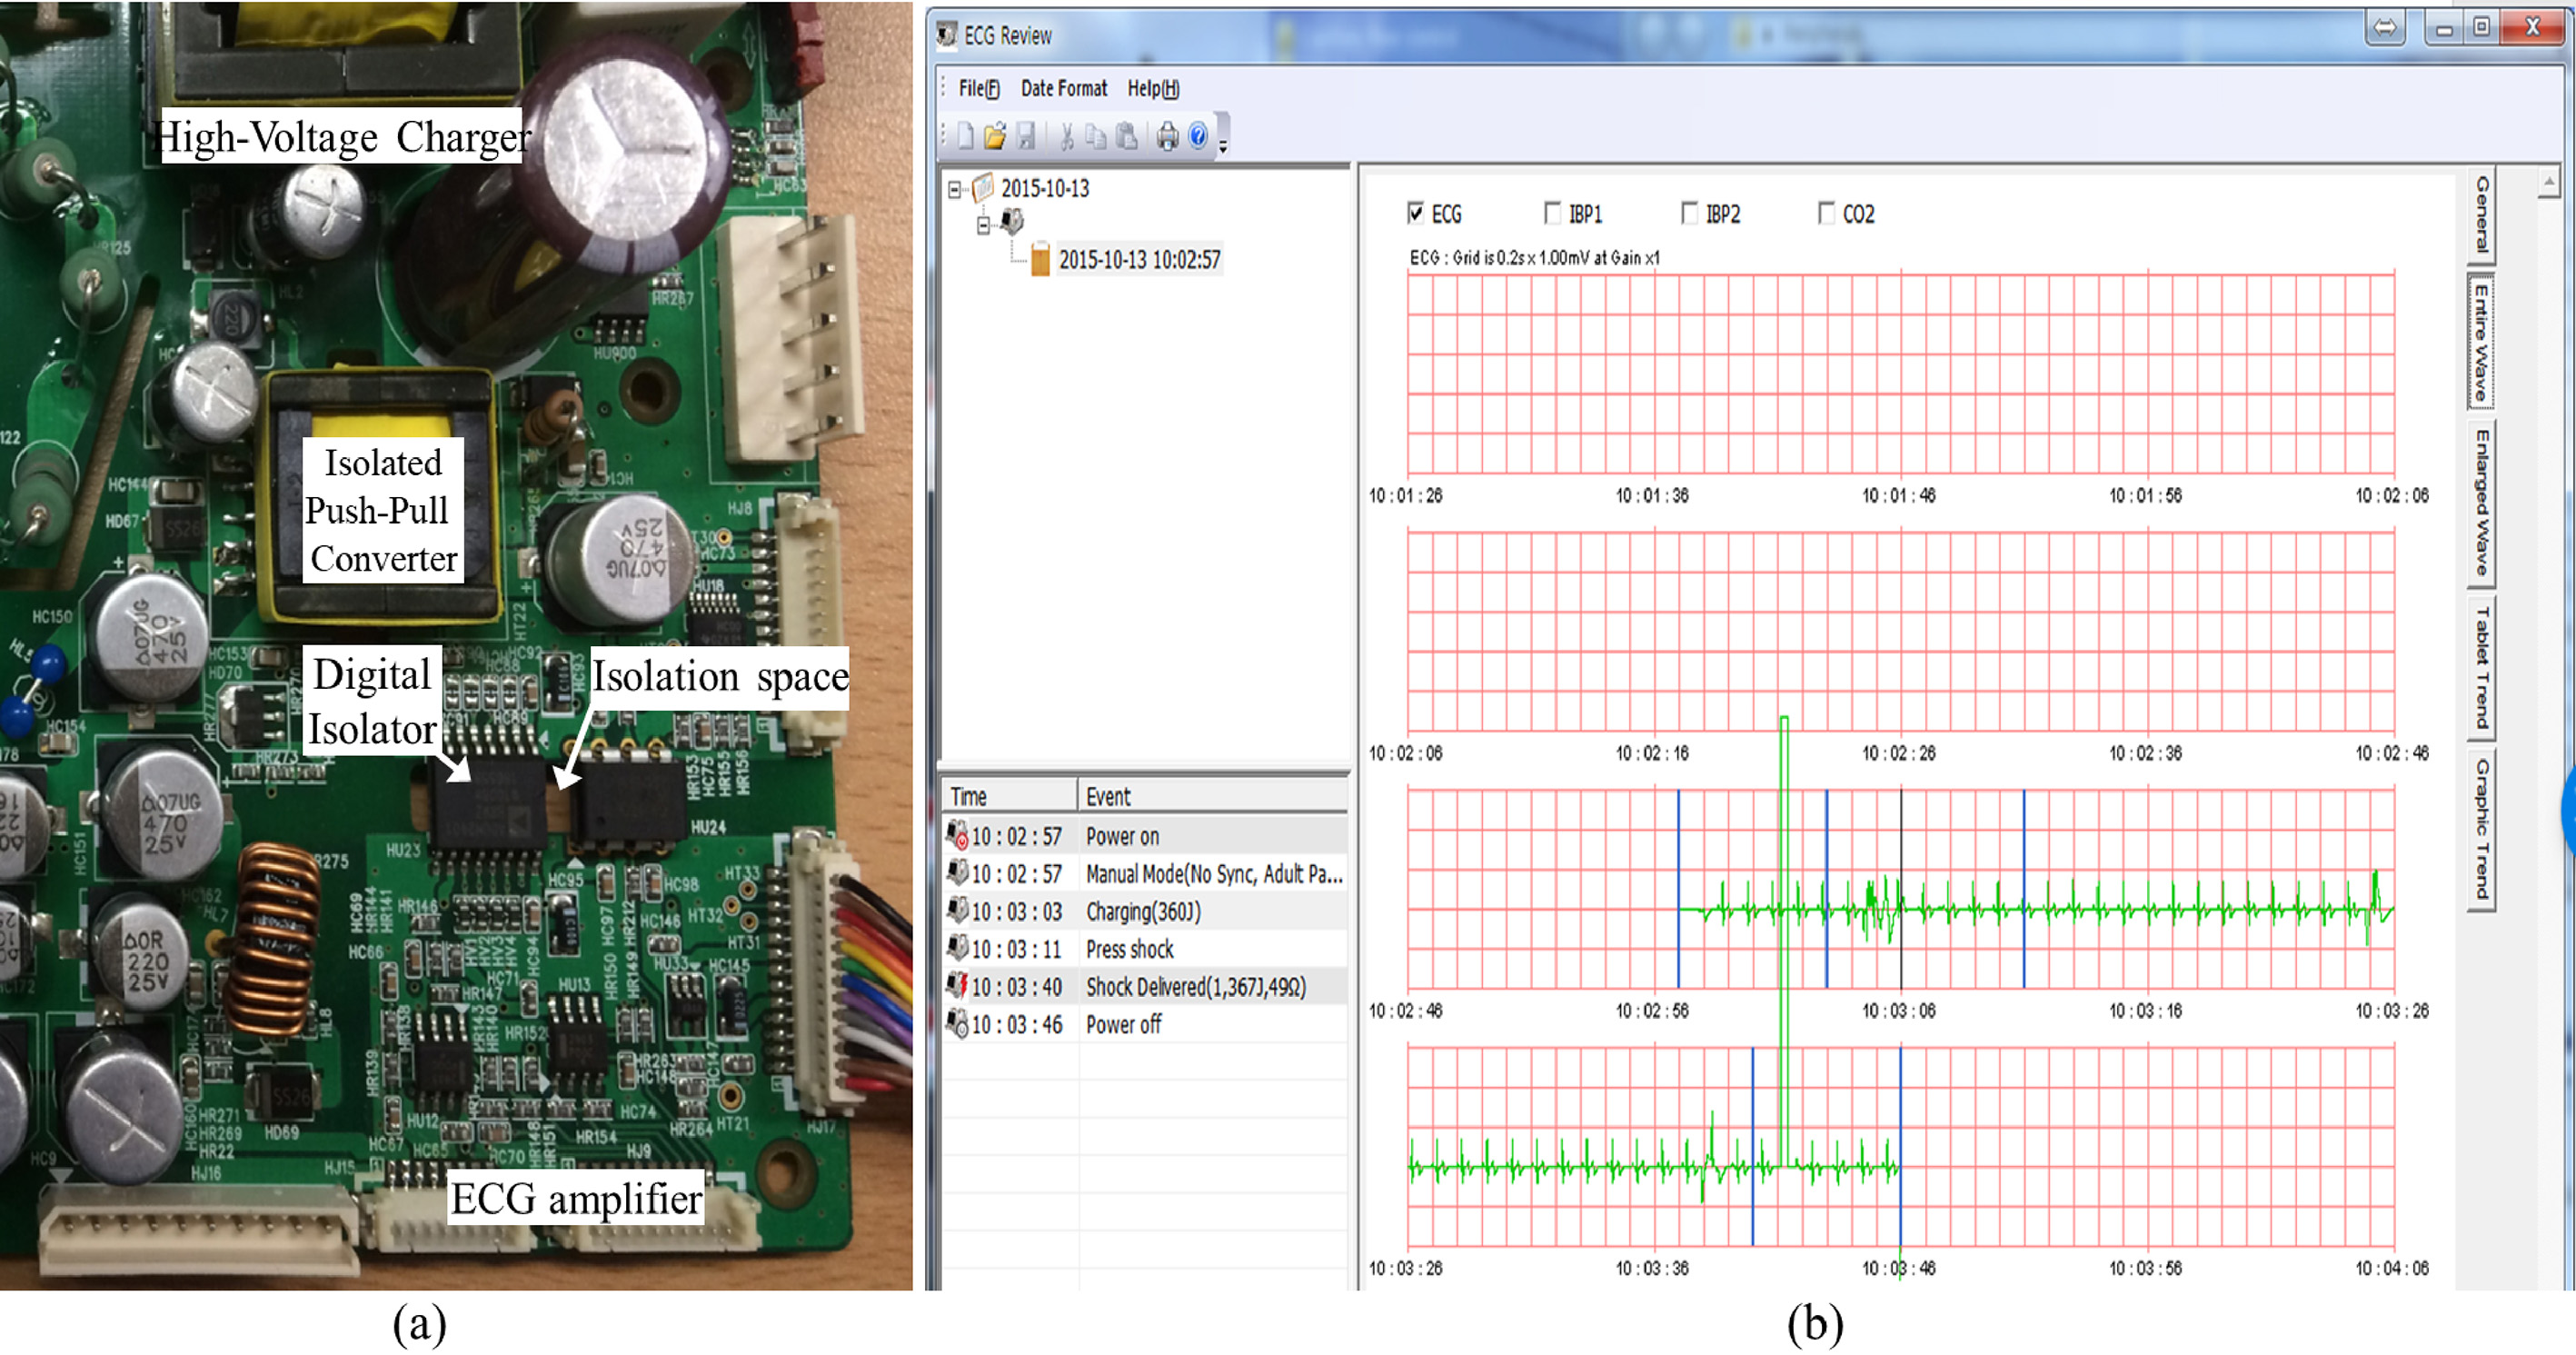
A circuit with the proposed method and data plotting viewer. a. Actual view of the proto-type circuit, b. Custom-made electrocardiogram viewer.
3.Results
An actual implemented circuit is shown in Fig. 4A. The size was approximately 6 cm
Figure 5.
Comparison of the ECG signal before and after application of the isolation barrier. a. Before the proposed method, False-Positive case occurred, b. Electrical noise was not induced and the diagnosis algorithm was operating normally.
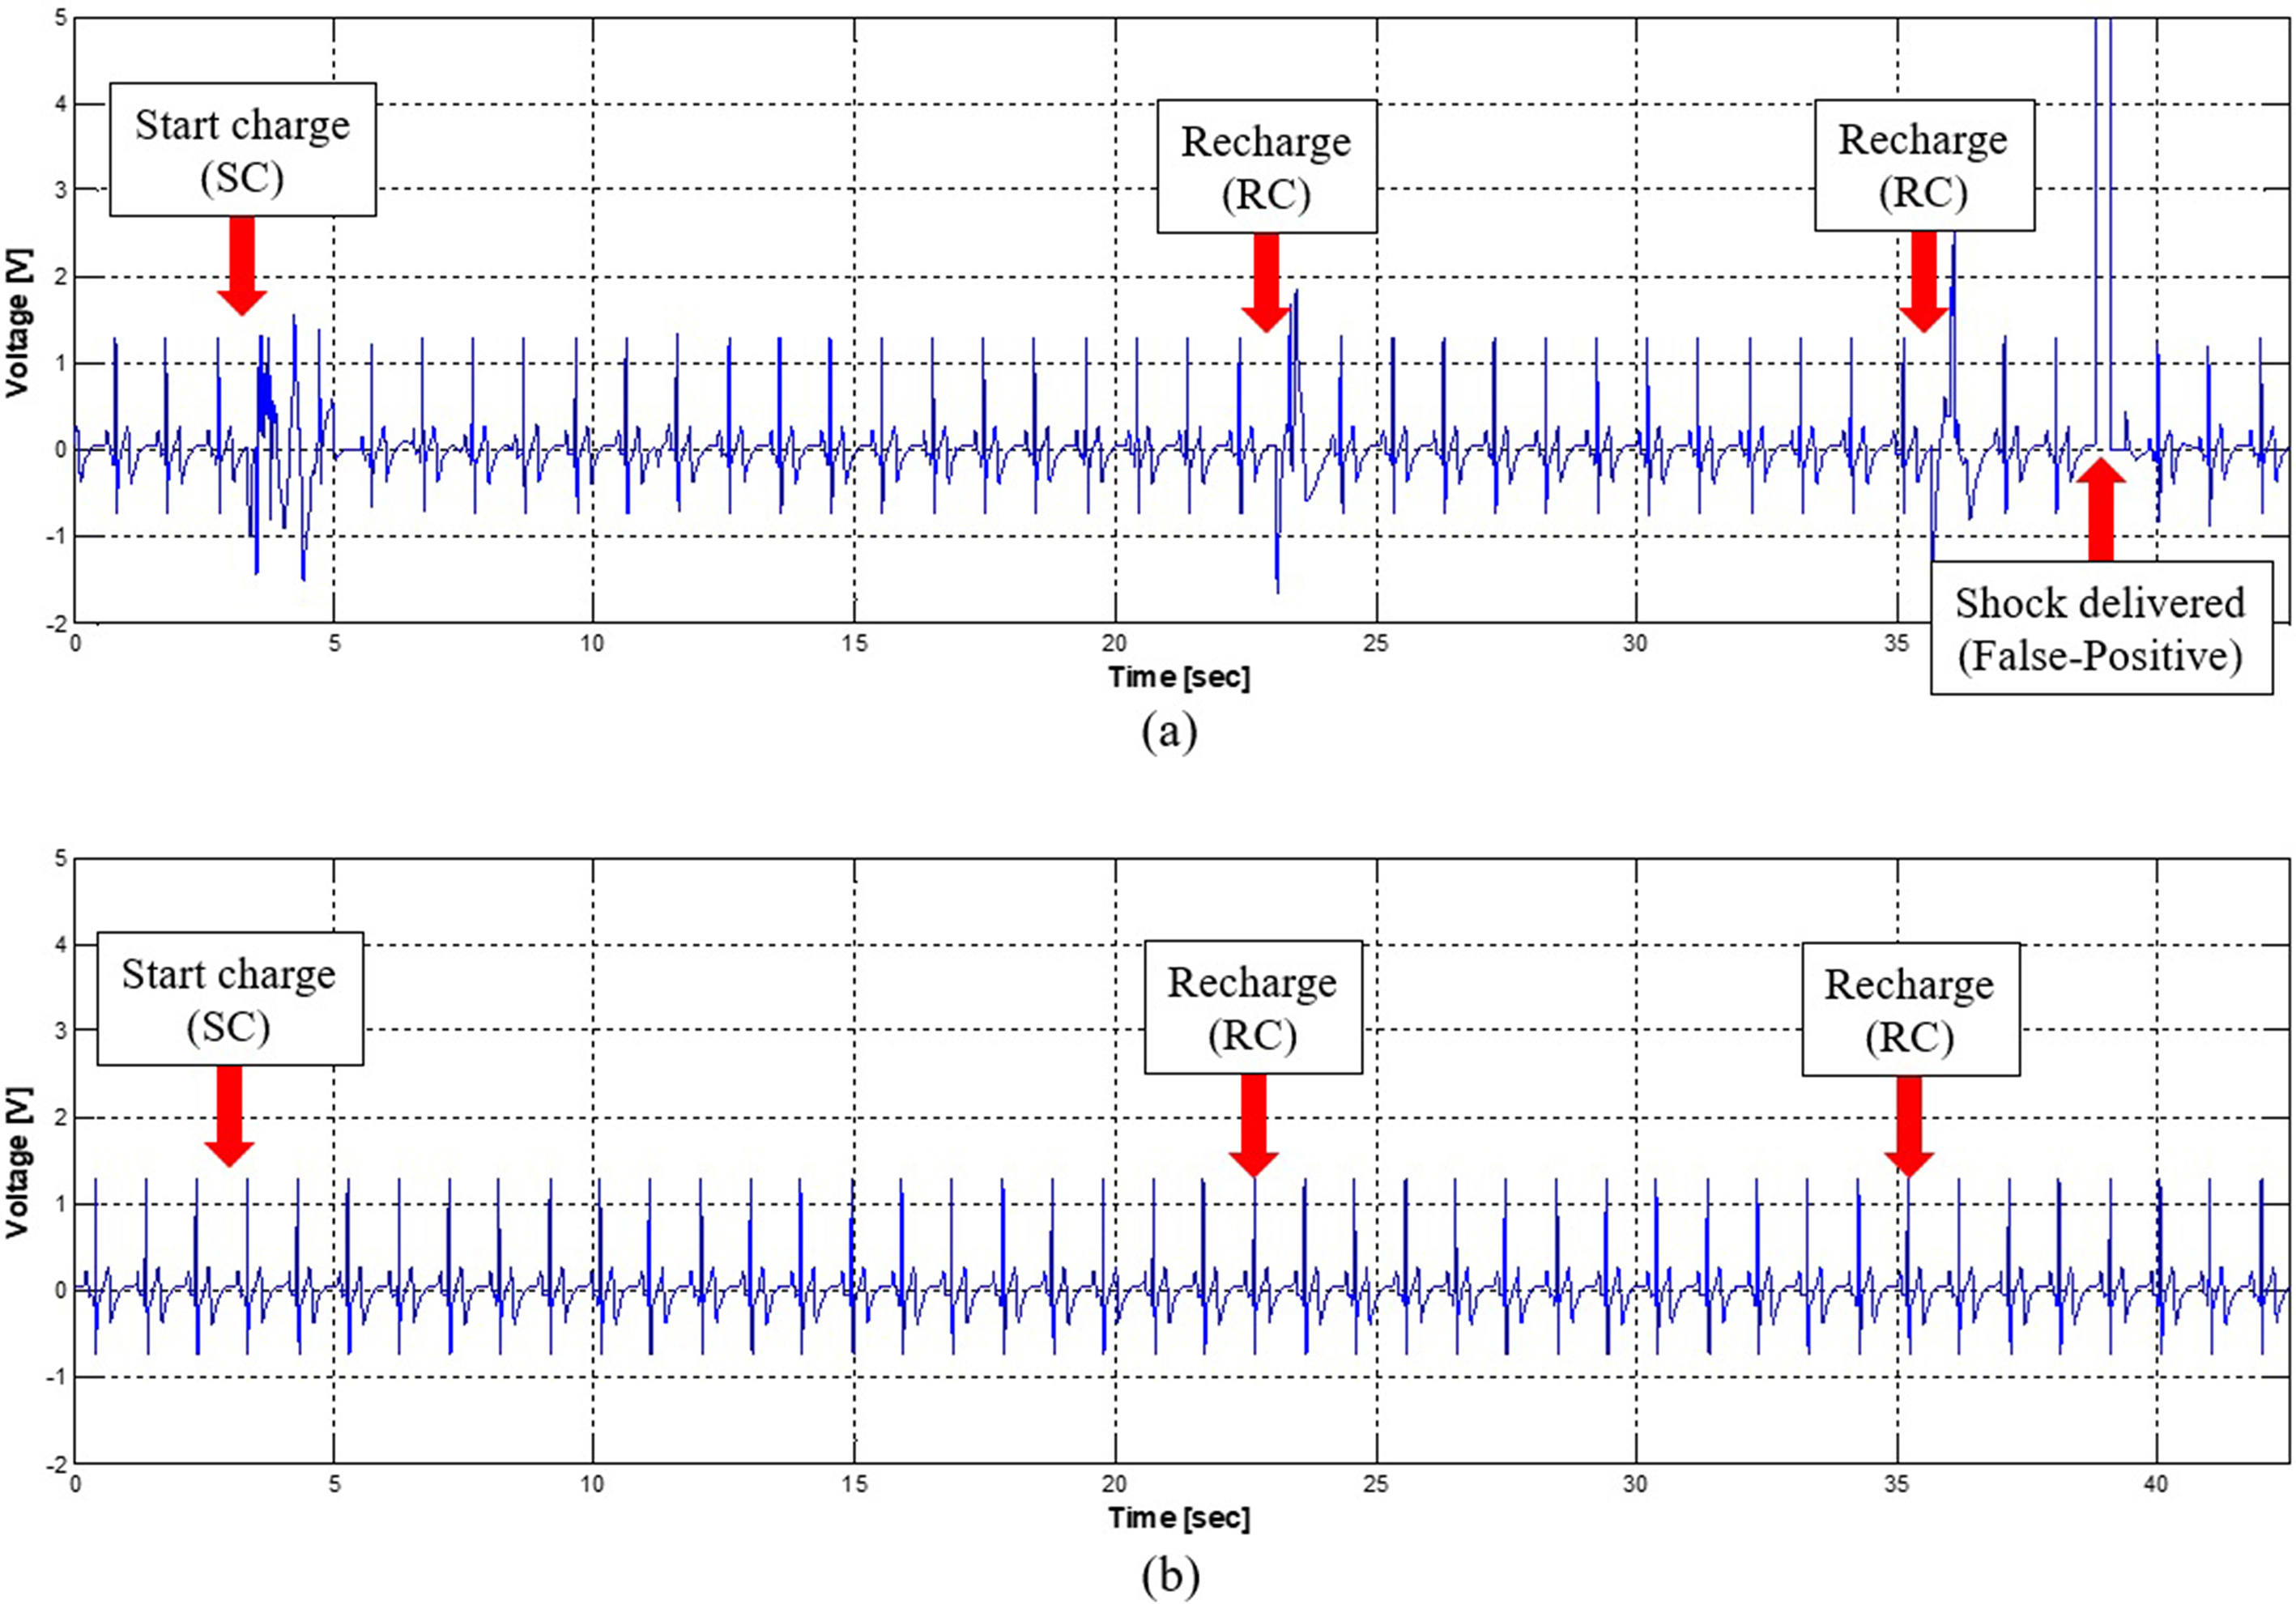
Figure 5 shows the results of the ECG before and after implementation of galvanic isolation. Before applying the galvanic isolation, the distorted ECG signal existed for both the SC and RC conditions. The distortion was more severe for the SC situation when compared to the RC state because of the voltage drops of the main power supply and the surge current flowing into the uncharged capacitor. Therefore, the diagnosis algorithm for defibrillation makes decision regarding the delivery of the shock energy to a dummy patient even in a normal ECG situation (Fig. 5A). This false-positive result could be fatal since this type of energy delivery causes fibrillation even for a normal heart. After implementing the galvanic isolation, irregularity in the ECG waveform significantly decreased (Fig. 5B) and the false-positive conditions did not arise. In order to verify the performance of the proposed method, one SC and five RCs were configured as one charge-cycle and it repeated 50 times. In each experiment, the patient simulator was used to generate the normal ECG signal and the false-positive condition was recorded during the experiment. Before applying the proposed method, 4 out of 50 false-positive conditions occurred (error rate is 8%) and energy was delivered to phantom load. However, after application it did not occur at all (error rate is 0%).
4.Conclusions
Defibrillators are medical devices for cardiac-related emergencies, and research on defibrillation has been conducted for a long time in various fields [14, 21, 22]. With the development of technology, an automated external defibrillator (AED) that can be used without a physician has been developed. Its advantage is that it can be installed not only in public places but also in homes, so it is possible to cope even when there is no medical doctor when a heart attack occurs. This has led to an increase in the AED market and a growing number of medical device companies [16]. The market became high-quality and increased in terms of functionality and miniaturization, requirements for specifications such as improved resuscitation rate through shortening ECG analysis time and improving accuracy, fast charging time, and power efficiency [6, 24]. In order to reduce the charging time, a large amount of power is instantaneously used to charge the energy. Currently, there is a problem that electrical noise is generated and is induced in the biosignal. Previous work used methods that did not utilize biosignals acquired in the SC and RC phases for analysis. However, since the time for noise in each of the SC and RC phases was less than two seconds, additional time was required for the analysis of the biosignals [1]. Therefore, previous studies have developed various software algorithms. However, these methods could only be performed in large enterprises because of cost, verification and certification time, and difficulty in hiring outstanding software engineers.
In this study, we proposed a simple method to remove the irregularity of an electrocardiogram signal during a transient state of the power supply for a defibrillator. By applying galvanic isolation between the main operation unit and the ECG unit, the distortion of the biosignal during the transient state was nearly eliminated. The results of the proposed method are summarized as follows. First, it is confirmed that the design of the galvanic isolation and separated ground of the circuit can remove the noise of the biosignals measured in the AED. Therefore, cost and time for development can be reduced. Second, although this study is about 17% larger than the original AED product, it can be sufficiently overcome by sophisticating the design of the PCB, changing to one-chip ECG frontend circuit, and a compact design of the power supply for driving secondary side. Therefore, it is expected that this solution will be widely used in small businesses and small and medium-sized medical manufacturing companies.
This study had certain limitations. First, since the experiments were verified by the environment using the patient simulator, it is different from the actual use environment. Therefore, it is necessary to confirm the effectiveness of the proposed method through large animal experiments. Second, the system was validated by making a small sample on a laboratory scale. In order to confirm the stability of the operation, it is necessary to build several units on a pilot scale and verify the performance in various temperature and humidity conditions.
Acknowledgments
This paper was written as part of Konkuk University’s research support program for its faculty on sabbatical leave in 2016. The authors thank MEDIANA Corp. for supporting the instrument and AED equipment.
Conflict of interest
None to report.
References
[1] | Fallavollita JA, Heavey BM, Luisi AJ, et al. Regional myocardial sympathetic denervation predicts the risk of sudden cardiac arrest in ischemic cardiomyopathy. J Am Coll Cardiol. (2014) ; 63: (2): 141–149. |
[2] | Kim JH, Malhotra R, Chiampas G, et al. Cardiac arrest during long-distance running race. N Engl J Med. (2012) ; 366: : 130–140. |
[3] | Sanatani S, Wilson G, Smith CR, et al. Sudden unexpected death in children with heart disease. Congenit Heart Dis. (2006) ; 1: (3): 89–97. |
[4] | Weisfeldt ML, Becker LB. Resuscitation after cardiac arrest: A 3-phase time-sensitive model. JAMA. (2002) ; 288: (23): 3035–3038. |
[5] | Stiell IG, Wells GA, Field BJ, et al. Improved out-of-hospital cardiac arrest survival through the inexpensive optimization of an existing defibrillation program: OPALS study phase II. Ontario prehospital advanced life support. JAMA. (1999) ; 281: (13): 1175–1181. |
[6] | Sandroni C, Ferro G, Santangelo S, et al. In-hospital cardiac arrest: Survival depends mainly on the effectiveness of the emergency response. Resuscitation. (2004) ; 62: (3): 291–297. |
[7] | Comilla S, Mary AMR, Jason D, et al. Predictors of survival from out-of-hospital cardiac arrest: A systematic review and meta-analysis. Circulation. (2010) ; 3: (1): 63–81. |
[8] | Hasegawa K, Hiraide A, Chang Y, Brown DFM. Association of prehospital advanced airway management with neurologic outcome and survival in patients with out-of-hospital cardiac arrest. JAMA. (2012) ; 309: (3): 257–266. |
[9] | Kudenchuk PJ, Redshaw JD, Stubbs BA, et al. Impact of changes in resuscitation practice on survival and neurological outcome after out-of-hospital cardiac arrest resulting from nonshockable arrhythmias. Circulation. (2012) ; 125: (14): 1787–1794. |
[10] | Youness H, Halabi TA, Hussein H, et al. Review and outcome of prolonged cardiopulmonary resuscitation. Crit Care Res Pract. (2016) ; 2016: : 7384649. |
[11] | Conrad KM, Reichelt PA, Lavender SA, et al. Designing ergonomic interventions for EMS workers: Concept generation of patient-handling devices. Appl Ergon. (2008) ; 39: (6): 792–802. |
[12] | González-Otero DM, Ruiz J, Ruiz de Gauna S, et al. A new method for feedback on the quality of chest compressions during cardiopulmonary resuscitation. Biomed Res Int. (2014) ; 865967: : 1–7. |
[13] | Diepen SV, Girotra S, Abella BS, et al. Multistate 5-Year initiative to improve care for out-of-hospital cardiac arrest: Primary results from the heart rescue project. J Am Heart Assoc. (2017) ; 6: (9): 1–10. |
[14] | Kim GW, Lee DK, Kang BR, et al. A multidisciplinary approach for improving the outcome of out-of-hospital cardiac arrest in South Korea. Eur J Emerg Med. (2019) ; doi: 10.1097/MEJ.0000000000000612. |
[15] | Yoon H, Kwon Y, An J, et al. Main outcomes of the sudden cardiac arrest survey 2006 to 2016. Clin Exp Emerg Med. (2019) ; 6: (2): 183–188. |
[16] | Nagao K, Nonogi H, Yonemoto N, et al. Duration of prehospital resuscitation efforts after out-of-hospital cardiac arrest. Circulation. (2016) ; 133: (14): 1386–1396. |
[17] | Hansell AL, Blangiardo M, Fortunato L, et al. Aircraft noise and cardiovascular disease near Heathrow airport in London: Small area study. BMJ Open. (2013) ; 347: : 1–10. |
[18] | Kanz KG, Kay MV, Biberthaler P, et al. Susceptibility of automated external defibrillators to train overhead lines and metro third rails. Resuscitation. (2004) ; 62: (2): 189–198. |
[19] | Elrod JB, Merchant R, Daya M, et al. Public health surveillance of automated external defibrillators in the USA: Protocol for the dynamic automated external defibrillator registry study. BMJ Open. (2017) ; 7: (3): e014902. |
[20] | DeLuca LA, Simpson A, Beskind D, et al. Analysis of automated external defibrillator device failures reported to the food and drug administration. Ann Emerg Med. (2012) ; 59: (2): 103–111. |
[21] | Danielis M, Chittaro M, Monte AD, et al. A five-year retrospective study of out-of-hospital cardiac arrest in a north-east Italian urban area. Eur J Cardiovasc Nurs. (2018) ; 18: (1): 67–74. |
[22] | Andreão RV, Dorizzi B, Boudy J. ECG Signal analysis through hidden markov models. IEEE Trans Biomed Eng. (2006) ; 53: (8): 1541–1549. |
[23] | Lyon A, Mincholé A, Martínez JP, et al. Computational techniques for ECG analysis and interpretation in light of their contribution to medical advances. J R Soc Interface. (2018) ; 15: (138): 20170821. |
[24] | Schläpfer J, Wellens HJ. Computer-Interpreted electrocardiograms: Benefits and limitations. J Am Coll Cardiol. (2017) ; 70: (9): 1183–1192. |
[25] | Rahman M, Nasor M. An algorithm for detection of arrhythmia. Int J Biol Eng. (2012) ; 2: (5): 44–47. |
[26] | Kim SW, Chou PH. Energy harvesting by sweeping voltage-escalated charging of a reconfigurable supercapacitor array. In: Proceedings of the 17th IEEE/ACM International Symposium on Low-power Electronics and Design (ISLPED) 2011. San Francisco, USA: IEEE; (2011) . pp. 235–40. |

