
Assessment of mental workload based on multi-physiological signals
Abstract
BACKGROUND:
Mental workload is one of the contributing factors to human errors in road accidents or other potentially adverse incidents.
OBJECTIVE:
This research probes the effects of mental workload on the electroencephalographic (EEG) and electrocardiogram (ECG) of subjects in visual monitoring tasks, based on which a comprehensive evaluation model for mental workload is established effectively.
METHODS:
Three degrees of mental workload were obtained by monitoring tasks with different levels of difficulty. 20 healthy subjects were selected to take part in the research.
RESULTS:
The subjective scores showed a significant increase with the increase of task difficulty, meanwhile the reaction time (RT) increased and the accuracy decreased significantly, which proved the validity of three degrees of mental workload induced. For the EEG parameters, a significant decrease of
CONCLUSION:
This study demonstrates that the proposed algorithm can be applied to mental workload monitoring.
1.Introduction
The modern man-machine system is highly automated with the development and application of technology. Therefore, cognitive monitoring tasks are more and more common in systems, especially in the actual production, power plant control, transportation, aerospace and other fields of work. As the amount of information faced and processed by operators increases dramatically, the roles of humans in the human-computer system gradually begins to turn to monitoring and making decisions. It has been shown that 80% of the information is obtained through vision, so the operators must be highly focused, and thus bear great mental workload, which may easily cause safety accidents. Therefore, the study on the assessment of mental workload draws great attention.
There is no consistent of definition for mental workload, and the definitions vary from field to field. Eggemeier et al. [1] indicated that mental workload referred to the information processing ability of an operator to complete a specific task in a man-machine interaction system. The assessment of mental workload is very important and meaningful in ergonomic domain. Mehler [2] thought that mental workload was the load imposed limited brain resources by a specific task. Some scholars proposed that mental workload described the total amount of information that the brain could process in a certain time, namely rate of information processing [3, 4]. It is considered that mental workload is related to task requirement, time pressure, individual ability, effort and performance [5]. There are three principal measurements for the evaluation of mental workload: subjective measurement, behavior performance measurement and physiological measurement [6]. Questionnaires are the main forms of subjective measurement, such as Cooper-Harper, SWAT, and NASA-TLX [7, 11]. However, the disadvantage of subjective evaluation is that the measurement results are easily affected by differences between individuals, such as memory loss and cultural difference. Performance evaluation mainly includes primary task measurement and secondary task measurement based on indicators as reaction time (RT) and accuracy. However, the comparison of workloads between different environments is unworkable by primary task measurement. Meanwhile, it is easy to change the priority of primary and secondary tasks and lead to wrong conclusions in secondary task measurement if the test design is improper. In comparison to the above two measurements, the advantage of physiological evaluation is that it can measure the workload degree directly and continuously. The electroencephalogram (EEG) and electrocardiogram (ECG) are the two mostly used signals for the physiological evaluation of mental workload [12, 14].
Numerous experiments have been conducted in the past to quantify the effects of mental workload on the EEG and ECG, but the results have been mixed. Previous studies showed that alpha power varied with mental workload, as it is associated with arousal level, idling and cortical inhibition [15, 16]. Theta is shown to be mediated by intellectual efforts and task demands [17, 18]. In addition, beta also proved to be associated with mental workload [19, 20]. ECG is another physiological signal that can quantitatively reflect the effect of mental workload on the human body [21, 22]. It was shown that the heart rate (HR) increased when the mental workload increased [23]. Meanwhile, the HRV proved to respond more quickly than HR to changes in momentary workload, i.e. the HRV decreased as the mental workload increased [24]. However, the challenge for physiological measurement is its reliability, for it is assumed that the changes of mental workload are the only factors causing changes of physiological indicators, but in fact, many other factors unrelated to mental workload may also cause these changes. Another limitation is that different work takes up different mental resources and thus produce different physiological responses, i.e. one physiological indicator is applicable to one type of work and may not be applicable to another type of work.
Considering the multi-dimension characteristics of mental workload, single measurement for mental workload is limited. In contrast with previous studies, multiple measurements were combined to study mental workload in the current study, i.e. various measurements complemented each other and avoided their own shortcomings. Along with subjective and performance measurements, effective EEG and ECG characteristic evaluation indicators of mental workload were obtained and an effective high-dimensional vector was constructed. PCA was used to reduce the dimension of the data and a new set of samples was formed, based on which the method of SVM was subsequently used to establish an effective model for evaluating mental workload.
2.Materials and methods
2.1Subjects
Twenty healthy and young males (Mean age
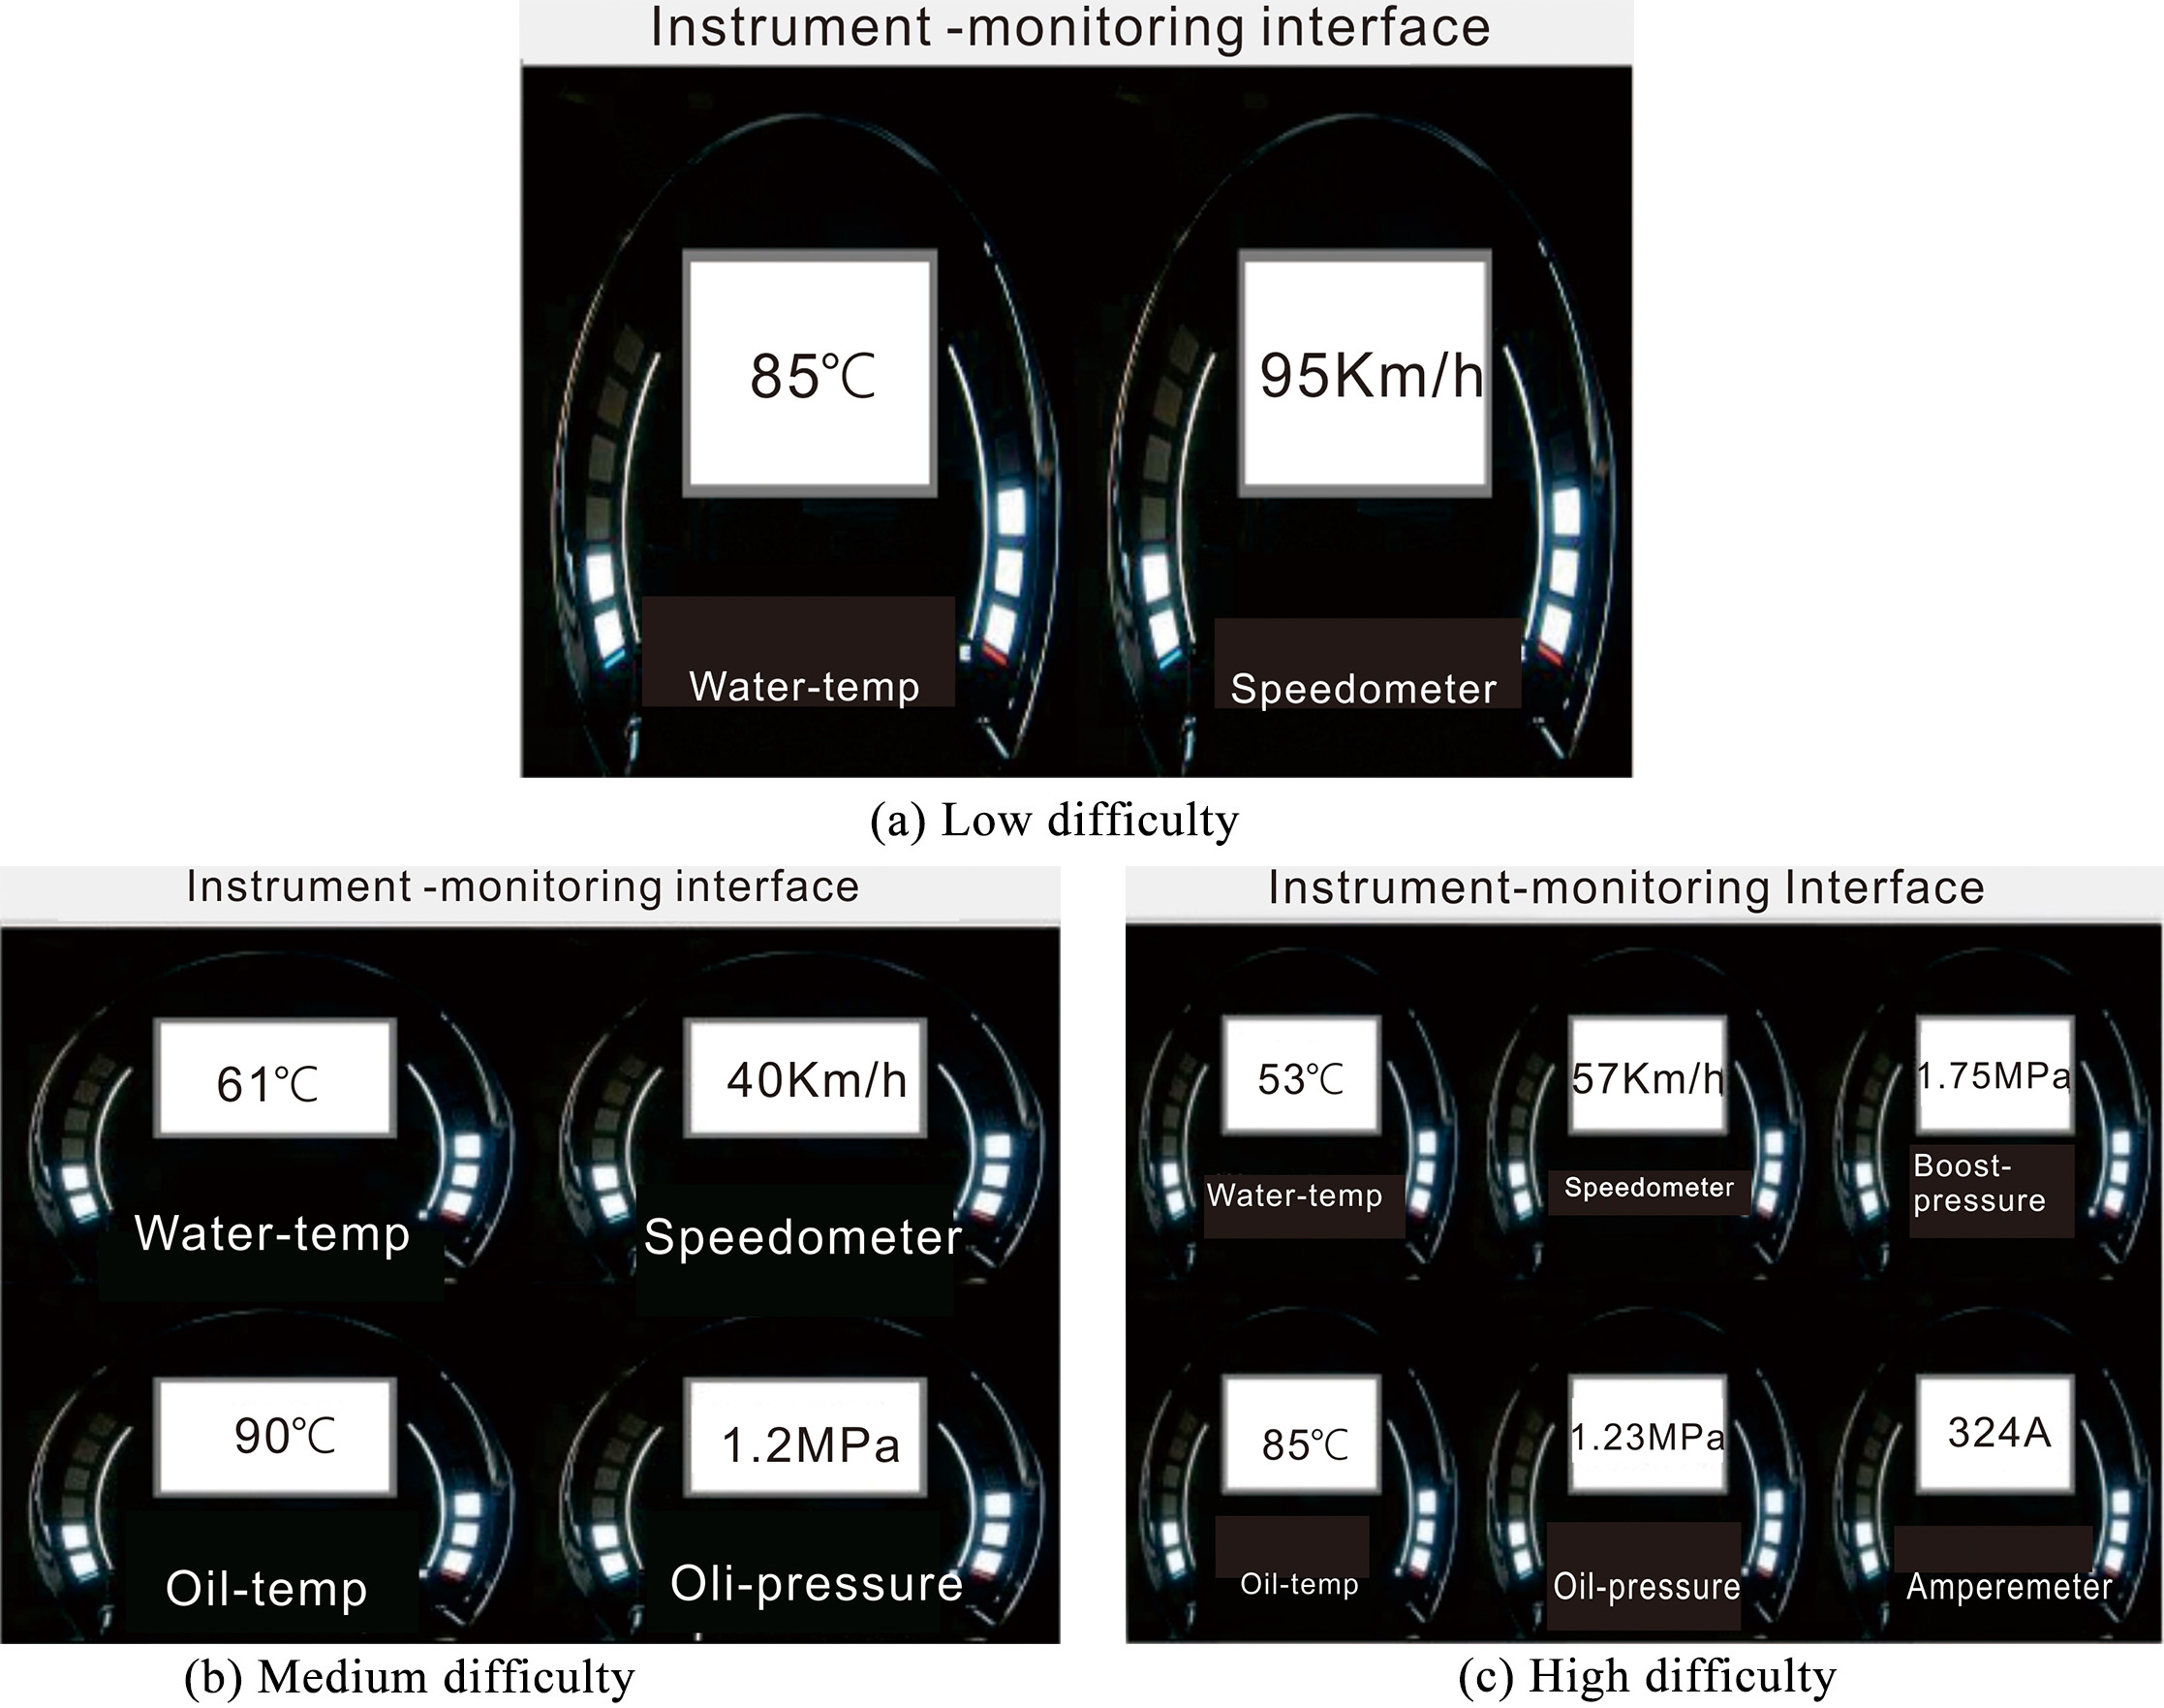
Figure 1.
Interfaces of instrument-monitoring tasks with different difficulties.
2.2Task design
The brain thinking mechanism, especially the process of information processing, thinking and decision-making is analyzed by studying the process of human-computer interaction in modern systems and extracting the corresponding cognitive model. According to the complex information processing process, the monitoring task can be divided into three phases: perceiving, judging and decision-making, and executing. Instrument monitoring is one of the most typical monitoring tasks, which covers the three phases fully. According to the attention resource theory, when people are engaged in monitoring work, the more information sources they need to perceive, the more attention resources they will allocate [25]. Mental workload is the extent of attention resources occupied of the person at work. Therefore, an instrument monitoring software with the amount of instruments settable was designed to induce three different levels of mental workload. Figure 1a–c show the interfaces for the low difficulty (L), medium difficulty (M) and high difficulty (H) instrument-monitoring tasks respectively. Each task is composed of multiple trials, each trial is presented for 6,000 ms, and, at most, one target appears with one instrument parameter beyond the normal range (ratio of target stimulus to non-target stimulus is 1:1). The normal ranges of instrument parameters, and the corresponding operations when they are out of the range are decided in advance. During the experiment, the subjects are required to observe and judge whether the corresponding parameters of the instruments on the screen are in normal range and if not, they are asked to respond with the corresponding button as quickly and correctly as possible, or otherwise to respond by pressing the “spacebar” button. The software records the RT and accuracy during the experiment automatically.
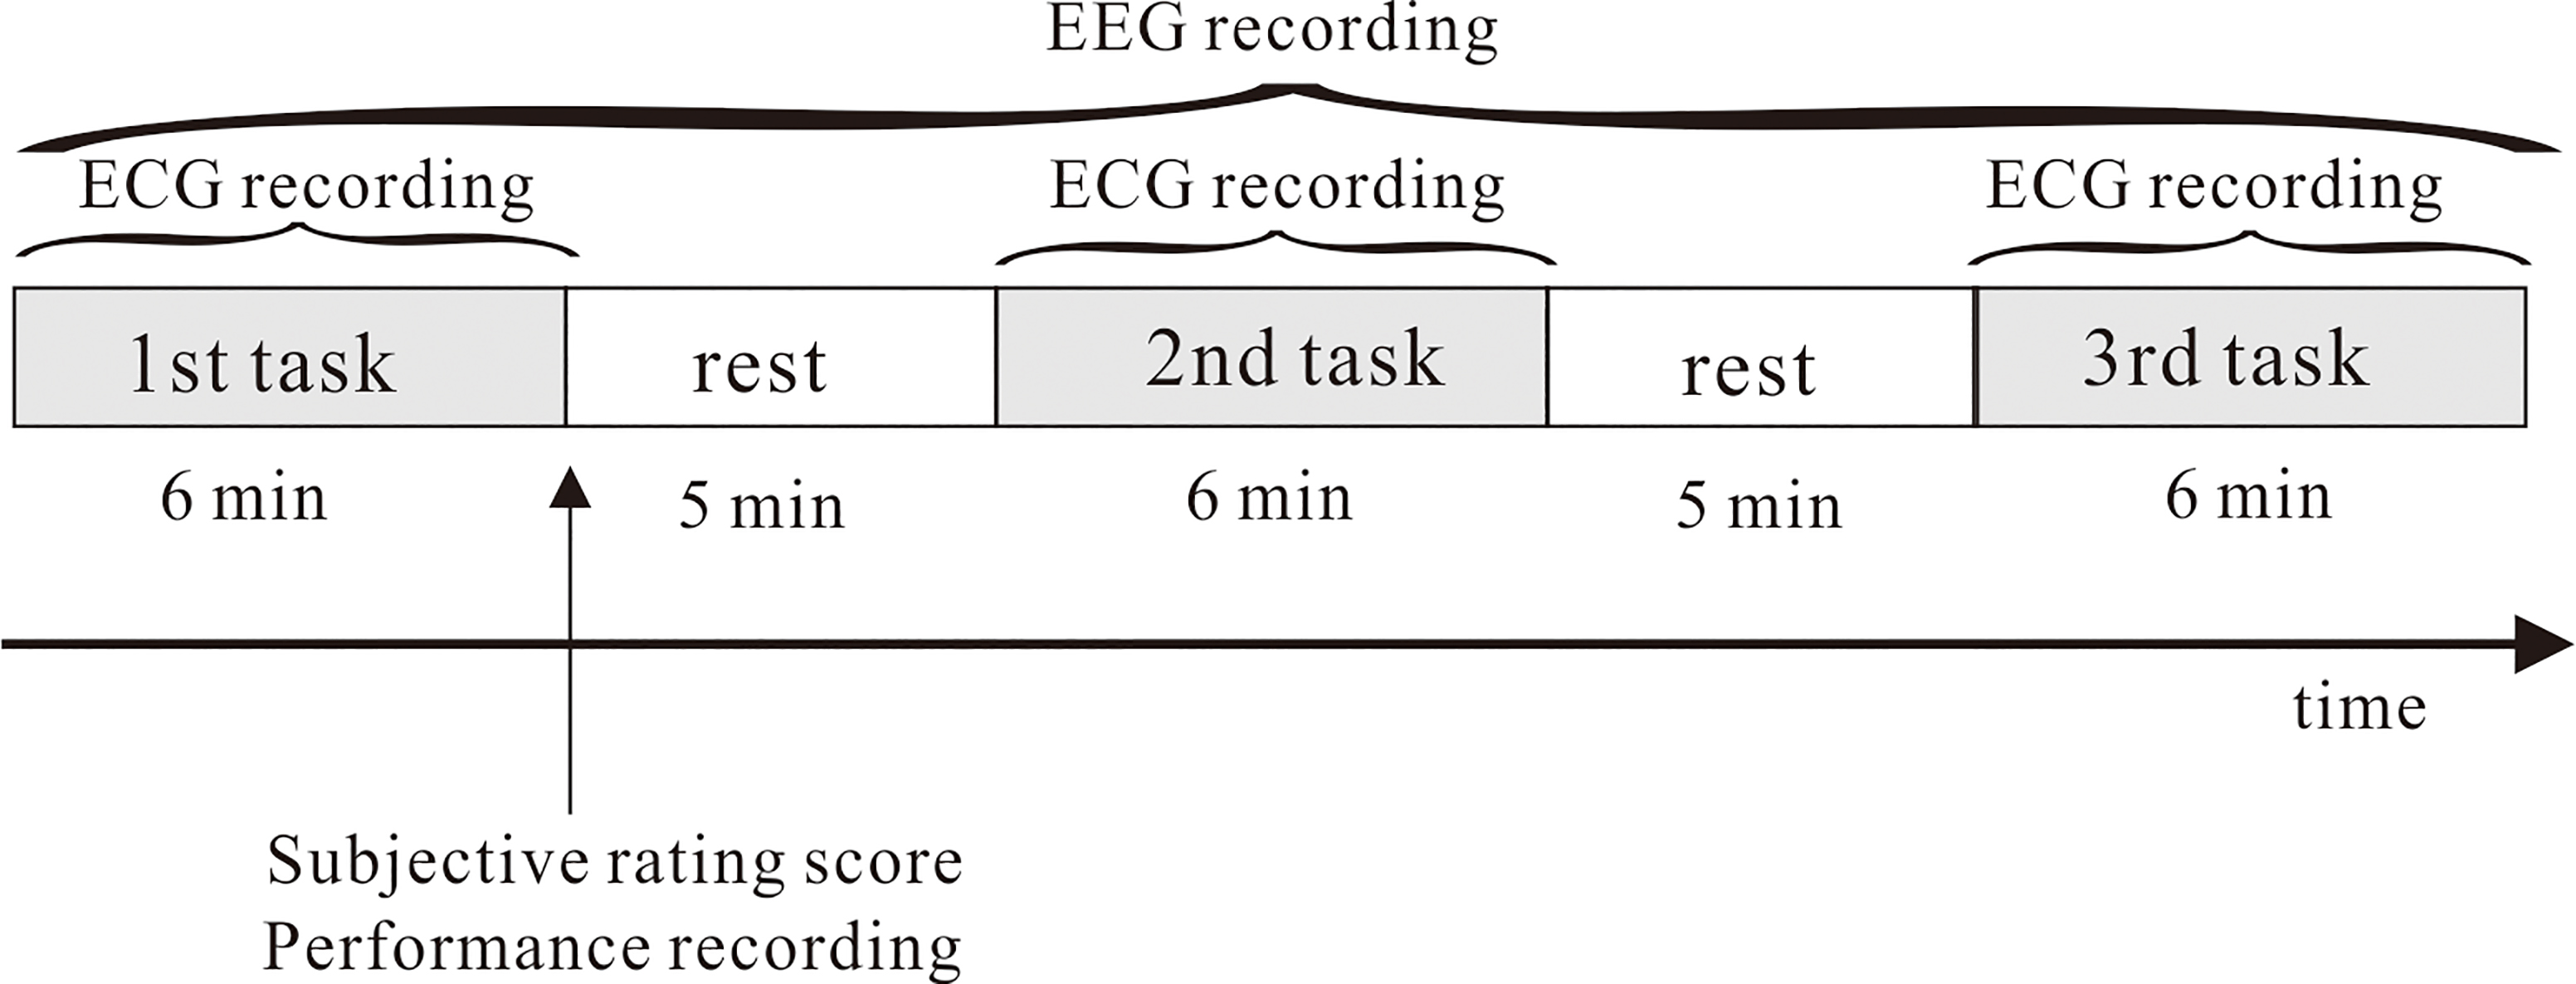
Figure 2.
Experiment procedure.
2.3Experiment procedure
The experiment was carried out in an electrically shielded and soundproof room. The tasks were shown on a high-resolution computer 70 cm in front of the subjects. Figure 2 shows the experiment procedure, which is consisted by three tasks with different difficulties. To avoid the influence of single task sequence on experiment results, the sequence of three tasks with different difficulties was shuffled and designed according to Latin square design (e.g. the task sequence for the first subject was L-M-H, and then the sequence for the second subject should be M-H-L, and so on). Each task lasted for 6 min. To avoid the effect of fatigue induced by continuous task execution on experimental results, subjects were required to take a break for 5 minutes after completing each task, and then proceeded with the next task. EEG and ECG signals were recorded during the tasks, and the software recorded RT and accuracy of each task automatically. Meanwhile subjects were asked to score their workload levels according to subjective evaluation scale shown in Table 1 after completing each task.
Table 1
Subjective evaluation scale for mental workload
| Descriptions for 1 | Descriptions for 2 | Score |
|---|---|---|
| Difficulty level is acceptable | Very easy | 1 |
| Easy | 2 | |
| Normal | 3 | |
| Difficulty level is a little high | Low but annoying | 4 |
| Medium and objectionable | 5 | |
| Very objectionable but endurable | 6 | |
| Difficulty level is higher | Requiring extreme effort to reduce the error to a medium level | 7 |
| Requiring extreme effort to avoid countless mistakes | 8 | |
| Requiring extreme effort to complete task, but still with countless mistakes | 9 | |
| Difficulty level is highest | Unable to complete the task | 10 |
2.4Physiological signal recording and processing
2.4.1EEG
The EEG signal was amplified and recorded with a Brain Products 32-channel System (ANT, Germany). This system consisted of 32 Ag/AgCl active electrodes which are located on a scalp according to the International 10–20 System. The vertical and horizontal channels of electrooculograms were recorded. Linked-mastoid (M1 and M2) were used as reference electrodes. The electrode impedance was controlled no more than 10 k
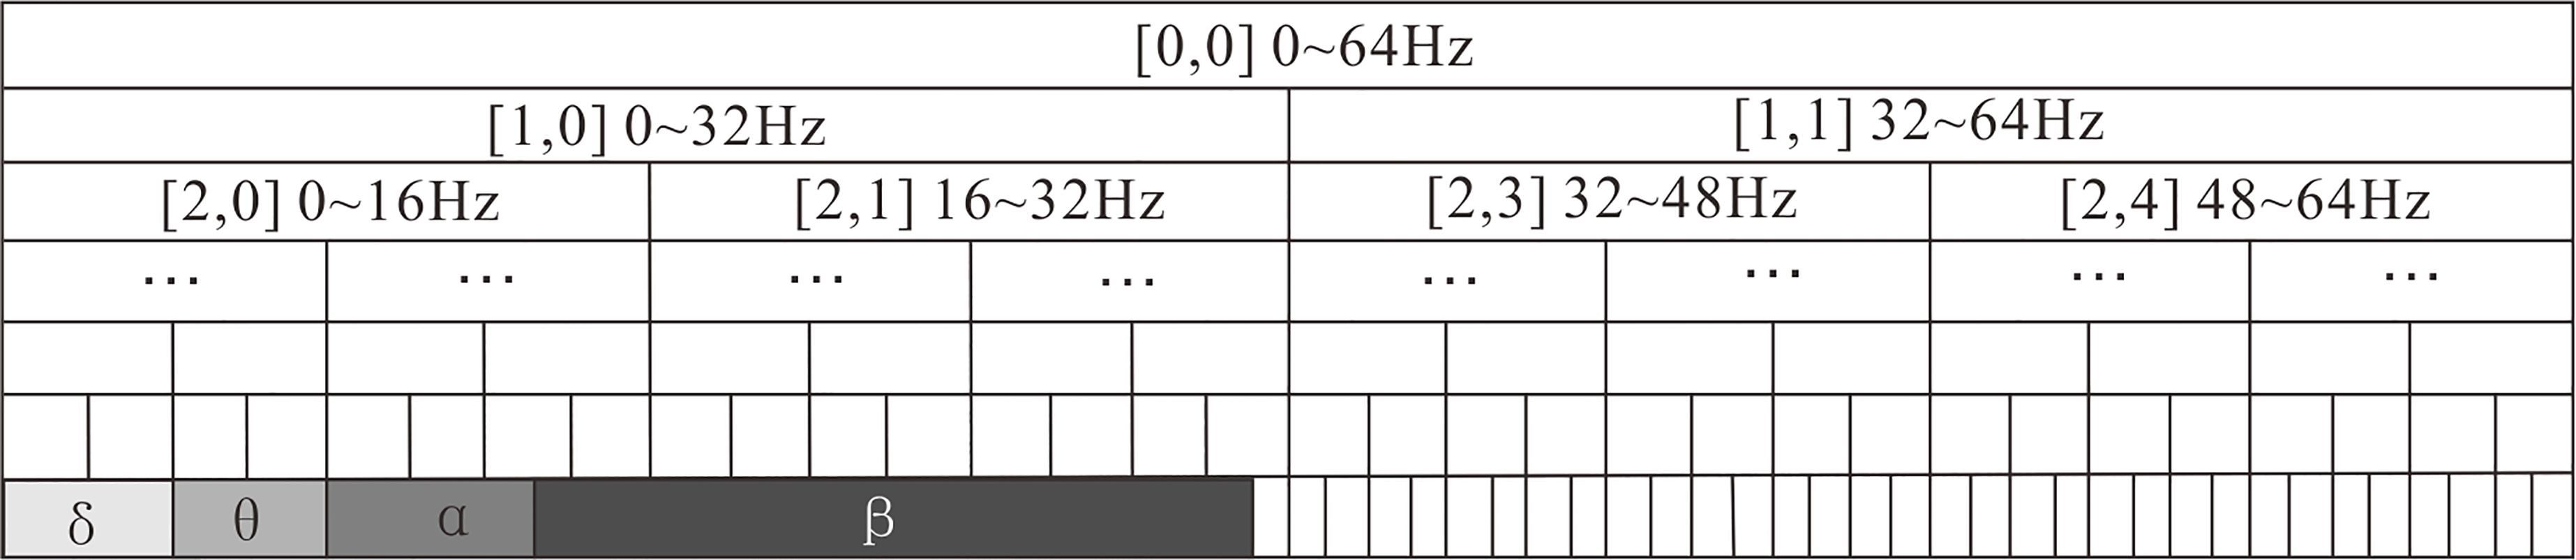
Considering different brain regions associated with different cognitive functions, 12 channels EEG signals from 4 brain regions, i.e. Frontal (F3, Fz, and F4), Central (C3, C4, and Cz), Parietal (P3, P4, and Pz), and Occipital (O1, O2, and Oz), were analyzed in the current study. Since there were many artifacts in the raw EEG signals, of which the major contributor was ocular artifacts, Independent Component Analysis (ICA) was adopted to suppress EEG artifacts in this study. Wavelet Packet Transform (WPT) was chosen to detect EEG rhythms
Figure 3.
Schematic diagram of wavelet packet decomposition.
2.4.2ECG
The ECG data were obtained through the Breath Wear-ECG device (wearable wireless heart patch). Six channels were recorded by placing the electrodes on the designated locations of body. Raw ECG signals were digitalized with a sampling rate 1000 Hz, and filtered by a low pass Gaussian filter with cut-off frequency of 40Hz, while IIR Zero-Phase Filter was used to attenuate baseline wander with a cutoff frequency of 0.5 Hz. Three methods, that is, time domain analysis, frequency domain analysis and nonlinear analysis were used to process the preprocessed ECG signals. The HRV time domain parameters (Mean RR, SDNN, SDANN, RMSSD, SDNNI, NN50 and PNN50), frequency domain parameters (LF_norm, HF_norm, LF/HF) and SampEn were chosen in the current study as the assumed indicators of mental workload for the later analysis. These parameters were obtained through the package software of the ECG device.
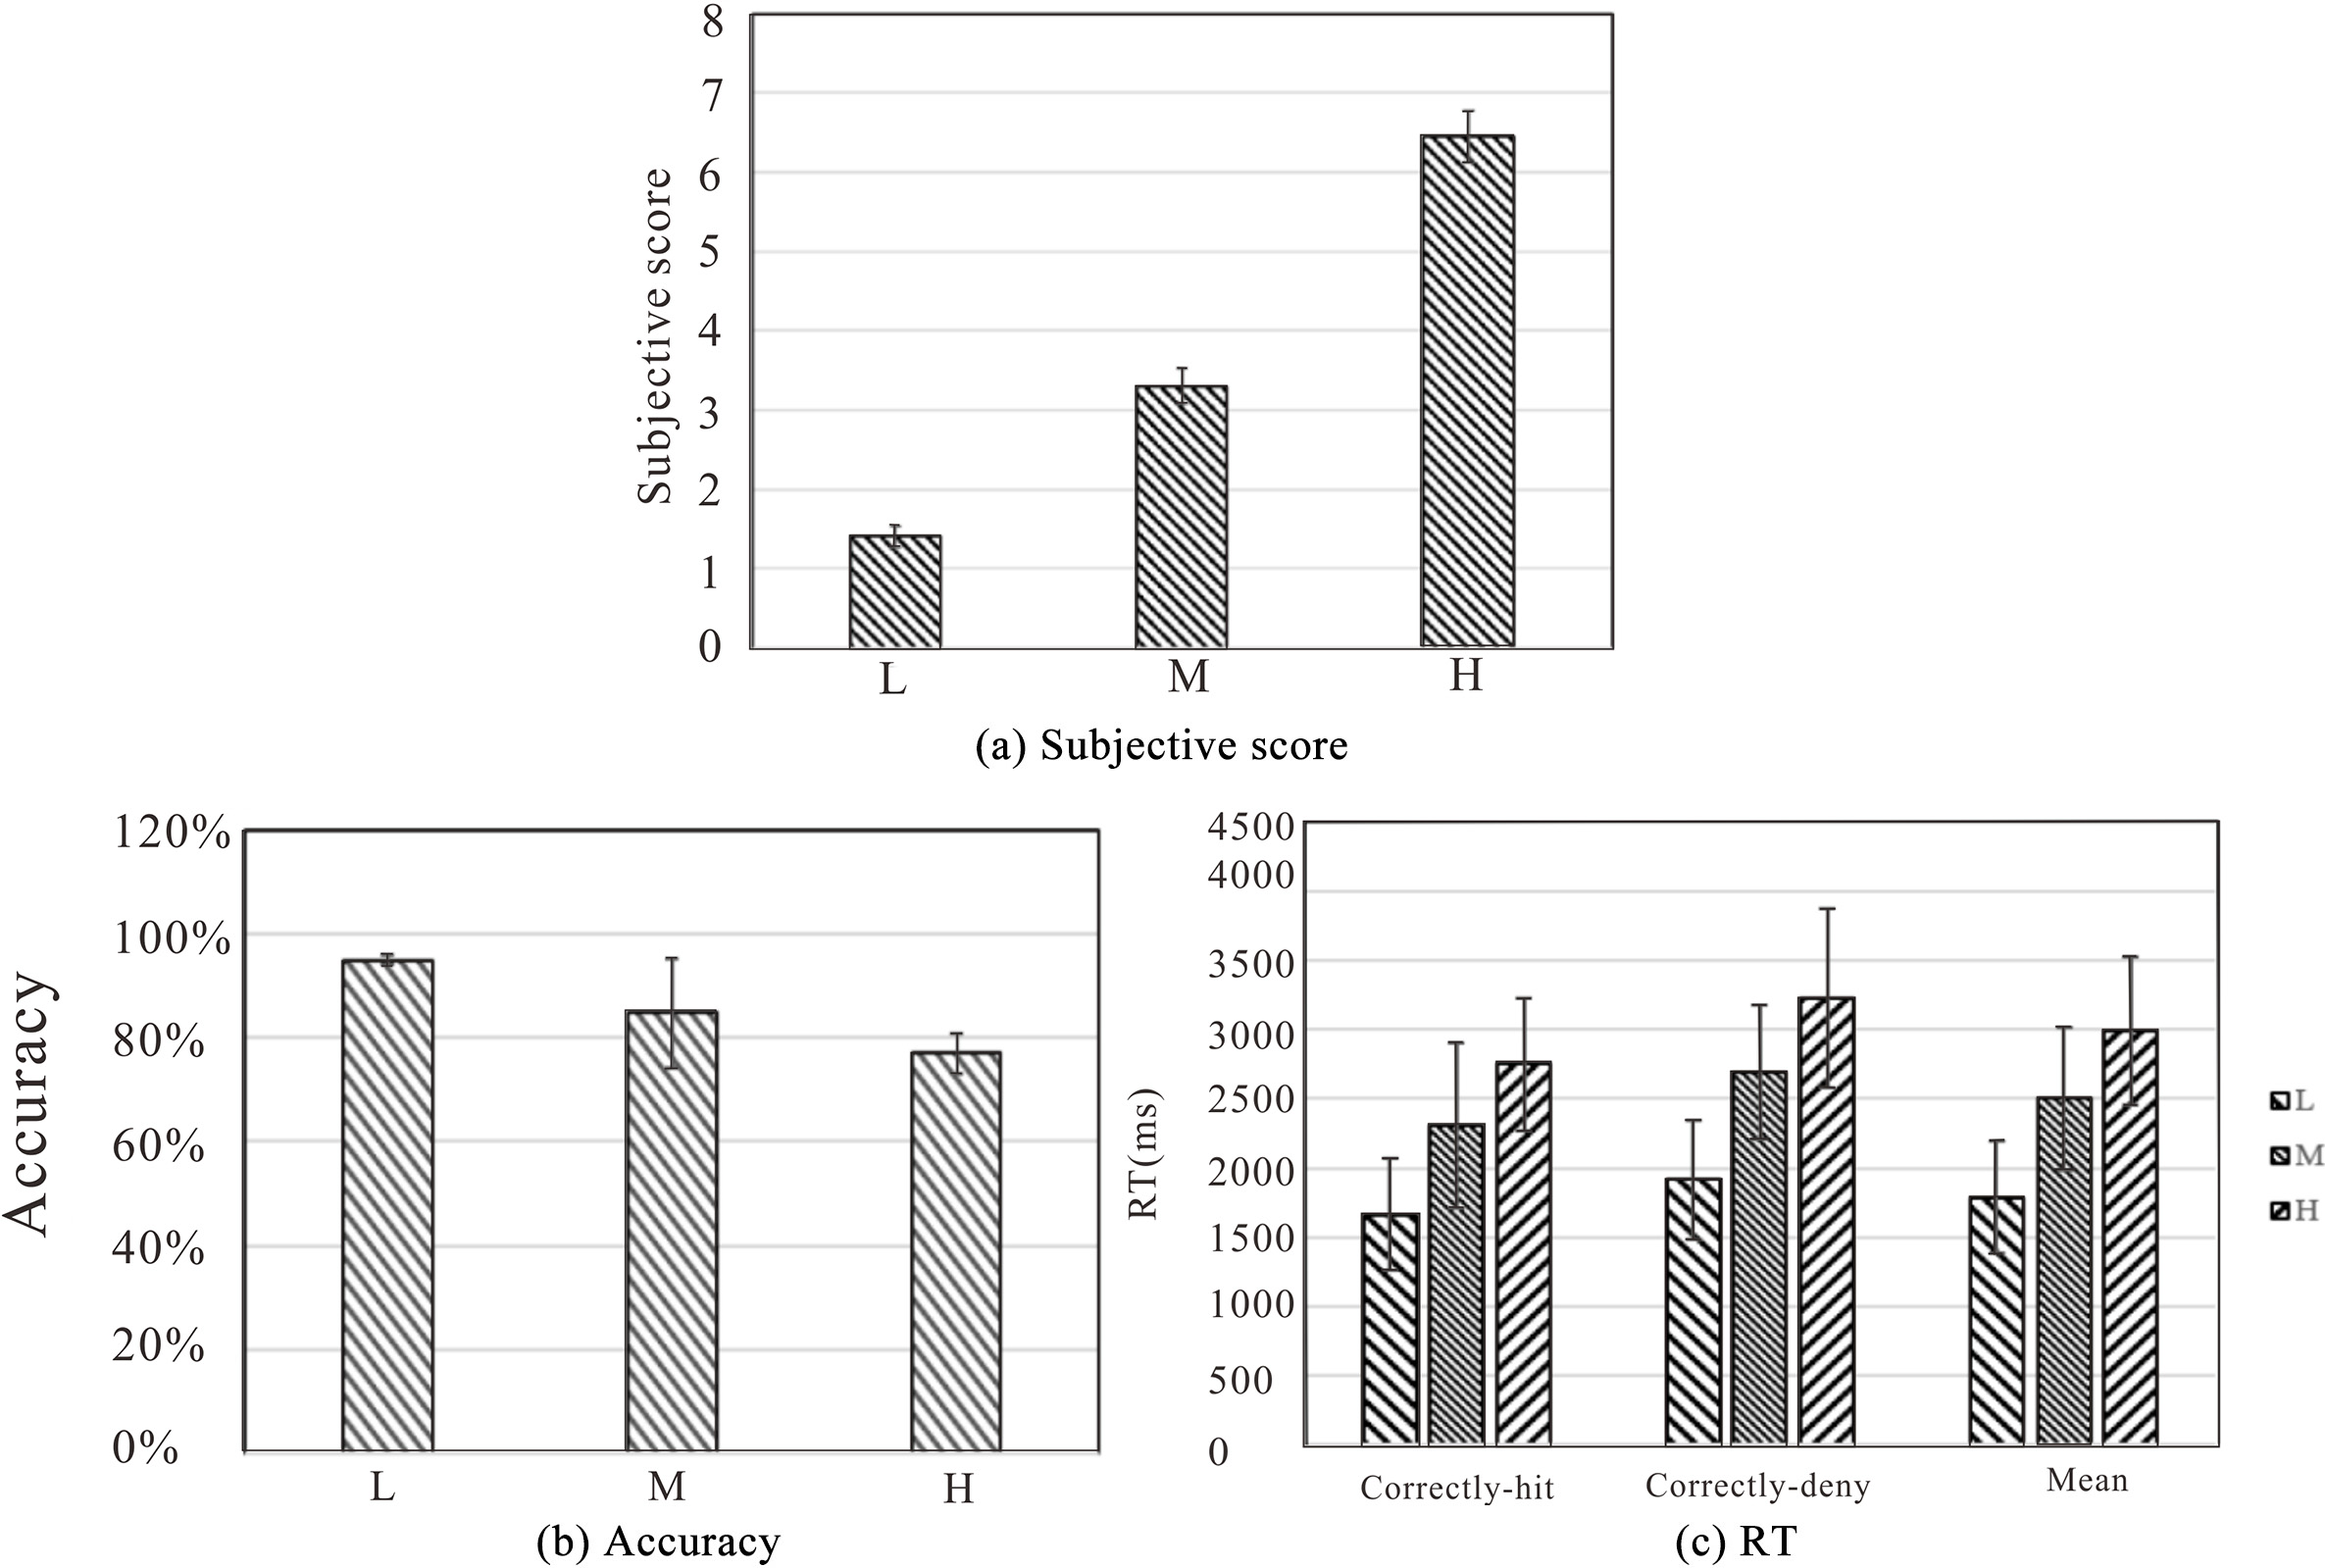
Figure 4.
Subjective scores and performance results.
3.Results
3.1Subjective results
Mean subjective scores for the three degrees of mental workload can be found in Fig. 4a. One-way ANOVA was chosen to analyze the subjective scores of mental workloads among the three tasks with different mental workloads. The results showed a significant increase of scores with the increase of task difficulty (
3.2Performance results
Mean performance indicators (RT and Accuracy) for the three levels of difficulty can been found in Fig. 4b and c, from which it could be seen that the accuracy decreased when the task difficulty increased. Meanwhile the correctly-hitting RT, correctly-denying RT and mean RT all increased when the task difficulty increased, which were obviously due to the increase of the amount of perceived signal sources when the task difficulty increased. One-way ANOVA was used to analyze the accuracy among the three tasks with different difficulties. The results showed a significant decrease of accuracy when the task difficulty increased (
3.3EEG data
The artifact-removed EEG signals from the first 180 s of each task were chosen for analysis in order to speed up data processing. The WPT and WPE were used to compute the previously assumed EEG indicators for each 1-s interval, and then averaged these 180 1-s intervals and the final values were considered as the parameters of the task. Therefore, the relative energies of
One-way ANOVA was used to analyze each parameter in each brain region, and the results are shown in Table 2. Figure 5 shows the histogram of comparisons of EEG parameters among three levels difficulties in different brain regions. As shown in Table 2 and Fig. 5, significant decreases of the relative energy of
Table 2
One-way ANOVA results of EEG parameters in different brain regions
| EEG parameters/brain regions | F | C | P | O |
|---|---|---|---|---|
|
| / | |||
|
| / | |||
|
| / | / | ||
|
| / | / | / | |
|
| / | |||
| ( | / | |||
| ( | / | / | ||
| WPE | / | / |
Figure 5.
The comparisons of EEG characteristic parameters among three tasks with different degrees of difficulty.
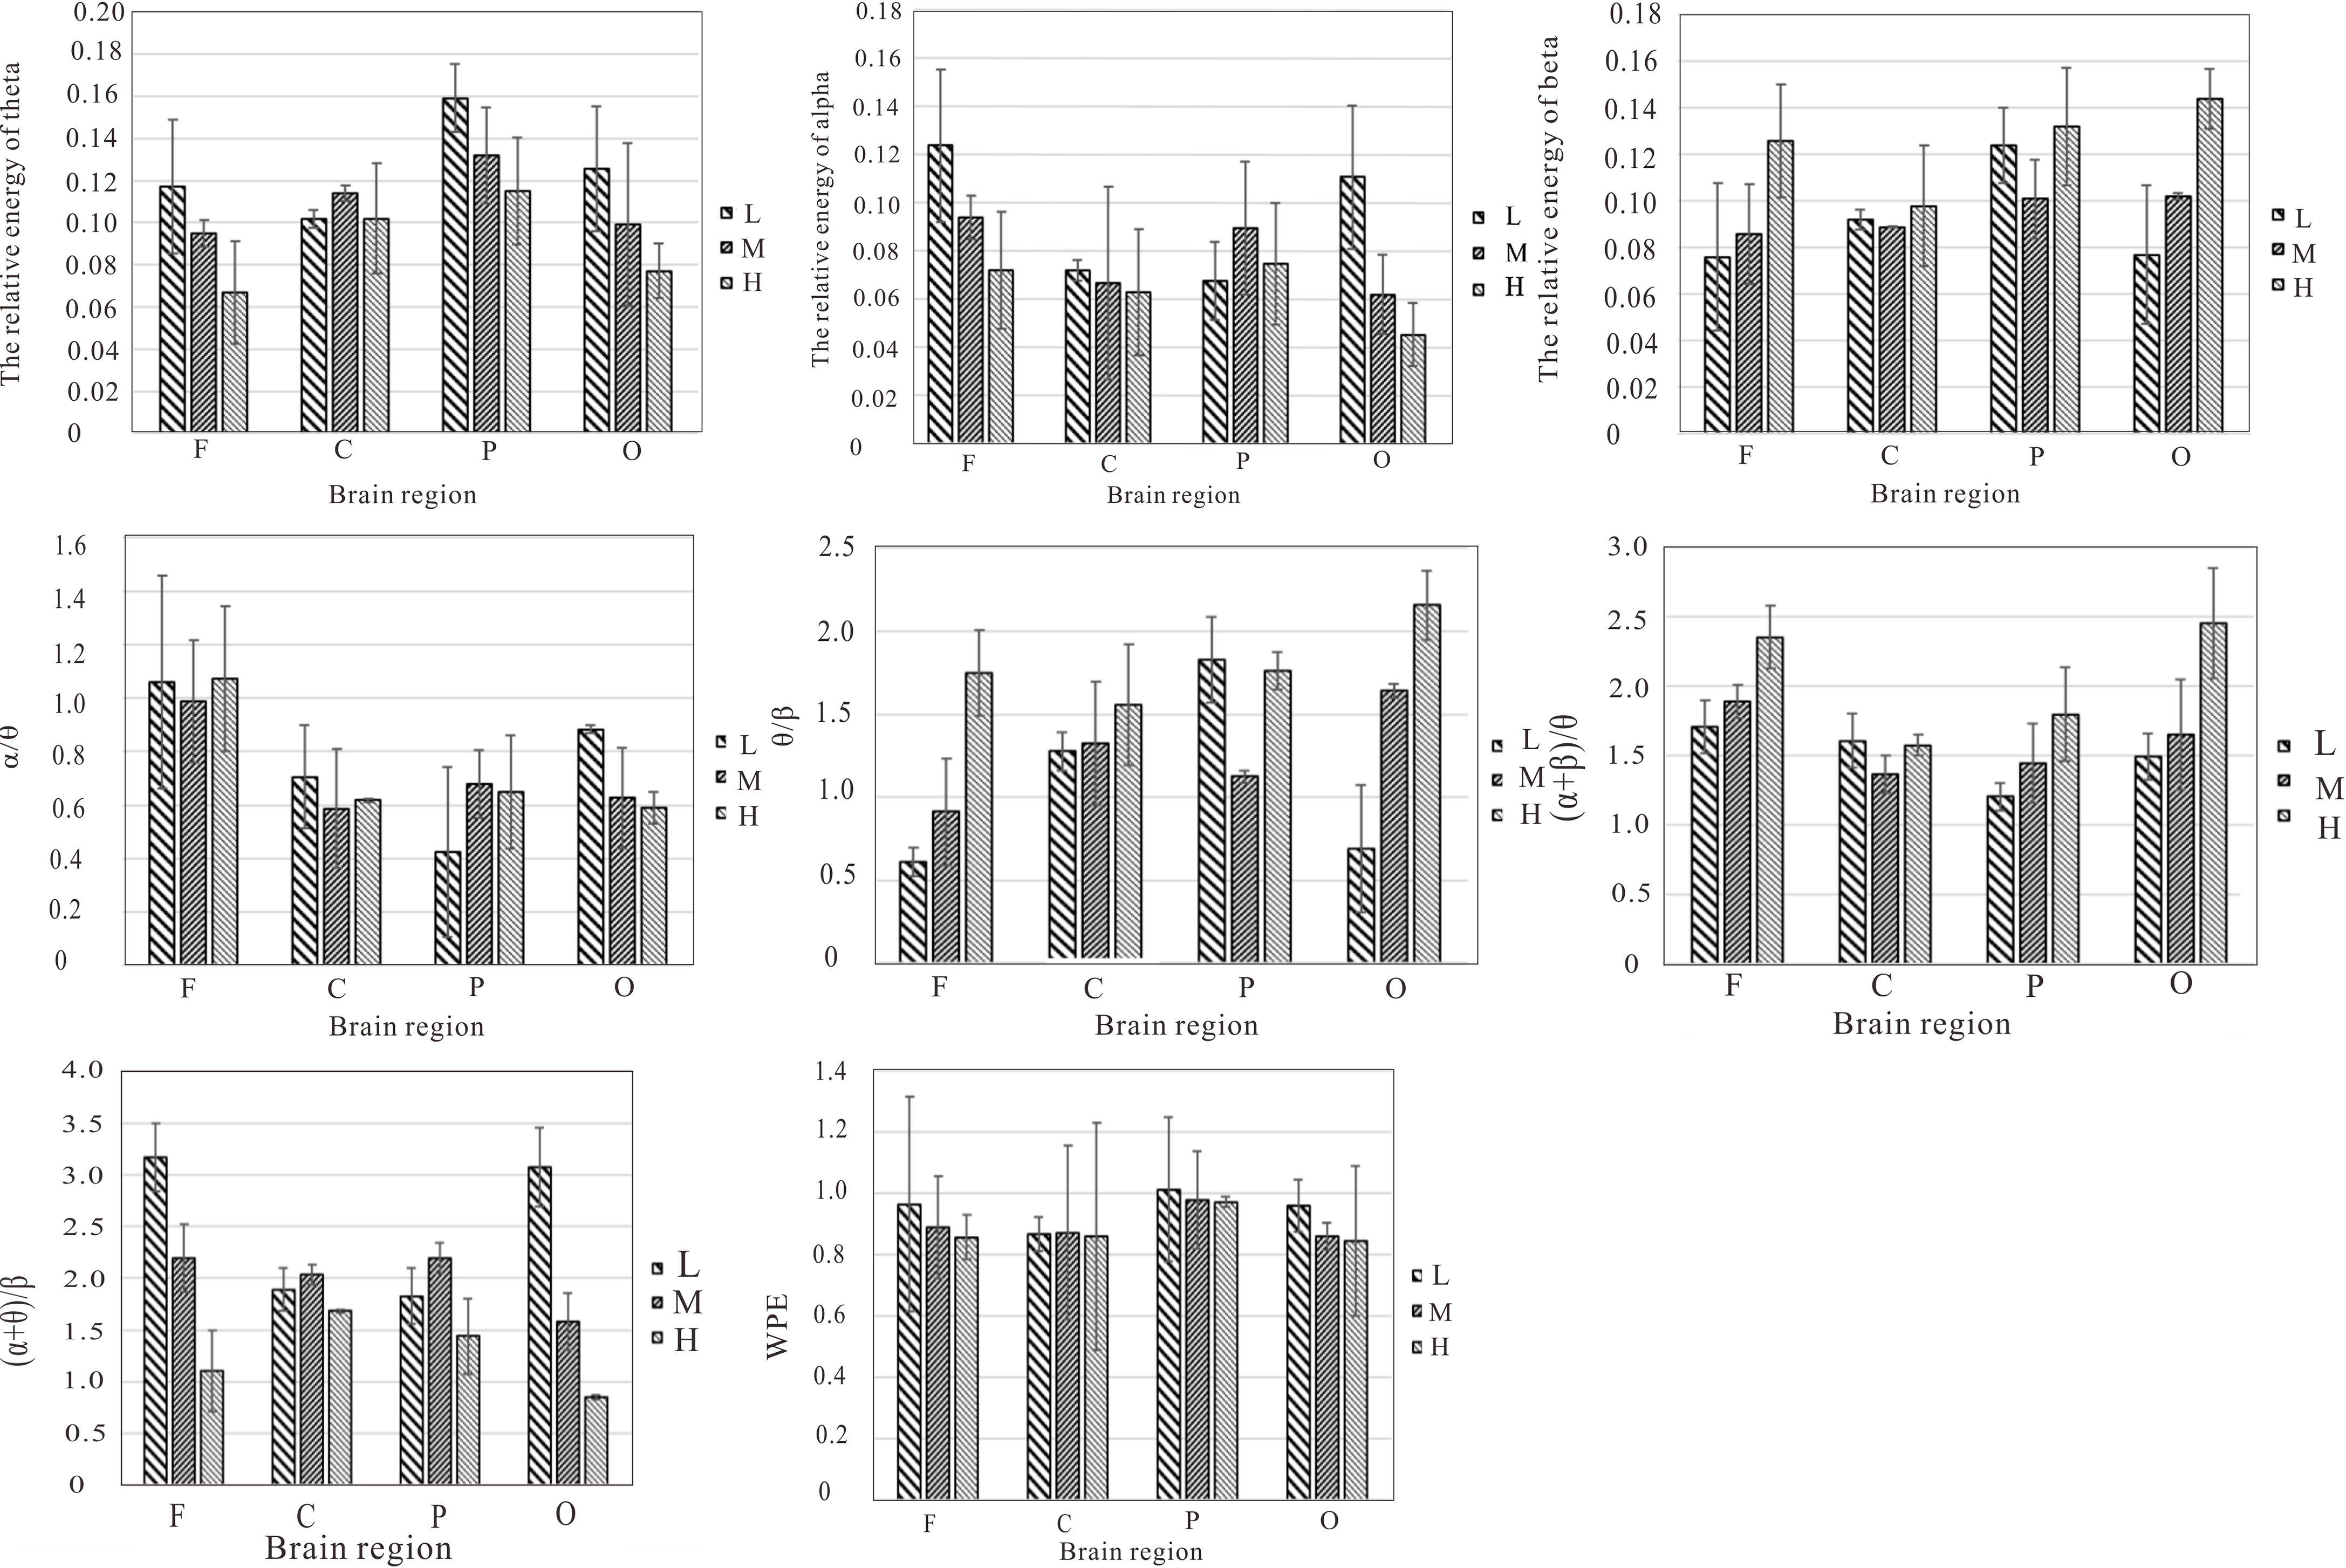
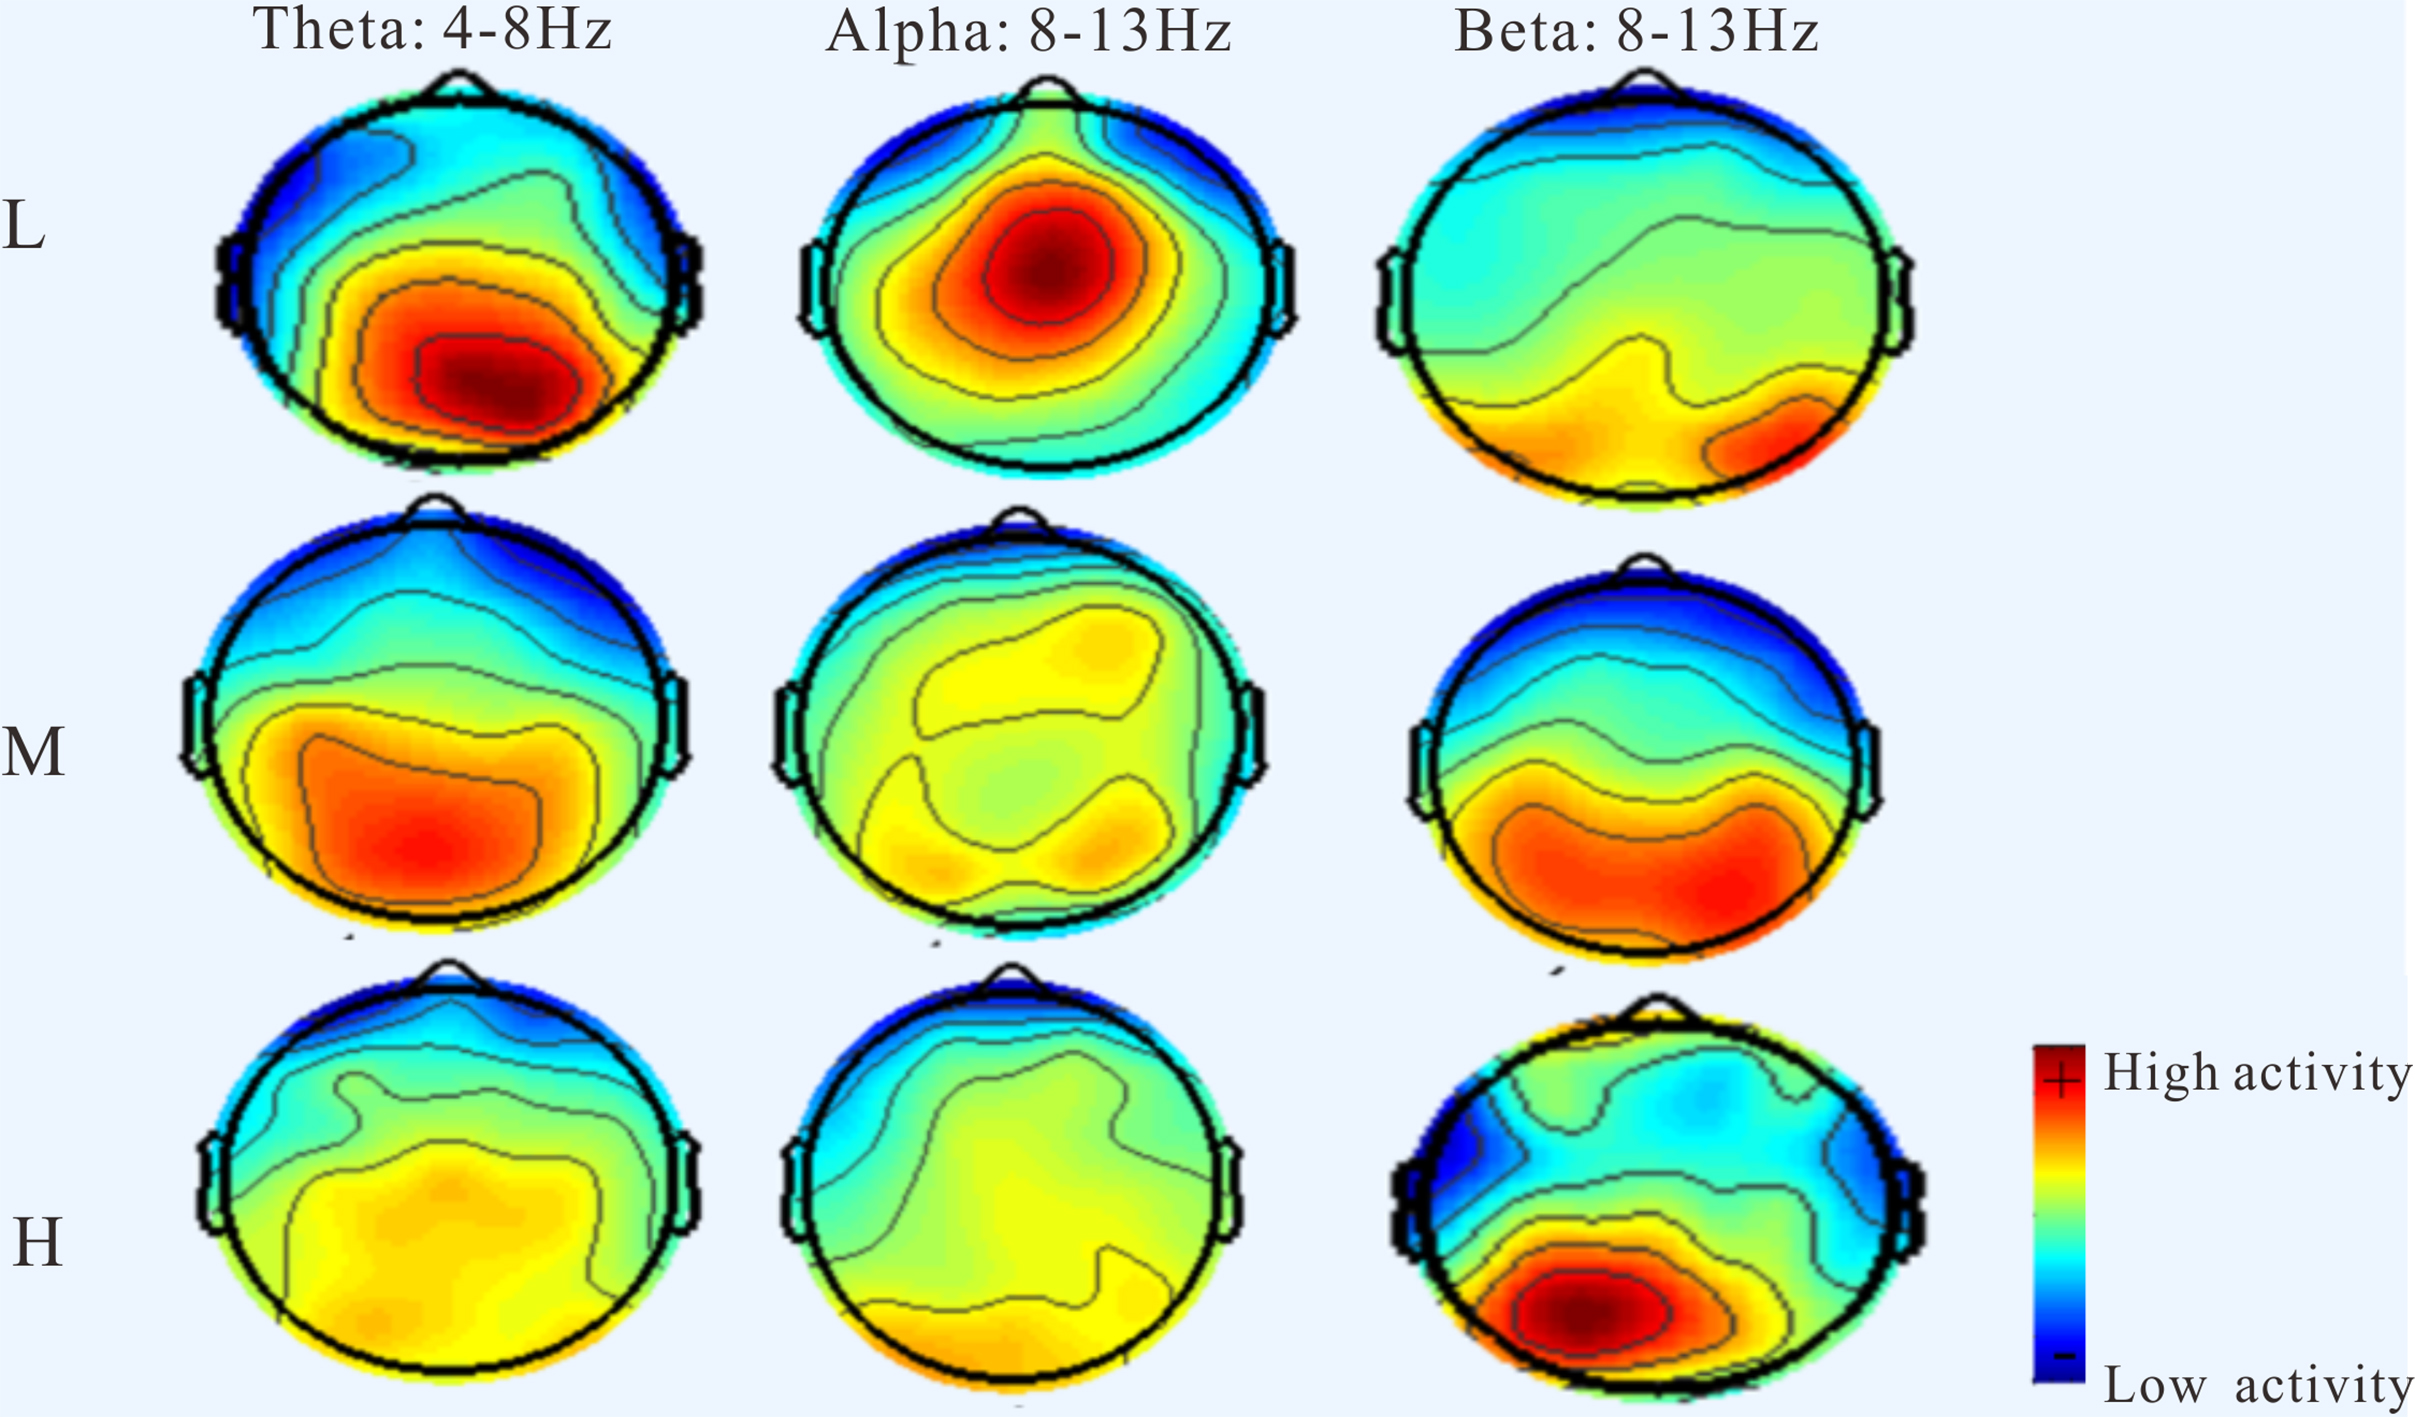
Figure 6.
One subject’s brain topography.
3.4ECG data
One-way ANOVA was used to analyze the ECG parameters (Seven HRV time domain parameters and four frequency domain parameters) obtained during the three tasks with different difficulties. For the analysis results in
Table 3
Statistical analysis results of ECG parameters
| Parameters | L | M | H | P | P (L-M) | P (L-H) | P (M-H) | |||||
|---|---|---|---|---|---|---|---|---|---|---|---|---|
| 863.75 | (76.38) | 850.05 | (71.26) | 846.84 | (110.64) |
| 0.05 | 0.11 | 1. | 0 | ||
| SDNN | 143.11 | (36.45) | 148.44 | (35.88) | 126.75 | (36.40) | 0.167 | / | / | / | ||
| SDANN | 133.77 | (25.04) | 136.31 | (26.11) | 124.52 | (27.79) | 0.355 | / | / | / | ||
| RMSSD | 42.47 | (8.97) | 35.40 | (10.44) | 33.28 | (9.17) |
| 0.05 | 0.078 | 1. | 0 | |
| SDNNI | 26.46 | (10.56) | 25.73 | (6.63) | 30.12 | (10.63) | 0.436 | / | / | / | ||
| NN50 | 38.00 | (15.24) | 27.65 | (19.44) | 36.00 | (22.17) | 0.767 | / | / | / | ||
| PNN50 | 22.30 | (6.58) | 20.53 | (7.02) | 19.08 | (6.05) | 0.392 | / | / | / | ||
| LF_norm | 43.19 | (12.65) | 49.69 | (13.02) | 59.20 | (11.89) |
| 0.01 | 0.347 | 0. | 068 | |
| HF_norm | 43.89 | (7.49) | 42.56 | (8.36) | 36.37 | (5.03) |
| 0.01 | 1.0 | 05 | ||
| LF/HF | 1.01 | (0.33) | 1.18 | (0.23) | 1.65 | (0.38) |
| 0.01 | 0.329 | 01 | ||
| SampEn | 2.55 | (0.35) | 2.30 | (0.44) | 2.18 | (0.37) |
| 0.05 | 0.068 | 0. | 353 | |
3.5Multi-physiological classifier
It can be concluded from the above analysis results that EEG signals and ECG signals can effectively evaluate mental workload. However, considering the reliability of physiological signals, the effectiveness of using a single physiological signal to evaluate mental workload is low. Therefore, the EEG and ECG indictors were combined to establish an effective classifier in the current study, which could be used to classify three degrees: low difficulty, medium difficulty and high difficulty. There are many classification algorithms, such as Bayesian Network, Neural Network, and Decision tree, etc., all of which need to follow Empirical Risk Minimization principle, but need sufficient data guarantee. However, the sample size of this study is small, therefore the above algorithms don’t apply here. Especially high-dimensional feature inputs in this study, insufficient samples will result in the inability to obtain better generalization ability. Therefore, Support Vector Machine (SVM) is proposed and used in this study as it is a classification algorithm based on the Structural Risk Minimization (SRM) principle, which has advantages in solving small sample, nonlinearity and high dimensions pattern recognition [25]. However, the resource for calculating time and space will increase exponentially as the samples increase in numbers, which is a disadvantage for SVM. Therefore, Principal Component Analysis (PCA) was used to eliminate correlation of data, extract the principal elements and decrease the dimension of sample space in order to simplify calculation and save resource space. Then the dimension-reduced data was used as the input of SVM classification.
Eight EEG indictors [
Table 4
Training results of the classification models
| Kernel function | Loss function parameter ( | Regularization parameter ( | Accuracy |
|---|---|---|---|
| Polynomial | 5.773 | 0.608 | 89.2% |
| Radial basis | 5.628 | 0.562 | 92.2% |
| Sigmoid | 4.375 | 0.563 | 87.4% |
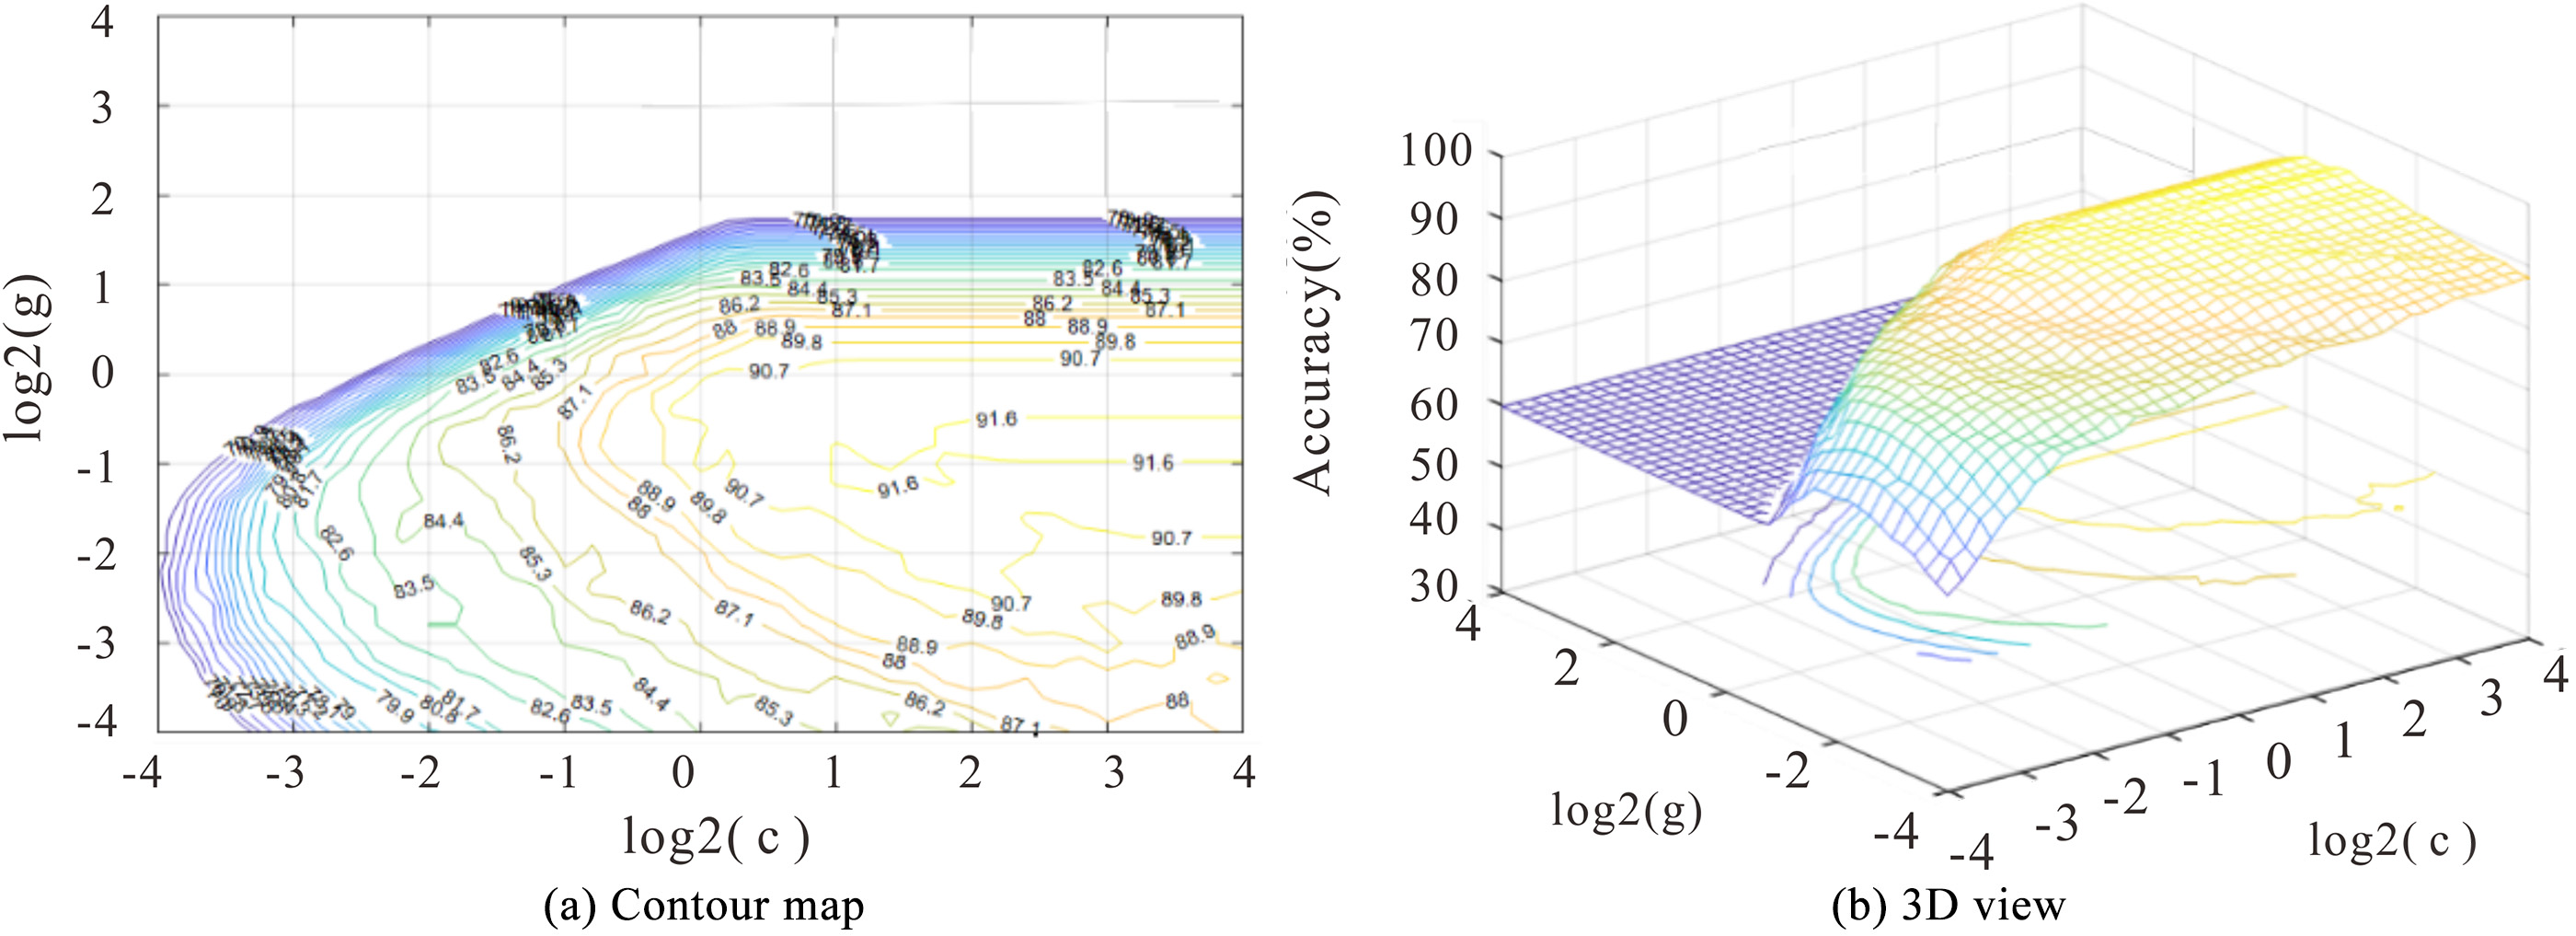
Figure 7.
Optimization of radial basis kernel function parameters.
The SVM classification process was done as follows [27]:
1. Normalization of eigen vector sample. After PCA analysis, [20
2. Preprocessing. For improving the model classification accuracy effectively, all samples were normalized to [0, 1], and the processing method was as follows:
3. Kernel parameter optimizing. Loss function parameter (
4. Classifier training and testing. Based on the optimum parameters (
The optimization results for the three classification models are shown in Table 4, from which it can be seen that the model constructed by Radial Basis Kernel function obtained the best classification effect (Best_ACC
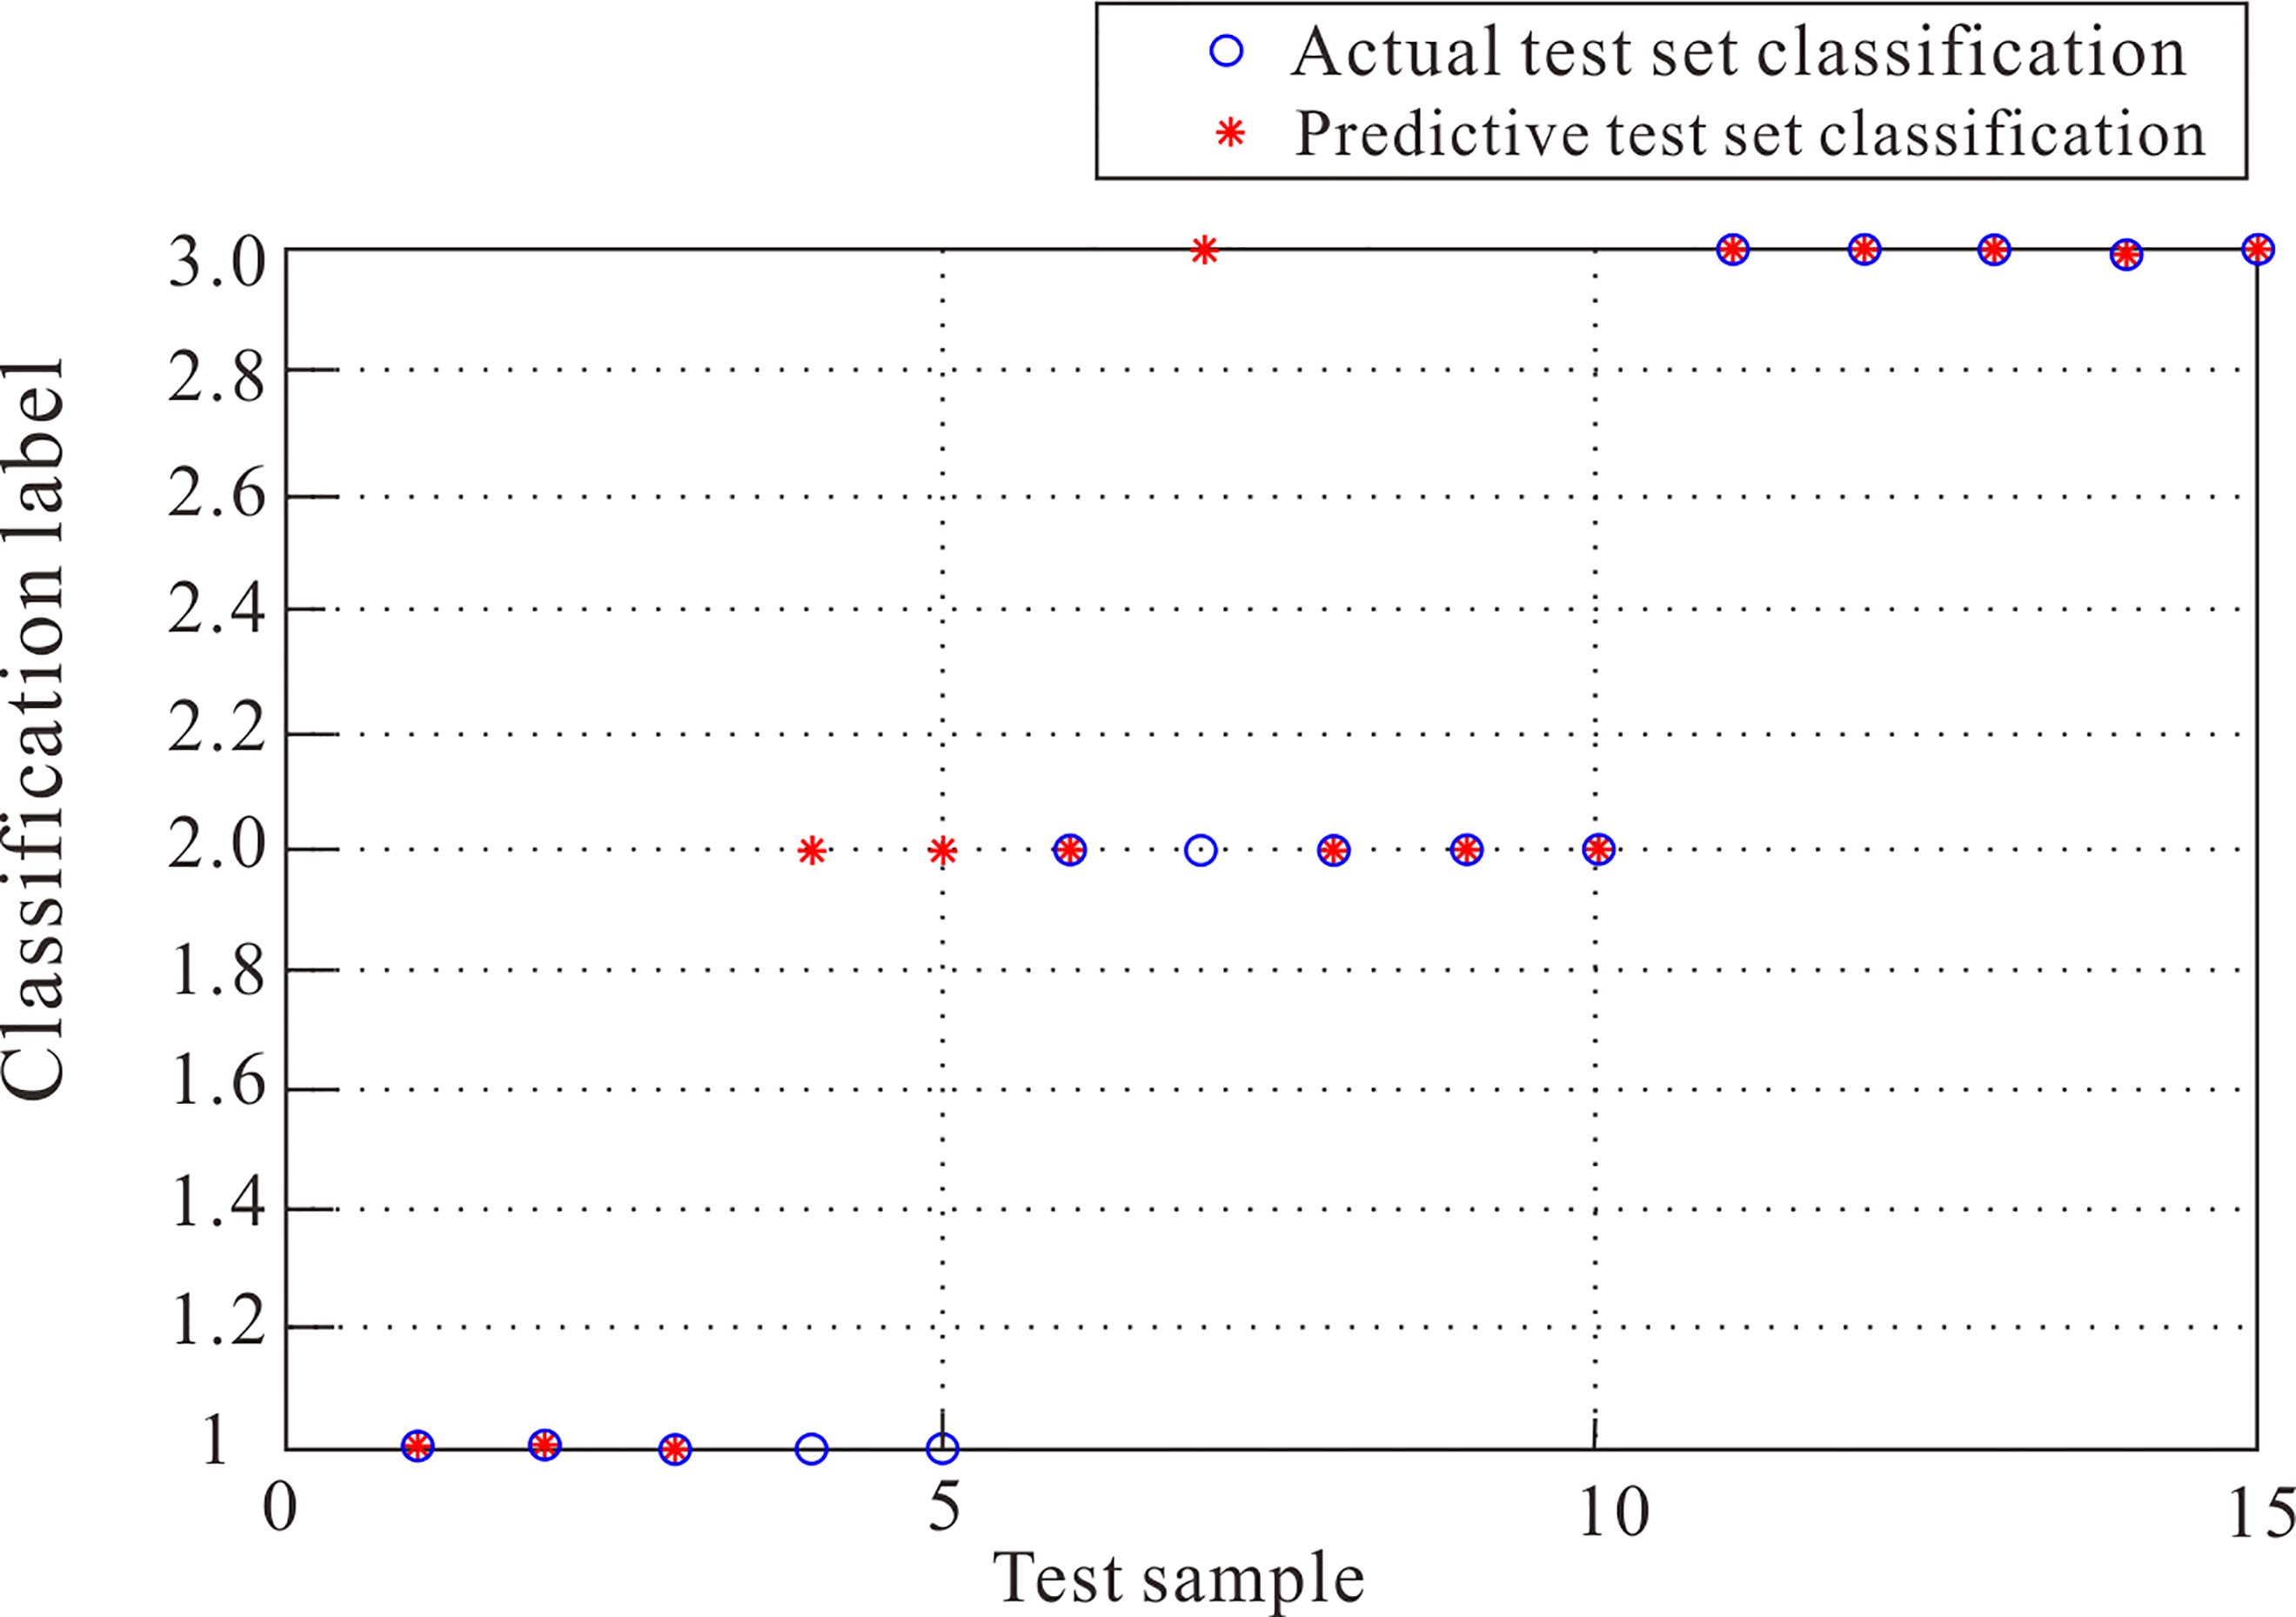
Figure 8.
Actual and predictive classifications of test set.
4.Discussion
Many studies have examined mental workload, and most of them indicated that the evaluation effect of comprehensive assessment with multi-methods is superior to the assessment with single method [29, 31], which may be due to the multi-dimensional characteristics of mental workload. In the present study, multiple measurements were combined to study mental workload. Subjective and performance evaluations were combined to verify the validity of task difficulty degrees of classification. The subjective evaluation results indicated that the mental workload of the subjective experience increased significantly when the task difficulty increased. The RT increased and accuracy decreased significantly with the increase of task difficulty. Therefore, it can be concluded that the instrument-monitoring tasks with different degrees of difficulty induced different degrees of workload effectively.
EEG measurements have proved to be reliable for the evaluation of mental workload. Most previous studies showed that EEG rhythms (
ECG is another physiological measurement for the evaluation of mental workload, which is used frequently in previous studies. HRV is considered to be sensitive to mental workload, which is most closely associated with autonomic nervous system (ANS) [36, 37]. In the present study, it was shown that Mean RR, RMSSD, HF_norm and SampEn decreased significantly when the task difficulty increased, while LF_norm and LF/HF increased significantly. Even though the results of these indicators did not show a positive correlation, it was found that mental workload caused a reduction of HRV in general. Some researchers thought this might be because the heart’s sympathetic activity increased as the workload increased [38]. Increased sympathetic activity could account for the decrease in Mean RR and the increase in LF_norm and LF/HF. However, other studies reported that mental workload might inhibit parasympathetic activity which can also cause reduction of HRV [39]. RMSSD that characterizes rapid changes in RR time series, as well as HF_norm which reflects the activity of parasympathetic, decreased with the increase of mental workload, which indicated the reduction of parasympathetic activity [40]. Therefore, Tobias Heine [41] speculated that mental workload, as well as concentration degrees, were both characterized by growing sympathetic activity firstly, and then weakening parasympathetic activity according to the degree of mental workload. Meanwhile, the decrease of SampEn indicated that the complexity of HRV signal reduced when the task difficulty increased.
Considering the reliability of physiological signals, the EEG and ECG indictors were combined to establish an effective evaluation model based on SVM. Before the classification, PCA was used to extract the principal elements and decrease the dimension of sample space in order to simplify the calculation. An effective classification model with accuracy of 80% based on SVM was achieved, which indicated that the proposed algorithm can be applied for mental workload monitoring.
5.Conclusion
Our findings demonstrate that EEG and ECG could be effectively used to evaluate different levels of mental workload in monitoring tasks. Three EEG rhythms (
However, there were some limitations to the current study. Firstly, the experiment was only conducted during visual monitoring tasks, and whether the conclusions obtained apply to other types of tasks (e.g. memory, calculation) needs further verification. Secondly, the research was still in the preliminary stage, and how the online monitoring of mental workload should be realized needs further exploration. Moreover, except for EEG and ECG, other physiological measurements, such as EMG and EOG, should be included in the comprehensive assessment of mental workload.
Acknowledgments
This research was funded by NQI (2017YFF0206601), Presidential Fund of CNIS (522018Y-5943) and National Key R&D Program of China (2017YFF0206604).
Conflict of interest
None to report.
References
[1] | Fastenmeier W, Gstalter H. Driving task analysis as a tool in traffic safety research and practice. Safety Science. (2007) ; 45: : 952-979. |
[2] | Mehler B, Reimer B, Coughlin JF, et al. Impact of incremental increases in cognitive workload on physiological arousal and performance in young adult drivers. Transportation Research Record. (2009) ; 2138: (2138): 6-12. |
[3] | Sanders M, McCormick E. Human factors in engineering and design. Industrial Robot. (1998) ; 25: (2): 153-159. |
[4] | Wickens CD. Information processing, decision making, and cognition. In Salvendy G. (Ed.), Cognitive engineering in the design of human-computer interaction and expert systems. Amsterdam: Elsevier. (1987) . |
[5] | Paas FG, Van Merriënboer JJ, Adam JJ. Measurement of cognitive load in instructional research. Percept Mot Skills. (1994) ; 79: : 419-430. |
[6] | Weinger MB, Herndon OW, Zornow MH, et al. An objective methodology for task analysis and workload assessment in anesthesia providers. Anesthesiology. (1994) ; 80: (1): 77-92. |
[7] | Reid GB, Nygren TE. The subjective workload assessment technique: A scaling procedure for measuring mental workload. Advances in Psychology. (1988) ; 87: : 185-218. |
[8] | Hart SG, Staveland LE. Development of NASA-TLX (Task Load Index): Results of empirical and theoretical research. Advances in Psychology. (1988) ; 32: : 139-183. |
[9] | Gao Q, Wang Y, Song F, et al. Mental workload measurement for emergency operating procedures in digital nuclear power plants. Ergonomics. (2013) ; 56: (7): 1070-1085. |
[10] | Wanyan XR, Zhuang D, Zhang H. Improving pilot mental workload evaluation with combined measures. Bio-medical Materials and Engineering. (2014) ; 24: (6): 2283-2290. |
[11] | Hart SG, Staveland LE. Development of NASA-TLX (Task Load Index): Results of empirical and theoretical research. Advances in Psychology. (1988) ; 52: : 139-183. |
[12] | Gevins A, Smith ME, Leong H, McEvoy L, et al. Monitoring working memory load during computer-based tasks with EEG pattern recognition methods. Humman Factors. (1998) ; 40: : 79-91. doi: 10.1518/001872098779480578. |
[13] | Hoover A, Singh A, Muth E. Real-time detection of workload changes using heart rate variability. Biomed. Signal Process. (2011) ; 7: : 333-341. doi: 10.1016/j.bspc. |
[14] | Ranganathan G, Rangarajan R, Bindhu V. Estimation of heart rate signals for mental stress assessment using neuro fuzzy technique. Appl. Soft Comput. (2012) ; 12: : 1978-1984. doi: 10.1016/j.asoc. |
[15] | Pfurtscheller G, Stancak AJ, Neuper C. Event-related synchronization (ERS) in the alpha band – an electrophysiological correlate of cortical idling: A review. Psychophysiol. (1996) ; 24: : 39-46. |
[16] | Fink A, Grabner RH, Neuper C. EEG alpha band dissociation with increasing task demands. Cognitive Brain Research. (2005) ; 24: (2): 252-259. |
[17] | Pesonen M, Hamalainen H, Krause CM. Brain oscillatory 4–30 Hz responses during a visual n-back memory task with varying memory load. Brain Res. (2007) ; 1138: : 171-177. |
[18] | Esposito F, Aragri A, Piccoli T, Tedeschi G. Distributed analysis of simultaneous EEG-fMRI time-series: Modeling and interpretation issues. Magnetic Resonance Imaging. (2009) ; 27: (8): 1120-1130. |
[19] | Laine TI, Bauer K, Lanning JW. Selection of input features across subjects for classifying crewmember workload using artificial neural networks. Systems Man and Cybernetics. (2002) ; 32: (6): 691-704. |
[20] | Michels L, Bucher K, Lüchinger R. Simultaneous EEG-fMRI during a working memory task: Modulations in low and high frequency bands. Plos One. (2010) ; 5: (4): 187-197. |
[21] | Dishman R, Nakamura Y, Garcia M. Heart rate variability, trait anxiety, and perceived stress among physically fit men and women. International Journal of Psychophysiology. (2000) ; 37: (2): 121-133. |
[22] | Salahuddin L, Jeong M, Kim D. Dependence of Heart Rate Variability on Stress Factors of Stress Response Inventory. In International Conference on E-health Networking, Application & Services. (2007) . pp. 236-239. |
[23] | Lenneman JK, Backs RW. Diagnosticity of cardiac modes of autonomic control elicited by simulated driving and verbal working memory dual-tasks. In Harris D. (Ed.), Engineering Psychology and Cognitive Ergonomics, Lecture Notes in Artificial Intelligence. Springer-Verlag, Berlin. (2007) . pp. 541-550. |
[24] | Chen S, Liaw J, Chang Y, et al. Combined heart rate variability and dynamic measures for quantitatively characterizing the cardiac stress status during cycling exercise. Computers in Biology and Medicine. (2015) ; 133-142. |
[25] | Roy RN, Charbonnier S, Campagne A, et al. Efficient mental workload estimation using task-independent EEG features. Journal of Neural Engineering. (2016) ; 13: (2): 230-239. |
[26] | Fleury A, Vacher M, Noury N. SVM-based multimodal classification of activities of daily living in Health Smart Homes: Sensors, algorithms, and first experimental results. IEEE Transactions on Information Technology in Biomedicine. (2010) ; 14: (2): 274-283. |
[27] | Ziegler MD, Kraft A, Krein M, et al. Sensing and Assessing Cognitive Workload Across Multiple Tasks. In International Conference on Foundations of Augmented Cognition. (2016) . pp. 440-450. |
[28] | Yan L, Xu X, Qi G. Combining active learning and semi-supervised learning to construct SVM classifier. Knowledge-Based Systems. (2014) ; 44: (1): 121-131. |
[29] | Wilson GF. An Analysis of mental workload in pilots during flight using multiple psychophysiological measures. The International Journal of Aviation Psychology. (2002) ; 12: (1): 3-18. |
[30] | Longo L. A defeasible reasoning framework for human mental workload representation and assessment. Behavior & Information Technology. (2015) ; 34: (8): 758-786. |
[31] | Wei LL, Sourina O, Liu Y, et al. EEG-based mental workload recognition related to multitasking. In International Conference on Information. Singapore. (2015) . p. 112. |
[32] | Borghini G, Vecchiato G, Toppi J, Astolfi L. Assessment of mental fatigue during car driving by using high resolution EEG activity and neurophysiologic indices. In 34th Annual International Conference of the IEEE EMBS. (2012) . pp. 6442-6445. |
[33] | Joseph NM, Rosa HM, Chan M. Evaluation of Mental Workload in Visual-Motor Task: Spectral Analysis of Single-Channel Frontal EEG. In Conference of the Industrial Electronics Society. (2013) . pp. 8426-8430. |
[34] | Paxion J, Galy E, Berthelon C, et al. Mental workload and driving. Frontiers in Psychology. (2014) ; 5: (1344): 1344-1349. |
[35] | Fan XL, Zhao CY, Luo H. Electroencephalographic Study of Mental Fatigue Induced by Prolonged Vigilance Task. Journal of Medical Imaging and Health Informatics. (2018) ; 8: : 1349-1357. |
[36] | Paxion J, Galy E, Berthelon C. Mental workload and driving. Front. Psychol. (2014) ; 5: (1344): 1-11. |
[37] | Chandra S, Sharma G, Sharma M, et al. Workload regulation by Sudarshan Kriya: An EEG and ECG perspective. Brain Informatics. (2017) ; 4: (1): 13-25. |
[38] | Hirshfield LM, Chauncey K, Gulotta R, et al. Combining Electroencephalograph and Functional Near Infrared Spectroscopy to Explore Users’ Mental Workload. In International Conference on Foundations of Augmented Cognition. (2009) . pp. 239-247. |
[39] | Hjortskov N, Rissen D, Blangsted AK, et al. The effect of mental stress on heart rate variability and blood pressure during computer work. European Journal of Applied Physiology. (2004) : 84-89. |
[40] | Zimmermannviehoff F, Thayer JF, Koenig J, Herrmann C. Short-term effects of espresso coffee on heart rate variability and blood pressure in habitual and non-habitual coffee consumers – A randomized crossover study. Nutritional Neuroscience. (2016) ; 19: (4): 169-175. |
[41] | Tobias H, Gustavo L, Patrick R. Electrocardiographic features for the measurement of drivers’ mental workload. Applied Ergonomics. (2017) ; 61: : 31-43. |


