
Modeling and simulation of excitation- contraction coupling of fast-twitch skeletal muscle fibers
Abstract
BACKGROUND:
The current excitation-contraction coupling model of fast-twitch skeletal muscle fibers cannot completely simulate the excitation-contraction process.
OBJECTIVE:
To solve this problem, this study proposes an excitation-contraction model of fast-twitch skeletal muscle fibers based on the physiological structure and contractile properties of half-sarcomeres.
METHODS:
The model includes the action potential model of fast-twitch fiber membranes and transverse tubule membranes, the cycle model of
RESULTS:
Finally, detailed analyses of the results from the simulation are conducted using the Simulink toolbox in MATLAB. Two conditions, non-coincidence and coincidence, are analyzed for both the thick and thin myofilaments.
CONCLUSIONS:
The simulation results of two groups of models are the same as the previous research results, which validates the accuracy of models.
1.Introduction
At present, the action potential of the sarcolemma and transverse tubule membranes are studied using the Hodgkin-Huxley model and the Goldman-Hodgkin-Katz equation. The inwardly rectifying potassium (Kir) channel, together with the chloride channel (ClC-1), plays a vital role in the skeletal muscle physiology. Current research primarily focuses on the fibrous surface and transverse tubular system (TTS) of amphibians [1], and the measurement of Kir of mammalian skeletal muscle fibers [2, 3, 4]. The primary physiological function of mammalian skeletal muscle is to maintain the stability of resting membrane potential and to enable the excitation of electrogenic cells. It is essential to study the properties of Kir in mammalian skeletal muscle fibers to further understand the related muscular diseasesin humans [5, 6, 7].
In vertebrate skeletal muscle fibers, action potential controls contractile activity by inducing rapid changes of the free
Skeletal muscle fibers exhibit contractility through the relative sliding of the sarcomere’s thick and thin myofilaments in the myofibril. The sliding process depends on the hydrolysis coupling of ATP and the circulation of the fine filaments, i.e., actin filaments, along the molecules on the head of myosin, forming cross-bridges. In striated muscle fibers, it is believed that tropomyosin and troponin prevent the binding of myosin and actin, which form the cross-bridge circulation and act as doormen. Tropomyosin is the basis of many of actin’s biological activities, and the movement of troponin on the surface of actin is considered critical to the cooperative allosteric regulation of actin. The different positions of the thick and thin myofilaments will affect the speed at which
The currently existing excitation-contraction model of fast-twitch muscle fibers cannot simulate the excitation-contraction process completely. To solve this problem, this study proposes an excitation-contraction model for fast-twitch skeletal muscle fibers based on the physiological structure and contractile properties of the half-sarcomere. The study is structured as follows: (1) establishment of an action potential model for fast-twitch muscle fiber membranes and transverse tubule membranes; (2) establishment of the cycle model of
2.Methods
2.1Modeling of the skeletal fast muscle fiber membrane potential
A two-compartment model was used to simulate the action potential of skeletal fast muscle fibers. The total ionic current on the surface of the muscle fibers is calculated by adding
(1)
Due to the difference between ion channel densities in the T tube and myolemma, the ratio of T tube membrane channel density to myolemma channel density can be represented by
(2)
where
The changes inconcentration of
(3)
(4)
(5)
In Eqs (2)–(5),
2.2Modeling of calcium cyclingin skeletal fast muscle fiber
We divided the sarcomere into six geometric regions, which are
Figure 1.
Geometric division diagram of half sarcomere.
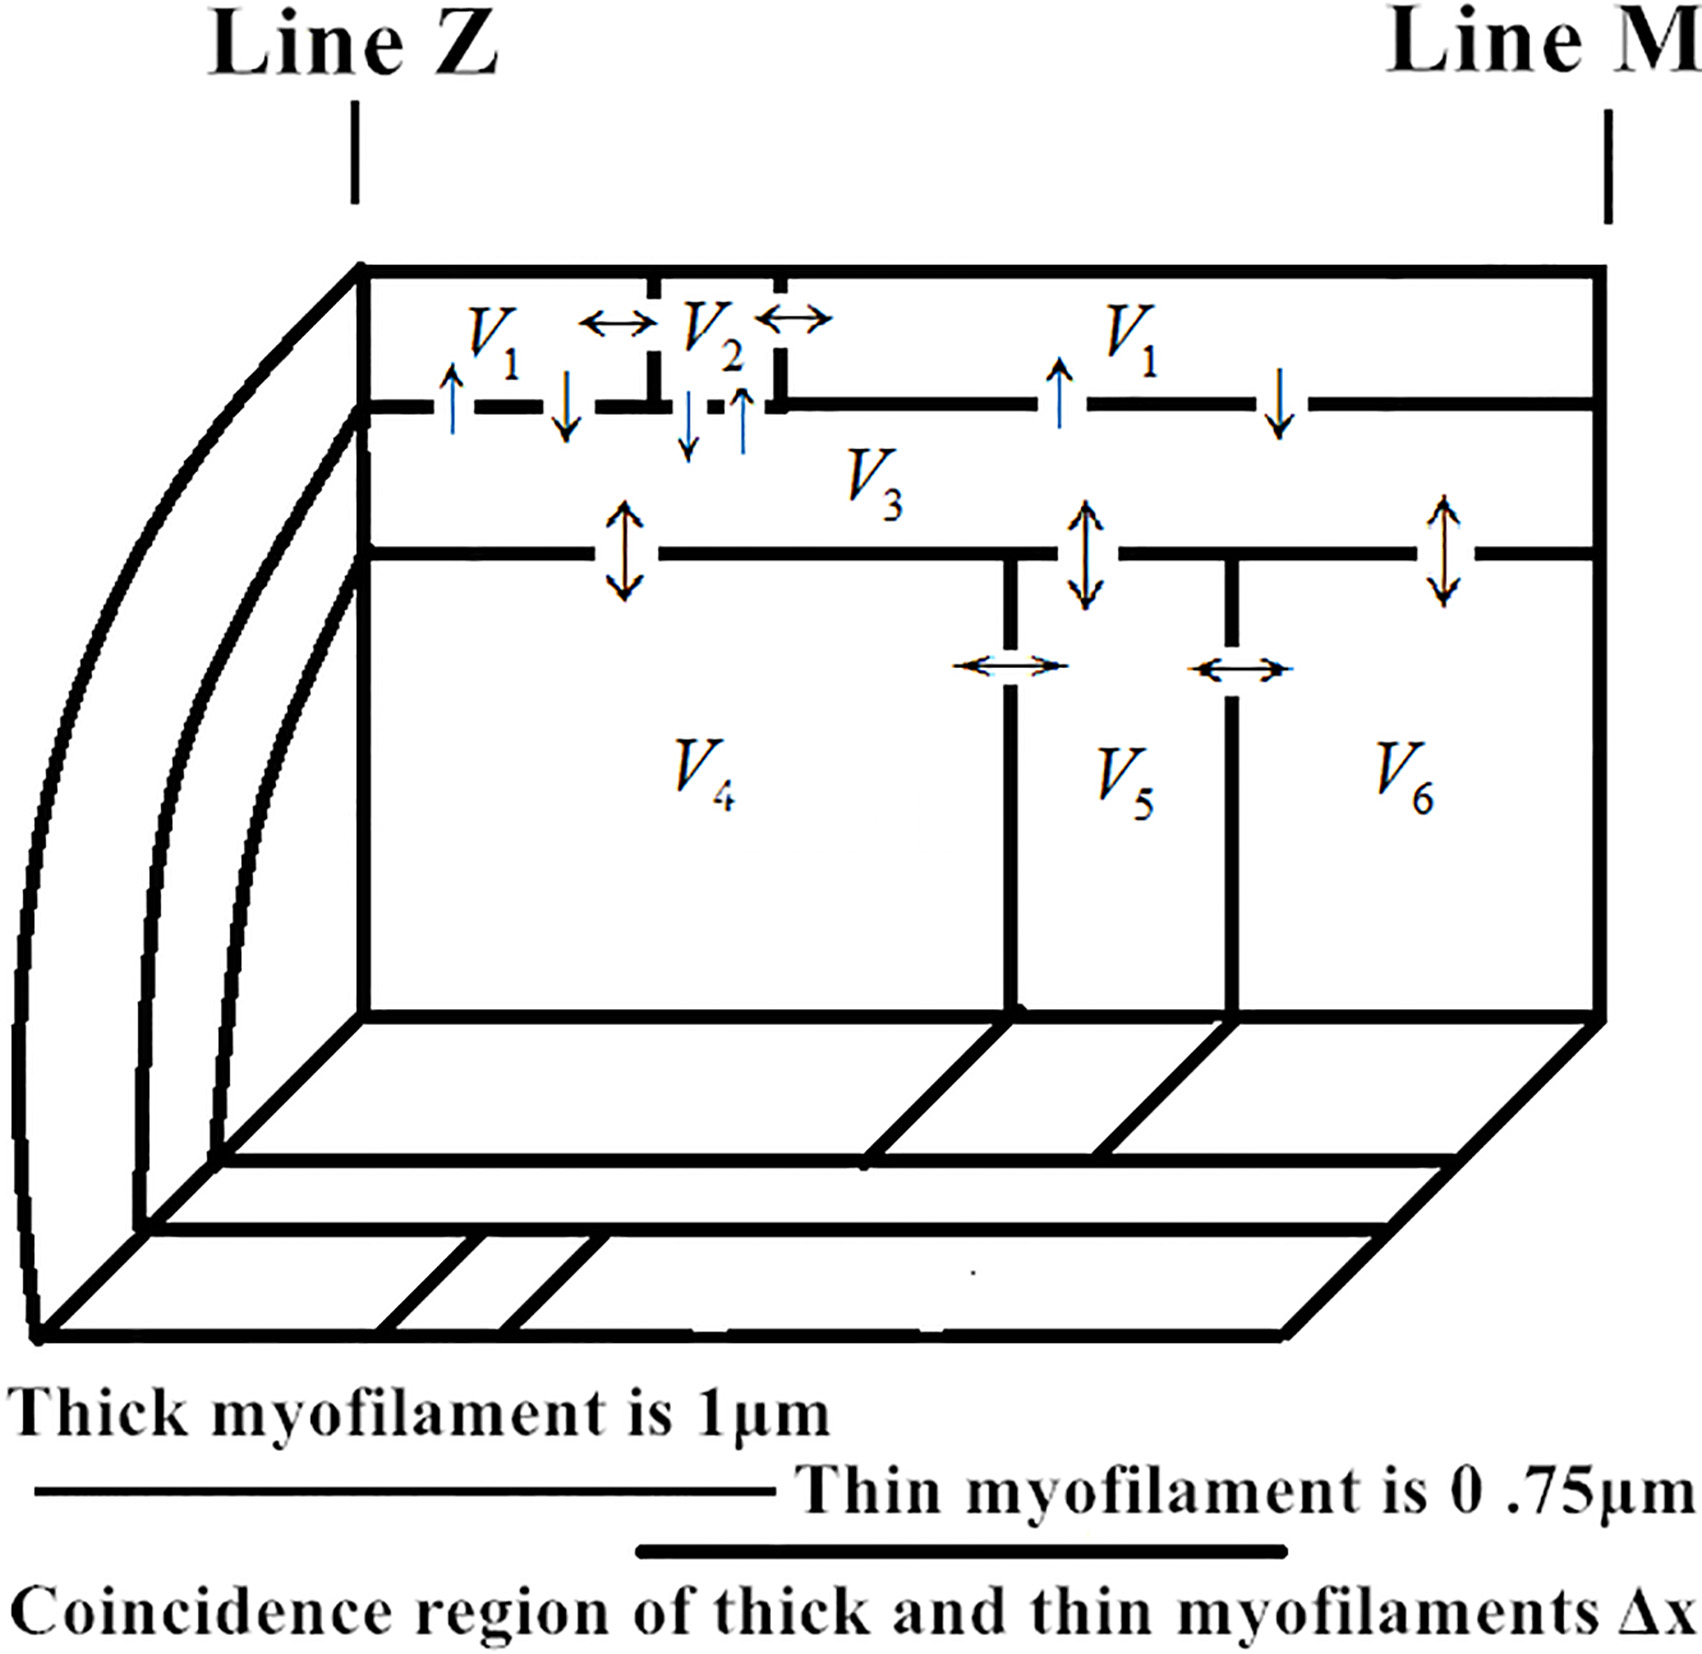
Table 1
Model parameters
| Parameter | Unit | Value | Parameter | Unit | Value |
|---|---|---|---|---|---|
|
| 1500 |
| ms | 0.0005 | |
|
| 31000 |
| 0.15 | ||
|
| 1 |
| ms | 30 | |
|
| 4.875 |
| 3.3 | ||
|
| 2 |
| ms | 0.003 | |
|
| 0.75 |
| 1.5 | ||
|
| 0.375 |
| ms | 0.15 | |
|
| 1.5 |
| 4 | ||
|
| 0.0417 |
| ms | 0.005 | |
|
| 300 |
A 10-state model is used to describe the release process from the T tube voltage to the Reynolds channel. The ten states consist of five states of four voltage sensor molecules and two states of a Reynolds channel (including five closed states (
(6)
(7)
(8)
(9)
(10)
(11)
2.3Modeling of the cross-bridge dynamic in skeletal fast muscle fiber
A 6-state model is used when
(12)
In the non-coincidence region (
(13)
In the coincidence region (
(14)
Table 2
Model parameters
| Parameter | Unit | Value | Parameter | Unit | Value |
|---|---|---|---|---|---|
|
| 140 |
| ms | 0.15 | |
|
| 0.04425 |
| ms | 0.05 | |
|
| ms | 0.115 |
| ms | 15 |
|
| ms | 0 |
| ms | 1.5 |
|
| ms | 0.15 |
| ms | 0.18 |
|
| ms | 0 |
| ms | 0.24 |
|
| ms | 0.12 |
| ms | 0.12 |
In the coincidence region (
(15)
2.4The fatigue modeling of metabolismin skeletal fast muscle fiber
During the cross-bridge cycle, when the cross-bridge attains a strong binding state from a weak binding state, the ATP will be hydrolyzedto generate ADP and
3.Results and discussion
3.1Analysis of the simulated excitation-contraction model of skeletal fast muscle fiber in conditions of non-coincidence of the thick and thin myofilaments
When skeletal fast muscle fibers are in a resting state, the number of ions in the myofibrilremains constant, and their concentrations are shown in Table 3. Calsequestrin in the sarcoplasmic reticulum combines a large amount of calcium ions to be stored. Magnesium ions in sarcoplasm combine at most of the ATP binding sites. The percentages of calcium and magnesium ions in binding sites, respectively, are shown in Table 4.
Table 3
Ion concentration in the myofibril at resting
| Ions | Concentration | Unit |
|---|---|---|
| Calsequestrin (sarcoplasmic reticulum) | 31000 | |
| 1500 | ||
| 0.05 | ||
| 1000 | ||
| ATP (sarcoplasm) | 8000 | |
| Parvalbumin (sarcoplasm) | 1500 | |
| Troponin (sarcoplasm) | 240 |
Table 4
The percentage of ions in the binding site at resting
| [height=0.8cm,width=3.4cm]IonsConjugates |
|
|
|---|---|---|
| Calsequestrin (sarcoplasmic reticulum) | 54.55% | – |
| Troponin (sarcoplasm) | 7.1% | – |
| Parvalbumin (sarcoplasm) | 41% | 54.1% |
| ATP (sarcoplasm) | – | 90.9% |
Figure 2.
Release rate of calcium ion in terminal cistern.
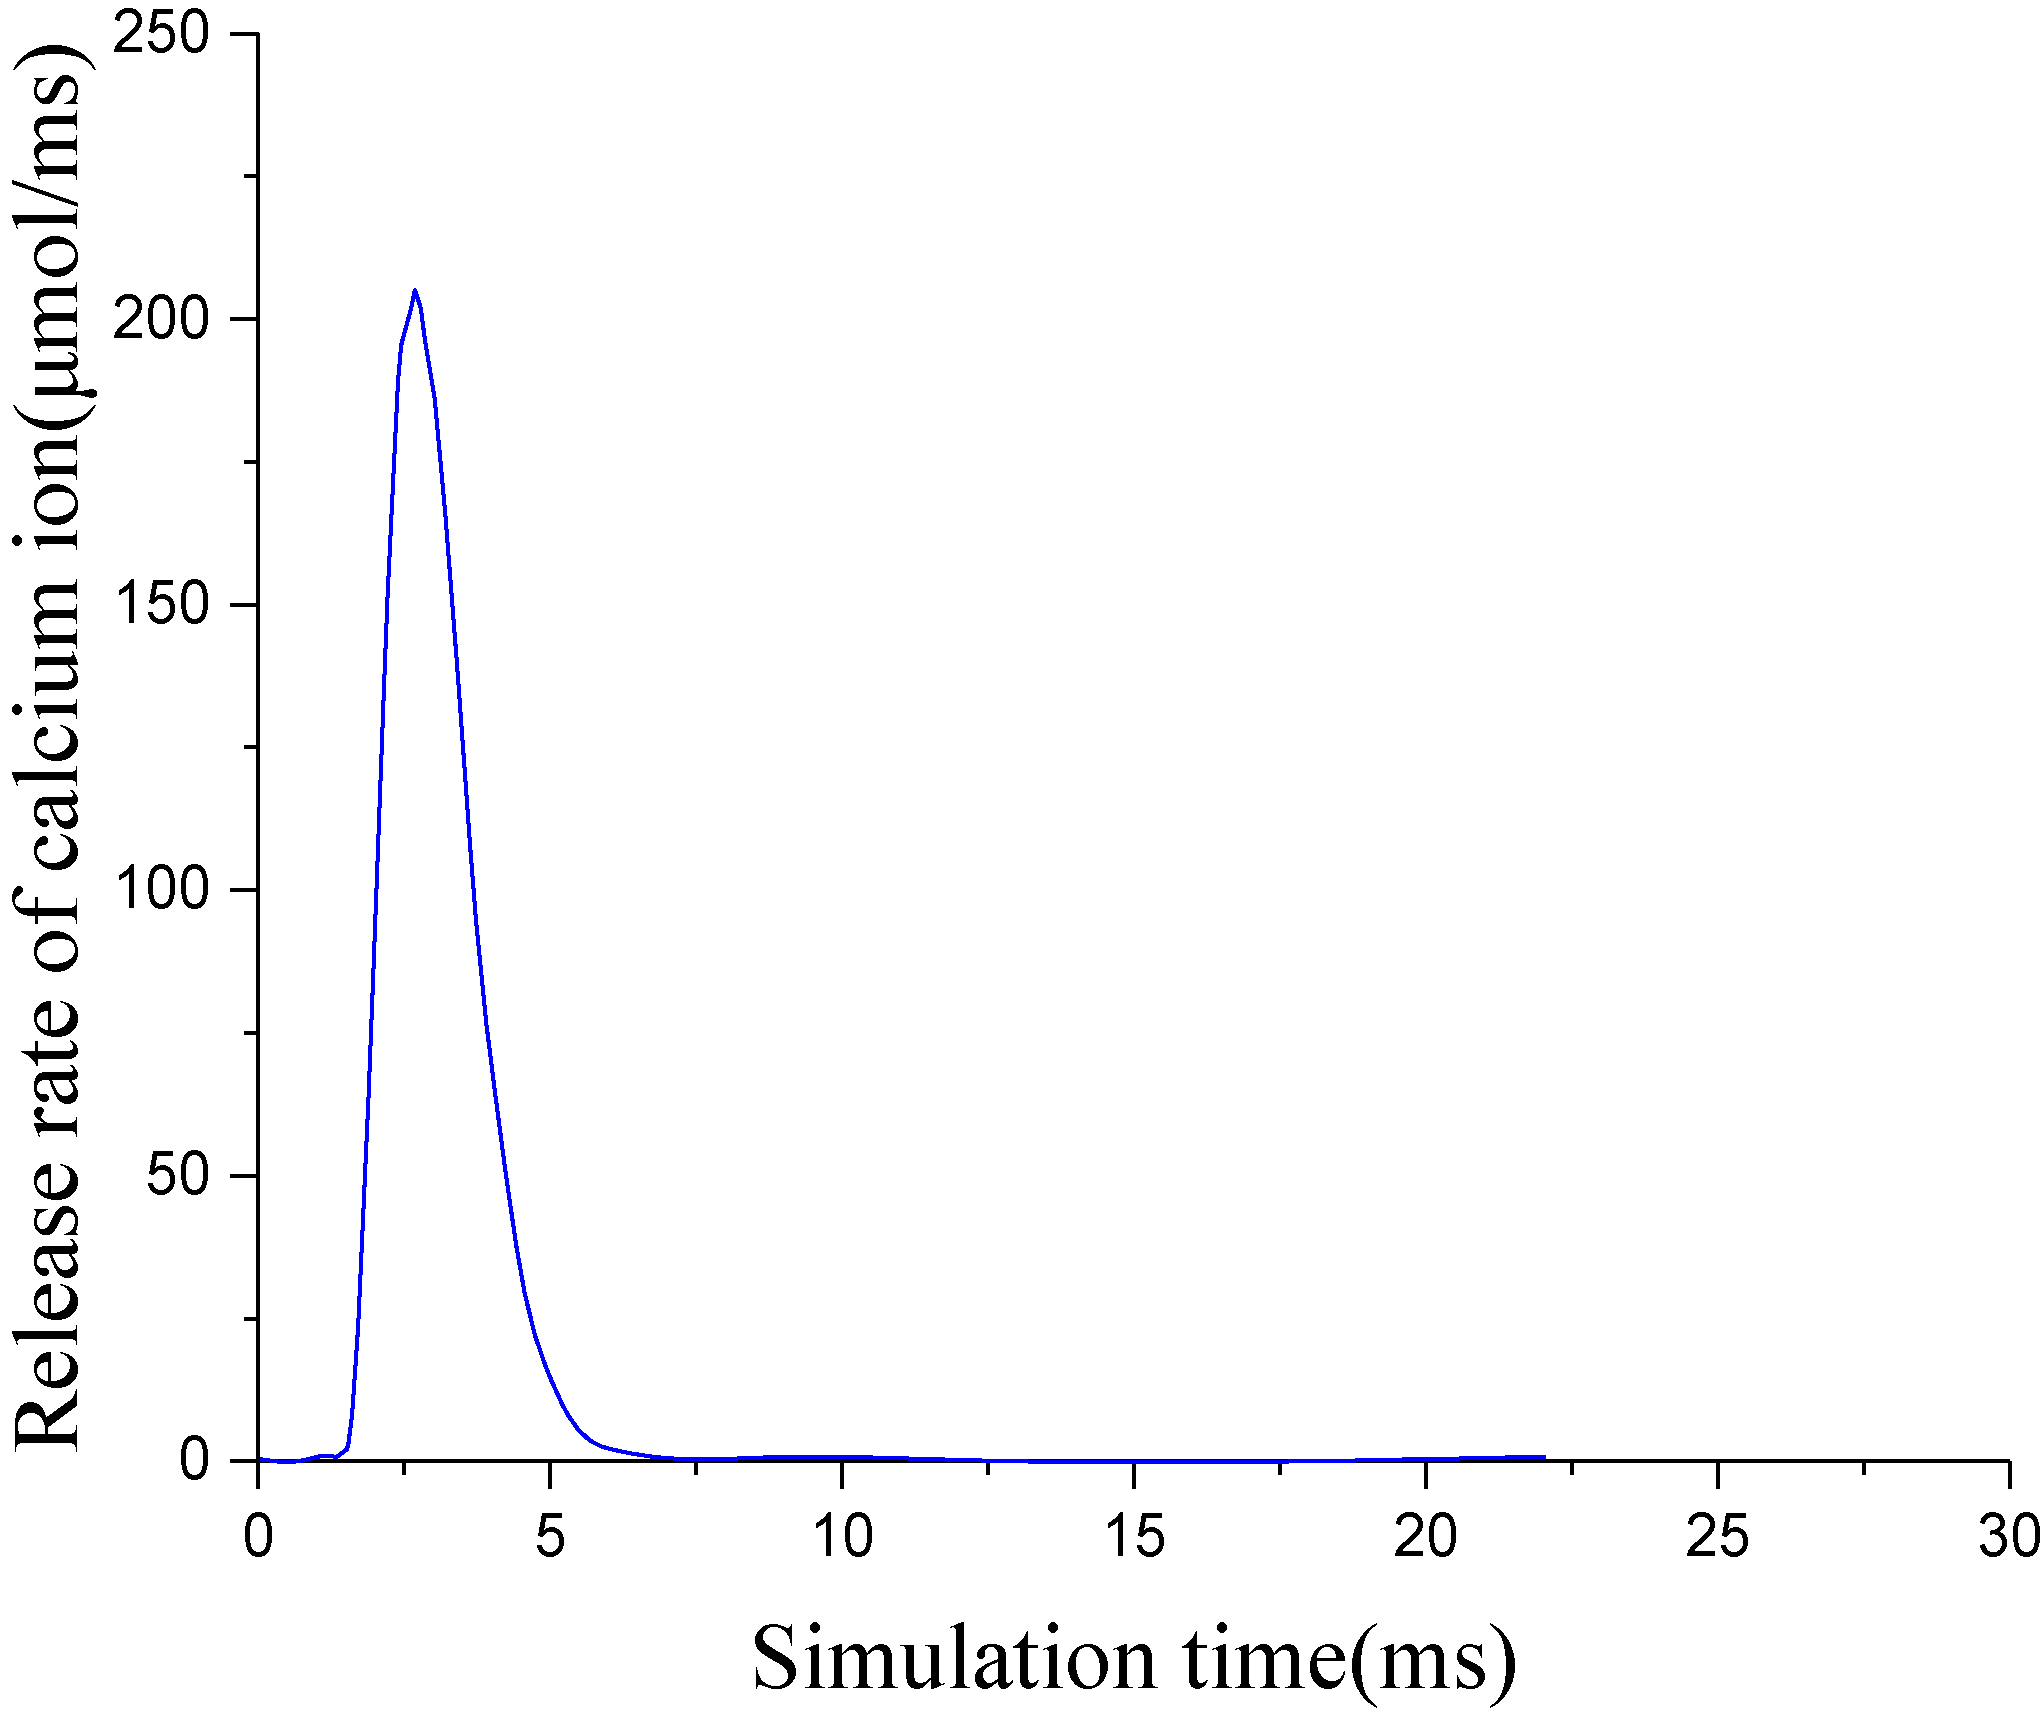
Figure 3.
The simulation module of the binding of calcium ion and troponin.
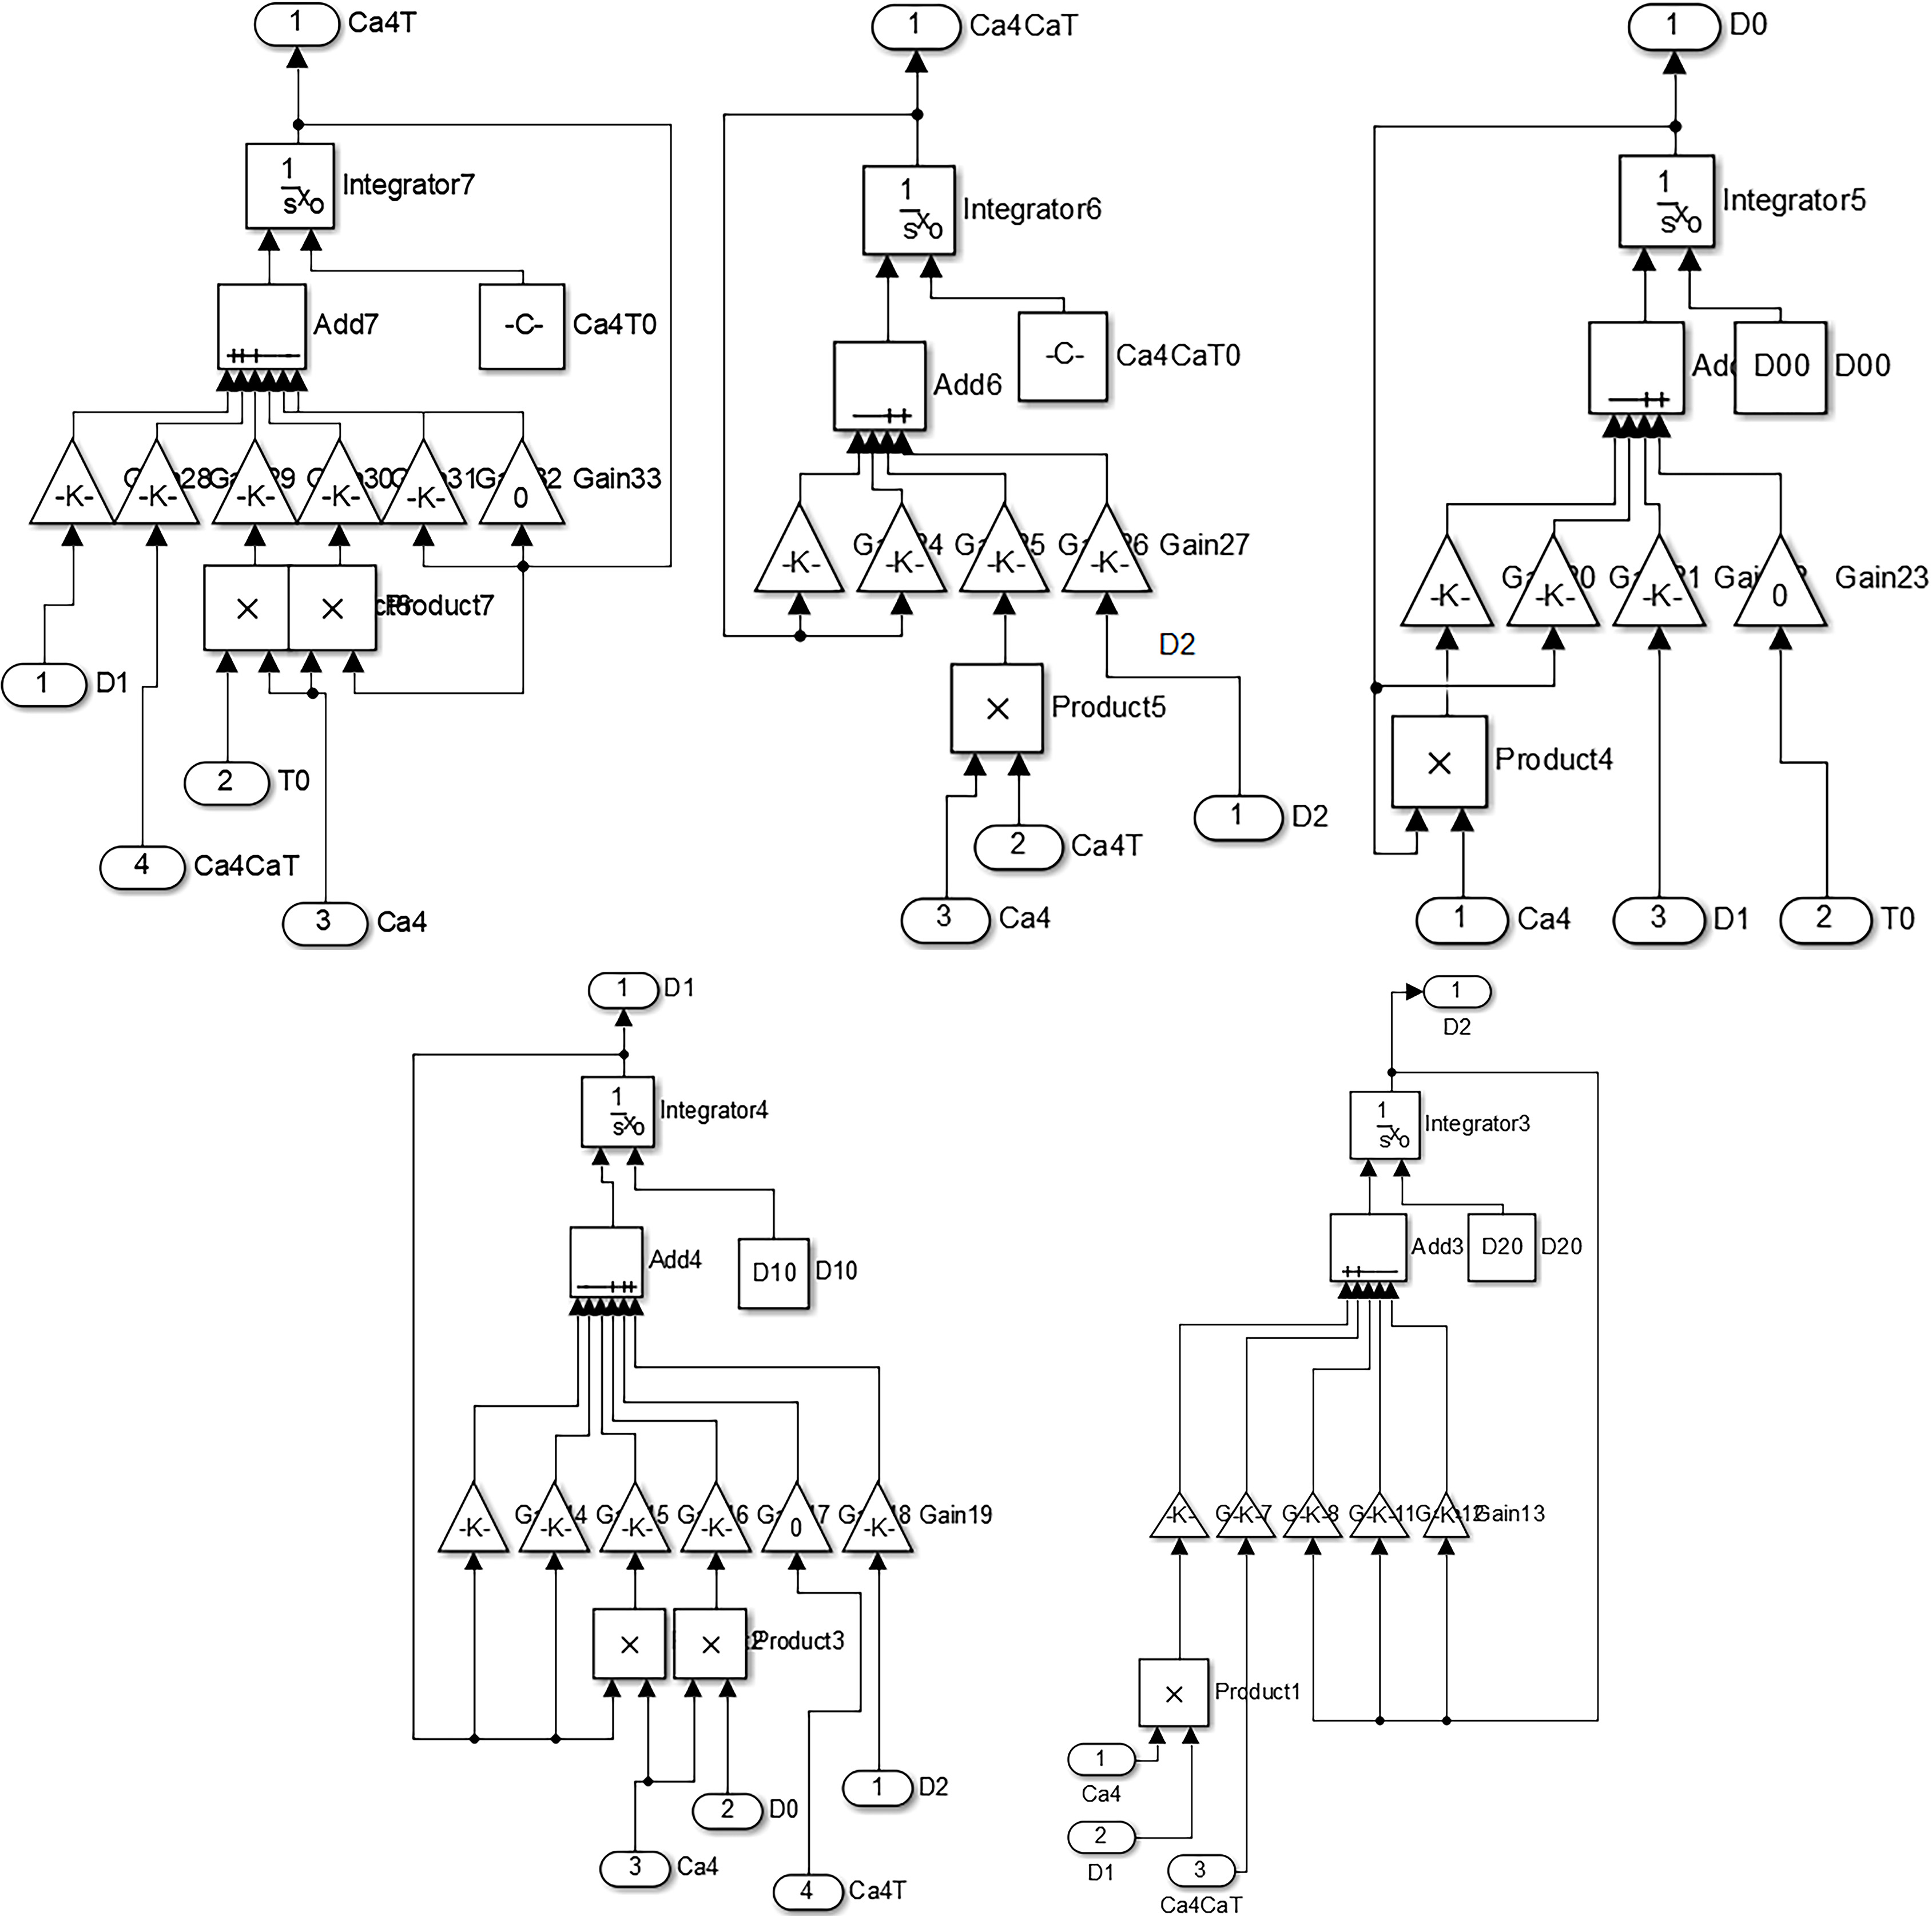
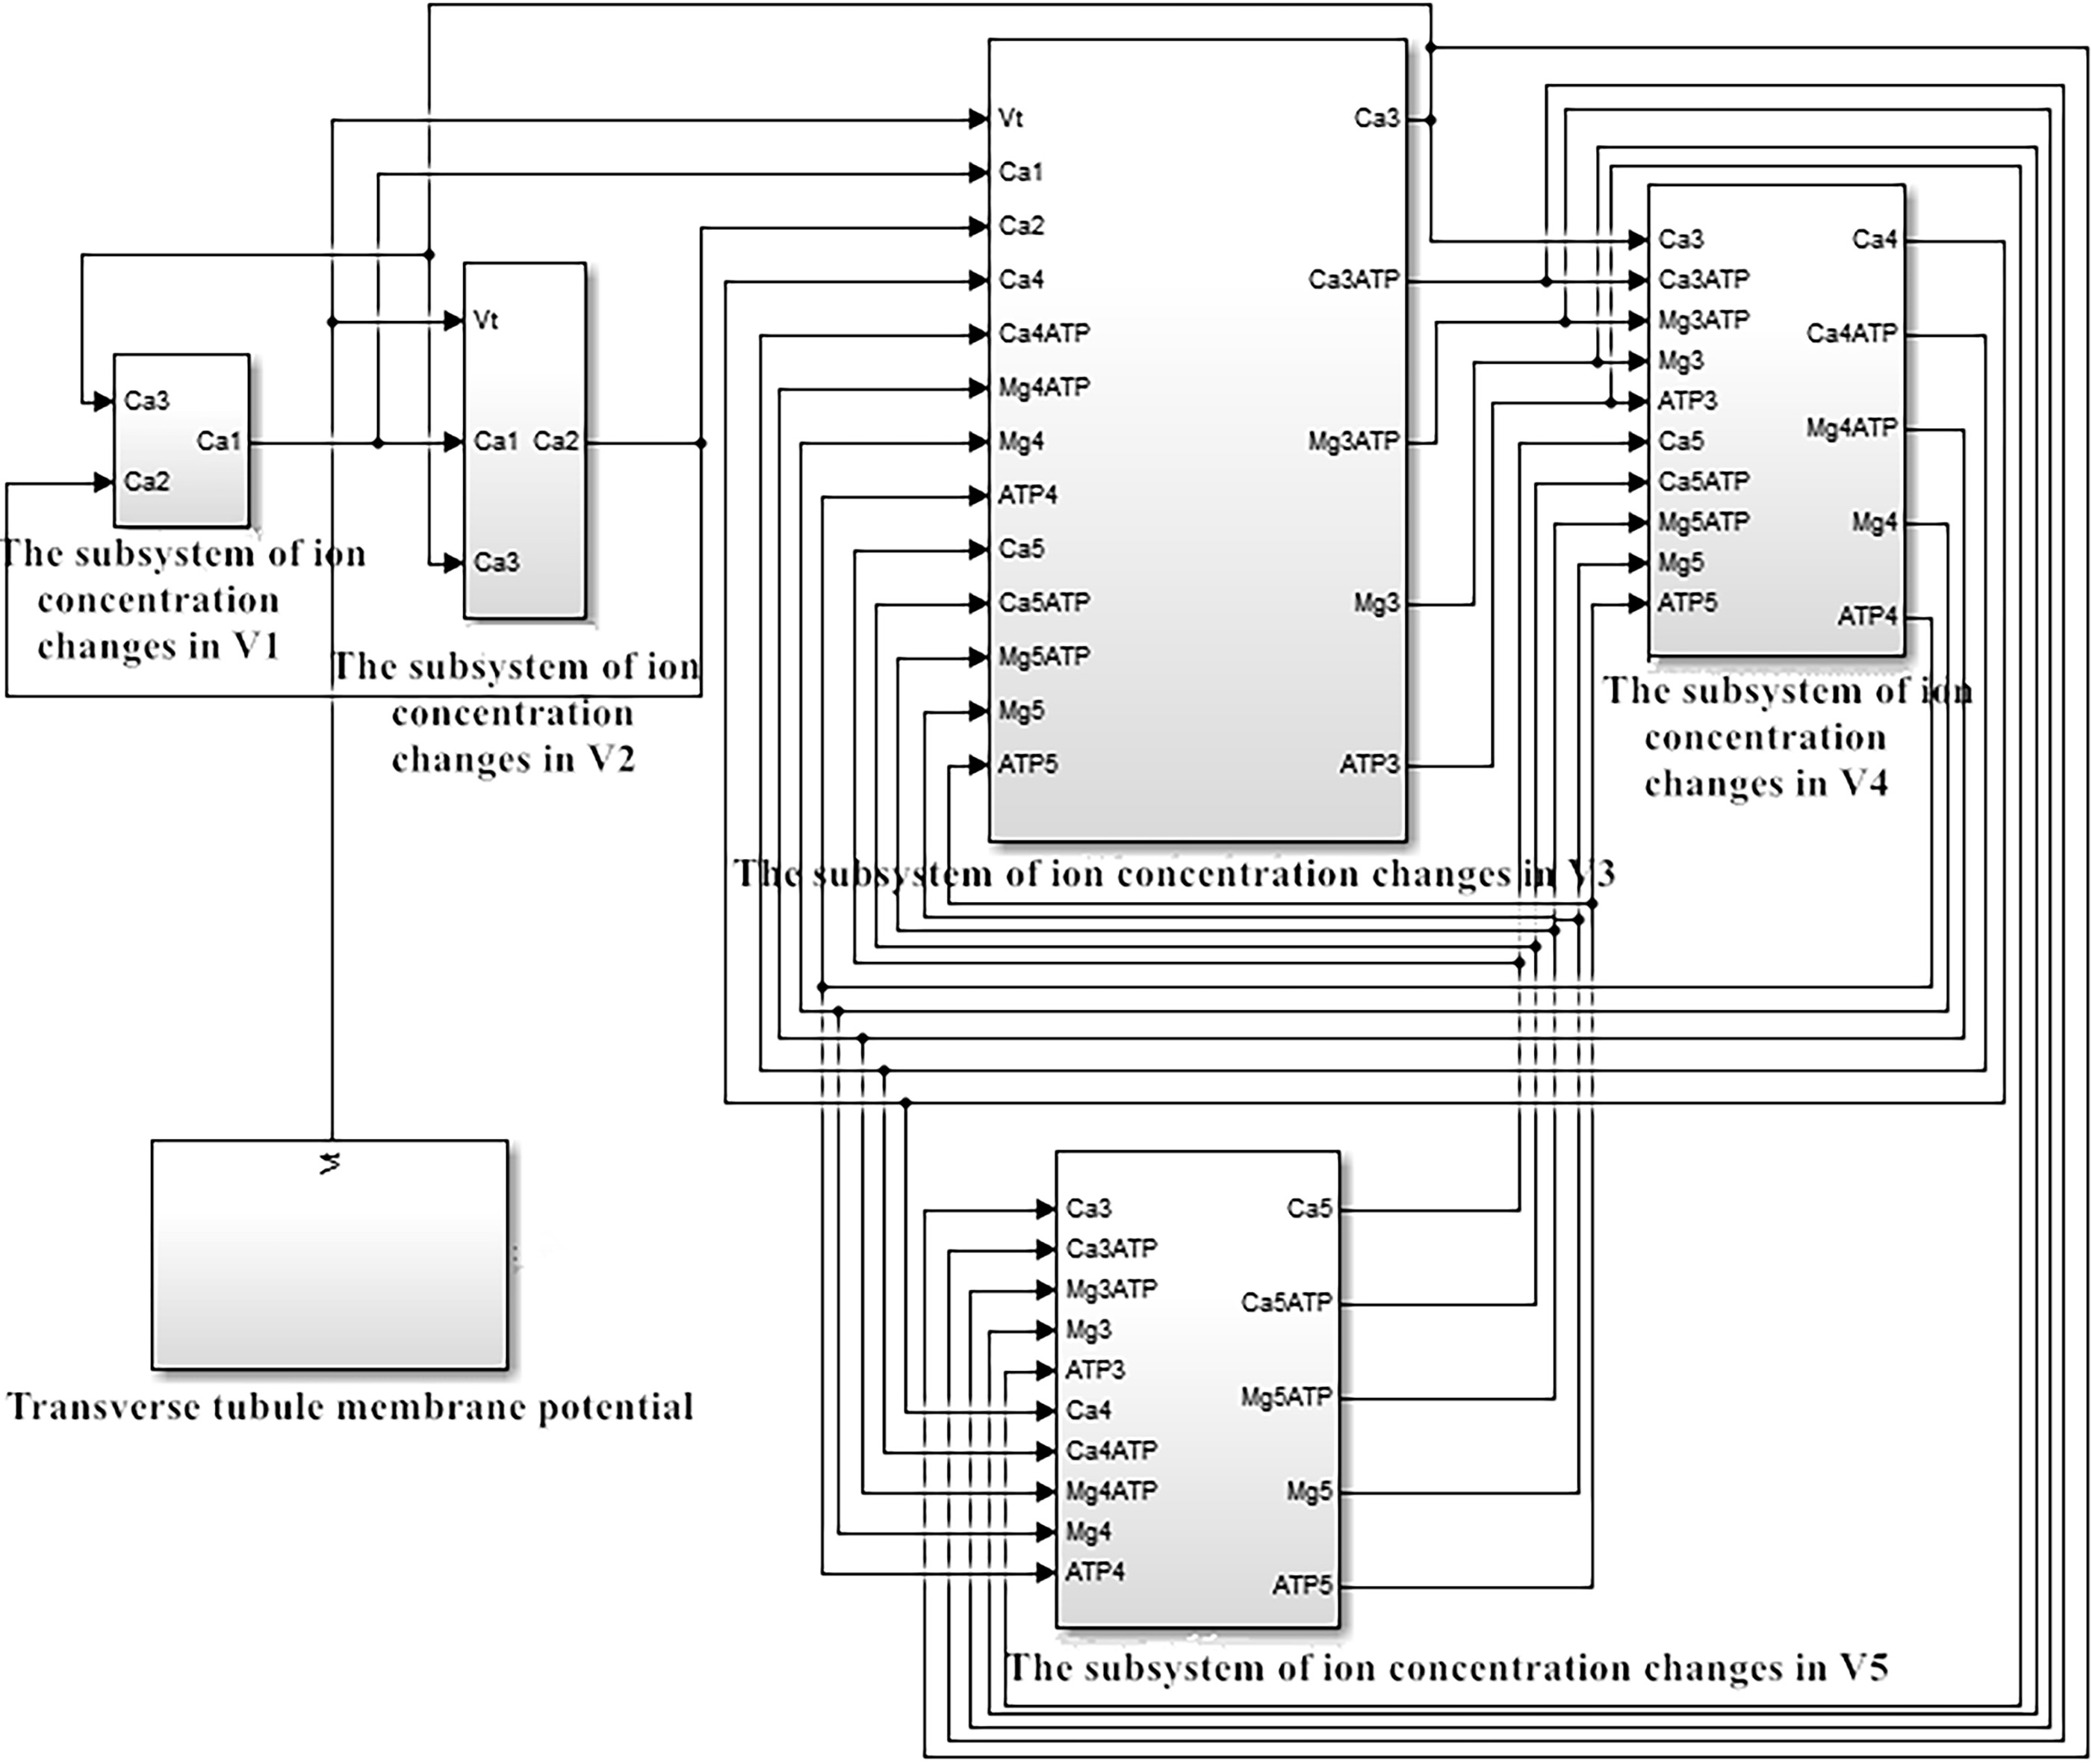
Figure 4.
The simulation system of the excitation-contraction model of fast-twitch fiber of skeletal muscle when non-coincidence of the thick and thin myofilaments occurs.
When a single action potential is transmitted to the transverse tubule membranes, the dihydropyridine voltage receptor (DHPR) on the transverse tubule membranes is coupled to the Reynolds channel on the terminal cistern to control the release of
Figure 5.
The average concentration of free calcium ions in sarcoplasm.
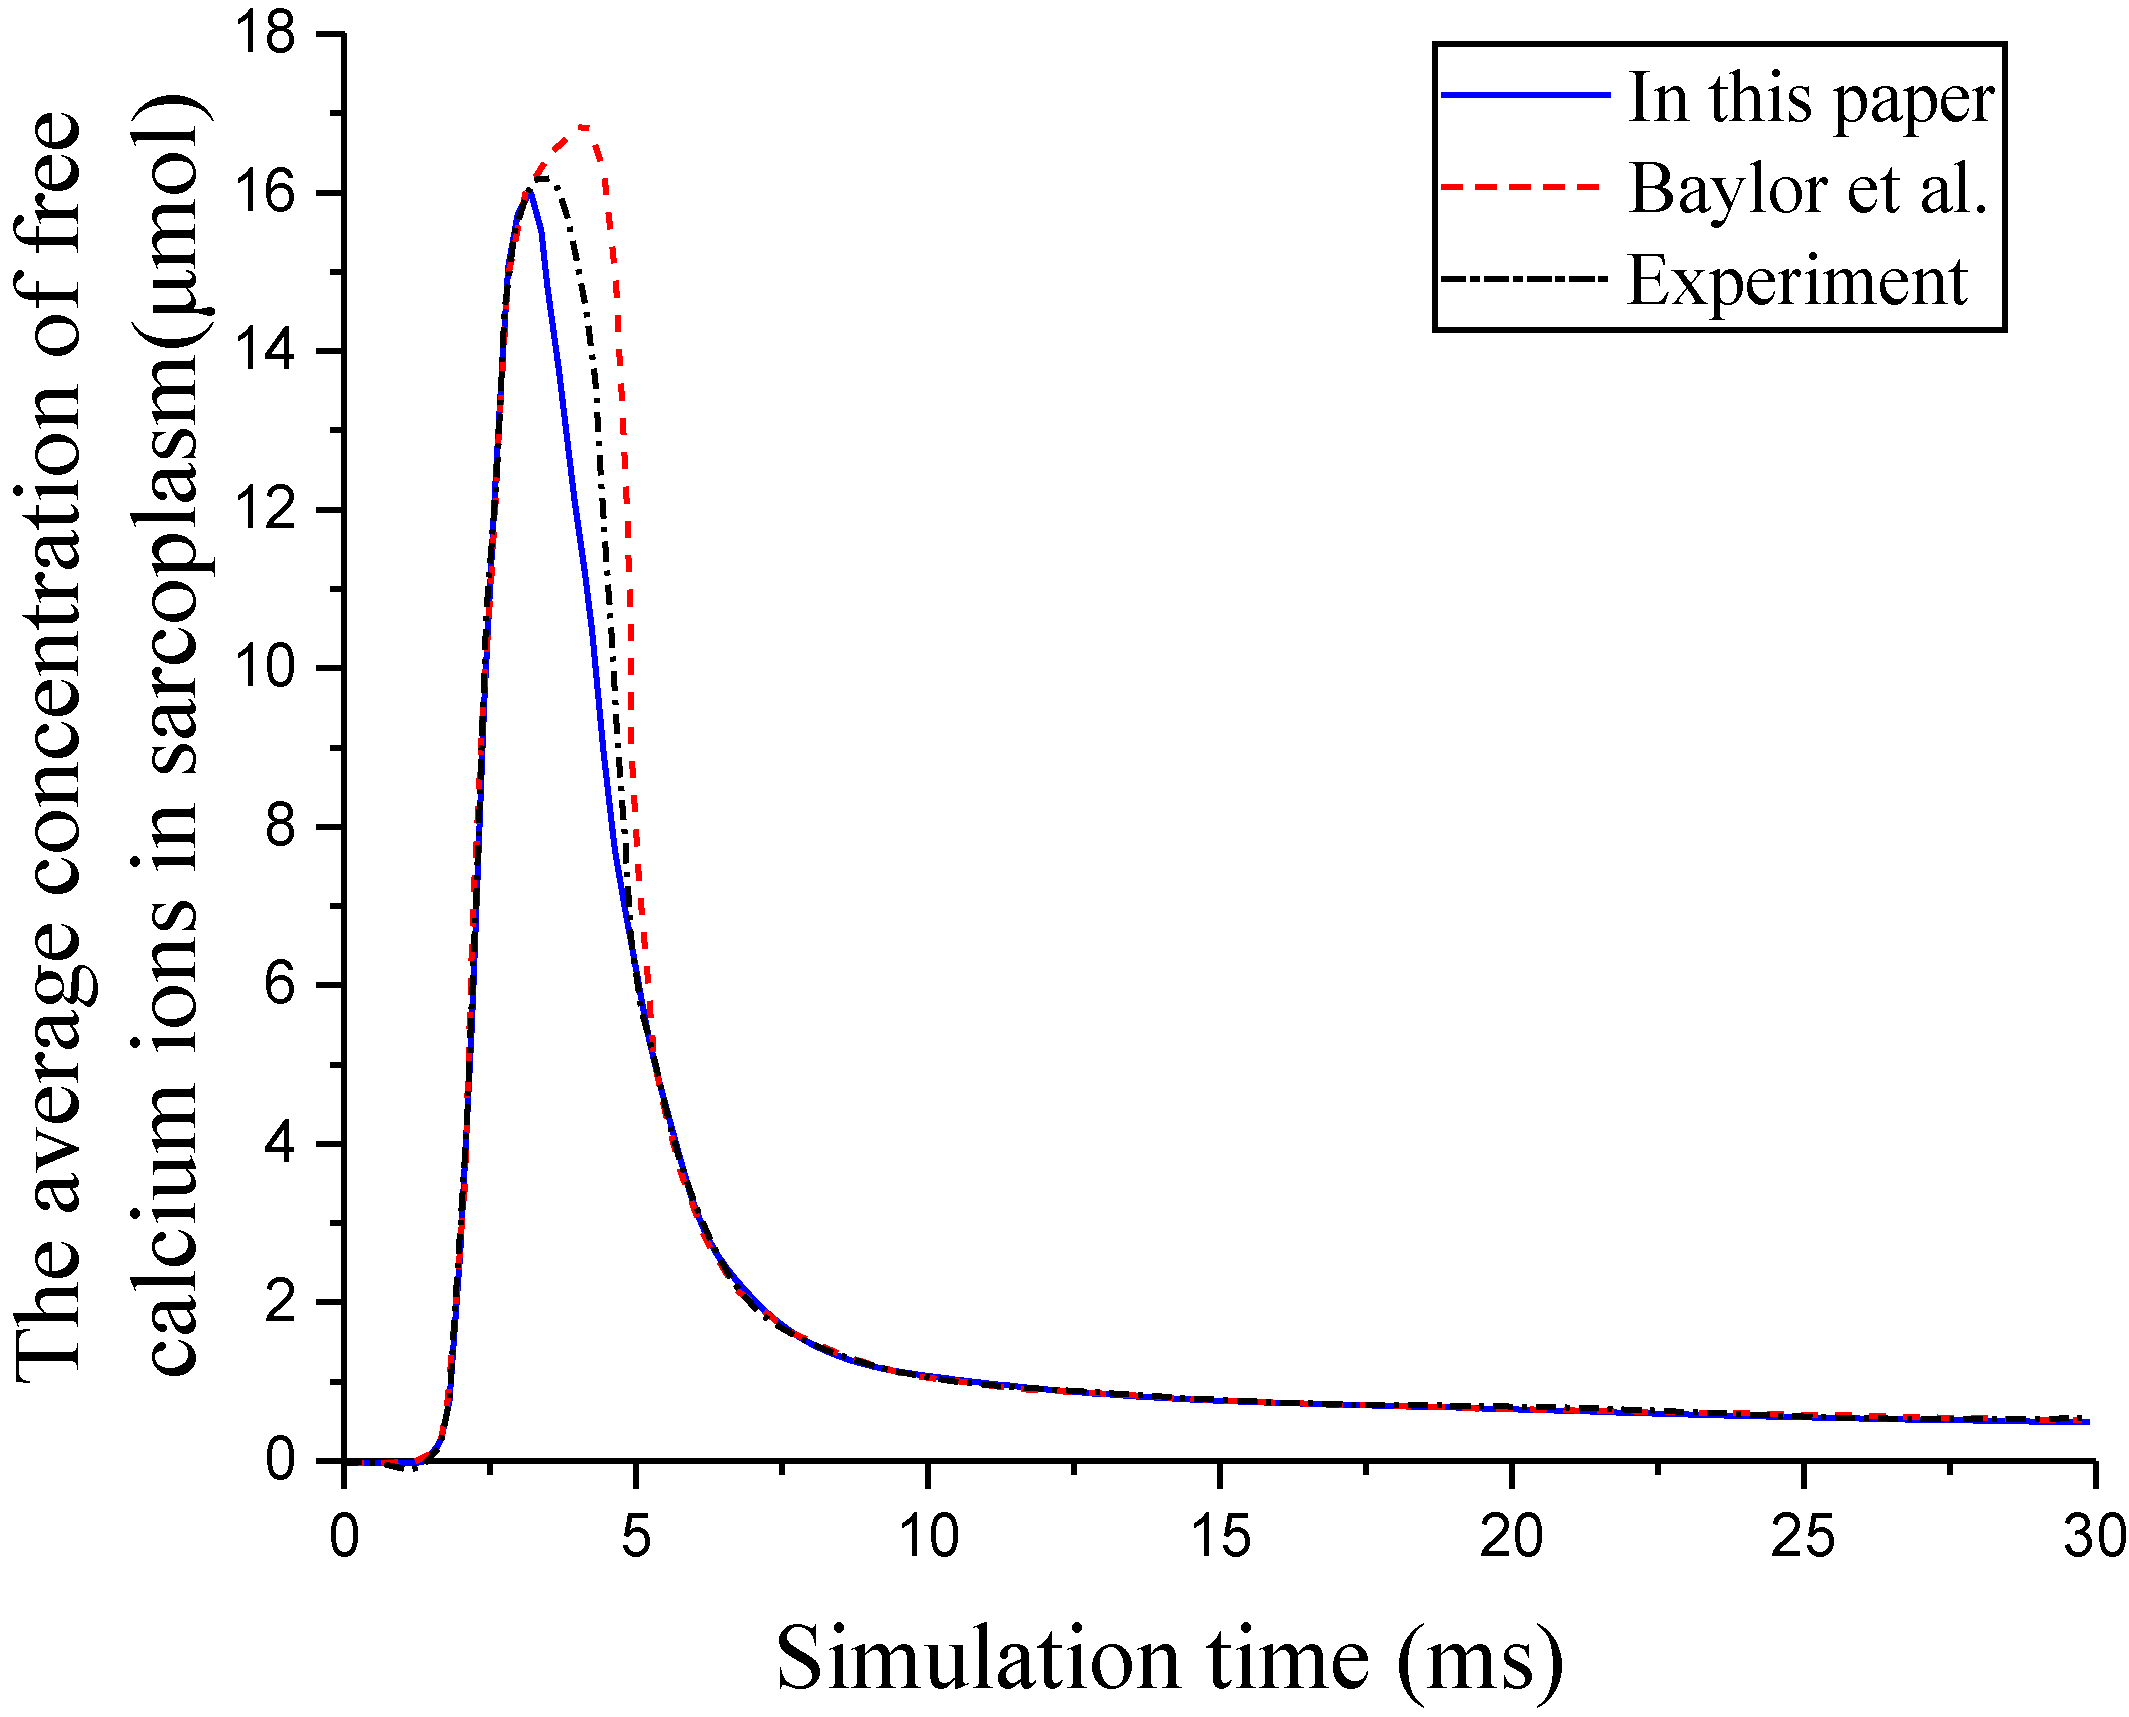
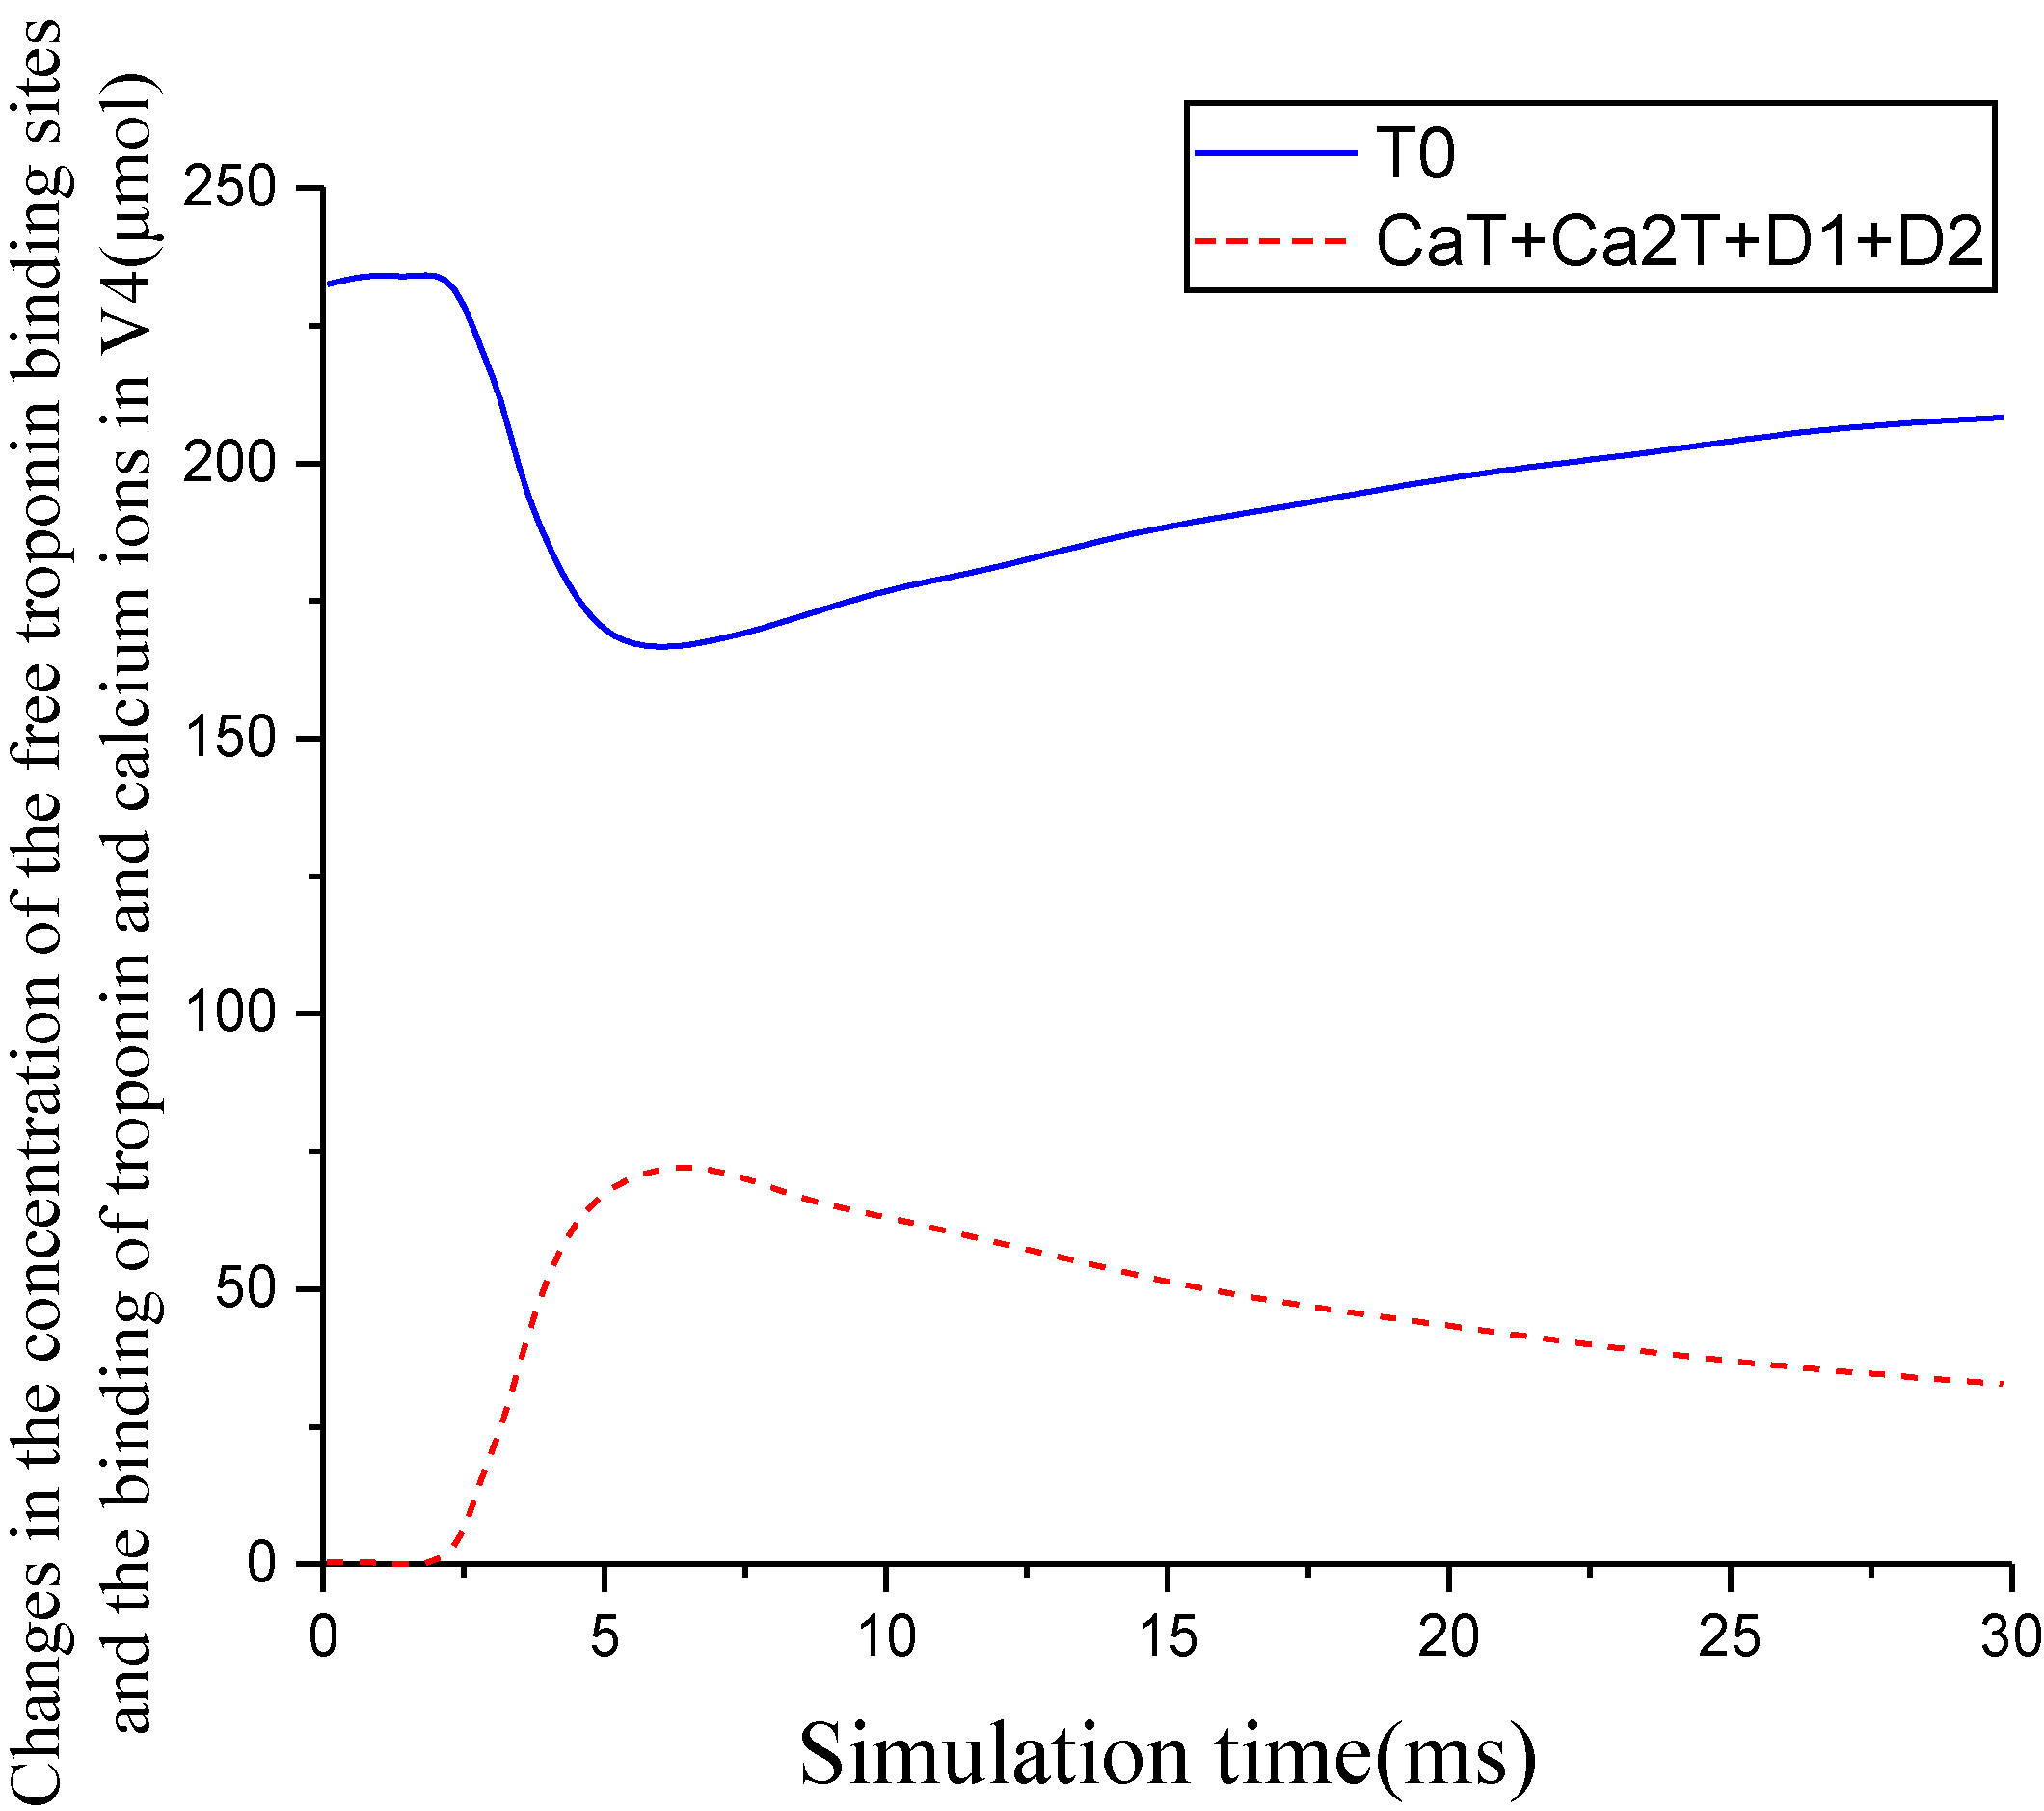
Figure 6.
Changes in the concentration of the free troponin binding sites and the binding of troponin and calcium ions in V4.
The simulation results showed that the concentrations of calcium ions in V3, V4, and V5 regions increased after 1.4 ms, and the concentrations of free calcium ions in V3 reached a peak value of 24
Figure 7.
Changes in the concentration of troponin and tropomyosin regulated the units in V4.
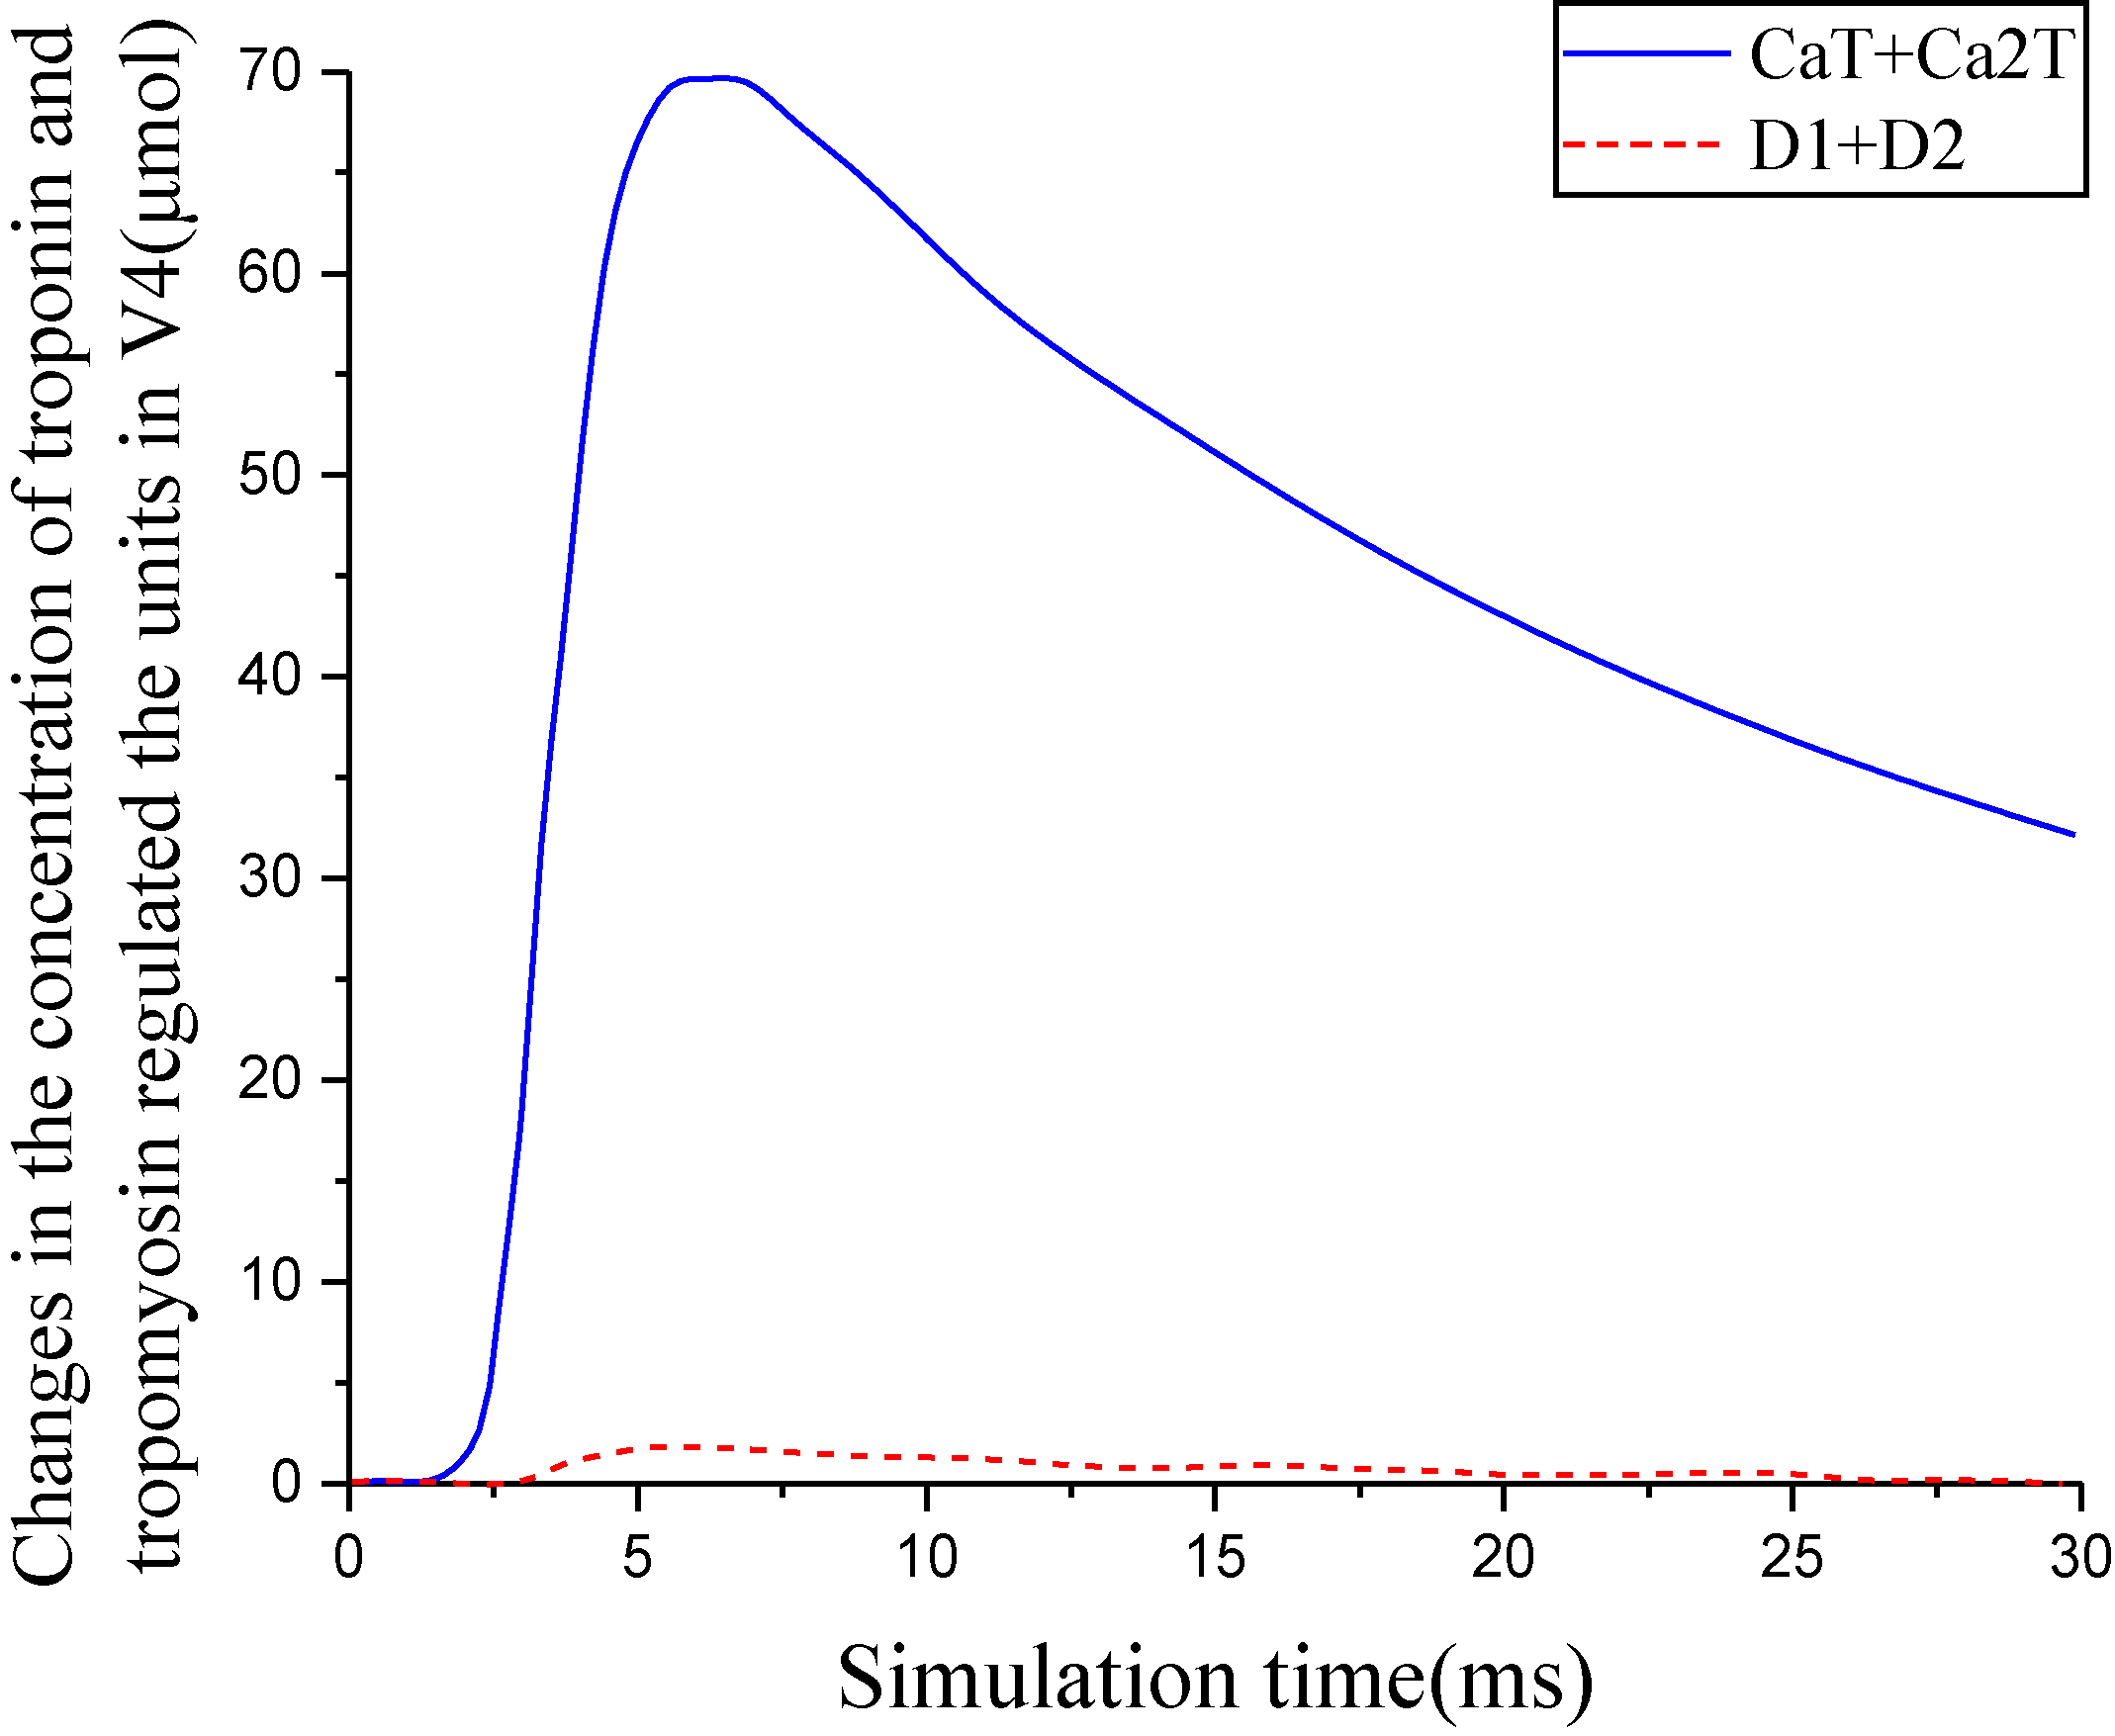
Figure 8.
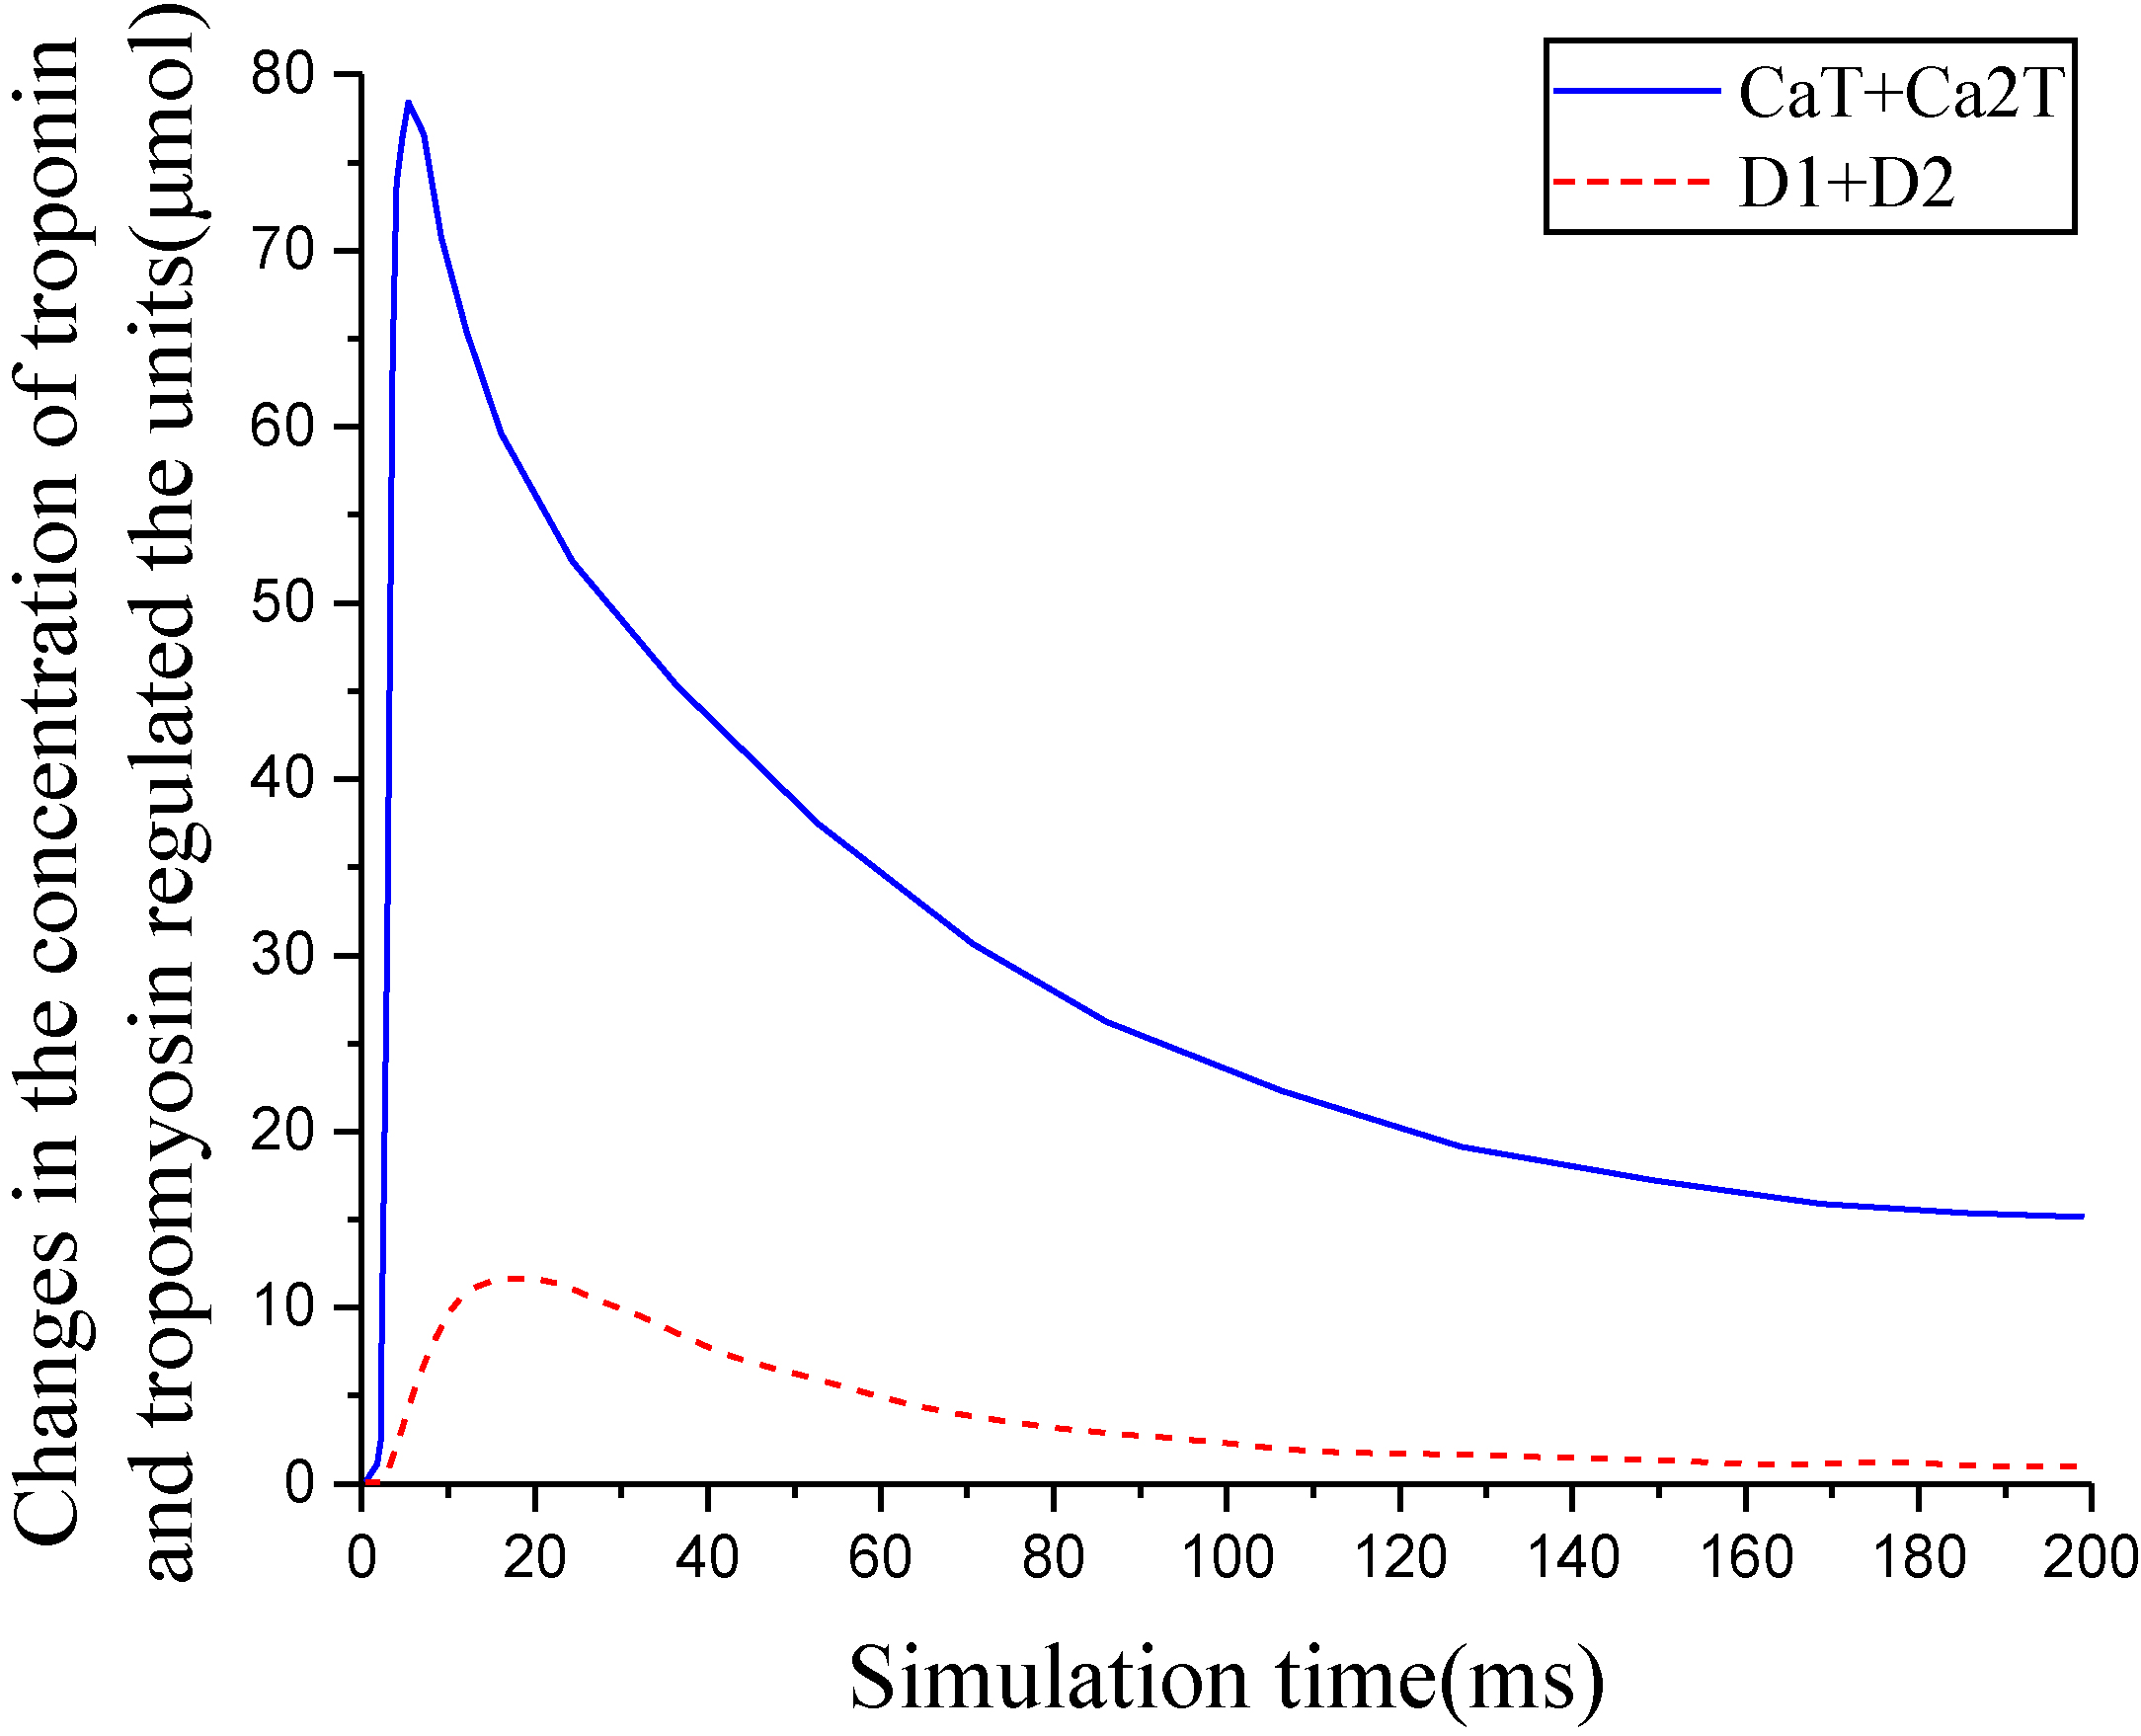
Changes in the concentration of troponin and tropomyosin regulated the units.
3.2Simulation analysis of the excitation-contraction model of skeletal fast muscle fiber in the condition of coincidence of the thick and thin myofilaments
When the half-sarcomere’s length was
When
Figure 9.
Degree of cross-bridge activation.
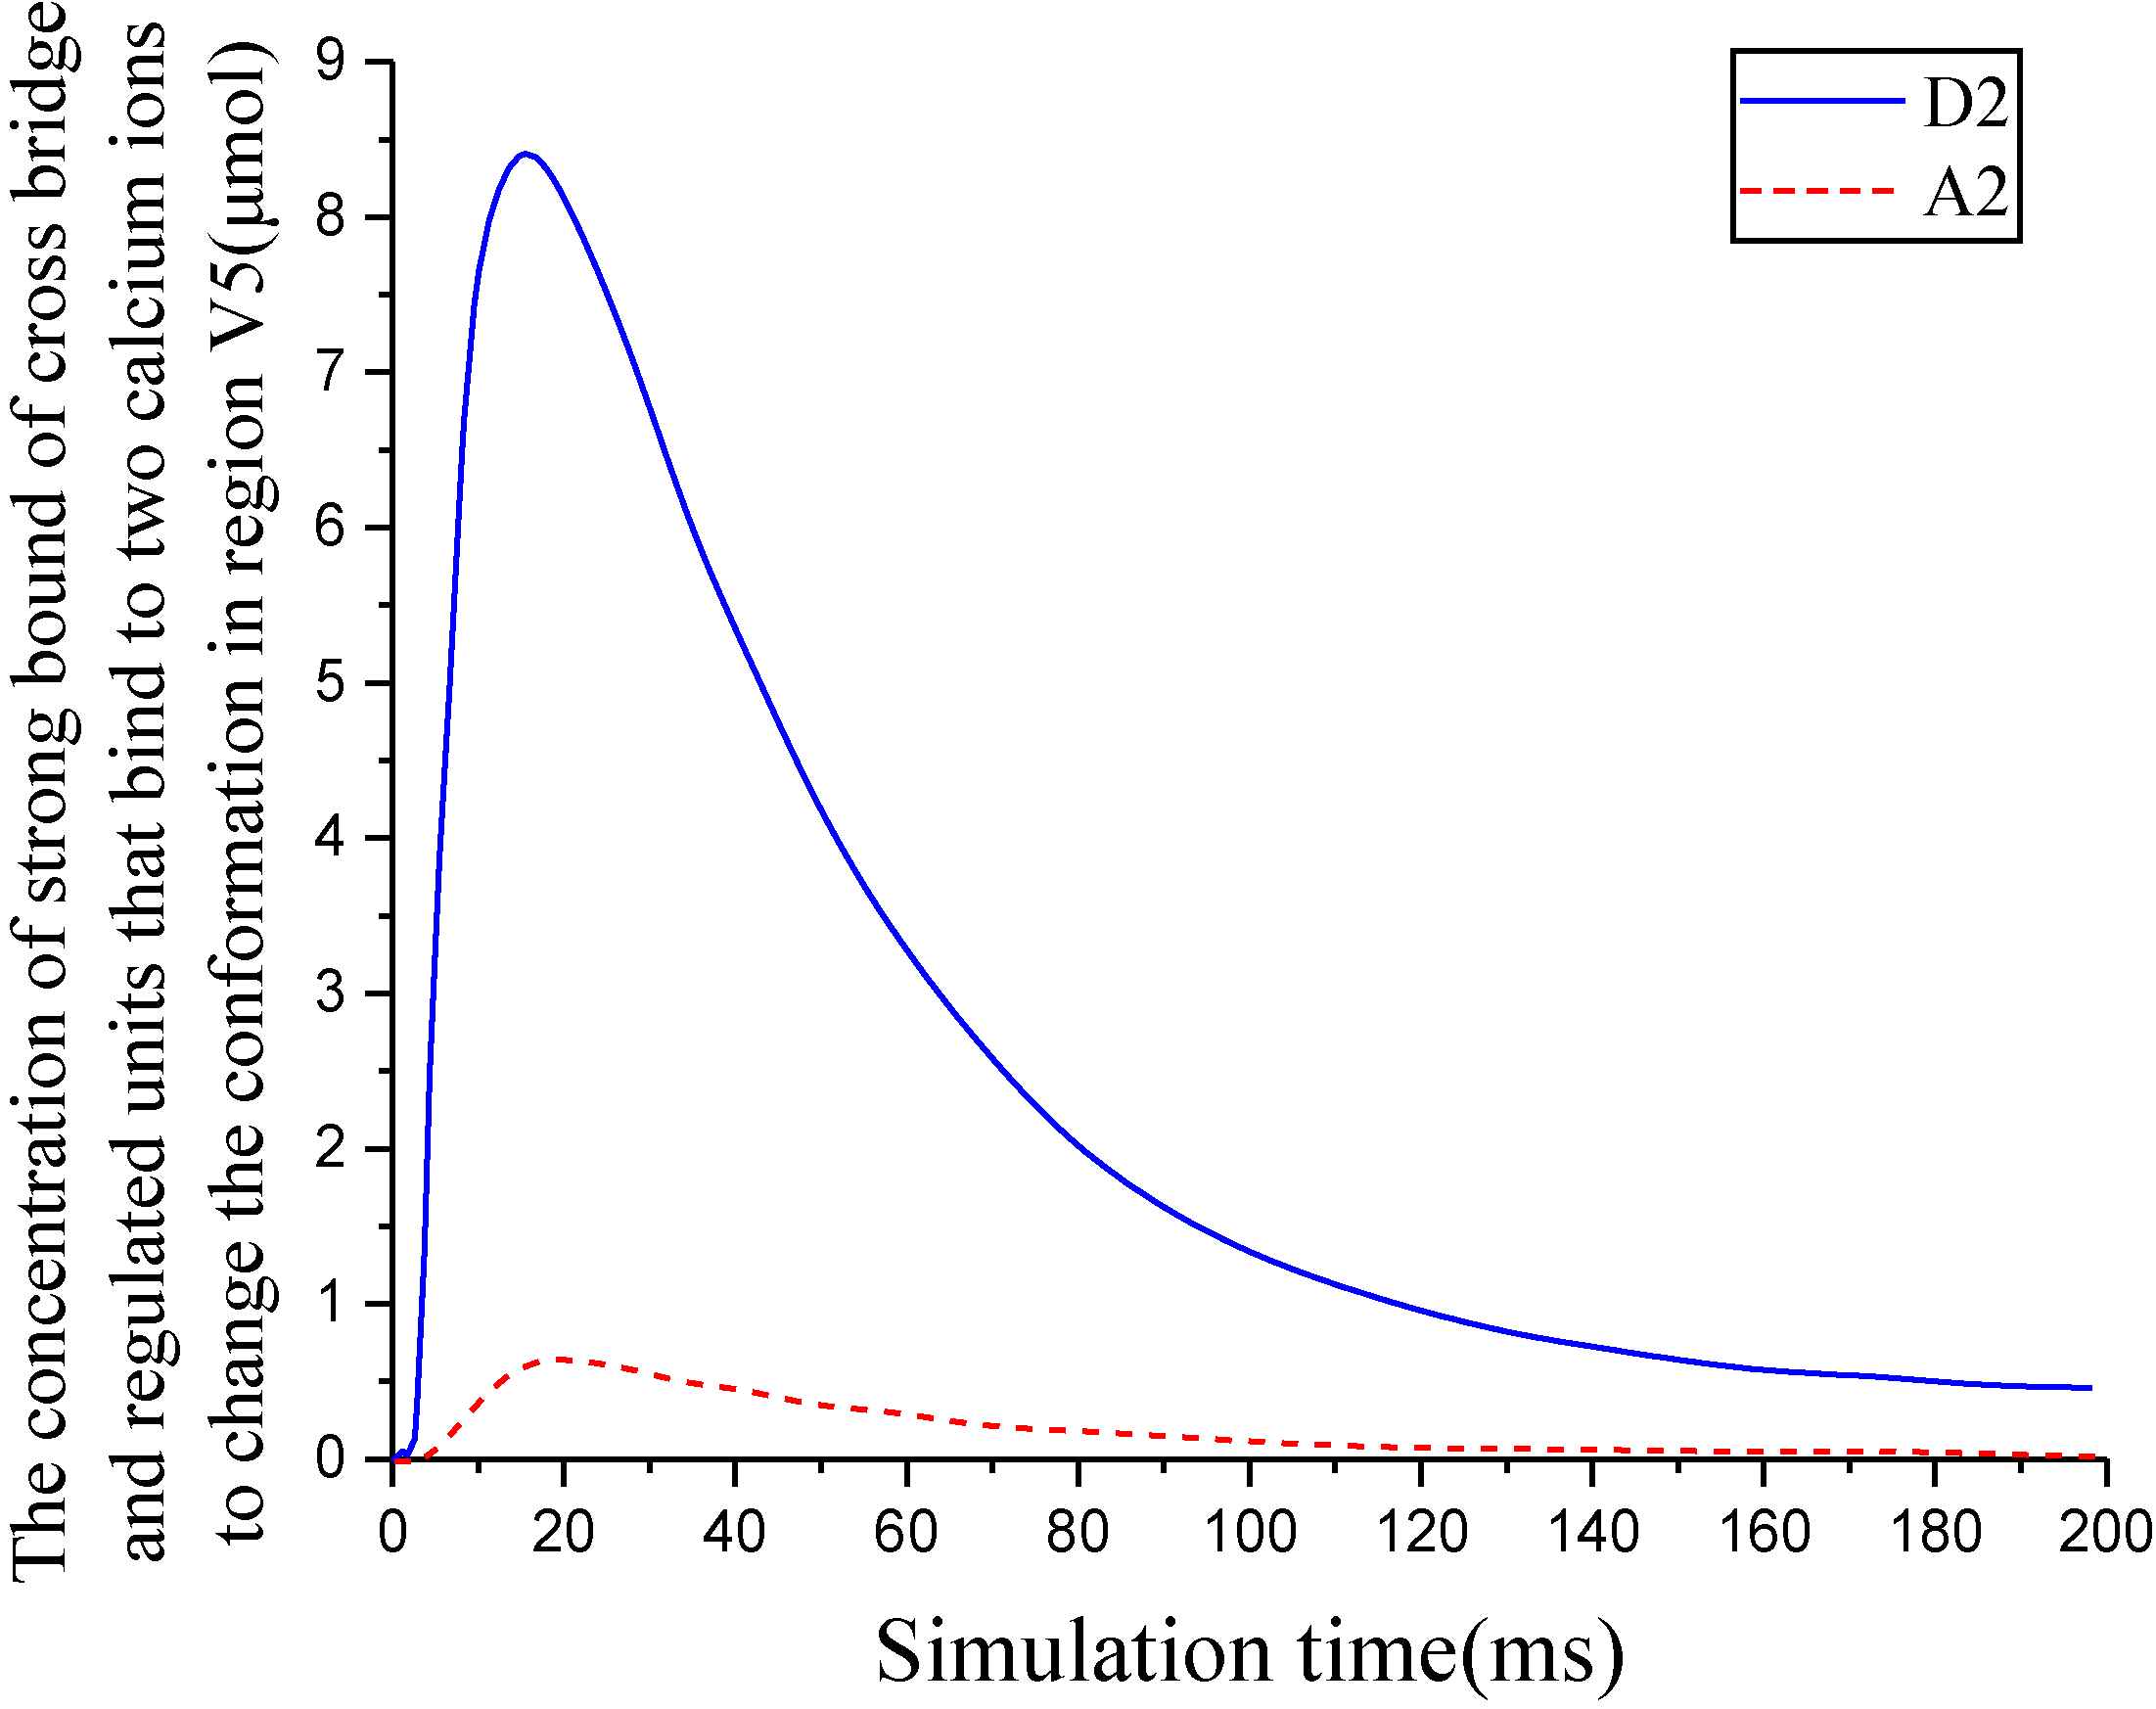
Figure 10.
ATP hydrolyzed to produce phosphate.
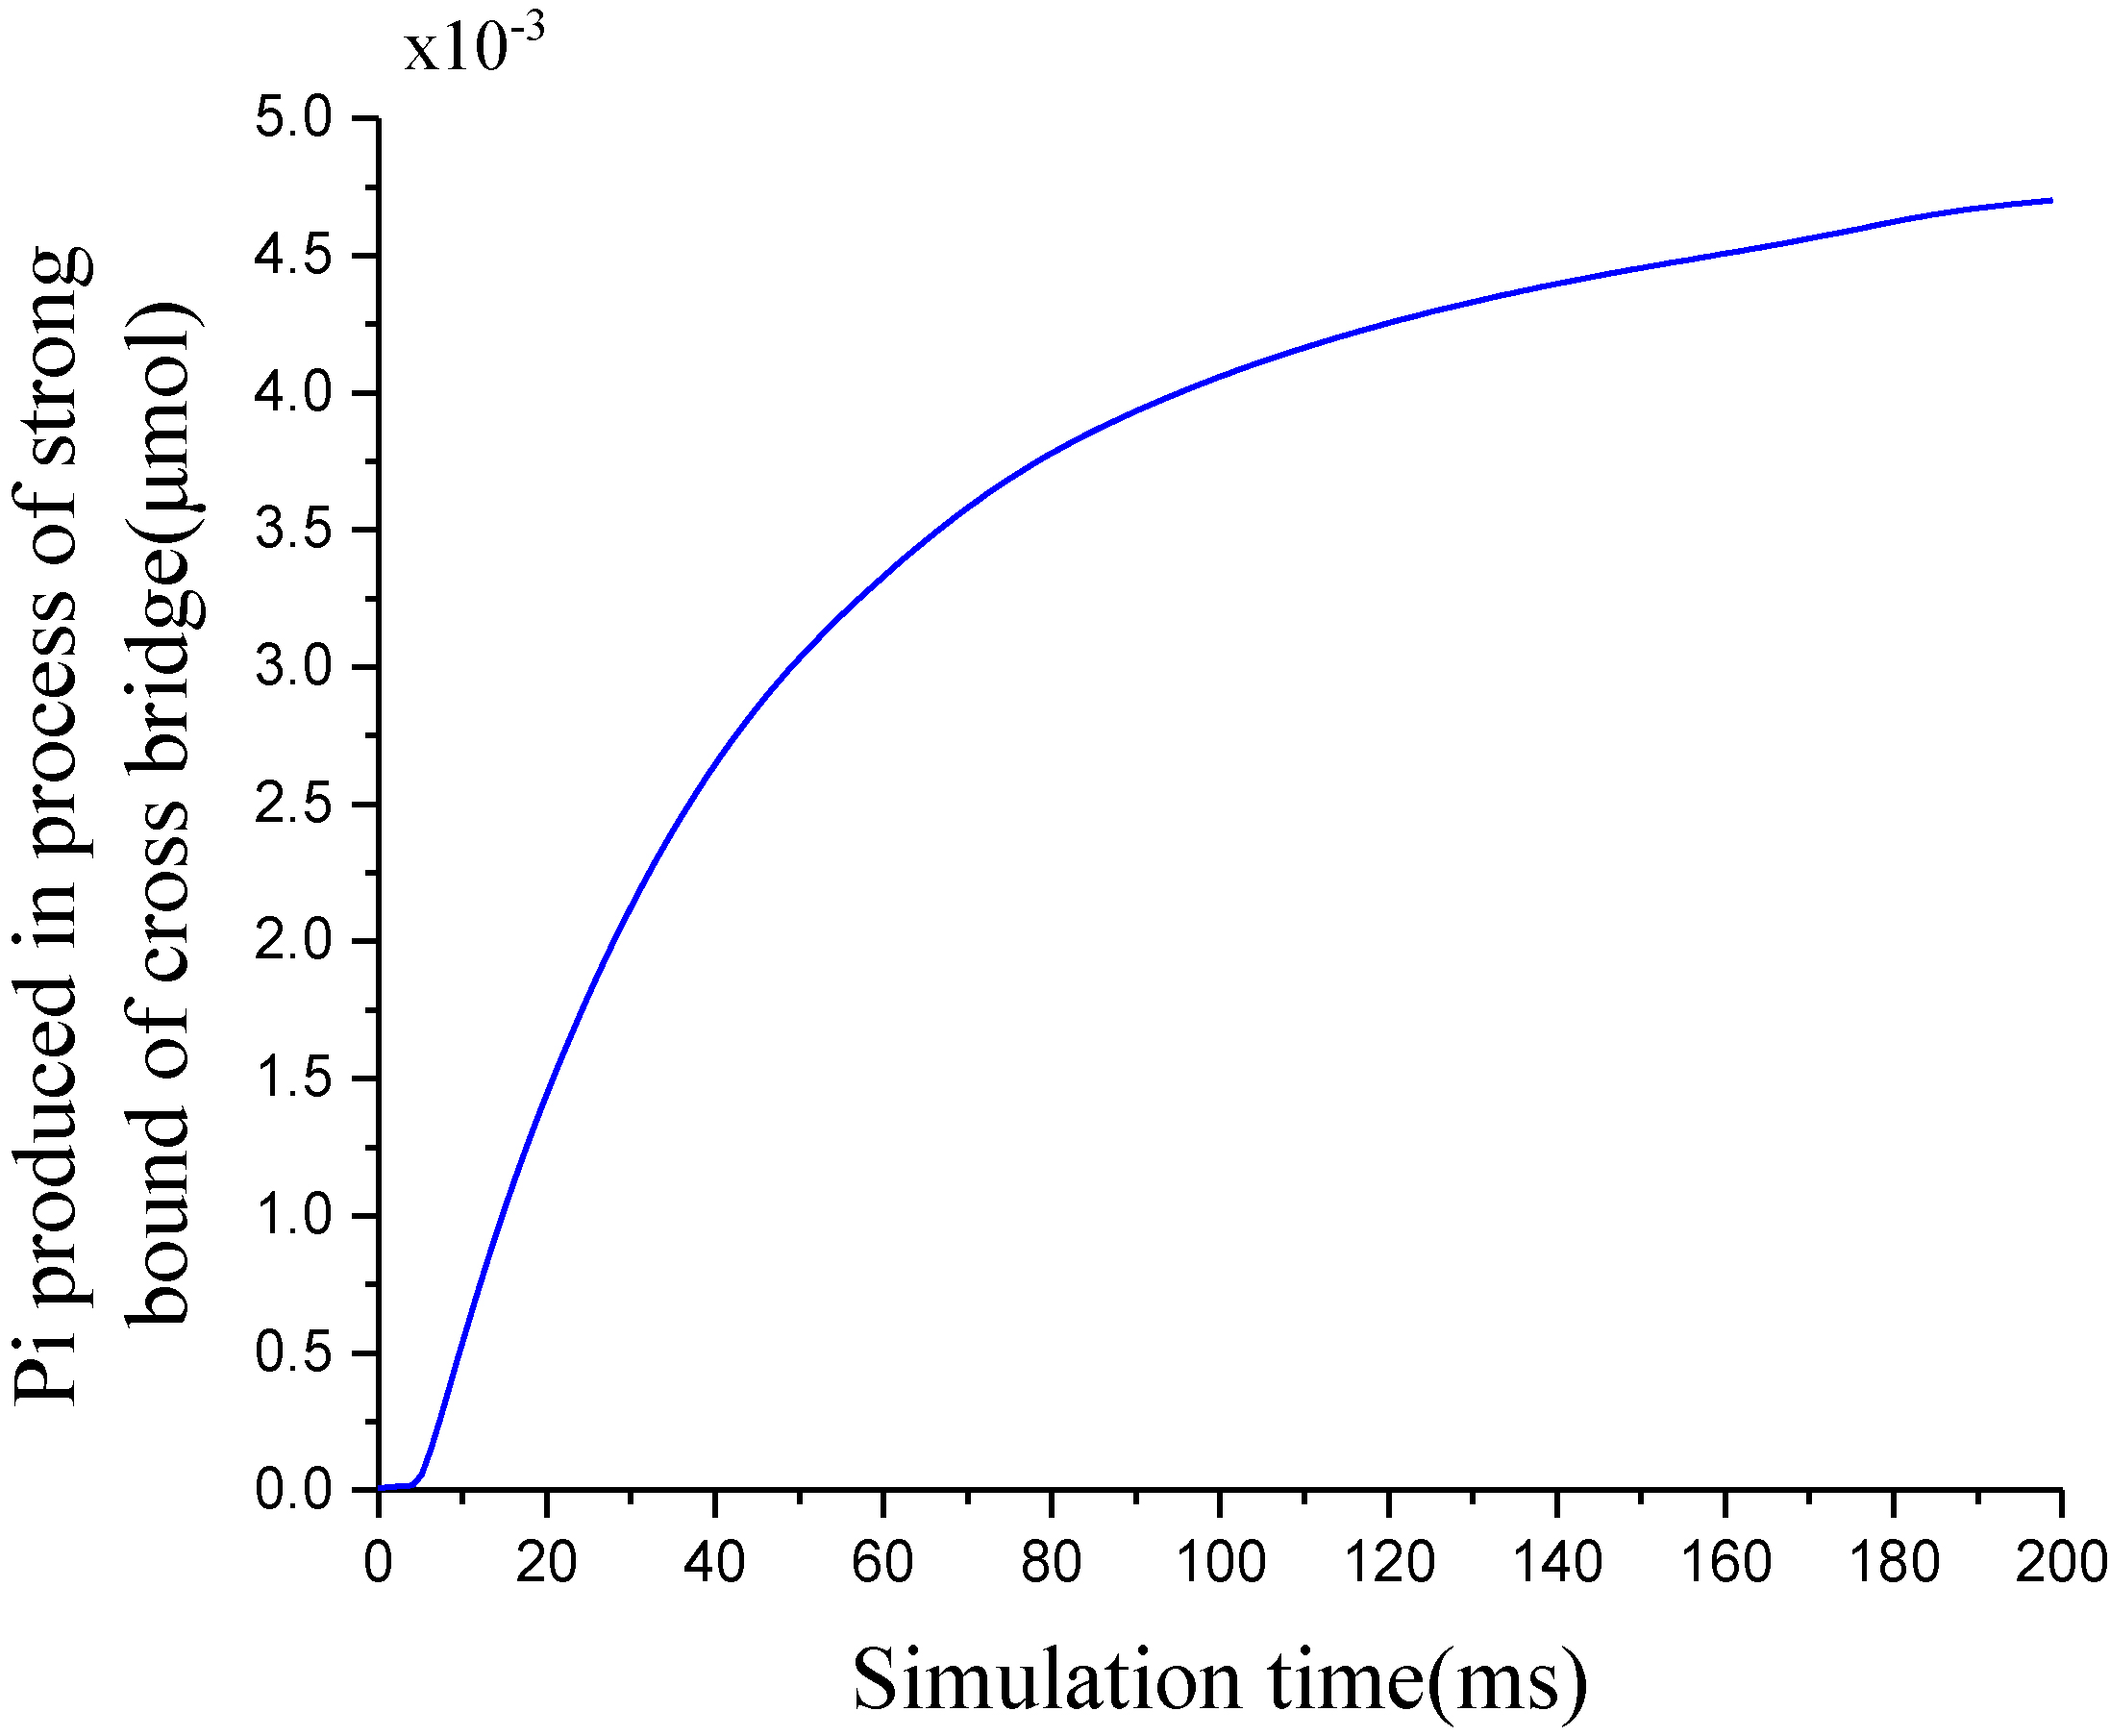
When the length of the half-sarcomere is
Acknowledgments
This research was supported by NSFC (No. 61572159, No. 61972117), the Natural Science Foundation of Heilongjiang Province of China (ZD2019E007).
Conflict of interest
None to report.
References
[1] | Cannon SC, Brown RH, David JR, Corey P. Theoretical reconstruction of myotonia and paralysis caused by incomplete inactivation of sodium channels. Biophysical Journal. (1993) ; 65: : 270-288. |
[2] | Stanfield PR, Nakajima S, Nakajima Y. Constitutively active and G-protein coupled inward rectifier K+ channels: Kir2.0 and Kir3.0. Rev Physiol Biochem Pharmacol. (2002) ; 145: : 47-179. |
[3] | Dassau L, Conti LR, Radeke CM, Ptacek LJ, Vandenberg CA. Kir2.6 regulates the surface expression of Kir2.x inward rectifier potassium channels. J Biol Chem. (2011) ; 286: : 9526-9541. |
[4] | Difranco M, Yu C, Quinonez M, Vergara JL. Inward rectifier potassium channels in mammalian skeletal muscle fibers. J Physiol. (2015) ; 593: (5): 1213-1238. |
[5] | DiFranco M, Herrera A, Vergara JL. Chloride currents from the transverse tubular system in adult mammalian skeletal muscle fibers. J Gen Physiol. (2011) ; 137: : 21-41. |
[6] | DiFranco M, Vergara JL. The Na conductance in the sarcolemma and the transverse tubular system membranes of mammalian skeletal muscle fibers. J Gen Physiol. (2011) ; 138: : 393-419. |
[7] | DiFranco M, Quinonez M, Vergara JL. The delayed rectifier potassium conductance in the sarcolemma and the transverse tubular system membranes of mammalian skeletal muscle fibers. J Gen Physiol. (2012) ; 140: : 109-137. |
[8] | Baylor SM, Hollingworth S. Model of sarcomeric Ca2+ movements, including ATP Ca2+ binding and diffusion, during activation of frog skeletal muscle. Gen. Physiol. (1998) ; 112: : 297-316. |
[9] | Hollingworth S, Zeiger U, Baylor SM. Comparison of the myoplasmic calcium transient elicited by an action potential in intact fibres of mdx and normal mice. Journal of Physiology. (2008) ; 586: : 5063-5075. |
[10] | Hollingworth S, Gee KR, Baylor SM. Low-affinity Ca2+ indicators compared in measurements of skeletal muscle Ca2+ transients. Biophys. J. (2009) ; 97: : 1864-1872. |
[11] | Hollingworth S, Kim MM, Baylor SM. Measurement and simulation of myoplasmic calcium transients in mouse slow-twitch muscle fibres. Journal of Physiology. (2012) ; 590: : 575-594. |
[12] | Baylor SM, Hollingworth S. Calcium indicators andcalcium signalling in skeletal muscle fibres during excitation-contraction coupling. Prog. Biophys. Mol. Biol. (2011) ; 105: : 162-179. |
[13] | El-Mezgueldi MM. Tropomyosin dynamics. Muscle Res. Cell Motility. (2014) ; 35: : 203-210. |
[14] | Lehrer SS. The 3-state model of muscle regulation revisited: Is a fourth state involved? MuscleRes. Cell Motility. (2011) ; 32: : 203-208. |
[15] | Sun JG. Modeling and simulation of skeletal muscle rapid fiber excitation contraction. Harbin University of Science and Technology. (2018) ; 3: : 25-55. |
[16] | Zot HG, Hasbun JE. Modeling Ca2+-bound troponin in excitation contraction coupling. Frontiers in Physiology. (2016) ; 7: (406): 1-10. |


