
Measurement of pulse transit time using ultra-wideband radar
Abstract
BACKGROUND:
The pulse transit time is an important factor that can be used to estimate the blood pressure indirectly. In many studies, pressures in the artery near and far from the heart are measured or the electrocardiogram and photoplethysmography are used to calculate the pulse transit time. In other words, the so-called contact measurements have been mainly used in these studies.
OBJECTIVE:
In this paper, a new method based on radar technology to measure the pulse transit time in a non-contact manner is proposed.
METHODS:
Radar pulses were simultaneously emitted to the chest and the wrist, and the reflected pulses were accumulated. Heartbeats were extracted by performing principal component analysis on each time series belonging to the accumulated pulses. Then, the matched heartbeat pairs were found among the heartbeats obtained from the chest and wrist and the time delay between them, i.e. the pulse transit time, was obtained.
RESULTS:
By comparing the pulse transit times obtained by the proposed method with those obtained by conventional methods, it is confirmed that the proposed method using the radar can be used to obtain the pulse transit time in a non-contact manner.
1.Introduction
When the aortic valve opens because of ventricular contraction, a stroke volume of blood ejects into the aorta and the aortic pressure reaches its maximum value. The blood flow proceeds in the direction of the periphery and a pulsatile wave is transmitted. It takes some time for the pulsatile wave from the proximal point to reach the distal point. This time delay is called the pulse transit time (PTT). PTT is a useful for determining the arterial stiffness and is also used to estimate blood pressure in a noninvasive way [1, 2, 3, 4, 7, 8, 9]. The most common method of measuring the PTT is to use the time difference between the R peak of the electrocardiogram (ECG) and the feature point of the photoplethysmography (PPG) [2, 3, 5]. In recent, studies on the estimation of the PTT by detecting the change in the blood flow of the palm with infrared imaging without using PPG has been reported [6].
However, these methods measure PTT using ECG, PPG and ICG, which require the attachment of various electrodes to the body surface, and can only be performed in a clinic environment, not in everyday life. In recent years, researches are being actively conducted to eliminate the inconvenience of contact manner methods for measuring vital signs, including radar technologies to acquire physiological features of the human body [9, 10, 11]. Radar technology can be classified into continuous wave radar, which continuously emits waves with constant or modulated frequency, and pulse radar, which emits pulses of finite duration. In comparable studies [10, 11], continuous wave radar was used to detect the frequency of heartbeat, but continuous wave radar has a limitation of outputting only the difference between the frequency of the emitted wave and that of the reflected wave. In order to obtain the Doppler shift frequency expressed by the frequency difference, the radar signal was transferred to the frequency domain. Through this process, although the frequency of the heartbeat could be detected, information about the time at which the heartbeat occurred could not be obtained because time information disappeared. On the other hand, the pulse radar provides information on the distance to the target, which is indicated by the change in the position of the peak of the radar pulse reflected from the target. The position of the peak changes due to the Doppler effect as the target moves. Therefore, by observing the change in the shape of the pulses over time, it is possible to detect the points at which the heartbeats occur. From the viewpoint of whether the time when the heartbeat occurs could be found or not, it can be seen that the method used in comparative studies could not be used to measure the PTT, and the use of pulse radar should be considered. In our previous works, we showed that instantaneous changes in heartbeats could be detected by the ultra-wideband (UWB) impulse radar, a kind of pulse radar [12]. UWB impulse radar is robust against electromagnetic interference and provides high spatial resolution. Further, heartbeats can be measured simultaneously at the proximal and distal points using the UWB impulse radar, and the PTT can be estimated from the time interval between two heartbeats. In this study, we report the results of the PTT measurement using radar technology.
In order to extract heartbeats, radar pulses are emitted onto the body, and reflected pulses are collected at a specific time interval and then accumulated on a time axis. The pattern of heartbeats is extracted by conducting the principal component analysis [13] of time-series data containing the movement of the body surface due to the heartbeat. The PTT was obtained from the time interval between two heartbeats which are extracted from the chest and wrist, respectively and was in good agreement with the PTT obtained from the ECG and PPG. This result means that UWB radar technology can be an accurate method to estimate PTT in a non-contact manner.
2.Methodology
2.1Experimental setup for the study
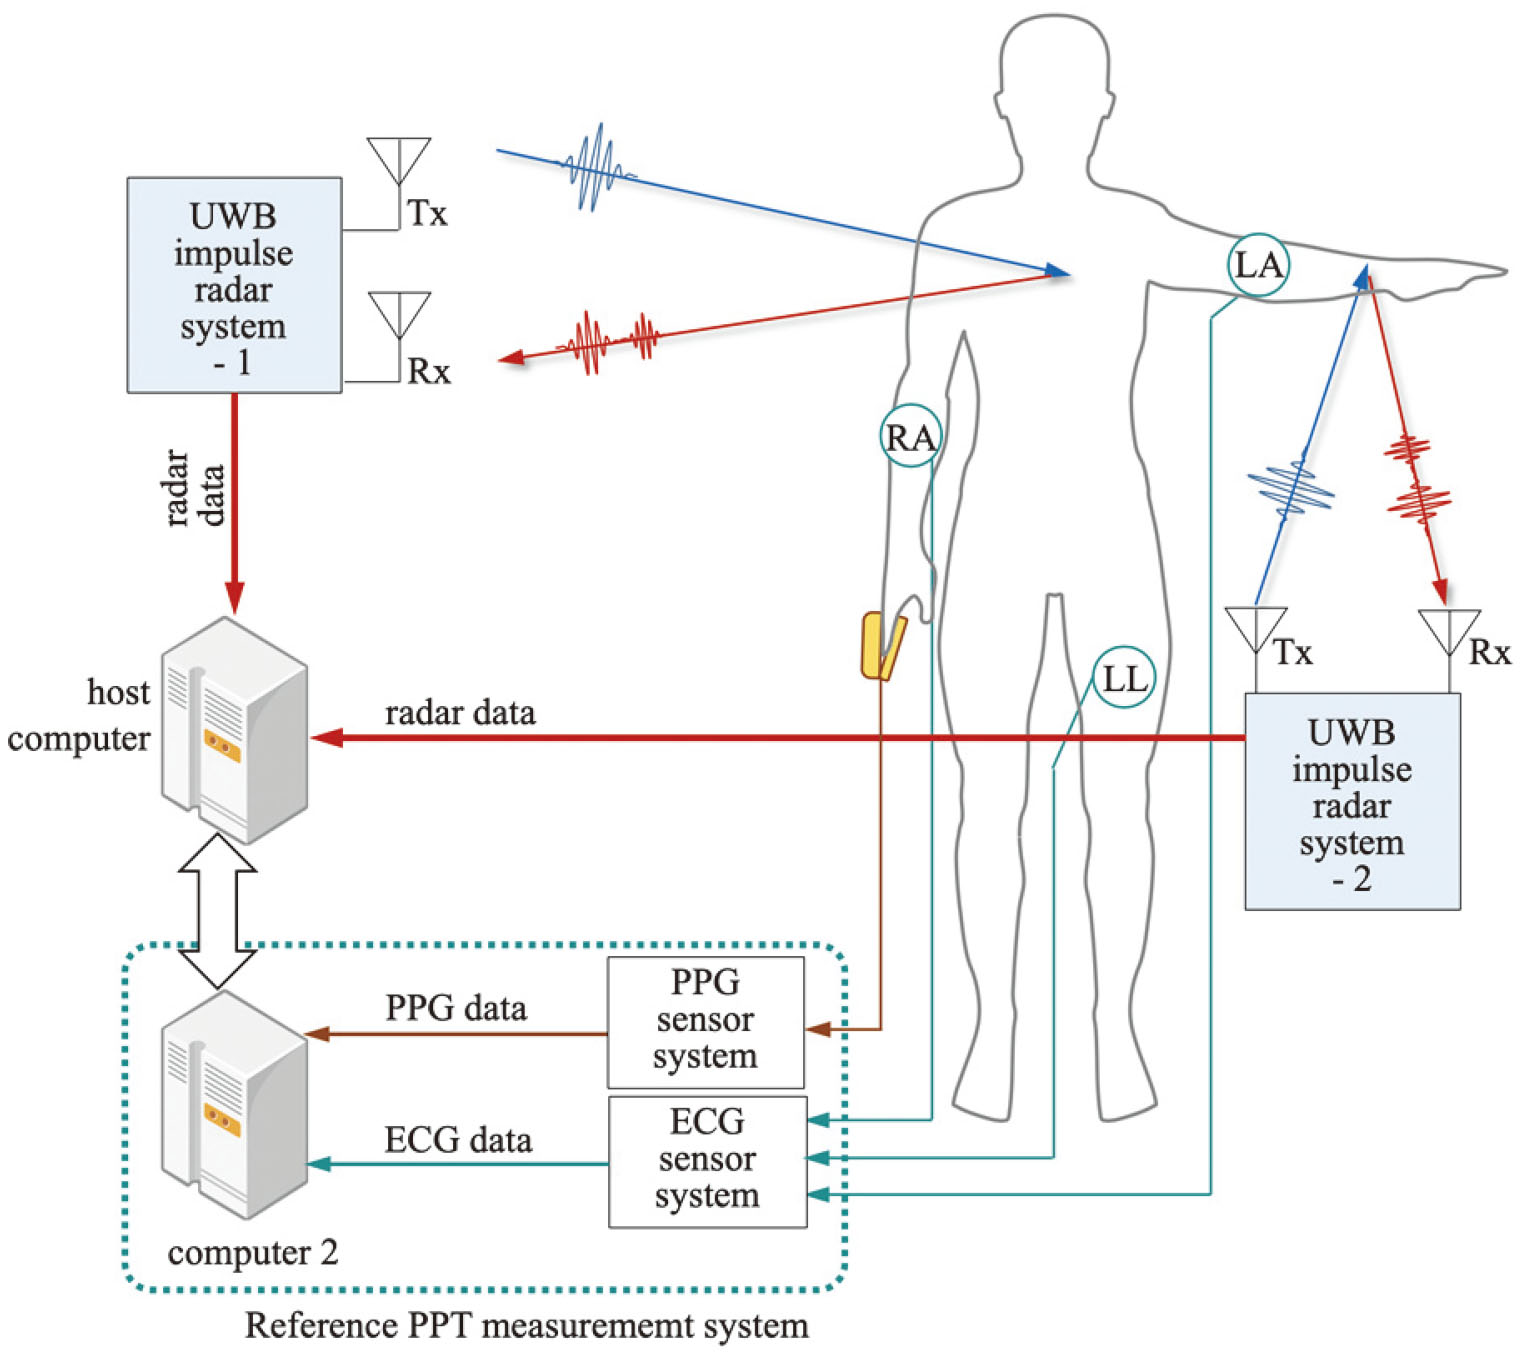
The setup for measuring the heartbeat on the chest and wrist using the UWB impulse radar is shown in Fig. 1. It consisted of two UWB impulse radar systems and a host computer for data processing. The two radar systems were connected to the host computer by serial communication and simultaneously emitted radar pulses to the target under the control of the host computer and also collected reflected pulses from the human body. The RF transceiver used in the configuration of the radar system was NVA6201 [14], which had built-in 256 samplers to convert the signals collected from the receiving antenna into 256 samples. The host computer controlled the radar system, collected data from them and executed the algorithm proposed in this study. An ECG sensor system and a PPG sensor system were used to output the PTT in real time while the radar signal was being collected, and these are referred to as “The reference PTT measurement system” for convenience. Electrodes were attached to the subject as shown in figure to obtain a LEAD I ECG, and a finger clip was placed on the subject’s finger to measure the PPG. Subjects were sitting in chairs with normal breathing without any sudden movements during the signal measurement. The antenna of the radar system emitting the pulse to the chest was kept at a distance of 40–70 cm from the surface of the body, and the other antenna emitting the pulse to the wrist was kept at a distance of 10–20 cm. In the case of the chest, the area where the radar pulse is reflected is wide, that is, the radar cross section (RCS) [15] is large and the power of the reflected pulse is high. Therefore, signals with a high SNR could be obtained even at a distance of 70 cm or more. However, in the case of the wrist, because the reflection area of the wrist is narrow, to obtain a signal with a high SNR, the antenna was placed closer to the body surface and at the same time the antenna was adjusted to have a narrow opening angle. Global synchronization was achieved by matching the time base of the two radar systems with that of the reference PTT measurement system. The radar wave used in the experiment is a sinusoidal wave with an envelope of the Gaussian function with a duration of less than 0.5 ns and occupies a bandwidth of 2.3 GHz in the frequency domain. To achieve the purpose of the study, the radar pulses are emitted to the human body at a frequency of 100 MHz, and the receiver collects the pulses at a frequency of 50 Hz. As a result, a number of pulses reflected from the human body are superimposed on the signal collected on the antenna at a specific time.
Figure 1.
Experimental setup for measuring heartbeats from the chest and the wrist.
2.2Accumulation of radar pulses for time series data acquisition
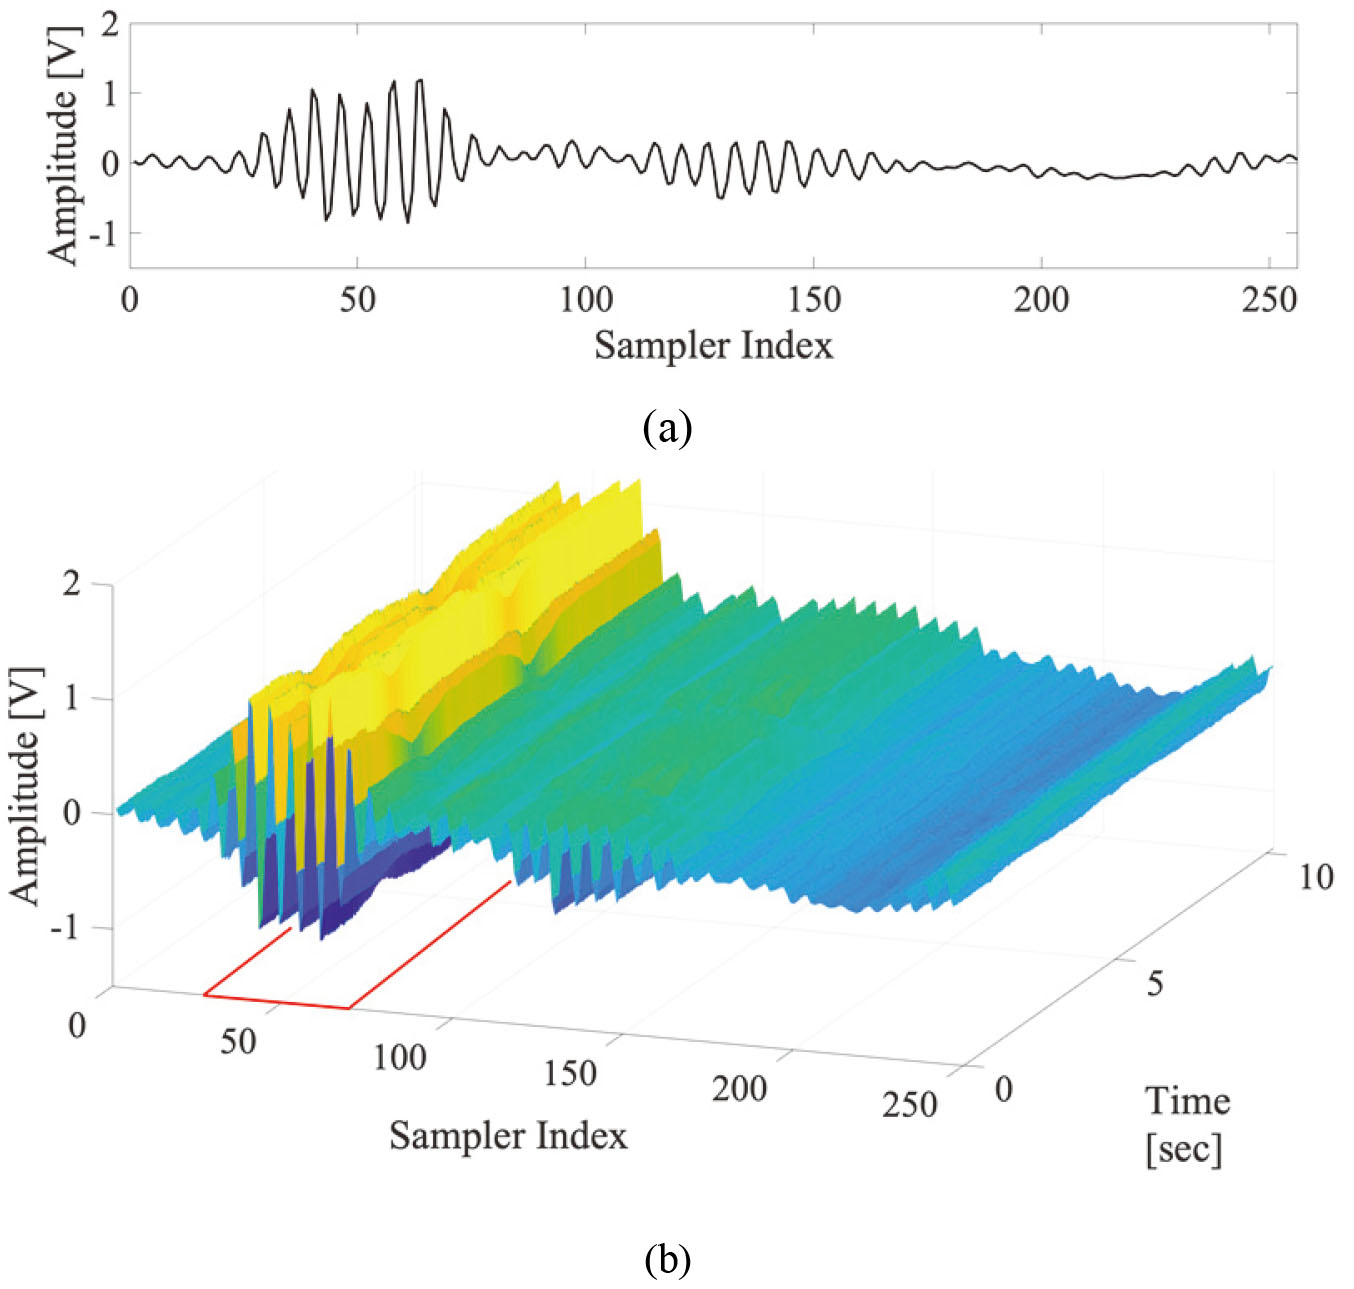
The waves collected through the receiver antenna contain traces of the minute movement of the body surface and even contain information about heartbeats. In particular, accumulating these signals at specific intervals reveals the phase change in the time axis direction. The set of data in the time axis direction that shows the change in the phase and amplitude with time in the accumulated radar pulses is called time series data. The radar signal collected from the receiving antenna is digitized by an RF transceiver, and 256 sample data generated at one time is referred to as a frame in this study. A total of 512 frames are accumulated at intervals of 20 ms to form one frame set, and this is the basic unit of data processing. As a result, one frame set is a matrix of 256
Figure 2.
Shapes of (a) frame and (b) frame set (area marked in red indicates IOI).
2.3Separation of heartbeat component from the time series data
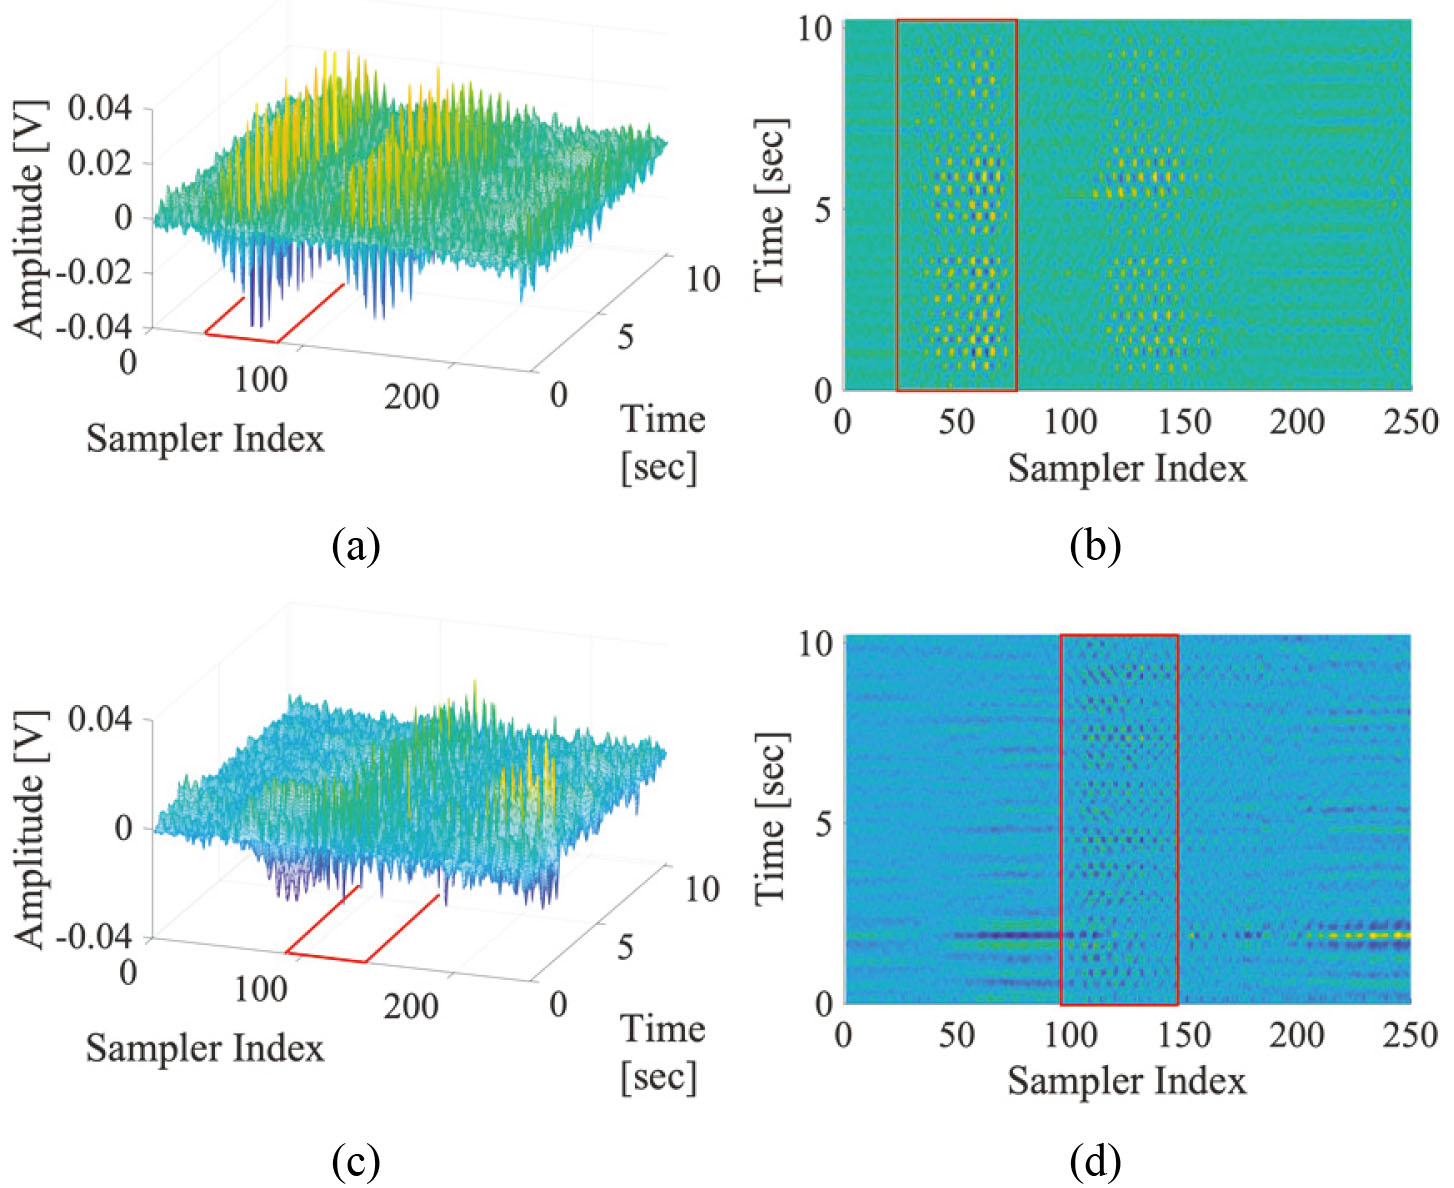
The time series of the sampler in the IOI contains respiratory components with large amplitudes and DC components reflected from the background. Therefore, to extract heartbeat components with relatively small amplitudes, a filtering process is required to filter out respiration, high frequency noise, and DC components from the time series data. In this study, a band-pass filter (BPF) that selectively passes only frequency components in the 1–3 Hz frequency band is applied to all the time series data. The frame set obtained from the chest and passed through the BPF, is shown in Fig. 3a and b as its top view, and those obtained from the wrist are shown in Fig. 3c and d respectively. It can be seen that certain patterns appear in the IOI, and this is the result of changes in the amplitude and phase of the radar pulses as the body surface is moved by the heartbeat. In the subsequent process, the principal component, which is commonly represented by the time series data in the IOI, is extracted.
Figure 3.
(a) The frame set obtained from the chest, (b) the shape after it passes through band-pass filter – top view, (c) the frame set obtained from the wrist, and (d) the shape after it passes through band-pass filter – top view (the red squares represent the IOI).
2.4Extraction of heartbeat trains through the principal component analysis (PCA)
The signal representing all the time series data in the IOI is obtained through the PCA of the following procedure.
(a) When performing a PCA, the frames in the IOI are treated as “an observation of a particular event” and sampler as “a variable.”
(b) Built up a covariance matrix from the IOI matrix.
(c) Perform eigenvalue decomposition on the covariance matrix to get eigenvectors.
(d) Choose the eigenvector with the highest eigenvalue and regard it as the “principal component.”
(e) Restore the data by projecting the IOI matrix onto the principal component vector and acquire one-dimensional signal, which is regarded as a pattern of heartbeats.
The waveforms normalized to a magnitude of 1 and their heartbeats are shown in Fig. 4, wherein the positions of the heartbeats are marked with blue stems. A set of heartbeats, a heartbeat train, is obtained in one frame set, and each heartbeat train is derived from two IOIs acquired from the chest and wrist, which is used to find the PTT in the following process.
Figure 4.
Shapes of the restored signals from (a) the chest IOI and (b) the wrist IOI with black line and their heartbeat locations with blue stems.
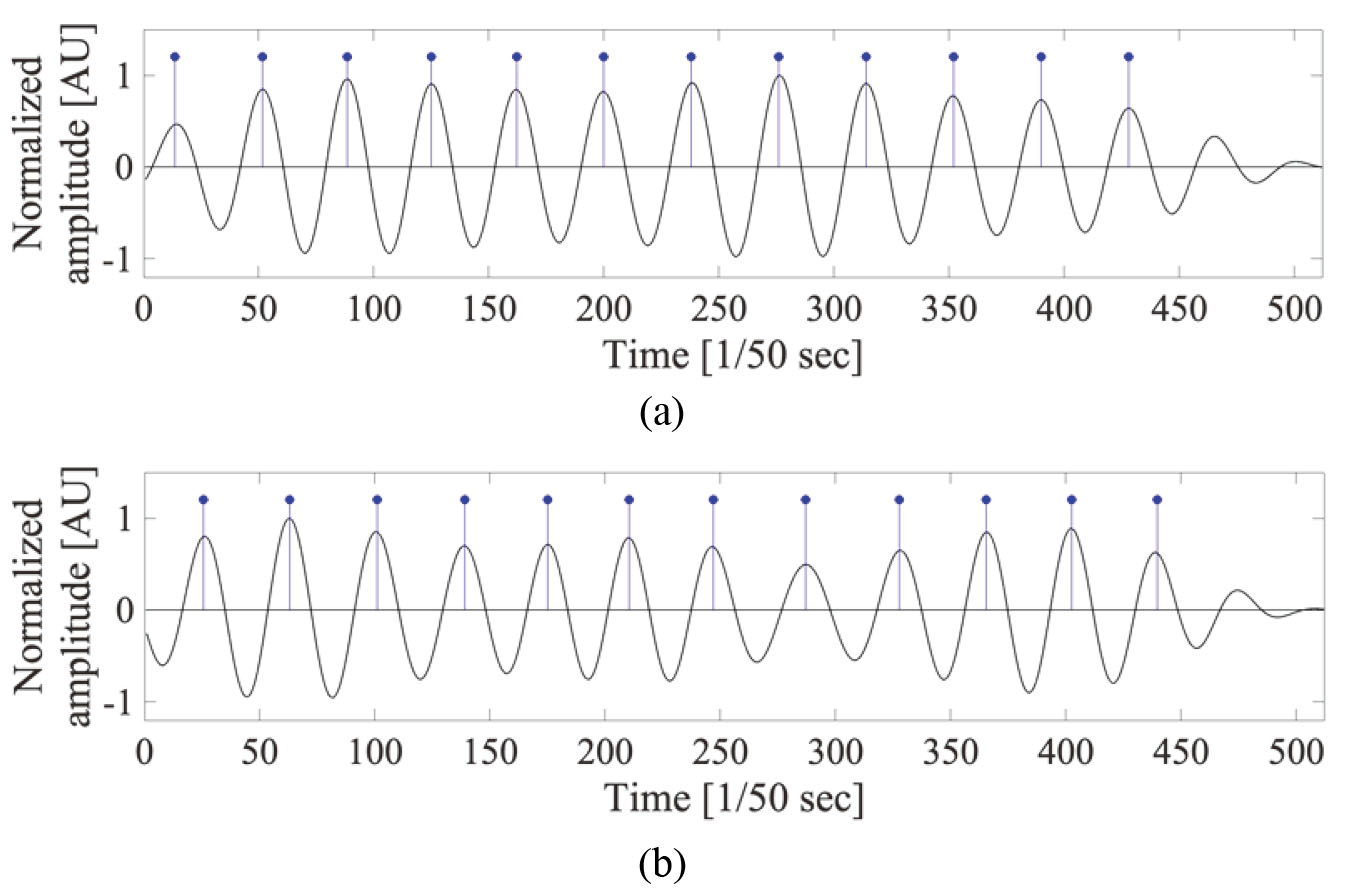
Figure 5.
Process of aligning the heartbeat train for PTT calculation.
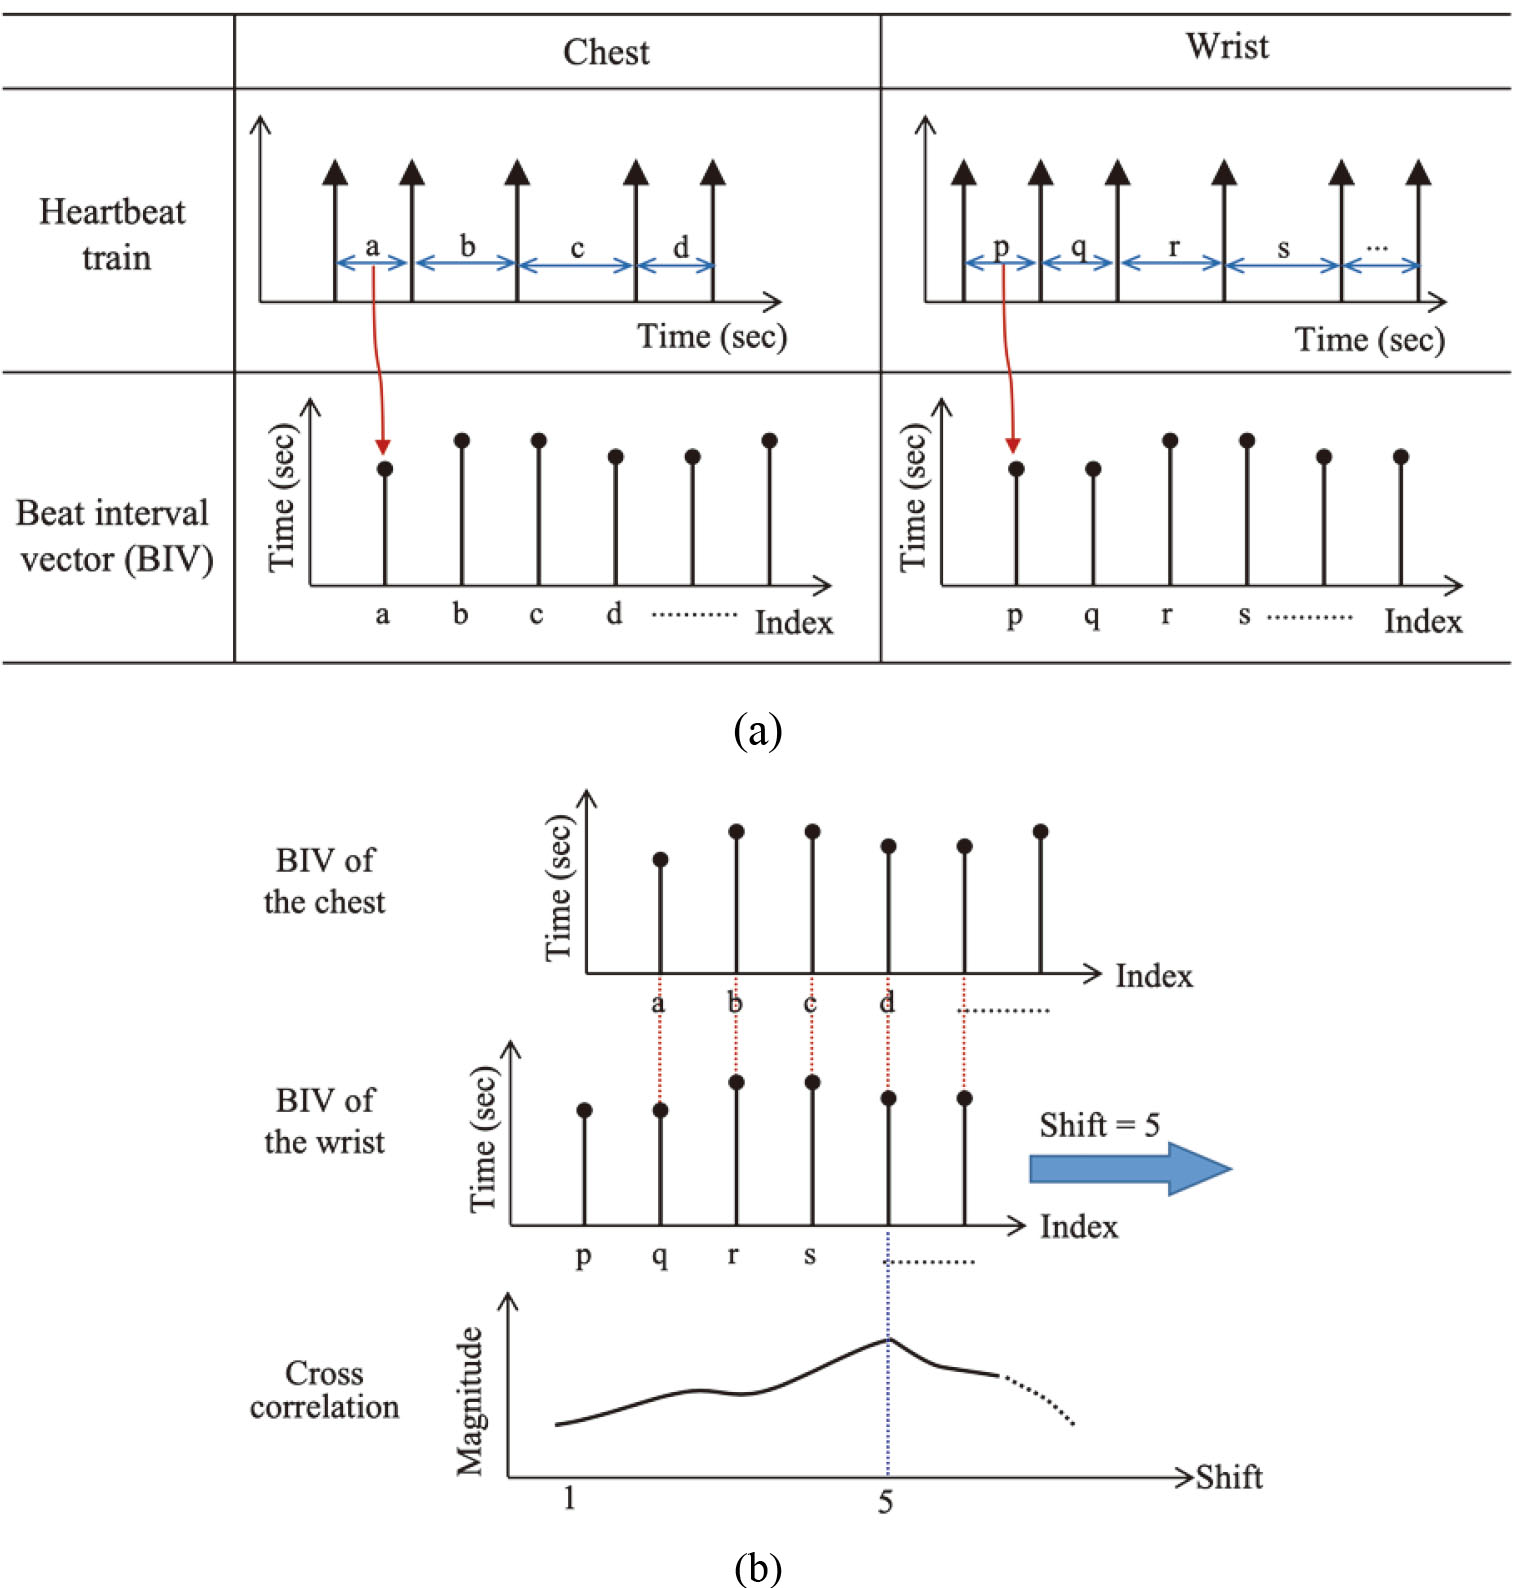
Figure 6.
Waveforms of ECG, PPG, and heartbeat waveform of the chest and the wrist that are obtained by the proposed method.
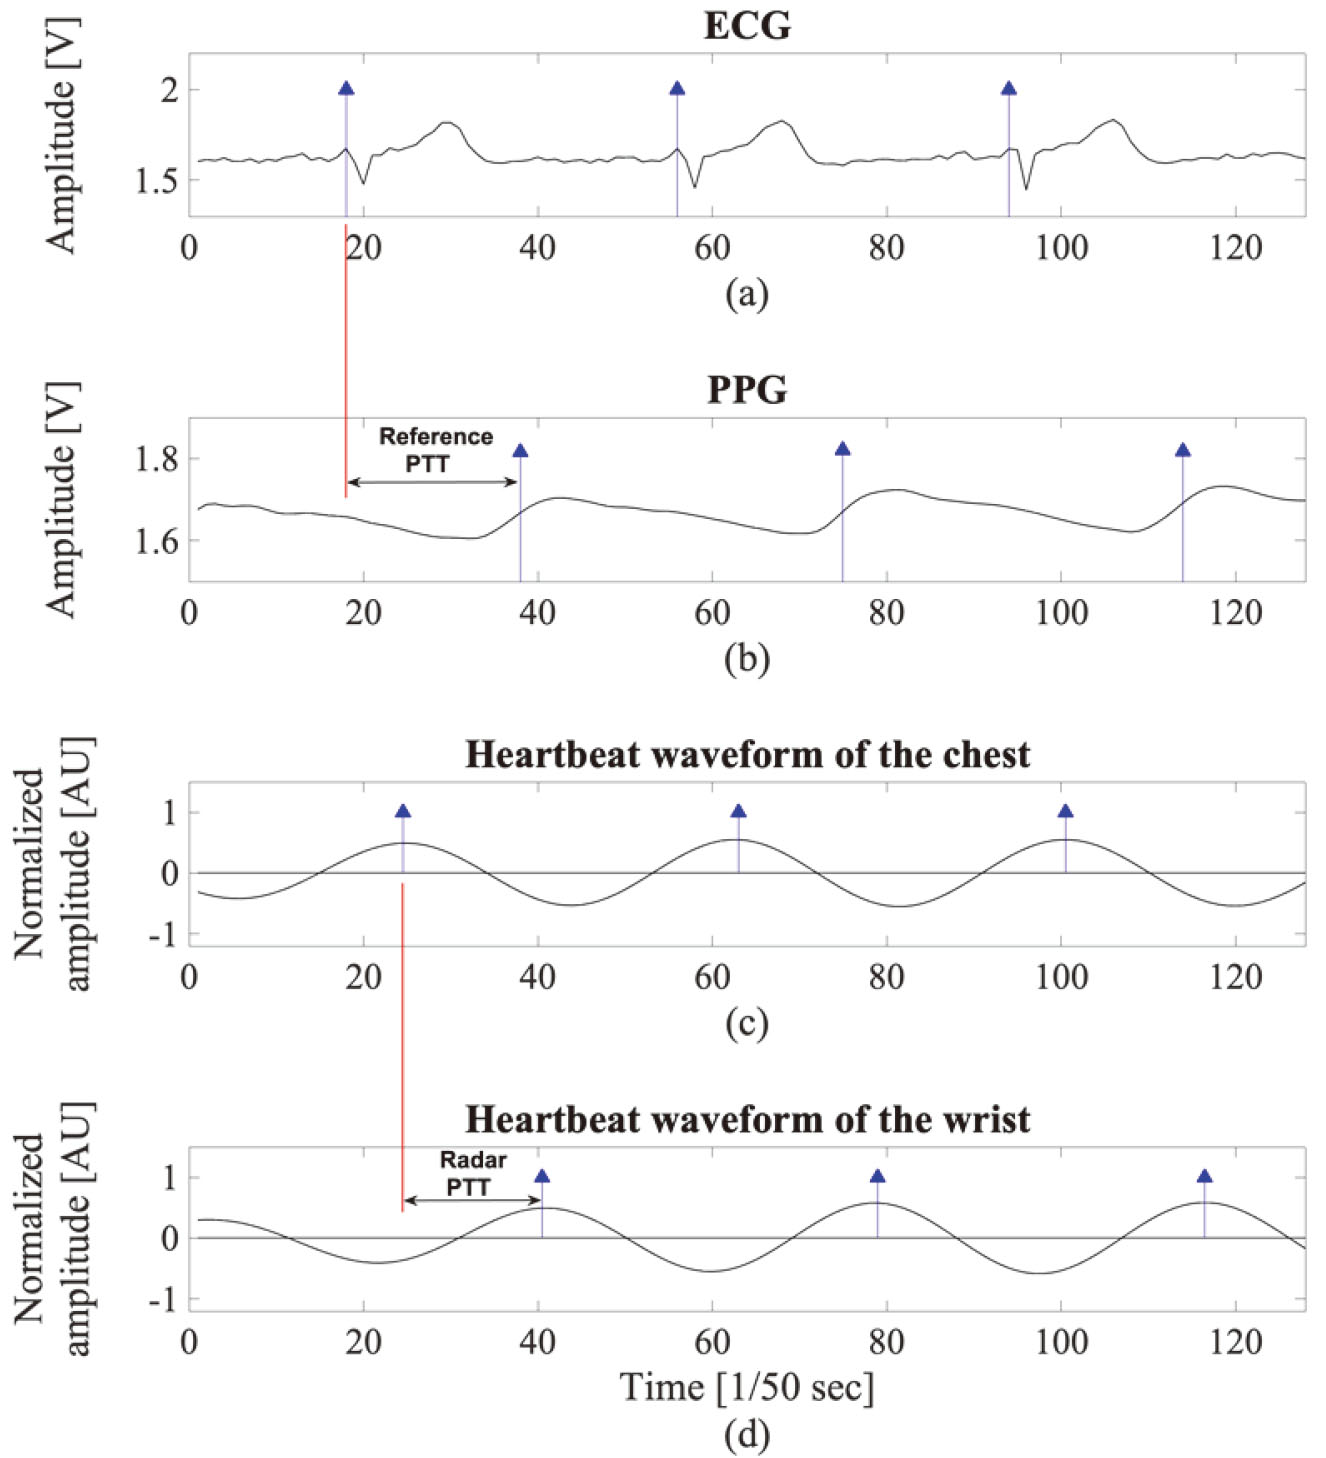
Figure 7.
Shapes of aligned heartbeat trains (upper plane indicates the R peaks and the characteristic points of the PPG, and lower plane indicates the heartbeat train pair obtained from the chest and wrist).
2.5Measuring the PTT
It is advantageous to utilize the heartbeat pattern itself, because there is only time delay between each heartbeat train obtained from the chest and periphery. Specifically, the beat interval vector (BIV) is created by deriving the interval between each heartbeat, i.e., beat-to-beat interval, in each heartbeat train. Then, the cross-correlation of the two vectors obtained from the chest and wrist is calculated, and the point having the highest value is found. Because each beat interval vector can be regarded as a discrete time signal, the beat interval vector obtained from the chest is denoted as
(1)
where
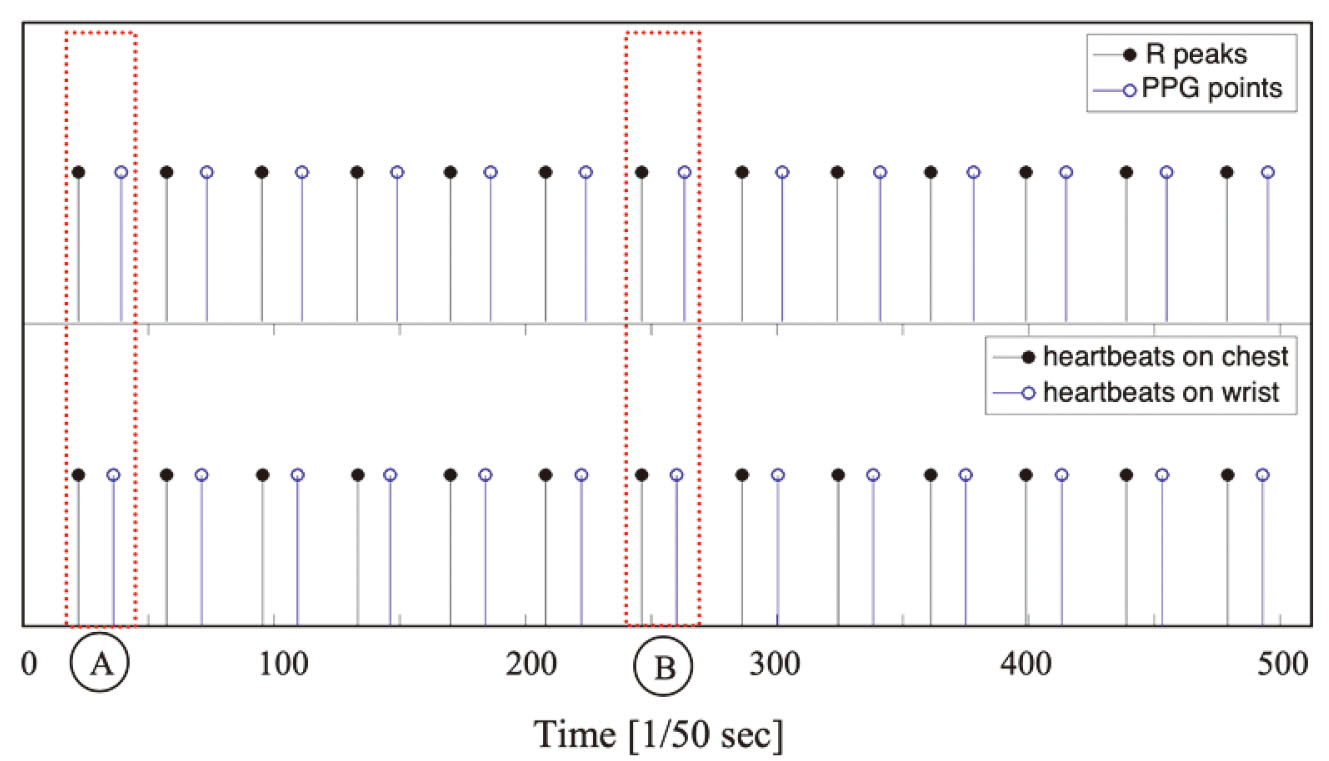
The process of extracting BIVs from heartbeat trains acquired from the chest and the wrist and the cross-correlation between BIVs are illustrated in Fig. 5a and b, respectively. As a result, two heartbeat trains can be aligned such that each pair of heartbeats generated by the same pulsation in the heart meet each other. In the figure, two heartbeat trains are aligned after 5 shifts as an example. Then, the differences in the time at which two heartbeats occurred in heartbeat pairs, for example the time difference between a and q in Fig. 5, are calculated. The mean time interval for all heartbeat pairs in the aligned heartbeat train can be defined as the PTT, and for convenience, it is referred to as “the radar PTT.”. In addition, the ECG and PPG are measured together while radar pulses are emitted to the human body, and the PTT measured by the ECG and PPG is called “the reference PTT.” ECG, PPG, the heartbeats extracted from the chest, and those from the wrist are presented on the same time axis in Fig. 6, and the heartbeat reference points are marked on each waveform as stems with a triangular head. The R peak is used as the reference point in ECG and the maximum inclination point of the wave is used as the reference point in PPG. The time interval between two reference points is indicated as the reference PTT. Figure 6c and d show the hypothetical heartbeat waveforms that are obtained from the chest and wrist, with each stem representing the reference point. The time interval between two reference points is indicated as the radar PTT. A pairs of the heartbeat trains are presented in the bottom plane of Fig. 7. In addition, the R peaks of the ECG and the characteristic points of the PPG are shown together in the upper plane of Fig. 7 for reference.
3.Results and discussion
An example of the reference PTT and the radar PTT measured from one subject is shown in Table 1. The values in Table 1 correspond to the radar PTTs and the reference PTTs taken from points A and B shown in Fig. 7. The difference between the reference and radar PTTs was 58.4 ms and 55.9 ms on average. This was mainly due to the difference in the paths of blood flows in the measurements. That is, the reference PTT considered the path from the heart to the fingertip, whereas the Radar PTT took into account the path from the heart to the wrist. In addition, the time interval between the R peak of the ECG and the heartbeat measured by the radar in the chest should be considered as an offset. A minute displacement of the chest surface occurs as the ventricular volume changes in the cardiac cycle. This causes a phase change in the radar pulse reflected from the body surface, and the heartbeat pattern is extracted from these pulses through the proposed method. Therefore, it is reasonable to assume that the position of the heartbeat extracted from the radar is synchronized with subtle differences rather than perfectly matching the R peak of the ECG as shown in Fig. 6.
Table 1
Comparison of the reference PTT and radar PTT
| Event | Radar PTT | Reference PTT | ||
|---|---|---|---|---|
| Heartbeat (BPM) | PTT (ms) | Heartbeat (BPM) | PTT (ms) | |
| A | 73.8 | 275.3 | 73.8 | 333.7 |
| B | 78.7 | 268.9 | 78.4 | 324.8 |
| Remark | 1. heart-to-wrist length: approximately 0.95 m. | |||
| 2. wrist-to-fingertip length: approximately 0.2 m. | ||||
Using the data set 1 from Table 1, the velocity of the blood flow calculated using the reference PTT is (1.15 m)/(333.66e-3 s)
4.Conclusion
Because PTT and BP are inversely correlated, PTT can be used to measure BP in a cuffless manner, which can contribute to eliminating the discomfort caused by the cuff in the subject. Widely used methods for obtaining the PTT include measuring the time delay between the R peak of the ECG and the feature points of the PPG and taking advantage of the time delay that the pressure pulse takes to travel from the proximal point to the distal point. However, the conventional methods measure the PTT in a contact manner because they utilize ECG, PPG, and ICG, which require various electrodes to be attached to the body surface. In this study, a new method based on the radar technology for full contactless PTT measurement was proposed. Radar pulses were simultaneously emitted to the chest and wrist to detect the heartbeat pattern at each position, and then the time delay between the two heartbeats was calculated to estimate the PTT indirectly. In order to find out the timing of the heartbeat, the received radar pulses were accumulated at predefined time intervals to construct a frame set and then passed through the digital filter to reveal the minute movement of the body surface caused by the heartbeats. The IOI was set as the region where the pattern of the heartbeat was most visible. The heartbeat train was extracted through the principal component of the time series belonging to the IOI region. After the heartbeat trains were obtained from the chest and wrist, the two heartbeat trains were aligned by cross-correlation and then the time difference, i.e., PTT, in the heartbeat pair was obtained. These were then compared with ECG and PPG based reference PTTs for verification. As a result, the radar PTT had an error of less than 2.29% with the modified reference PTT considering the path from the heart to the wrist. In conclusion, it was confirmed that the proposed method can be used to measure the PTT with good accuracy in a fully non-contact manner.
Acknowledgments
This work was supported by the DGIST R&D Program of the Ministry of Science and ICT of Korea (20-IT-09).
Conflict of interest
The authors declare no conflict of interests.
References
[1] | Mukkamala R, Hahn JO, Inan OT, Mestha LK, Kim CS, Töreyin H, Kyal S. Toward ubiquitous blood pressure monitoring via pulse transit time: predictions on maximum calibration period and acceptable error limits. IEEE Trans Biomed Eng. (2015) ; 62: (8): 1879–901. |
[2] | Zhang Q, Shi Y, Teng D, Dinh A, Ko SB, Chen L, Basran J, Bello-Haas VD, Choi Y. Pulse transit time-based blood pressure estimation using hilbert-huang transform. Conf Proc IEEE Eng Med Biol Soc. (2009) ; 2009: : 1785–1788. |
[3] | Wang R, Jia W, Mao ZH, Sclabassi RJ, Sun M. Cuff-free blood pressure estimation using pulse transit time and heart rate. Int Conf Signal Process Proc. (2014) . doi: 10.1109/ICOSP.2014.7014980. |
[4] | Ding XR, Zhao N, Yang GZ, Pettigrew RI, Lo B, Miao F, et al. Continuous blood pressure measurement from invasive to unobtrusive: celebration of 200th birth anniversary of Carl Ludwig. IEEE J Biomed Health Inform. (2016) ; 20: (6): 1455–1465. |
[5] | Lin H, Xu W, Guan N, Ji D, Wei Y, Yi W. Noninvasive and continuous blood pressure monitoring using wearable body sensor networks. IIEEE Intell Syst. (2015) ; 30: (6): 38–48. |
[6] | Volynsky MA, Mamontov OV, Sidorov IS, Kamshilin A. Pulse wave transit time measured by imaging photoplethysmography in upper extremities. J Phys Conf Ser. (2016) ; 737: : 1–5. |
[7] | Kachuee M, Kiani MM, Mohammadzade H, Shabany M. Cuffless blood pressure estimation algorithms for continuous health-care monitoring. IEEE Trans Biomed Eng. (2017) ; 64: : 859–69. |
[8] | Gao M, Cheng HM, Sung SH, Chen CH, Olivier NB, Mukkamala R. Estimation of pulse transit time as a function of blood pressure using a nonlinear arterial tube-load model. IEEE Trans Biomed Eng. (2017) ; 64: (7): 1524–34. |
[9] | Buxi D, Redout JM, Yuce MR. Blood pressure estimation using pulse transit time from bioimpedance and continuous wave radar. IEEE Trans Biomed Eng. (2017) ; 64: : 917–927. |
[10] | Ren L, Wang H, Naishadham K, Liu Q, Fathy AE. Non-invasive detection of cardiac and respiratory rates from stepped frequency continuous wave radar measurements using the state space method. Conf Proc IEEE MTTS Int Microw Symp. (2015) . doi: 10.1109/MWSYM.2015.7166886. |
[11] | Sakamoto T, Imasaka R, Taki H, Sato T, Yoshioka M, Inoue K, Fukuda T, Sakai H. Accurate heartbeat monitoring using ultra-wideband radar. Journal of IEICE Electronics Express. (2015) ; 12: : 1–7. |
[12] | Cho HS, Park YJ. Detection of heart rate through a wall using UWB impulse radar. J Healthc Eng. (2018) . doi: 10.1155/2018/4832605. |
[13] | Jolliffe IT. Principal component analysis. 2nd ed. Springer; (2002) . |
[14] | Novelda. NVA620x preliminary data sheet. http://www.novelda.no. Accessed Oct 30, (2013) . |
[15] | Skolnik MI. Radar handbook. 3rd ed. McGraw-Hill; (2008) ; 14.1. |
[16] | Proakis JG, Manolakis DK. Digital signal processing. 3rd ed. Pearson; (1995) ; 120. |


