
Assessment of the risk factors in the daily life of stroke patients based on an optimized decision tree
Abstract
BACKGROUND:
Stroke is a leading cause of mortality and disability, which can be affected by people’s daily living habits.
OBJECTIVE:
To investigate the effects of main daily living habits (smoking, drinking, diet, vegetable and fruits consumption, and exercise) on stroke risk in patients and provide the scientific basis for the assessment of the risk factors, a novel risk analysis model of the stroke is proposed.
METHODS:
A data mining method using decision trees which adopted the optimized C4.5 algorithm is presented. It is able to deal with the unbalanced data problem of the classification. Meanwhile, the proposed method has been verified on a clinical dataset of 23,682 patients with 21 risk factors.
RESULTS:
The overall accuracy and kappa coefficient for stroke risk classification has reached 84.88% and 0.7763, respectively. Through the generated knowledge rules, it demonstrates that the behavioral habits in daily life have an indirect effect on the risk of stroke. While, it has an obvious effect on stroke when hypertension, diabetes mellitus, hypercholesterolemia, and BMI risk factors exist. In addition, it was observed that the aforementioned five daily living habits have a decreased impact on the stroke.
CONCLUSIONS:
It is anticipated that the proposed system could help in reducing the risk, mortality, and disability of stroke, and provide clinical decision support for the treatment of stroke.
1.Introduction
Stroke is a leading cause of death and disability in the world. Prevention remains the most viable avenue for lessening the burden of stroke on society, particularly given the high incidence of stroke worldwide, insidious contribution of stroke risk factors [1]. Longitudinal studies have identified several characteristics/conditions (risk factors) that can boost a person’s risk for primary or recurrent stroke [2, 3]. These risk factors can be classified into two categories: nonmodifiable and modifiable. Nonmodifiable risk factors include factors that cannot be altered by intervention like, age, gender, race and genetic attributes, which may serve as markers for high stroke risk [1]. Whereas, modifiable risk factors are those can in principle be prevented, changed, or controlled to lower stroke risk like smoking, hypertension, diabetes etc. Systems with predictive outcome are valuable for the early prevention, treatment, and rehabilitation of stroke, which may have great potentialities in reducing the risk of stroke, stroke mortality, and disability.
The aim of the paper is to develop a novel model for assessing the risk factors of stroke in a quantitative way to provide a multivariate assessment. It is targeted to reduce the risk, mortality, and disability of stroke and to help in the treatment. The risk factor modeling was firstly developed in Framingham and the Framingham Stroke Risk Profile (FSRP) has been established [1]. The FSRP consists of significant risk factors including age, systolic blood pressure, diabetes; cigarette smoking, the presence of CVD (coronary heart disease, peripheral vascular disease, congestive heart failure), atrial fibrillation and so on. The FSRP was considered as an individual-based high-risk approach which aims to identify individuals at risk of stroke. It has been widely used in the world including the United States, Europe, and Israel. In addition, another risk assessment app called the Stroke Riskometer (TM) [4] was recently developed by AUT University, the app provides estimates of the absolute risk of stroke within the next 5 and 10 years for individuals aged
In this paper, a novel risk factor assessment model of the stroke based on decision trees is introduced. Decision trees, as an efficient and powerful method of data mining, has been widely used in the medical domain. It can give reliable and effective results that provide high-classification accuracy with a simple representation of gathered knowledge and is especially appropriate to support decision-making processes in the medical domain [7]. Several studies have already investigated the usefulness of decision trees in prediction problems. In 2010, decision trees and association rules to predict the risk factors of coronary heart disease have been explored in [8]. In 2016, a decision tree-based classifier for predicting risk factors during pregnancy has been investigated in [9]. However, as far as we know, decision trees for predicting risk factors of stroke remains to be investigated. In addition, in order to solve the unbalanced data problem of the dataset, an optimized C4.5 algorithm is explored.
The rest of this paper is organized as follows: Section 2 describes materials and methods. Section 3 provides the evaluations and results of the proposed system. Followed by a brief discussion in Section 4. At last, a conclusion is presented in Section 5.
2.Materials and methods
2.1Data collection, cleaning and coding
The data of this study consists of two parts. Firstly, the clinical data from Hospital Information System (HIS) including the medical history information of Hypertension, Diabetes, Hypercholesterolemia, Ischemic Optic Neuropathy (ION), Mild Stroke (MS), Family History of Stroke (FH-S), clinical manifestation information of Sleep Apnea (SA), Gingival disease, Sudden Sensorineural Hearing Loss (SSHL), etc. Based on the combination of the ischemic stroke screening and prevention guidelines and clinical experience, the cases with risk factors are screened and the risk was classified as “high”, “middle” and “low”.
After data screening, 23,682 effective cases were obtained. The second part of data is tracked by APP. Of these 23,682 cases the information of smoking, drinking alcohol (DA), diet (carnivorous habit, drinking milk, taking vegetable and fruit), playing sports (PS), psychological and emotional (PE), memory etc. was included. Among the data, there are 12,605 males and 11,077 females.
Apart from the advanced age (70 years), the proportion of male and female in other age groups is also very close as given in Fig. 1. The age is mainly over 50 years old.
The ratios of the number of people at different risk levels to the total number of people, and the ratio of male and female at each level are shown in Table 1.
Table 1
Proportion of risk level and proportion of men and women within each level
| Risk levels | Proportions | Male to female ratios |
|---|---|---|
| High | 20.3% | 1.55 |
| Medium | 17.1% | 1.49 |
| Low | 14.8% | 1.53 |
| None | 47.8% | 0.83 |
Figure 1.
Age-sex distribution.
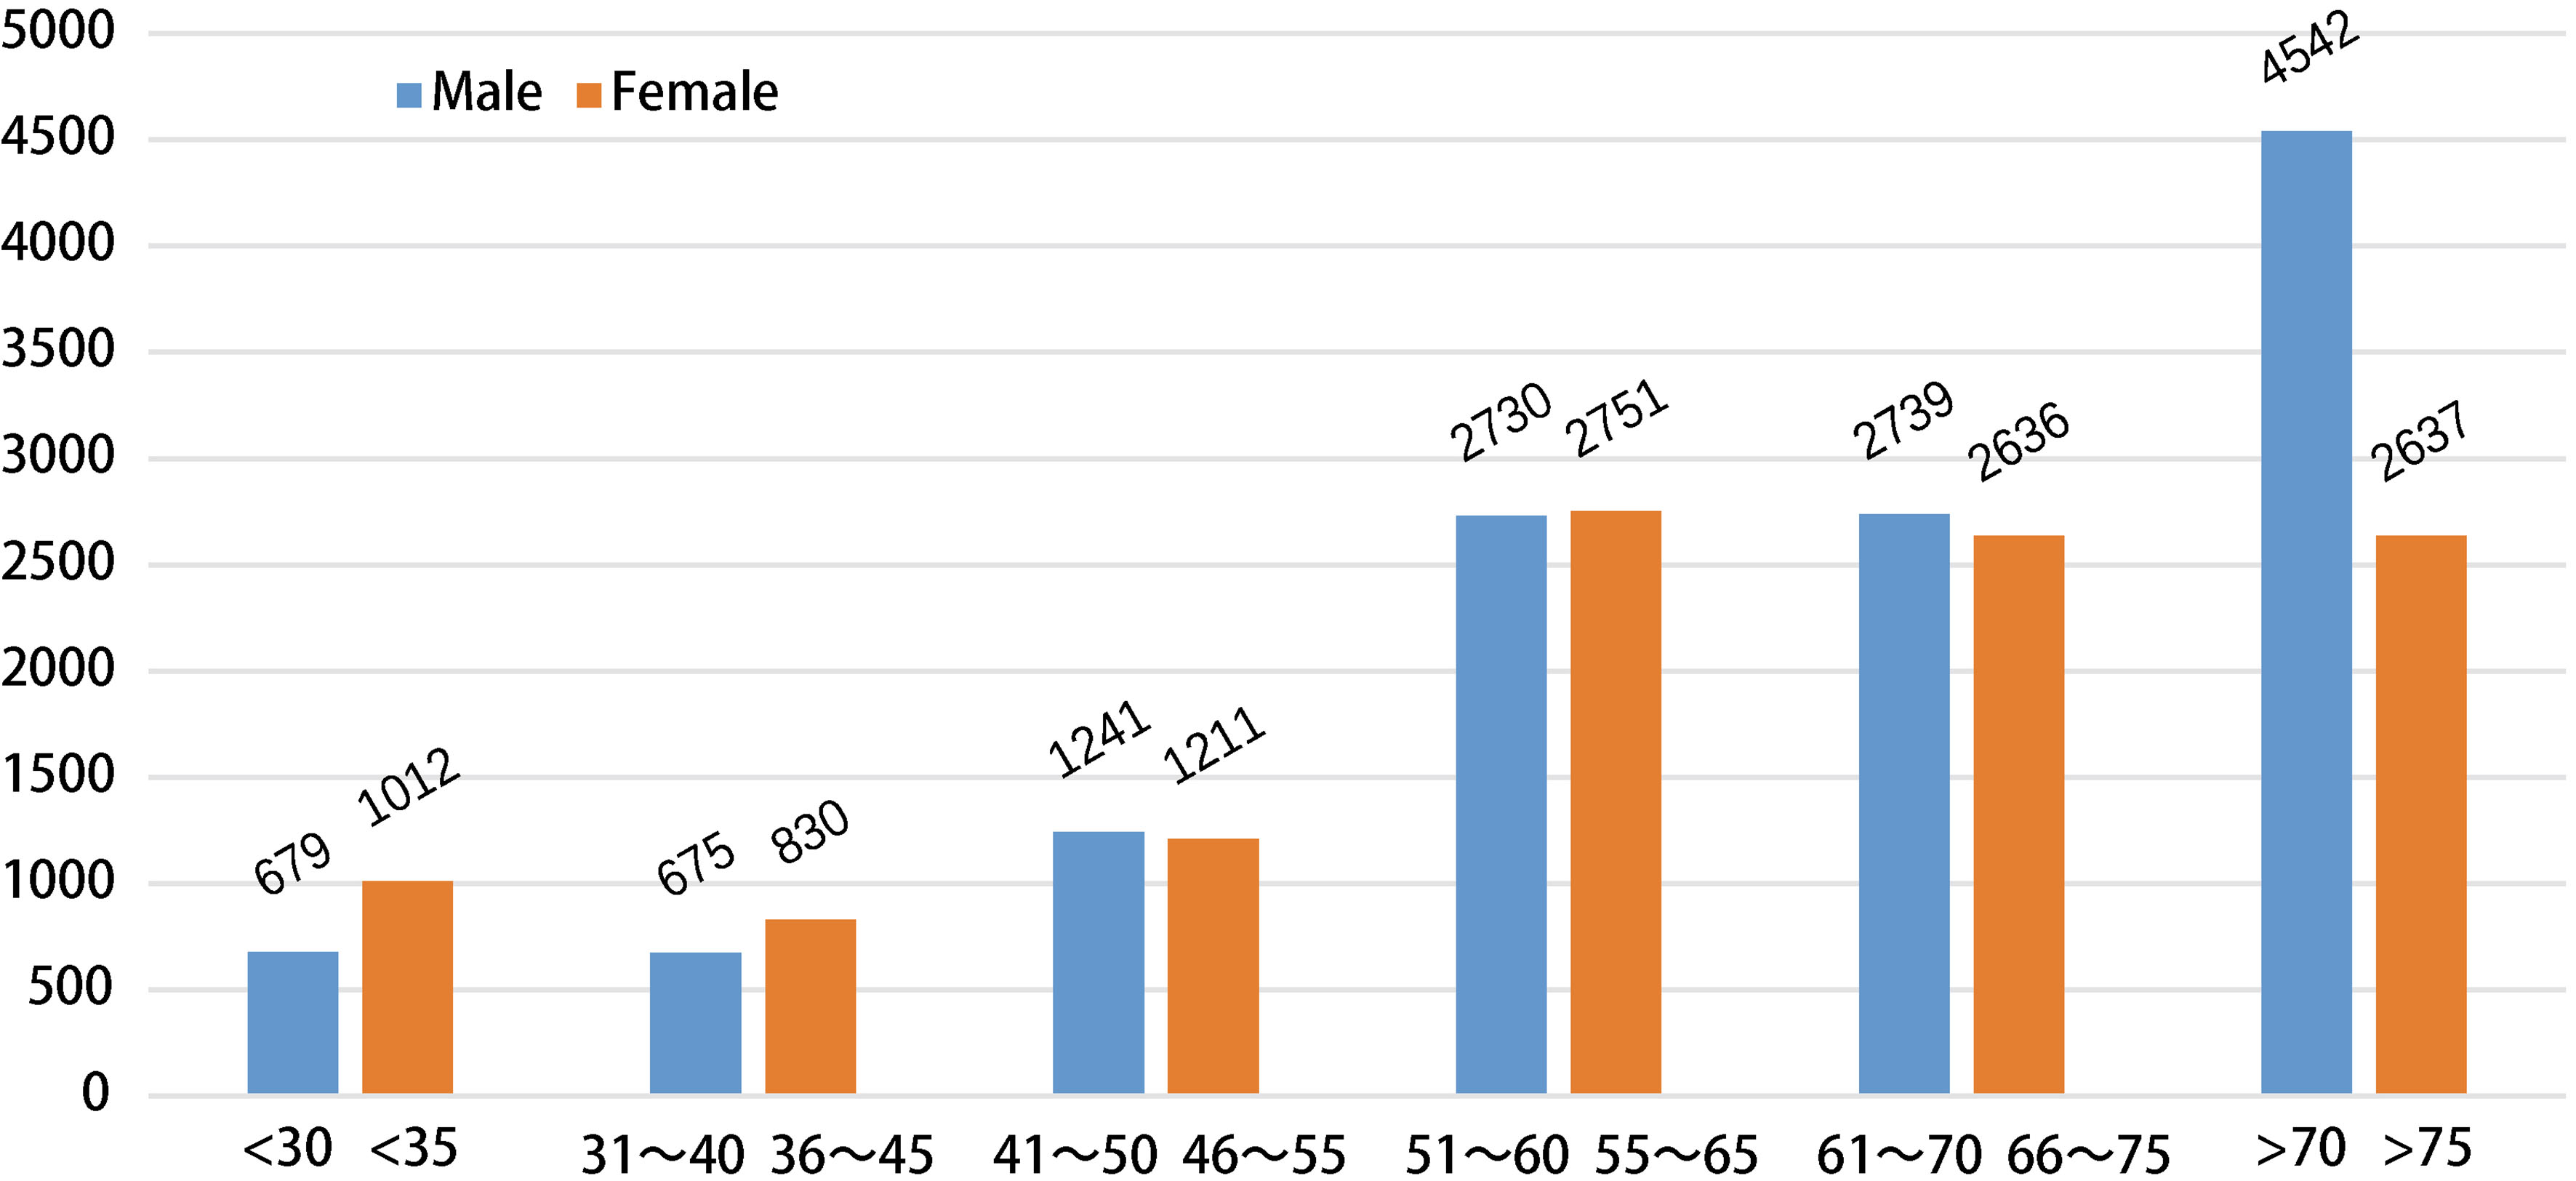
The ratio of the “having risk” (the risk level is high, medium and low) and risk-free is 52.2%, 47.8% respectively, and the two are close. The number of males at risk is about 1.5 times the number of females.
Total 21 risk factors have been evaluated in this paper and the meaning of each factor and its value is listed as below:
1) Age: Stroke incidence is associated with age, which increases rapidly with age. “L” represents that men are less than 45 years old and women are less than 55 years old. “H” represents that the male is greater than or equal to 45 and the female is greater than or equal to 55.
2) Body Mass Index (BMI): The average value calculated of the height and weight data selected by APP within 6 months. “L” represents that the value is less than 24 and “H” represents that the value is greater than or equal to 24.
3) Hyte: Hypertension is the most prominent modifiable risk factor for ischemic stroke, high blood pressure can cause damage to blood vessel walls, which may eventually lead to a stroke. Hyte versus non-Hyte. Subjects having a history of hypertension were marked as “T” and the rest as “F”.
4) Diab: Diab versus non-Diab. Boolean. Subjects having a history of Diabetes were marked as “T” and the rest as “F”.
5) CVD: CVD versus non-CVD. Subjects having a history of Cardiovascular Disease were marked as “T” and the rest as “F”.
6) Hypercholesterolemia (Hcho): contributes to blood vessel disease, which often leads to stroke. Hcho versus non-Hcho. Subjects having a history of Hypercholesterolemia were marked as “T” and the rest as “F”.
7) ION: ION versus non-ION. Subjects having a history of Ischemic Optic Neuropathy were marked as “T” and the rest as “F”.
8) MS: MS versus non-MS. Subjects having a history of Mild Stroke were marked as “T” and the rest as “F”.
9) FH-S: FH-S versus non-FH-S. Subjects having a family history of Stroke were marked as “T” and the rest as “F”.
10) FH-CVD: FH-CVD versus non-FH-CVD. Subjects having a family history of cardiovascular disease were marked as “T” and the rest as “F”.
11) SA: SA versus non-SA. Subjects having a history of sleep apnea were marked as “T” and the rest as “F”.
12) SSHL: SSHL versus non-SSHL. Subjects having a history of Sudden Sensorineural Hearing Loss were marked as “T” and the rest as “F”.
13) TAD: TAD versus non-TAD. Subjects having taken antihypertensive drugs were marked as “T” and the rest as “F”.
14) THD: THD versus non-THD. Subjects having taken Hypolipidemic drugs were marked as “T” and the rest as “F”.
15) Smoking: Smoking is associated with reduced blood vessel distensibility/compliance, elevated fibrinogen levels, increased platelet aggregation, decreased high density lipoprotein cholesterol levels, and higher hematocrit [3]. In this paper, cigarette smoking is also considered as a risk factor of stroke. Make statistics monthly and take the average of 6 months. “L” represents the light quantity which is less than 3 packages/month. “H” represents high volume which is greater than or equal to 3 packages/month.
16) Alcohol Consumption: Heavy alcohol consumption is associated with elevated blood pressure, enhanced coagulability, cardiac arrhythmias, and decrease in cerebral blood flow. Make statistics monthly and take the average of 6 months. “L” represents the light quantity that Males drink less than 0.6 kg/month (females halve). “H” represents high volume that Males drink greater than or equal to 0.6 kg/month.
17) CHoDM: Carnivorous habit or Drinking milk. “1” represents that eating 140–160 grams of meat or 180–220 grams of milk per day averagely. “0” represents less and “2” represents “excess”.
18) TVF: Taking vegetable and fruits. “H” represents that taking 200–350 grams of fruits or 200–400 grams of vegetables per day averagely and “L” represents less.
19) Physical Activity (PS): Increased physical activity is associated with reductions in fibrinogen, homocysteine, and platelet activity, as well as elevations in high-density lipoprotein cholesterol and plasma tissue plasminogen activator activity. Playing sports. “L” represents that the daily exercise time averagely is less than half an hour. “H” represents excess.
20) PE: PE versus non-PE. Subjects having a phenomenon of psychological stress or emotional instability monthly were marked as “T” and the rest as “F”.
21) Memo: Memo versus non-Memo. Subjects having awareness of the loss of memory by oneself or others were marked as “T” and the rest as “F”.
22) Risk Type (RT): It is divided into four types of high, medium, low and none which is represented by “H”, “M”, “L”, and “N”.
2.2Decision trees
The decision tree is a popular, logic based, easily interpretable, straightforward and widely applicable method [10]. The classic decision tree algorithms include ID3, C4.5, and CART. Unlike ID3, which can only handle discrete variables, C4.5 and CART can also handle continuous variables, and they are not sensitive to incomplete data. In addition, the CART generates binary trees and C4.5 generates multiple branches. Therefore, the C4.5 algorithm is selected in this paper. Details of the C4.5 algorithm are described as below.
2.2.1C4.5 algorithm
C4.5 decision tree algorithm was developed by Quinlan in [11]. It constructs a decision tree as a learning model from the data samples. The divide and conquer approach is adopted for construction of decision tree models using a measure called information gain to select the attribute from the dataset for the tree.
Information gain
Suppose that there are
(1)
where
(2)
Where
Gain ratio
The information gain represents the value of the information entropy that the data set
(3)
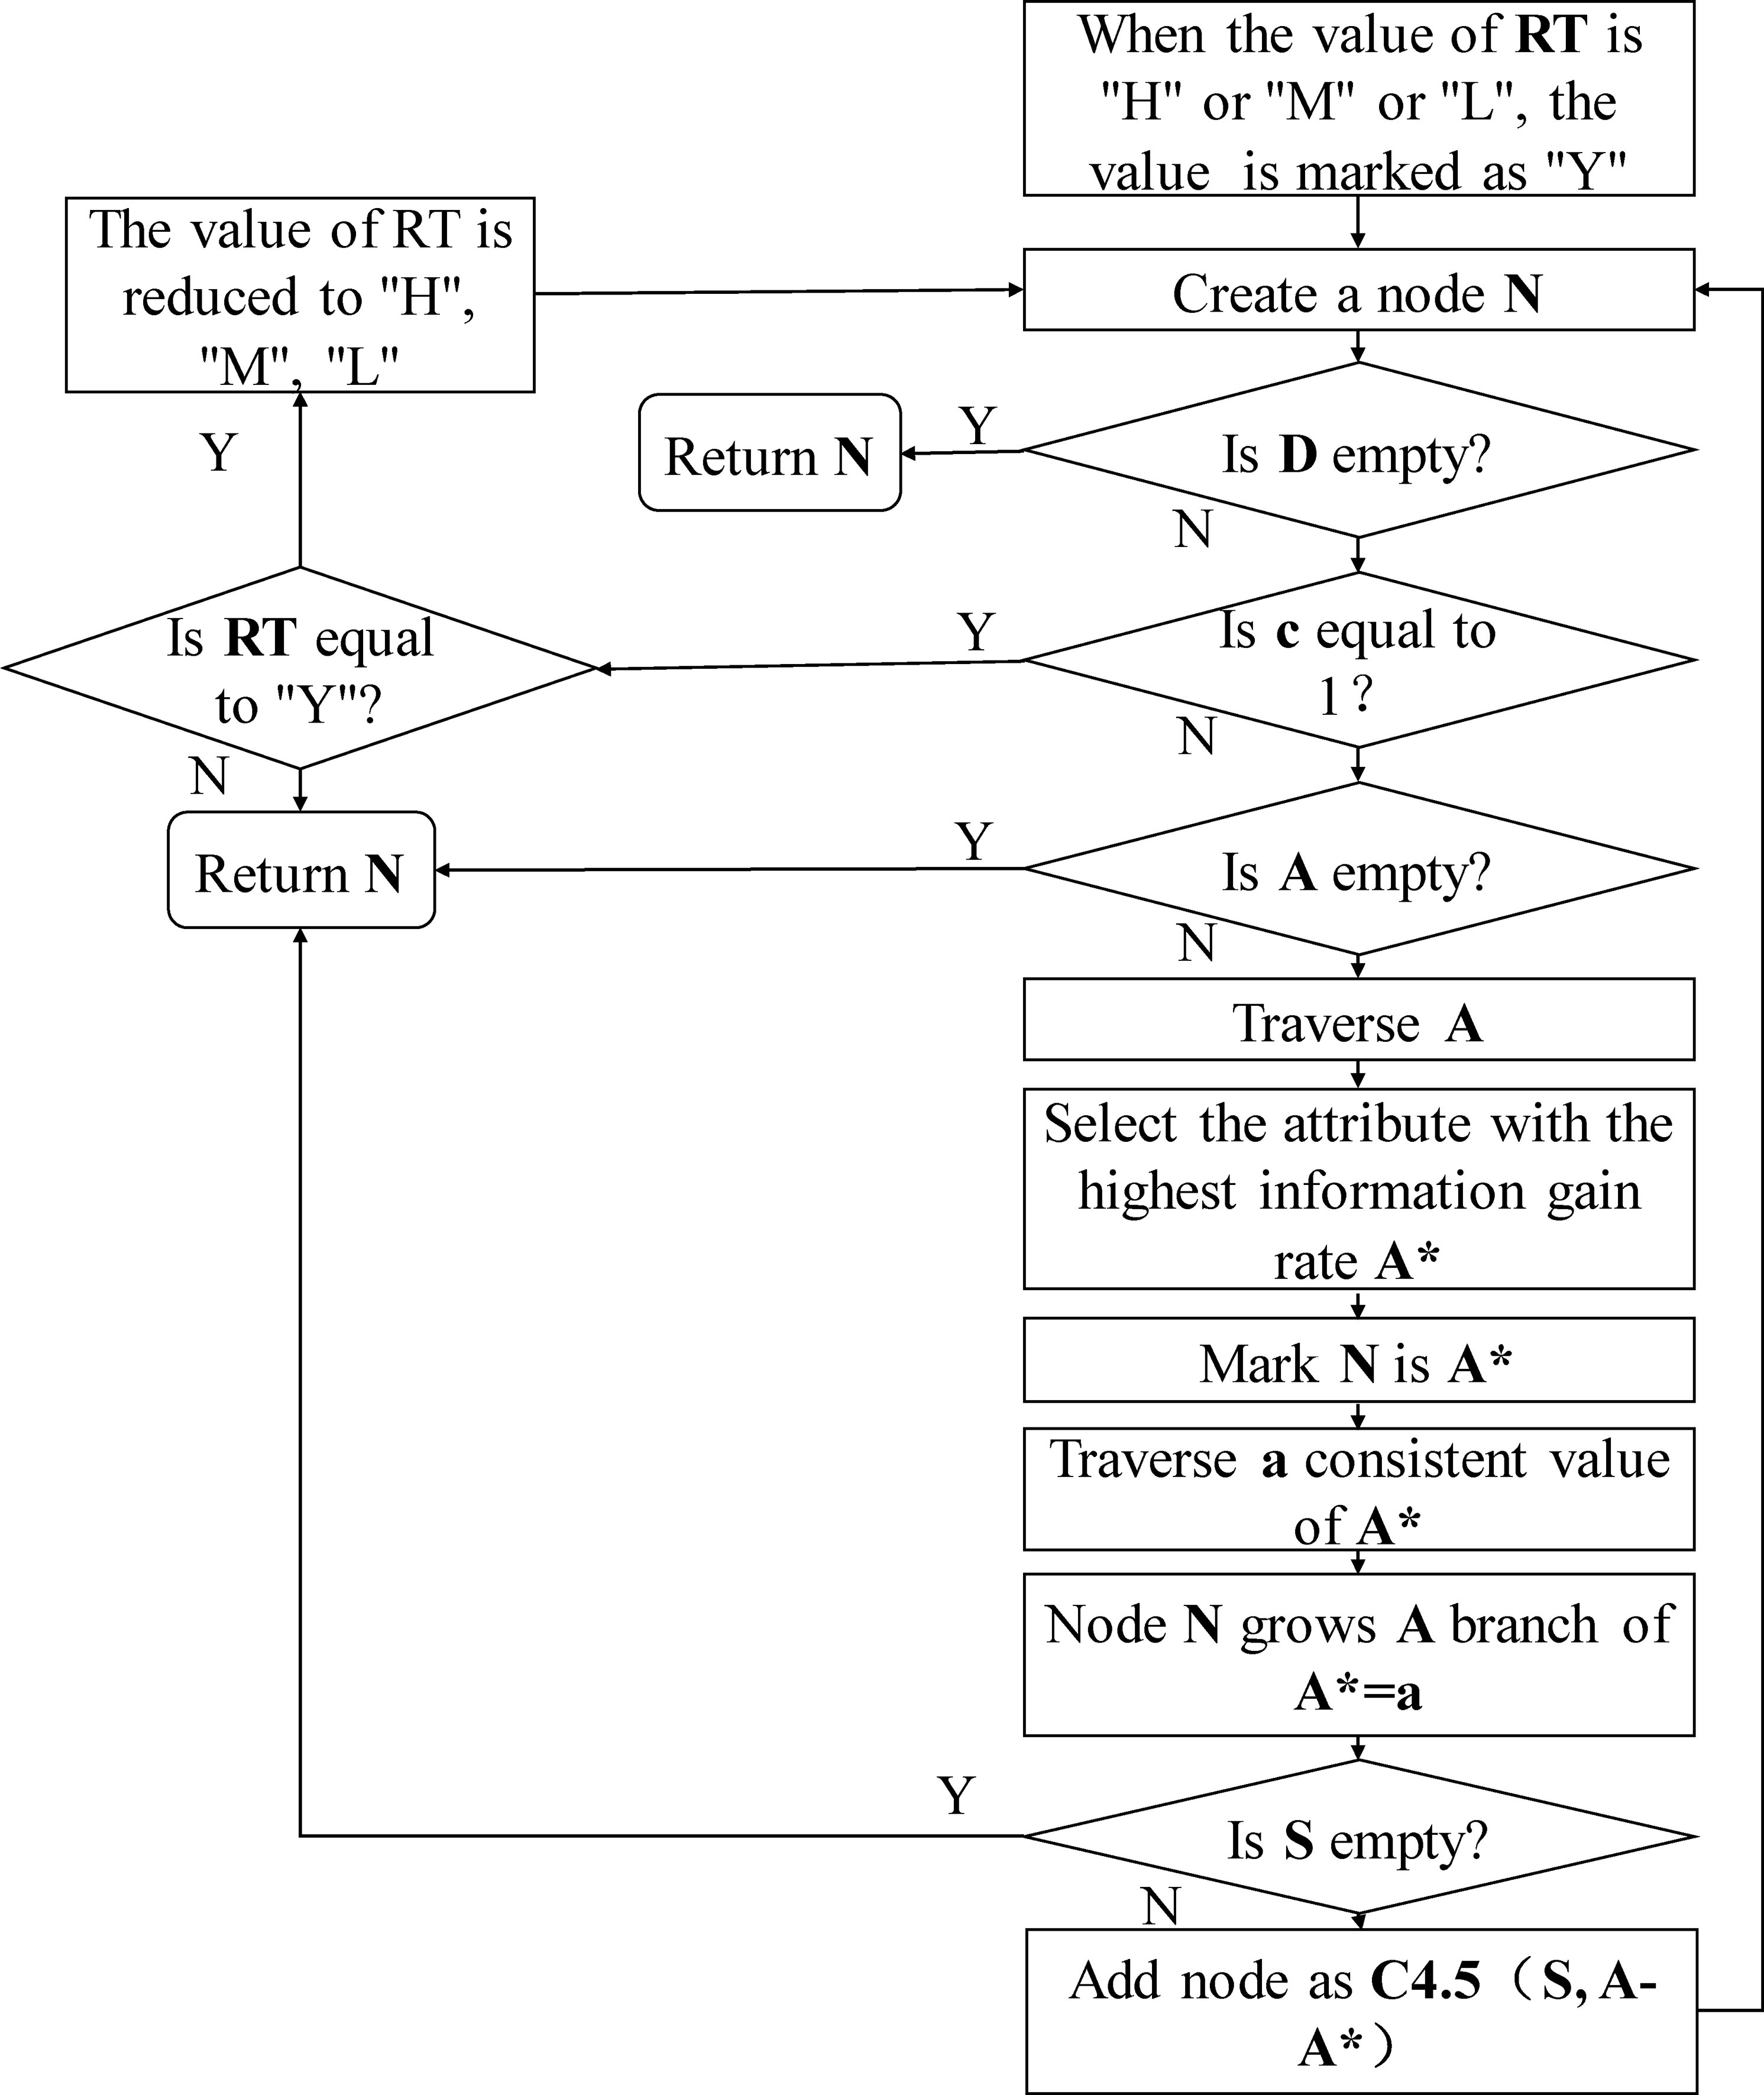
Figure 2.
The optimized C4.5 algorithm flow.
The information gain rate is:
(4)
2.2.2Implementation of C4.5 algorithm
The decision tree is generated using the J48 (C4.5 algorithm implementation) in the Weka classifier algorithm. The confidence factor for the pruning is set to 0.25 and the minimum number of instances per leaf minNumObj is set to 10. The 10-fold cross-validation is used to select and evaluate the model. The number of leaves of the final tree is 61 while the size of the tree is 121. Among them, the maximum misclassification accounted for as high as 24%. The reason is that the classification data is imbalanced, which causes the problem of classification bias. Regarding this problem, an optimized C4.5 algorithm is presented.
2.2.3Optimized C4.5 algorithm
For the data in this study, the outstanding imbalance appeared in the data of “no” risk and “low” risk, with the proportion exceeding 3 (47.8%: 14.8%
The algorithm flow is shown in Fig. 2. Where D denotes the training dataset for classification, c denotes the class number, A denotes the candidate contribute, A* denotes the contribute with the highest information gain rate in A and S denotes the sample dataset D which matches A*
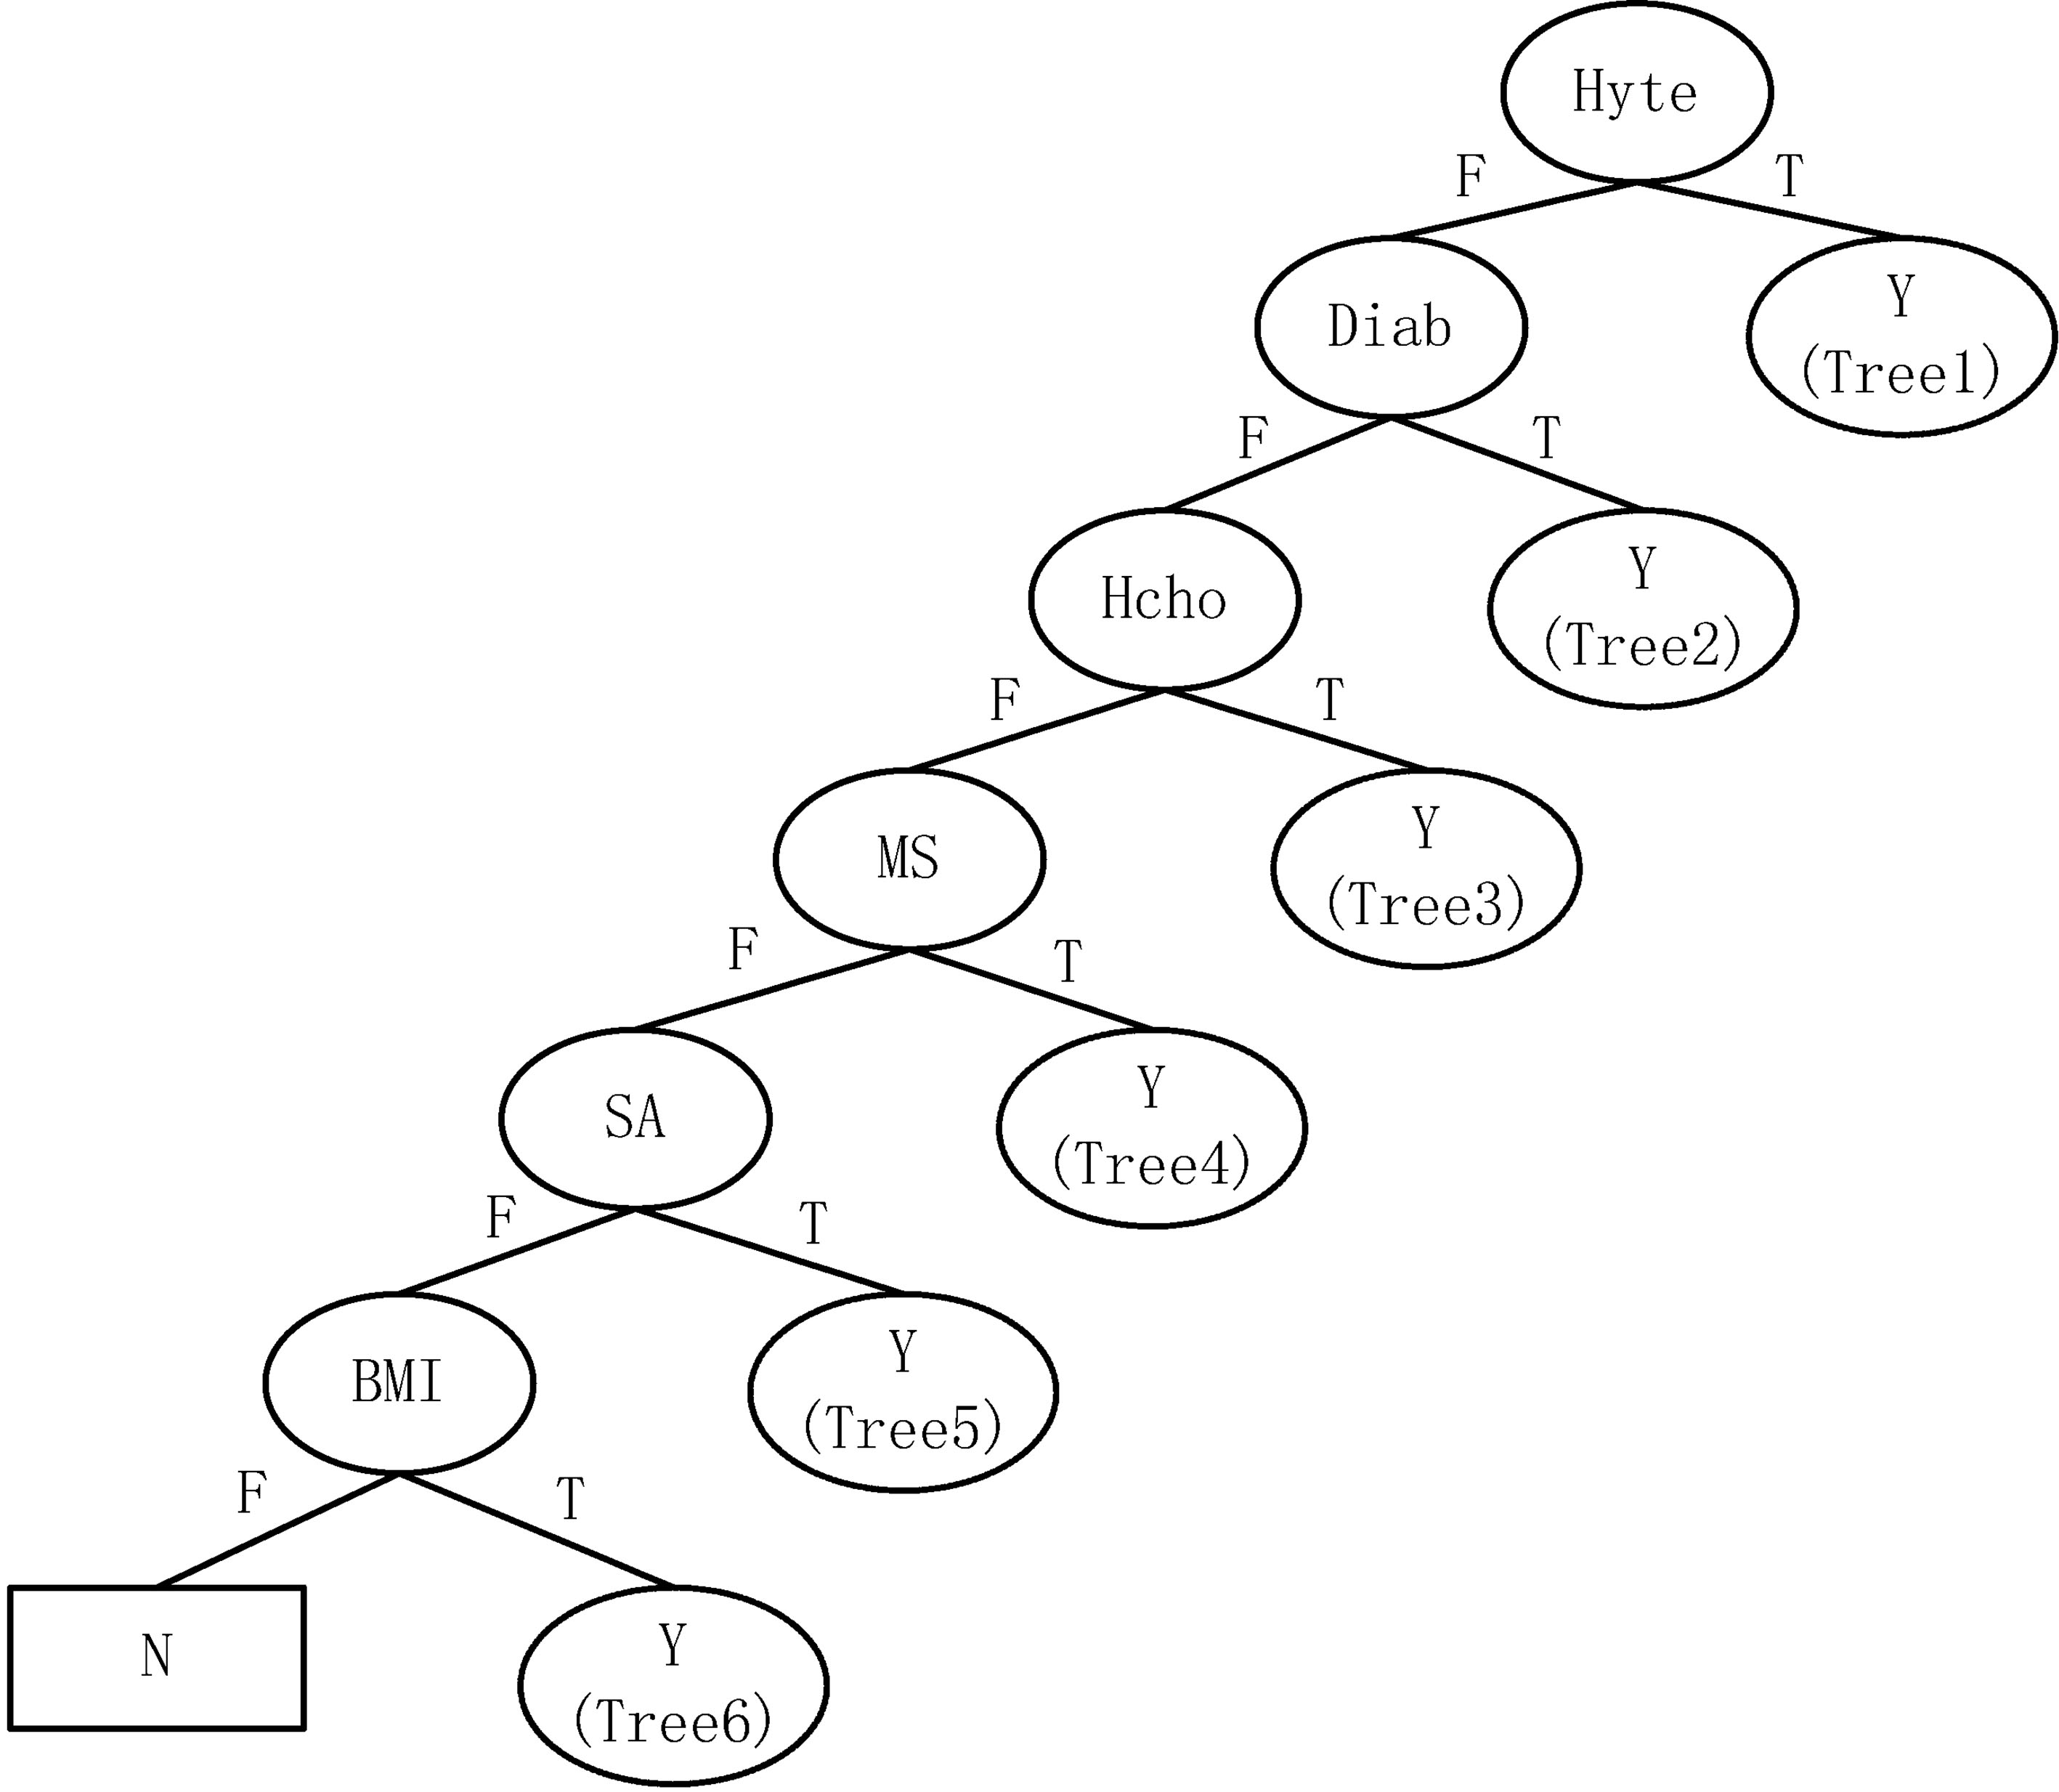
Figure 3.
The first-level decision tree.
3.Results
3.1Decision tree generation
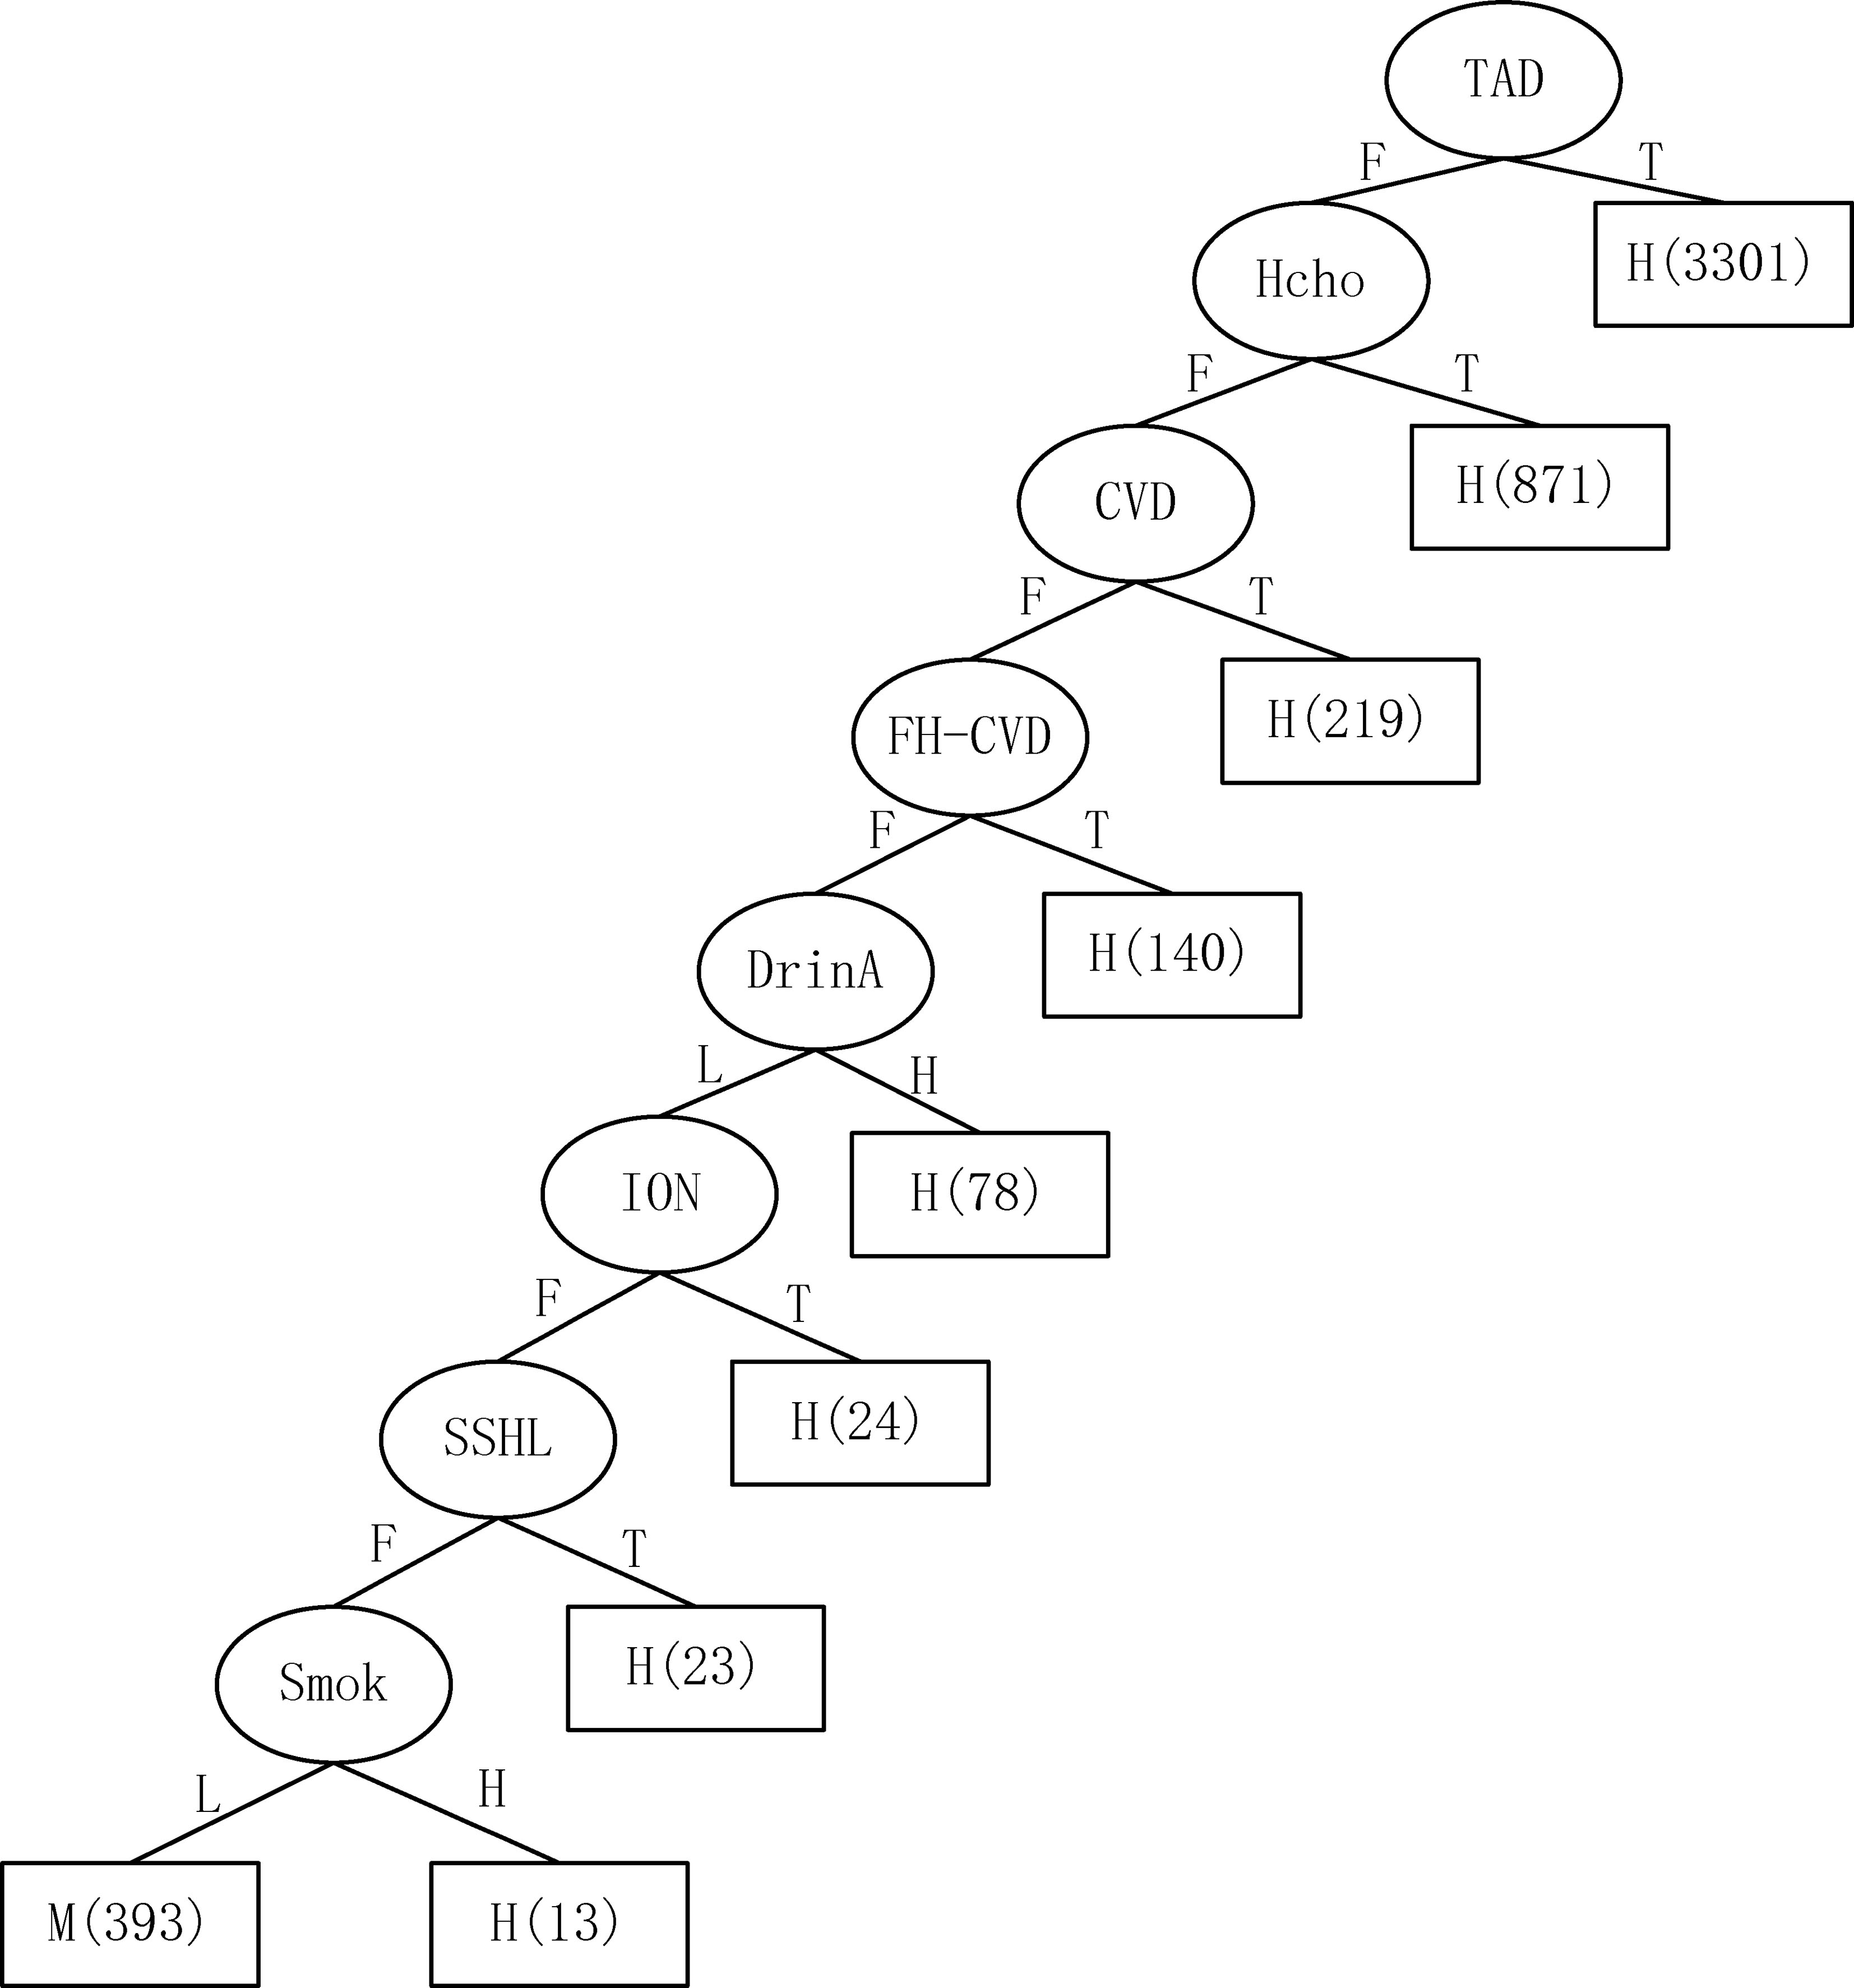
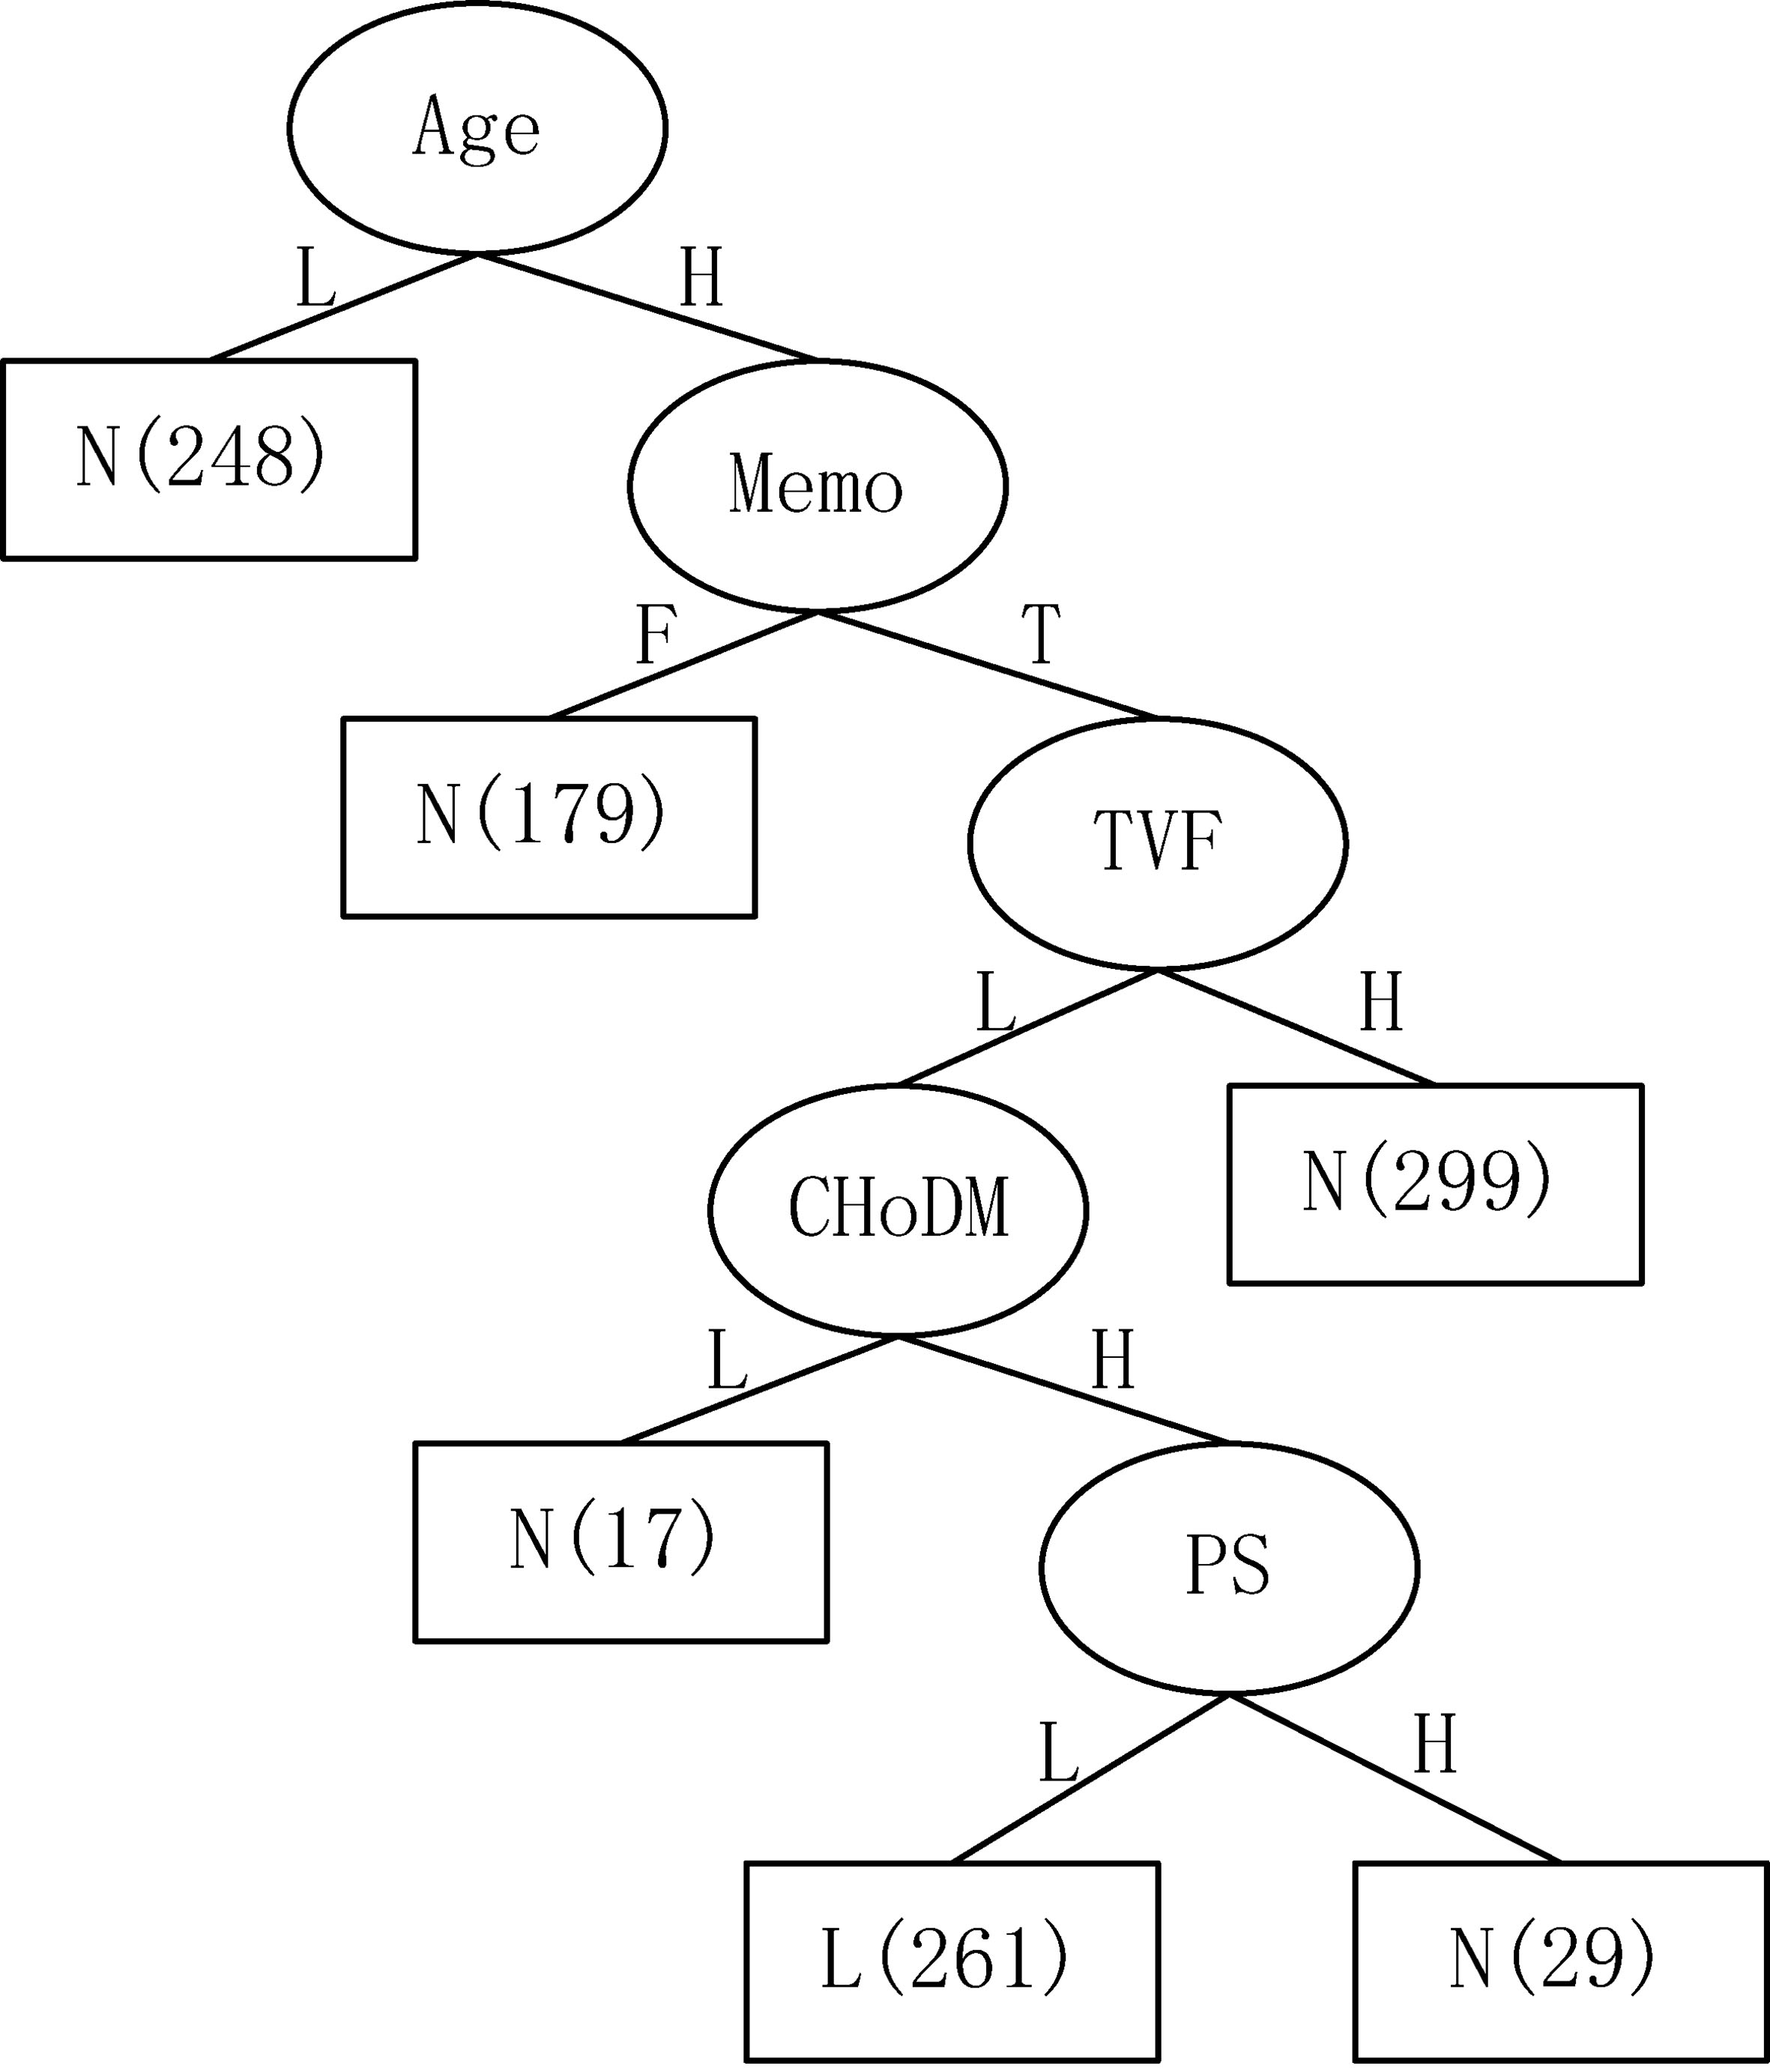
The first-level decision tree generated by the above-mentioned optimized C4.5 algorithm is shown in Fig. 3. That is, the decision tree is firstly classified as “Yes” or “No” risks. As a result, one single type “N” generates one “N” leaf node while a single type “Y” generates four “Y” nodes. These four nodes then continue to generate various subtrees through the C4.5 algorithm. At this time, there are only three classify: “high” (H), “medium” (M) and “low” (L), like Tree 1 as shown in Fig. 4. While, the two-hybrid types Tree5, Tree6 continue to generate various subtrees according to the optimized C4.5 classification. Figure 5 is an example of generated Tree 6. Numbers in nodes, such as “3301”, represent the number of cases. The entire tree has 43 leaf nodes and the tree size is 72.
Figure 4.
The second-level decision tree (Tree 1).
3.2Assessment of the results
To assess the performance of the proposed system for stroke risk classification, precision, recall, accuracy, and kappa are calculated and 10-fold cross-validation is used. The equation for calculating precision, recall, accuracy and kappa as shown in Eqs (5)–(8), respectively.
(5)
(6)
(7)
(8)
Precision represents the ration of all positive predictions among all the predictions. Recall is the ratio of all positive predictions among true events. Accuracy is a ratio of correctly predicted predications to the total predictions. TP (True Positive) is the positive cases that are correctly predicted. FN (False Negative) is the prediction considered as negative where the actual event is positive. TN (True Negative) is the negative cases that are correctly predicted, and FP (False Positive) is prediction labeled as positive where the actual event is negative. Meanwhile, Kappa offers a more robust estimate of the performance of the proposed system as compared to the simple agreement percentage and gives an overall evaluation of all the cases. is the relative observed agreement among proposed system and the physician analysis and is the hypothetical probability of chance agreement. Table 2 presents the confusion matrix of the classification result using the optimized C4.5 algorithm.
Table 2
Confusion matrix of optimized C4.5
| Risk level analyzed by the | Recall (%) | |||||
| proposed system | ||||||
| H | M | L | N | |||
| Risk level analyzed | H | 4183 | 245 | 78 | 301 | 87.02 |
| by physicians | M | 125 | 3297 | 54 | 574 | 81.41 |
| L | 325 | 151 | 2481 | 548 | 70.78 | |
| N | 189 | 456 | 534 | 10141 | 89.58 | |
| Precision (%) | 86.75 | 79.46 | 78.84 | 87.69 | ||
| Accuracy (%) | 84.88 | |||||
| Kappa (%) | 0.7763 | |||||
Figure 5.
The second-level decision tree (Tree 6).
As shown in the Table 2, the accuracy achieves at 84.88% and the Kappa is 0.7763. For the classification of all the risk level, the recall can reach over 80%, except the level Low (L). Regarding the precision, all the risk level can achieve over 75%, and for the risk level High (H) and None (N), it can reach to 86.75% and 87.69% respectively.
3.3Derivation of knowledge rules
From the decision tree which is obtained using the optimized C4.5, corresponding knowledge rules can be deduced. There are 43 knowledge rules deriving in this case. The rules related to the five daily living habits (smoking, drinking, diet, vegetable and fruits consumption, and exercise) among them are listed as below. The detailed analysis of these rules can be found in the discussion section.
1. Old age, suffering from hypertension, heavy smoking, a small amount of alcohol, the risk is H;
2. Old age, suffering from hypertension, low smoking, a small amount of alcohol, the risk is M;
3. Old age, male, low BMI, suffering from diabetes, high cholesterol, low smoking, a small amount of alcohol, a small amount of fruits and vegetables, large amounts of exercise, the risk is H;
4. Old age, female, high BMI, suffering from diabetes, high cholesterol, low smoking, a small amount of alcohol, a small amount of meat and milk, a small amount of fruits and vegetables, the risk is M;
5. Younger age, male, high BMI, suffering from diabetes, hypercholesterolemia, low smoking, a small amount of alcohol, small amount of fruits and vegetables, the risk is H;
6. Low BMI, suffering from diabetes, heart disease, a large amount of alcohol, the risk is H;
7. Low BMI, suffering from diabetes, heart disease, a small amount of alcohol, the risk is M;
8. Low BMI, suffering from high cholesterol, large amounts of fruits and vegetables, the risk is M;
9. Old age, high BMI, large amounts of meat and milk, small amounts of fruits and vegetables, a small amount of exercise, the risk is L;
10. Old age, high BMI, large amounts of meat and milk, large amounts of fruits and vegetables, a large amount of exercise, the risk is N.
3.4Comparison with C4.5 and random forest
In order to evaluate the performance of the proposed optimized C4.5 algorithm, the classical C4.5 and random forest algorithms are implemented for the comparison. Random forest, as proposed by Breiman [12], is an ensemble of decision trees where each tree is trained by a different subset of the training dataset. In this paper, the number of trees in the random forest is set to 100 and for each tree, the minimum number of instances for each leaf is set to 1. Tables 3 and 4 represent the confusion matrix of C4.5 and random forest respectively.
Table 3
Confusion matrix of C4.5
| Risk level analyzed by C4.5 | Recall (%) | |||||
| H | M | L | N | |||
| Risk level analyzed | H | 4109 | 278 | 89 | 331 | 85.48 |
| by physicians | M | 142 | 3227 | 50 | 631 | 79.68 |
| L | 652 | 189 | 1878 | 786 | 53.58 | |
| N | 220 | 413 | 583 | 10104 | 89.26 | |
| Precision (%) | 80.21 | 78.57 | 72.23 | 85.25 | ||
| Accuracy (%) | 81.57 | |||||
| Kappa (%) | 0.7254 | |||||
Table 4
Confusion matrix of random forest
| Risk level analyzed by random forest | Recall (%) | |||||
| H | M | L | N | |||
| Risk level analyzed | H | 4091 | 268 | 119 | 329 | 85.11 |
| by physicians | M | 150 | 3187 | 52 | 661 | 78.69 |
| L | 626 | 168 | 1833 | 878 | 52.30 | |
| N | 237 | 404 | 502 | 10177 | 89.90 | |
| Precision (%) | 80.15 | 79.14 | 73.14 | 84.99 | ||
| Accuracy (%) | 81.45 | |||||
| Kappa (%) | 0.7224 | |||||
By using the C4.5 and random forest, the accuracy can reach 81.57% and 81.45% respectively, which are relatively lower than using the proposed optimized C4.5. Meanwhile, the kappa obtained by C4.5 and random forest is also lower than the proposed algorithm. The recall of the risk level Low (L) can only achieve slightly over 50% using both C4.5 and random forest, which may indirectly prove the robustness of the proposed algorithm in dealing with the unbalanced dataset.
4.Discussion
According to the derivation of knowledge rules, it can be deduced that the five daily living habits (smoking, drinking, diet, vegetable and fruits consumption, and exercise) have an indirect effect on the risk of stroke. But these factors have a demonstrable effect on stroke when hypertension, diabetes mellitus, hypercholesterolemia, and BMI risk factors exist. The average depths in the decision tree of the five daily habits are 9.8, 10.1, 12.1, 8.7, and 12.8 respectively, which indicates that the impact of above five daily living habits on the stroke risk reduce successively. The impact of the above five factors on stroke risk are discussed as below.
4.1Smoking
Among the 43 knowledge rules, there are 17 rules that include the “smoking” factor. Inspired by these rules, it indicates that smoking increases the risk of stroke significantly. Meanwhile, from the rules, it can be also seen that the risk level will greatly increase for smokers with one of the diseases including hypertension, diabetes, high cholesterol or other diseases. The observations are consistent with many research, like, Yamagishi et al. [13] showed that smoking increased the risk of stroke in hypertensive patients.
4.2Drinking
Among the 43 knowledge rules, 19 rules contained the “drinking” factor. The rules indicate that people with high alcohol consumption who are associated with one of hypertension, diabetes, and hypercholesterolemia have a high-risk level of stroke. It can be seen from the rules that if the alcohol consumption is H, the risk level is high, vice versa, if the alcohol consumption is L, the risk level doesn’t change. The observations that heavy drinking could increase the risk of stroke while moderate drinking has little effect on the risk are in accordance with [14].
4.3Diet (meat and milk consumption)
Among the 43 knowledge rules, there are 10 rules including “meat or milk”, and the amount of meat or milk does not have a significant impact on risk. However, the risk will increase for people with hypercholesterolemia or high BMI when eating much meat or milk.
4.4Vegetables and fruits consumption
Among the 43 knowledge rules, there are 21 rules that include “vegetables and fruits”, which has a greater impact on risk. Under the same conditions, eating large amounts of fruits and vegetables will help reduce the risk, especially those with high BMI and hypercholesterolemia. The same observation was found in [15], which presented that eating more than 200 grams of vegetables and fruits a day can help reduce the risk of stroke.
4.5Exercise
Among the 43 knowledge rules, there are 8 rules that include “exercise”. Under the same conditions, the risk is low when the amount of exercise is H. The effect of exercise on risk is more obvious in the elderly population and high BMI. It is also consistent with the observation in [16] that sports may help prevent stroke.
5.Conclusions
In this paper, an assessment of stroke risk factors based on decision tree which utilizes the optimized C4.5 algorithm is presented. The dataset, involving 23,682 cases, which distributed reasonably in terms of gender, age, type of risk is applied. The proposed method not only achieves a high performance for stroke risk level classification, with an accuracy of 84.88% and a Kappa coefficient of 0.7763. More importantly, it also generates a set of knowledge rules which are advantageous for guiding the patients to adjust their living habits. In particular, the knowledge rules related to the living habits are also analyzed and discussed. To our best knowledge, this paper is the first to investigate the five living habits (smoking, drinking, diet, vegetable and fruits consumption, and exercise) together. We found that the above five daily living habits reduce the impact of risk factors successively. In the future, more data will be involved to verify the effectiveness of the proposed method.
Acknowledgments
This research was supported by the China Postdoctoral Science Foundation Grant (Grant nos. 2018T110346 and 2018M632019), the National Key R&D Program of China (Grant no. 2017YFE011 2000), and the Shanghai Municipal Science and Technology Major Project (Grant no. 2017SHZDZX01).
Conflict of interest
None to report.
References
[1] | Ovbiagele B, Nguyen-Huynh MN. Stroke epidemiology: advancing our understanding of disease mechanism and therapy. Neurotherapeutics. (2011) ; 8: (3): 319. |
[2] | Wolf PA, D’agostino RB, Belanger AJ, Kannel WB. Probability of stroke: a risk profile from the framingham study. Stroke. (1991) ; 22: (3): 312-318. |
[3] | Chong JY, Sacco RL. Risk factors for stroke, assessing risk, and the mass and high-risk approaches for stroke prevention. CONTINUUM: Lifelong Learning in Neurology. (2005) ; 11: (4): 18-34. |
[4] | Parmar P, Krishnamurthi R, Ikram MA, et al., The Stroke Riskometer(TM) App: validation of a data collection tool and stroke risk predictor. International Journal of Stroke Official Journal of the International Stroke Society. (2015) ; 10: (2): 231. |
[5] | Orford JL, Sesso HD, Stedman M, et al., A comparison of the Framingham and European society of cardiology coronary heart disease risk prediction models in the normative aging study. American Heart Journal. (2002) ; 144: (1): 0-100. |
[6] | Sr DR, Vasan RS, Pencina MJ, et al., General cardiovascular risk profile for use in primary care: the Framingham Heart Study. Circulation, (2008) . |
[7] | Podgorelec V, Kokol P, Stiglic B, Rozman I. Decision trees: an overview and their use in medicine. Journal of Medical Systems. (2002) ; 26: (5): 445-463. |
[8] | Karaolis MA, Moutiris JA, Hadjipanayi D, Pattichis CS. Assessment of the risk factors of coronary heart events based on data mining with decision trees. IEEE Transactions on Information Technology in Biomedicine. (2010) ; 14: (3): 559-566. |
[9] | Lakshmi B, Indumathi T, Ravi N. A study on c5 decision tree classification algorithm for risk predictions during pregnancy. Procedia Technology. (2016) ; 24: : 1542-1549. |
[10] | Ture M, Tokatli F, Kurt I. Using Kaplan-Meier analysis together with decision tree methods (C&RT, CHAID, QUEST, C45 and ID3); In determining recurrence-free survival of breast cancer patients. Expert Systems with Applications. (2009) ; 36: (2): 2017-2026. |
[11] | Quinlan JR. C4.5 Programming for machine learning. Morgan Kauffmann. (1993) ; 38. |
[12] | Breiman L. Random forests. Machine Learning. (2001) ; 45: : 5-32. |
[13] | Yamagishi K, Iso H, Kitamura A, et al., Smoking raises the risk of total and ischemic strokes in hypertensive men. Hypertension Research Official Journal of the Japanese Society of Hypertension. (2003) ; 26: (3):209-17. |
[14] | Zhang C, Qin YY, Chen Q, et al. Alcohol intake and risk of stroke: A dose-response meta-analysis of prospective studies. Int J Cardiol. (2014) ; 174: (3): 669-77. |
[15] | Hu D, Huang J, Wang Y, et al., Dairy foods and risk of stroke: a meta-analysis of prospective cohort studies. Nutr Metab Cardiovasc Dis. (2014) ; 24: (5): 460-9. |
[16] | Mcdonnell MN, Hillier SL, Hooker SP, et al., Physical Activity Frequency and Risk of Incident Stroke in a National US Study of Blacks and Whites. Stroke. (2013) ; 44: (9): 2519-2524. |


