
Prediction of atrial fibrillation using the recurrence complex network of body surface potential mapping signals
Abstract
OBJECTIVE:
Atrial fibrillation (AF) is the most common type of persistent arrhythmia. Early diagnosis and intervention of AF is essential to avert the further fatality. The technique of noninvasive electrical mapping, especially the body surface potential mapping (BSPM), has a more practical application in the study of predicting AF, when compared with the invasive electrical mapping methods such as the epicardial mapping and interventional catheter mapping. However, the prediction of AF with noninvasive signals has been inadequately studied. Thus, the aim of this paper was to analyze the properties of atrial dynamic system based on the noninvasive BSPM signals (BSPMs), using the recurrence complex network, and consequently to evaluate its role in predicting the recurrence of AF in clinical aspect.
METHOD:
Twelve patients with persistent AF were included in this study. Their preoperative and postoperative BSPMs were recorded. Initially, the preoperative BSPMs were transformed into the recurrence complex network to characterize the complexity property of the atria. Subsequently, the parameters of recurrence ratio (REC), determinism (DET), entropy of the diagonal structure distribution (ENTR), and laminarity (LAM) were calculated. Furthermore, the difference in the parameters in the four regions of the body and the difference obtained from the dominant frequency (DF) method were compared. Finally, the results obtained for the atrial dynamic system complexity from a 12-lead electrocardiogram (ECG) from the BSPMs were discussed.
RESULTS:
Our study revealed that the patients whose REC is greater than an average threshold, and with a lower LAM presented a much higher possibility of AF recurrence, after the AF surgery.
CONCLUSIONS:
The recurrence complex network is a useful and convenient way to evaluate the nonlinear properties of the BSPMs in patients with AF. It has good immunity to the lead position and has a potential role in the understanding of predicting the recurrence of AF.
1.Introduction
Atrial fibrillation (AF) is a very common type of arrhythmia. Patients with AF are frequently prone to suffer from congestive heart failure, stroke and internal organs embolism, resulting in a high disability and mortality. The incidence of AF in the general population is 0.4–1.0%, and with the increase of the age, the incidence rate increases gradually, reaching 5%–10% after 65 years [1, 2]. At present, the electrophysiological mechanism of AF is complex and still not fully understood. The treatment of AF can be divided into drug therapy and radiofrequency ablation. Drug therapy is mainly to control the heart rate to ensure the normal blood supply to the heart and prevent complications, but the long-term use of anti-heart disorder drugs may lead to heart failure. Radiofrequency ablation is a radical treatment, but exhibits a high recurrence rate after heart surgery [3, 4, 5]. It is well known that AF can be self-sustained by the cardiac electrical remodeling, as the disease progresses, which leads finally to a persistent AF [6]. Hence, the early prediction of AF, and a timely treatment are very important to avert the fatal complications.
The study of AF has been the subject of a wide range of interests. From previous studies, we found that the atrial electrical system can change during the sinus rhythm, before it turns into the atrial fibrillation. This makes the prediction of AF possible. Lovett et al. used a time-frequency coherence estimator to quantify this change [7]. Huang proposed a strategy based on the RR intervals to detect this change [8]. However, as these studies are only based on the AF signals itself, those algorithms cannot be used to predict the event of AF.
The prediction of AF began to arouse the interest of researchers in recent years. Linear methods and nonlinear methods were proposed to analysis the complexity of the heart. The Harvard team found that the heart exhibits outstanding nonlinear dynamic characteristics. This means that the nonlinear analysis method is more suitable for analyzing the physiological system, especially the cardiac dynamic system [9, 10, 11, 12]. But due to the difficulties and limitations in the postoperative follow-up, the normal sinus rhythm (NSR) signals of pre-AF and the postoperative signals are rarely used for AF prediction. Most of the AF prediction methods are based on the data obtained from the invasive animal experiments or clinical operations [13, 14]. Invasive mapping method is the major technique in the treatment of cardiac arrhythmias. However, this technique needs complex surgeries and the cost is extremely high. Moreover, sometimes it is difficult to indicate a cardiac arrhythmia and its origin [15, 16]. Thus, in order to promote the clinical application of prediction of AF, an effective and convenient noninvasive mapping method is needed. Body surface potential mapping (BSPM) is one of the advanced noninvasive tools that has been applied successfully in different fields like estimating the distribution of transmembrane potentials, three-dimensional cardiac electrical imaging, etc. [17, 18, 19, 20].
The aim of this study was to analyze the complexity of the atrial dynamic system based on the BSPMs, using the recurrence complex network, and consequently to evaluate its role in predicting the recurrence of AF in the clinical aspect. Initially, the preoperative BSPMs were transformed into the recurrence complex network to characterize the complexity property of the atria. Subsequently, the parameters like the recurrence ratio (REC), determinism (DET), entropy of the diagonal structure distribution (ENTR), and laminarity (LAM) were quantified. Furthermore, the difference of those parameters from the four areas of the body and the difference from dominant frequency method were compared. Finally, the atrial dynamic system complexity of 12-lead electrocardiogram (ECG) from the BSPMs was also discussed.
2.Materials and methods
2.1Recurrence complex network
In the past few decades, complex networks have been widely used in the biological, economic, social, and other fields [21, 22, 23]. Therefore, many mapping algorithms from time series to complex networks have emerged widely. In these methods, the structure of the recurrence complex network is intuitive and can exhibit a unique pattern caused by the typical dynamic behavior that cannot be provided by other methods [24, 25].
The recurrence complex network was proposed by Donner et al. [24]. In a dynamical system, the adjacency matrix
(1)
where,
In general, the time-delay embedding technique was used to reconstruct the state vectors from the time series [27]. In this case, we can obtain the state vector
(2)
where, m is the observing trajectories, which means the number of the electrodes. The state vector
Thus, each distinct
The properties underlying the system can be investigated by the complex networks that are built in this way. In the present work, four parameters were analyzed according to the pattern of the BSPMs.
Recurrence rates (REC) is the ratio of recursive points in a recursive graph that reflects the degree of aggregation of the system orbit in a phase space.
(3)
Determinacy (DET) is the ratio of deterministic structures, defined as the recurrence point ratio of a main diagonal structure whose length exceeds the threshold
(4)
where,
Entropy (ENTR) is the Shannon entropy of the diagonal structures distribution in the recursive graphs.
(5)
The distribution of the diagonal structure length is quantified by the ENTR. The greater the difference in distribution of diagonal lengths, the more complex is the deterministic structure of recursive graphs. Thus, the ENTR will get the greater value, which means a greater complexity of the atrial system.
Lamellar (LAM) is the percentage of recursive points of vertical lines or horizontal lines; in other words, the percentage of retention structure.
(6)
where,
2.2Data acquisition
2.2.1Subjects
A selective group of patients presented with persistent AF as their main disease at the West China Hospital of Sichuan University, was enrolled in this study. All patients were subjected to routine preoperative assessment especially the electrophysiological examination.
Table 1
Patient characteristics
| Parameter | Value |
| Age | 56 |
| Male/Female | 4/8 |
| Rheumatic heart disease (RHD) | 12 |
| Mitral stenosis (MS) | 9 |
| Mitral regurgitation (MR) | 7 |
| Tricuspid regurgitation (TR) | 8 |
| Aortic stenosis (AS) | 2 |
| Aortic regurgitation (AR) | 2 |
| Recurrence of AF/No recurrence of AF | 4 |
BSPMs were measured of 12 patients twice; before and after the operation. The fundamental and the medical information of the patients is summarized in Table 1. All patients were informed of the data collection, and a signed written informed consent was taken. The patient information was anonymized prior to the analysis. The research programme strictly followed the principles of the Helsinki Declaration and was approved by the Institutional Ethics Committee of the West China Hospital, Sichuan University.
Figure 1.
Flexible electrode net and recording system.
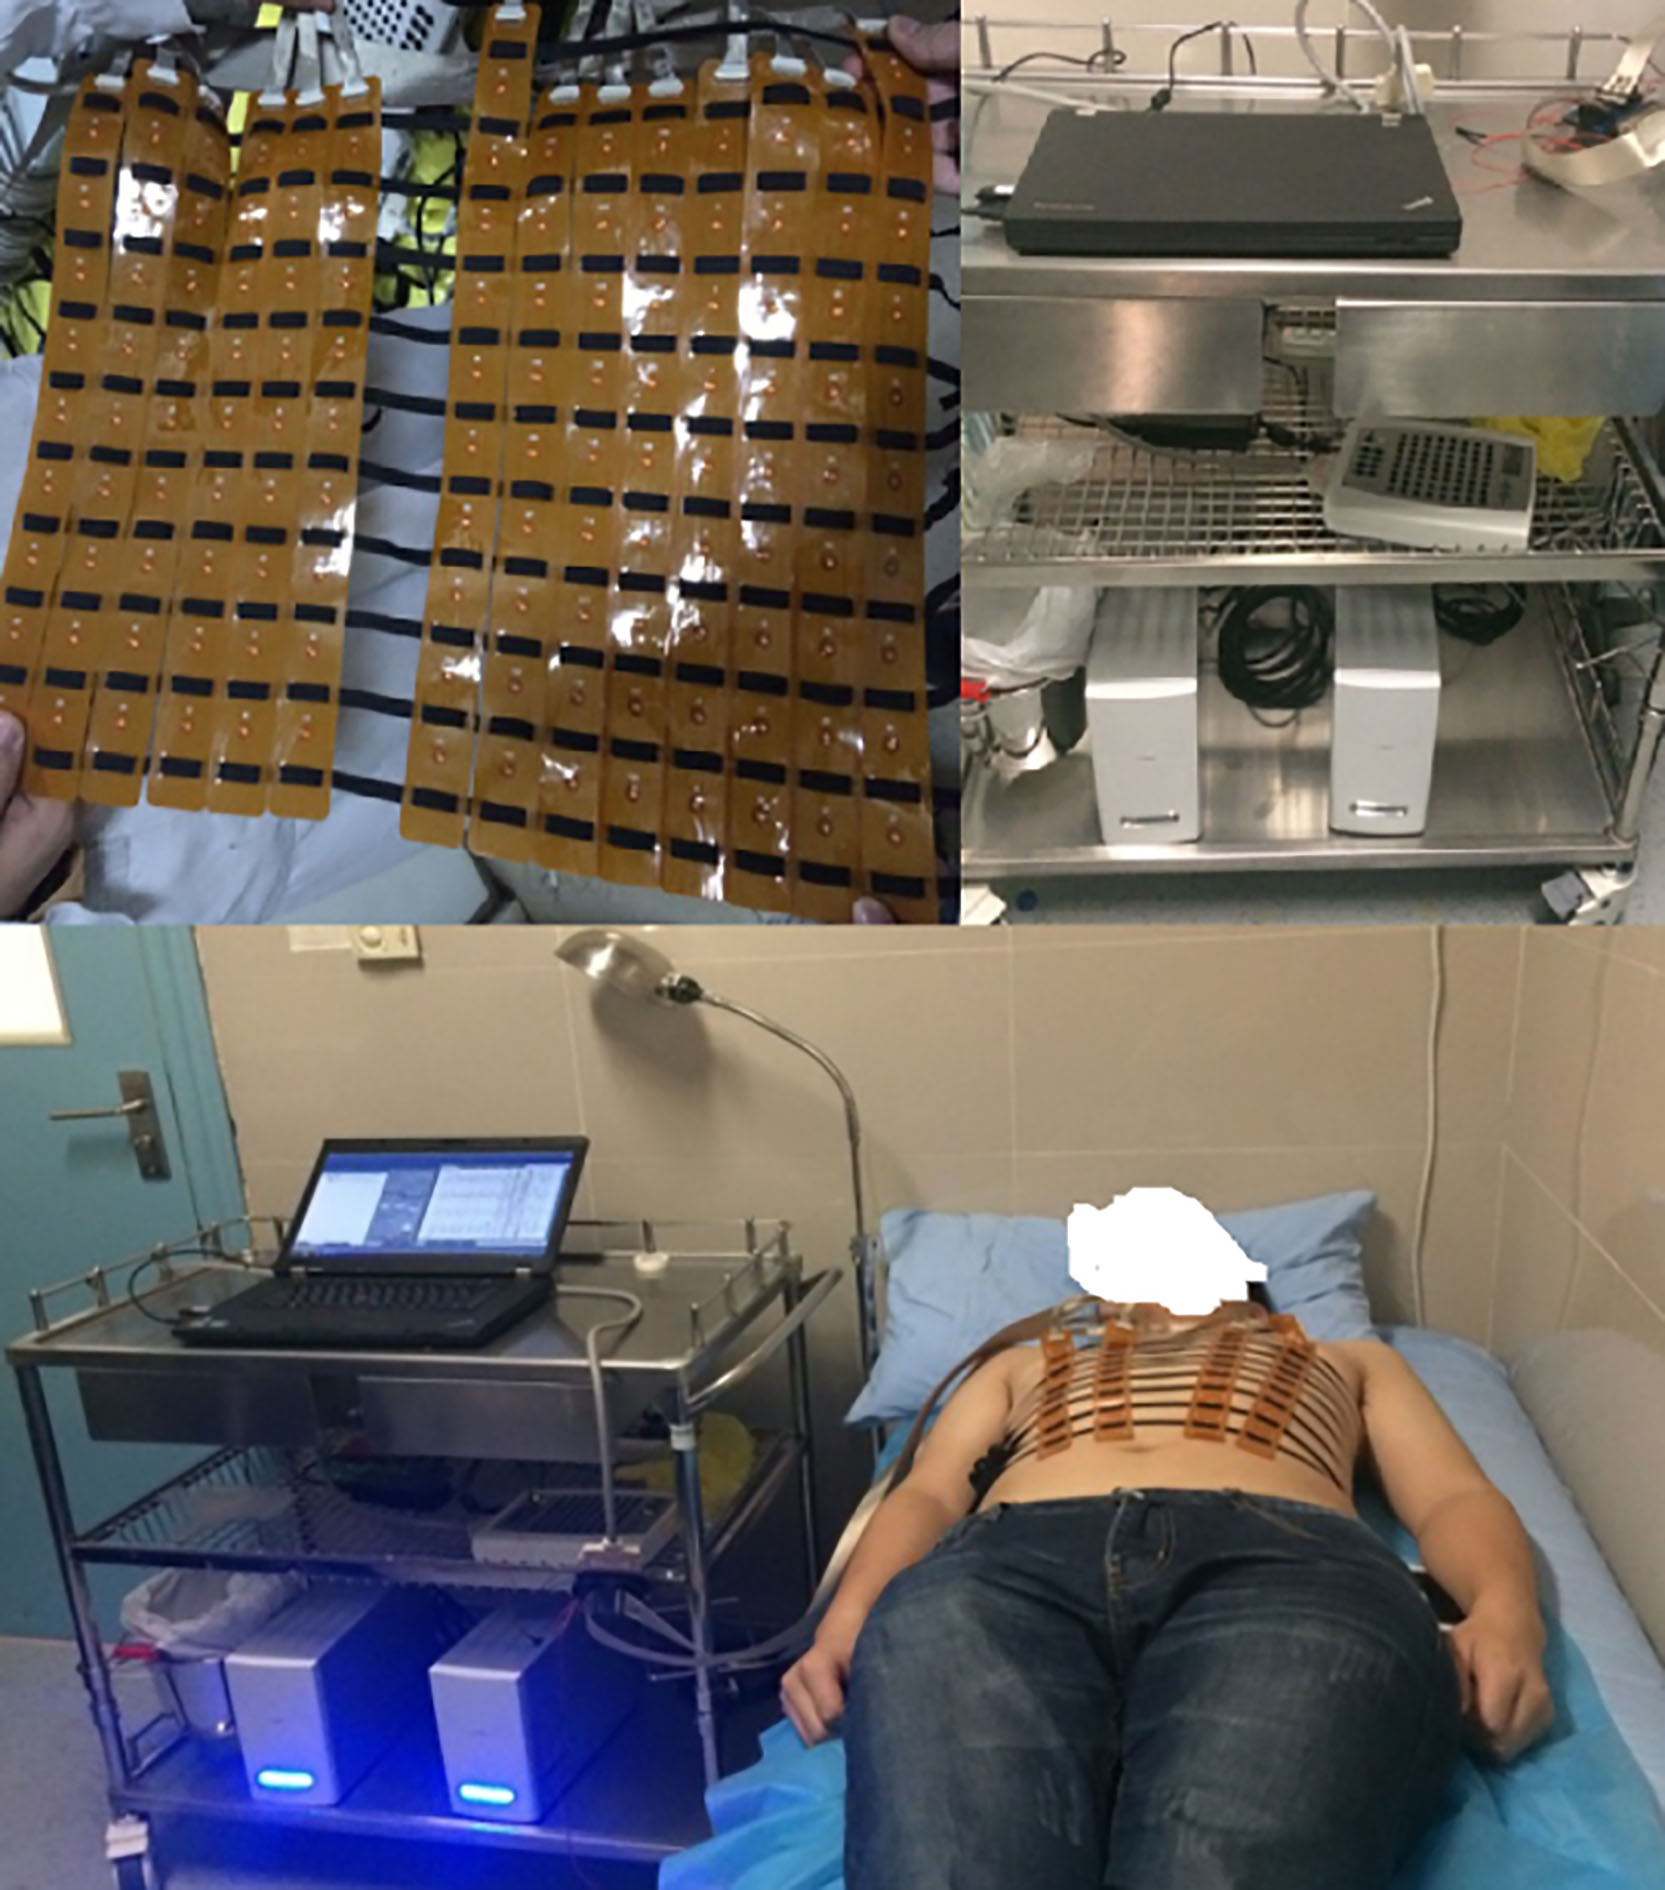
2.2.2128-channel BSPM system
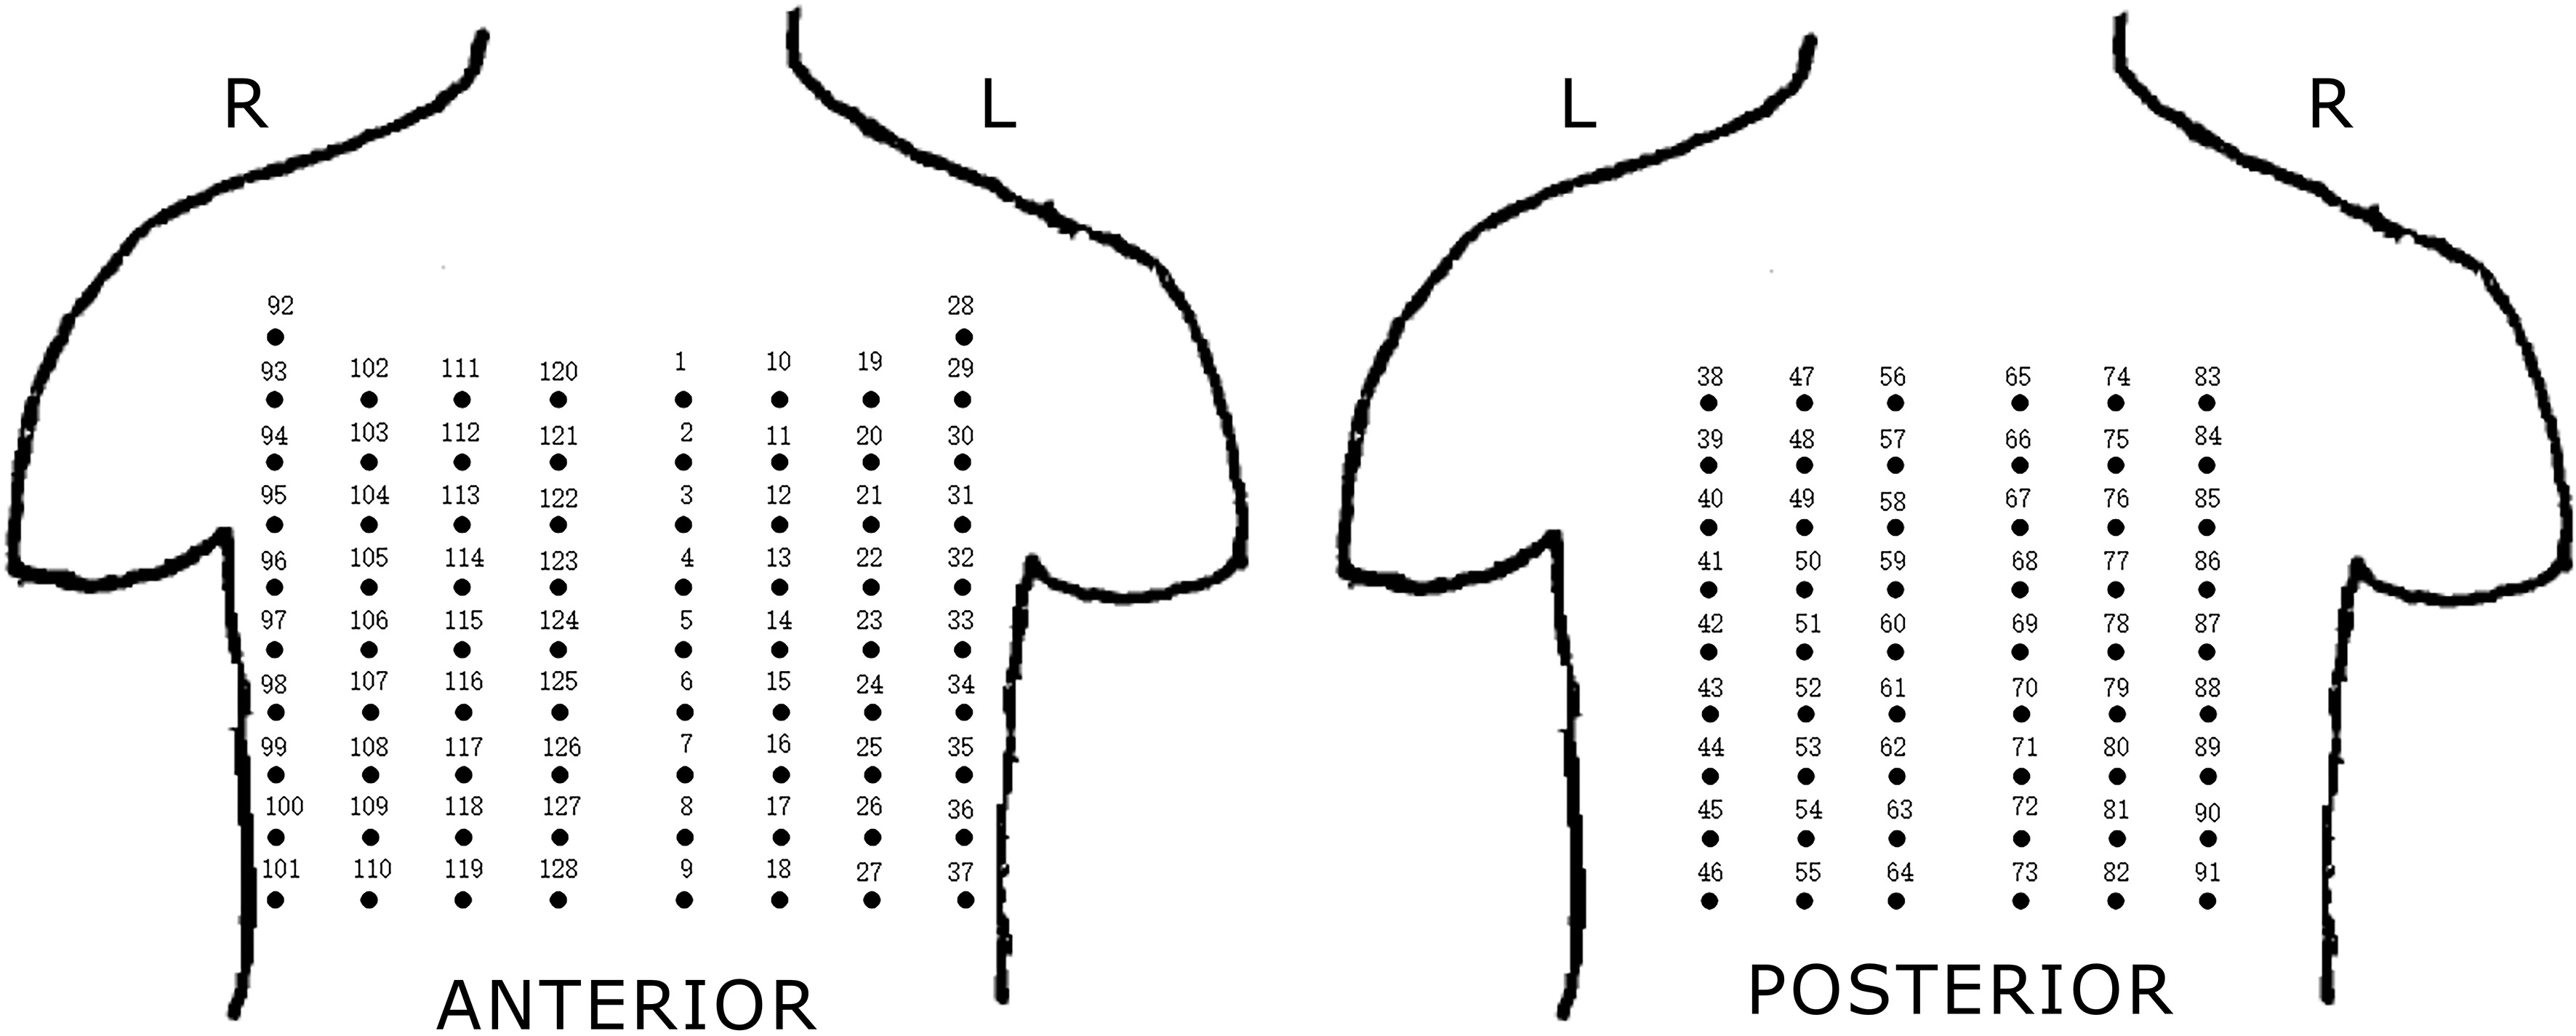
The BSPM system composed of two parts: the flexible electrode net and the recording system. As shown in Fig. 1, the flexible electrode net of a composed structure of 14 bands developed by the Cardiac Electrophysiology and Pacing Laboratory of Fudan University, was used for the study. Just like a ‘vest’, these electrode bands were connected with elastics to ensure clinging of the electrode to patient’s body surface, for collecting the BSPMs. A total of 128 electrodes were present on the ‘vest’. The distance between the two adjacent electrodes in the same band was 3.5 cm, and the distance between bands was adjustable. The distribution of the electrodes on the patient’s body surface is shown in Fig. 2. The mapping areas were divided into four regions for subsequent signal processing. Another part of the BSPM system was the NeuroScan (model ESI-128, Australia Compumedics Ltd.), a multi-channel recording system for recording the electrophysiological signals.
Figure 2.
Electrodes distribution of BSPM system. Four regions: I-anterior left region, II-anterior right region, III-posterior left region, IV-posterior right region.
It was used to complete the amplification, filtering, display and storage of the BSPMs with 24 bits of A/D and 1 kHz of the sampling frequency [28]. The Wilson Center Terminal was also designed in the front end of the BSPM system, which is the reference point of all the electrodes, to obtain the corresponding voltage value. The circuit of the central terminal was made in the electrode lead-out PCB.
2.2.3Preprocessing of BSPMs
Three minutes preoperative and postoperative BSPMs of the 12 patients were recorded by the BSPM system. In this study, the length of each segment was 4 s, thus each patient’s BSPM data were divided into 45 segments with 128-channels. Apart from signals with poor quality, the recurrence of the complex network was used to analyze the residual signals.
As shown in Fig. 2, we constructed the recurrence complex network for every segment data in four regions, separately. Thus, there were totally 12
For the remaining 500 segment signals, we firstly removed the 50 Hz frequency interference through 50 Hz notch filter. Then the classical method was adopted for the processing of BSPMs, which included a band-pass filter of a digital, zero-phase, third-order Butterworth filter with a range of 0.5–100 Hz, and a low-pass filter of third-order Butterworth filter with a 20 Hz cutoff ( the results are shown in Fig. 3) [29].
Figure 3.
Preoperative channel 21 (anterior) and 76 (posterior) BSPMs of one AF patient.
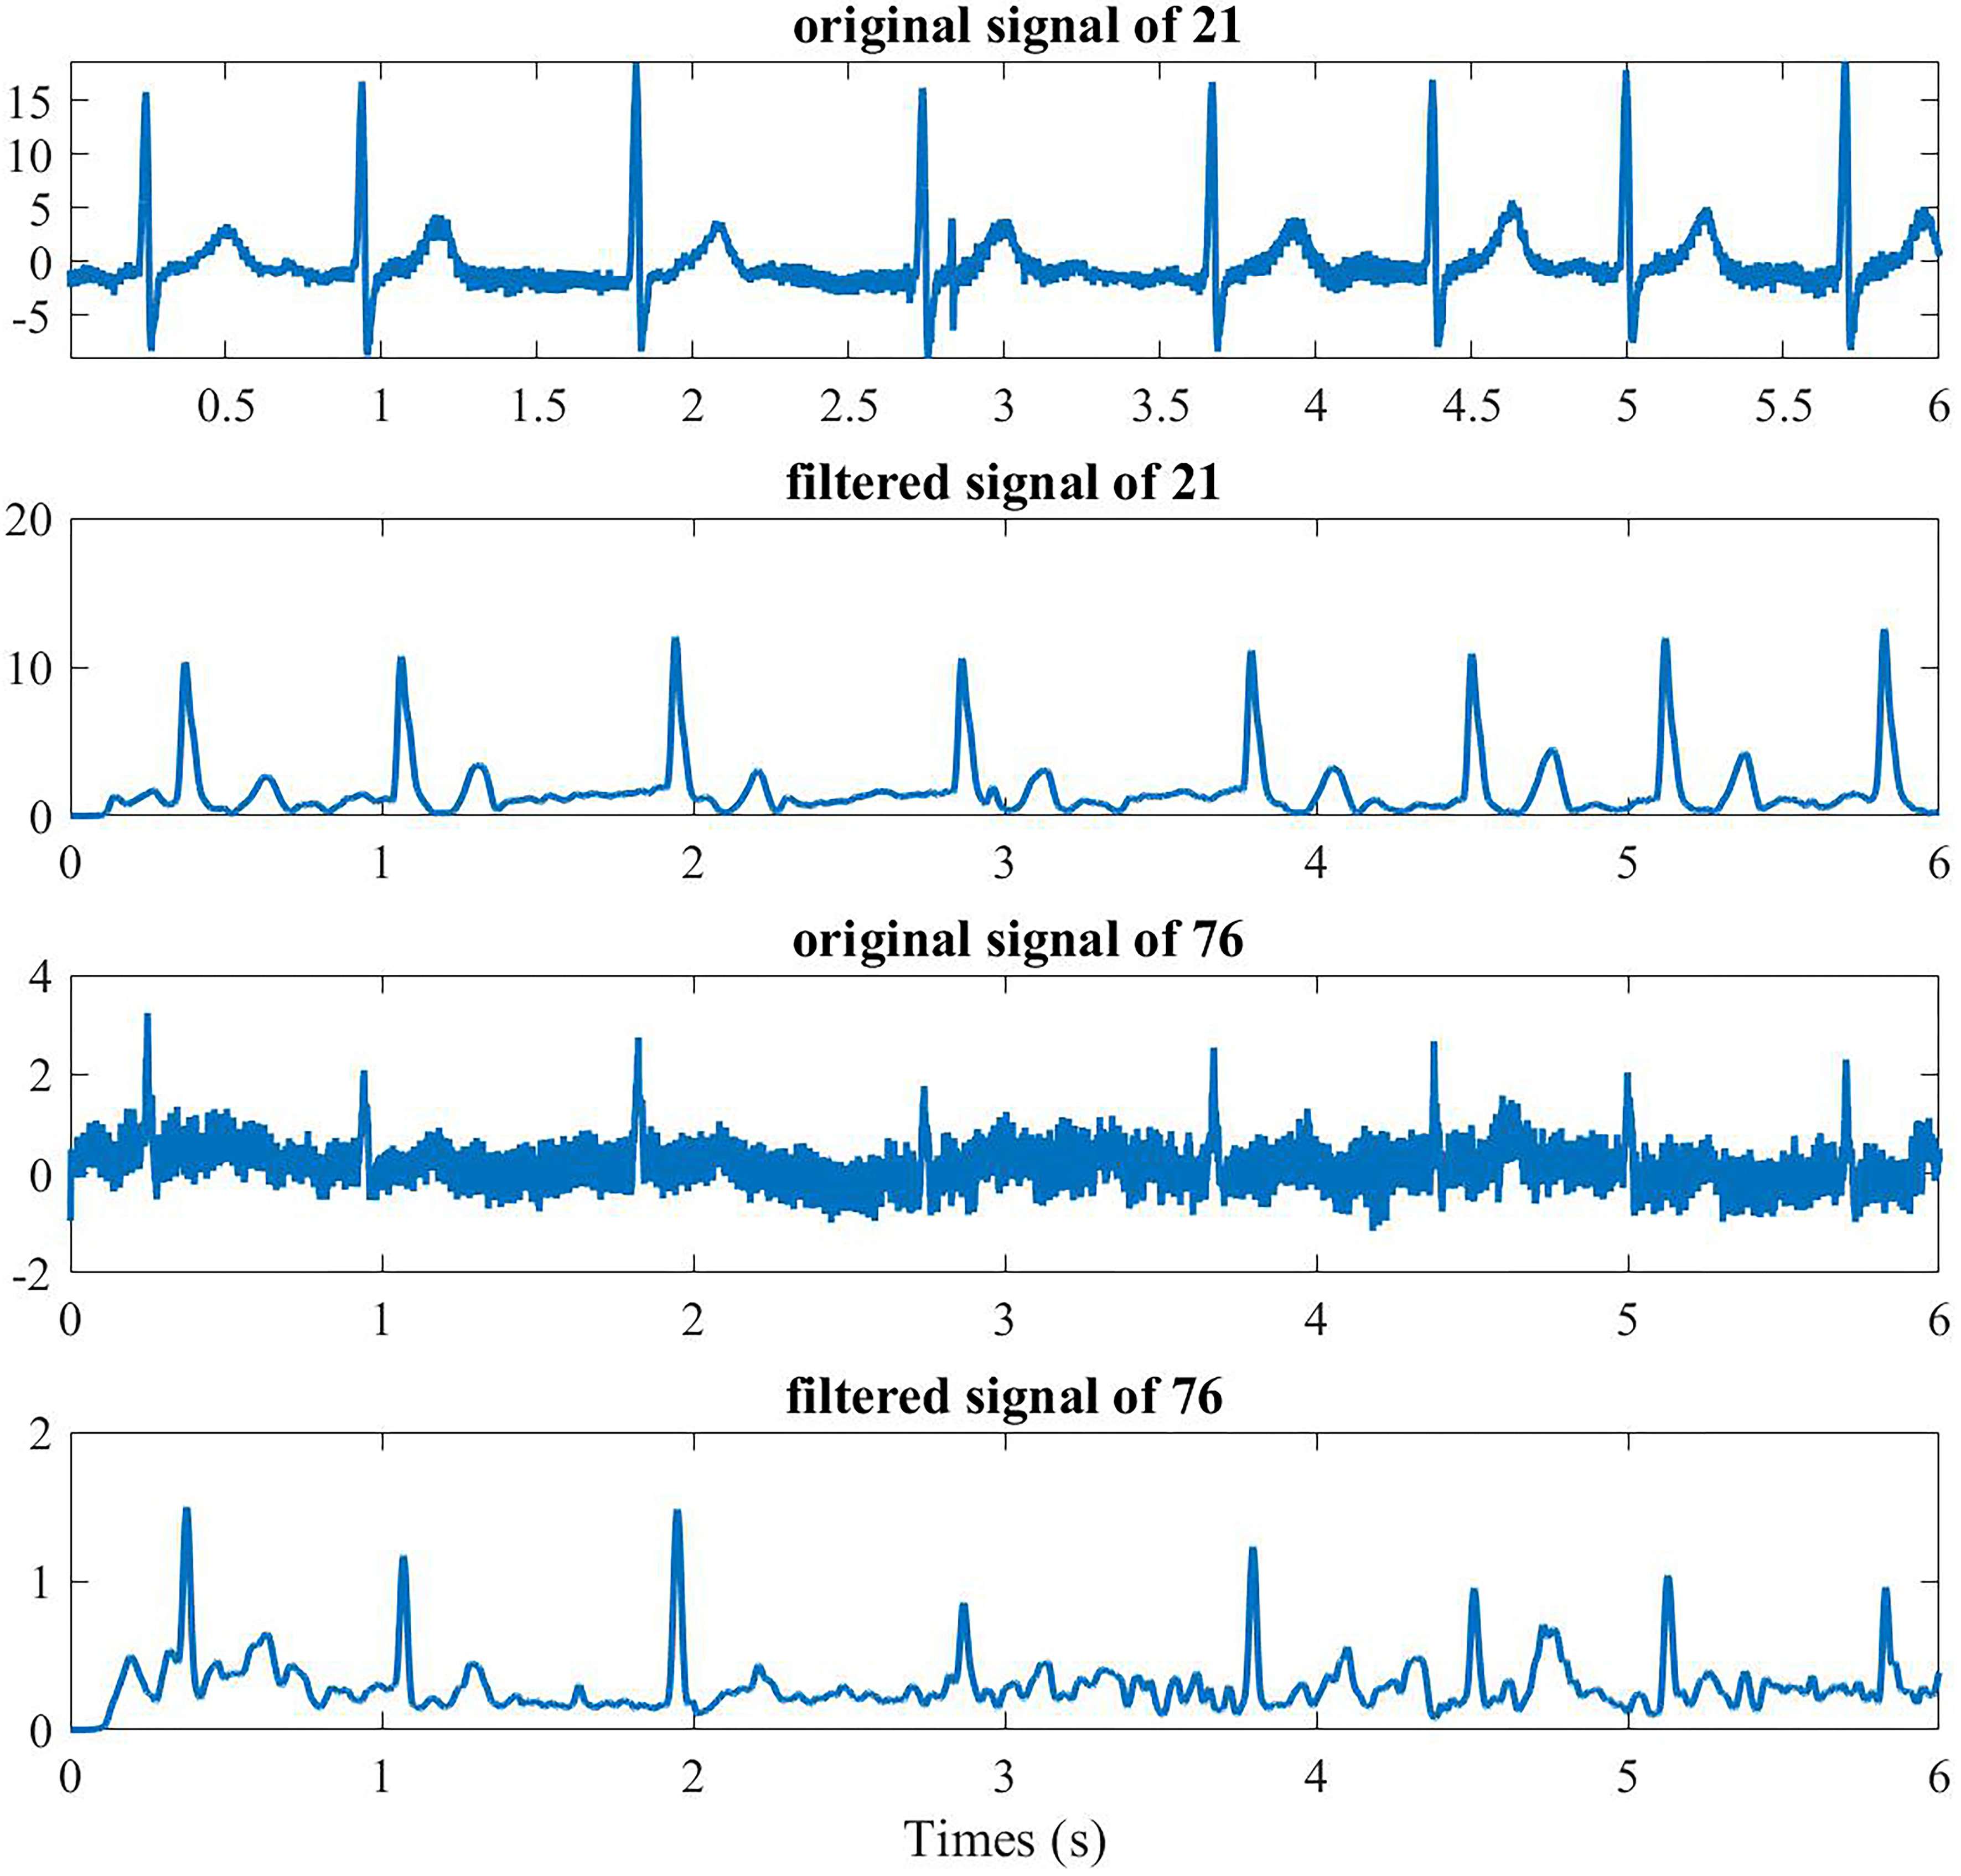
Figure 4.
12-lead ECG obtained from BSPMs.
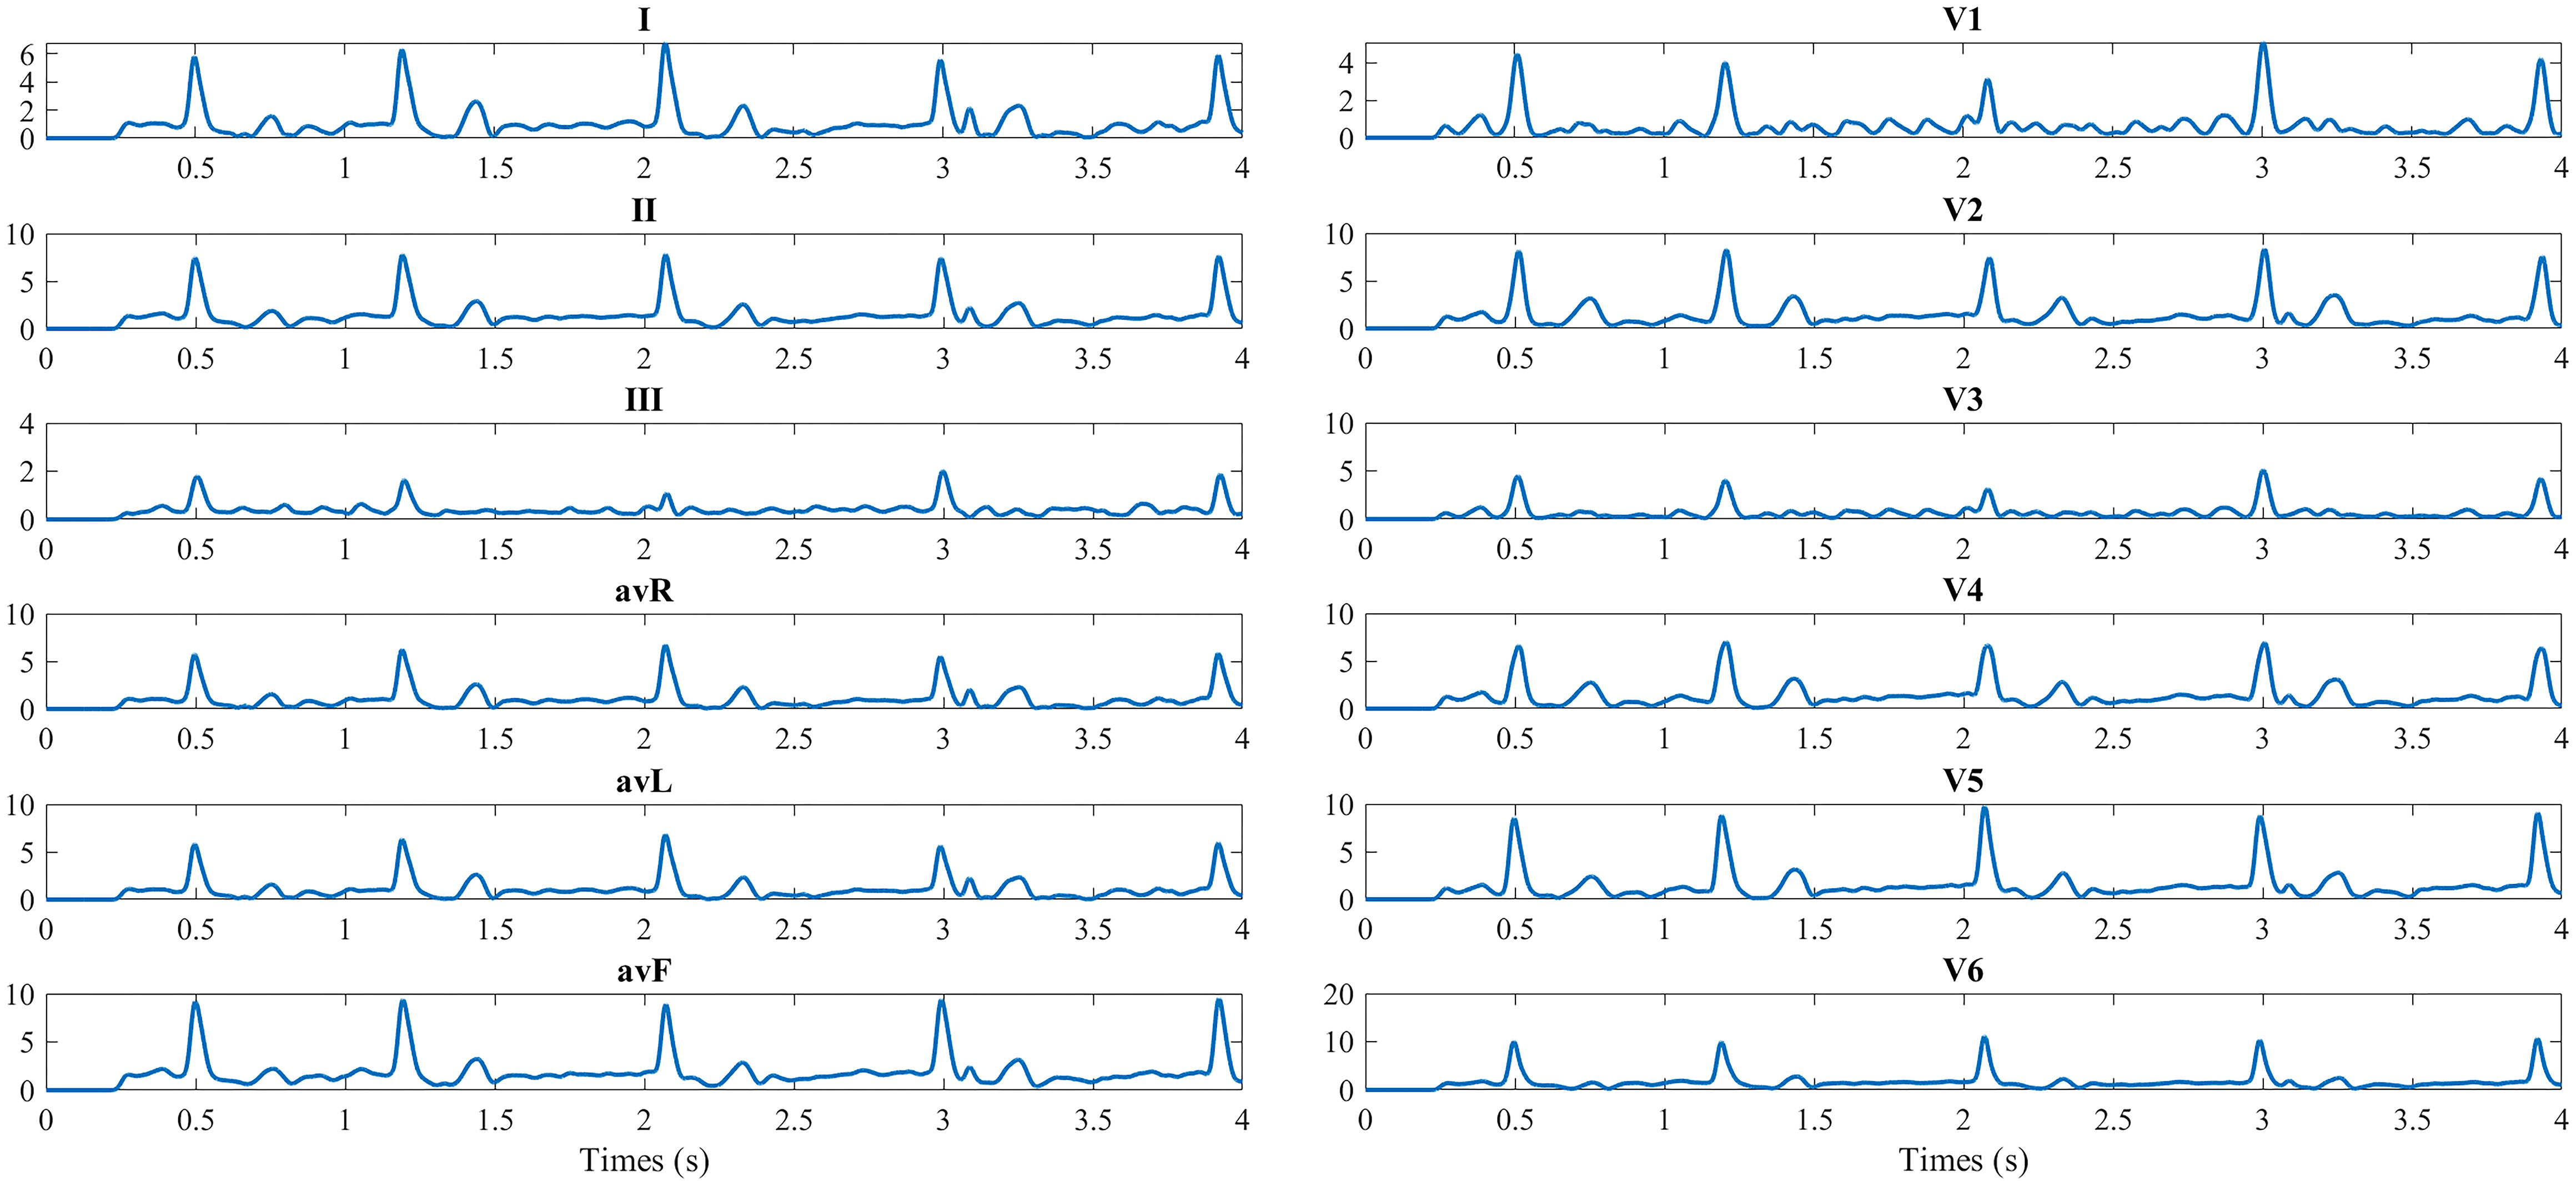
Figure 5.
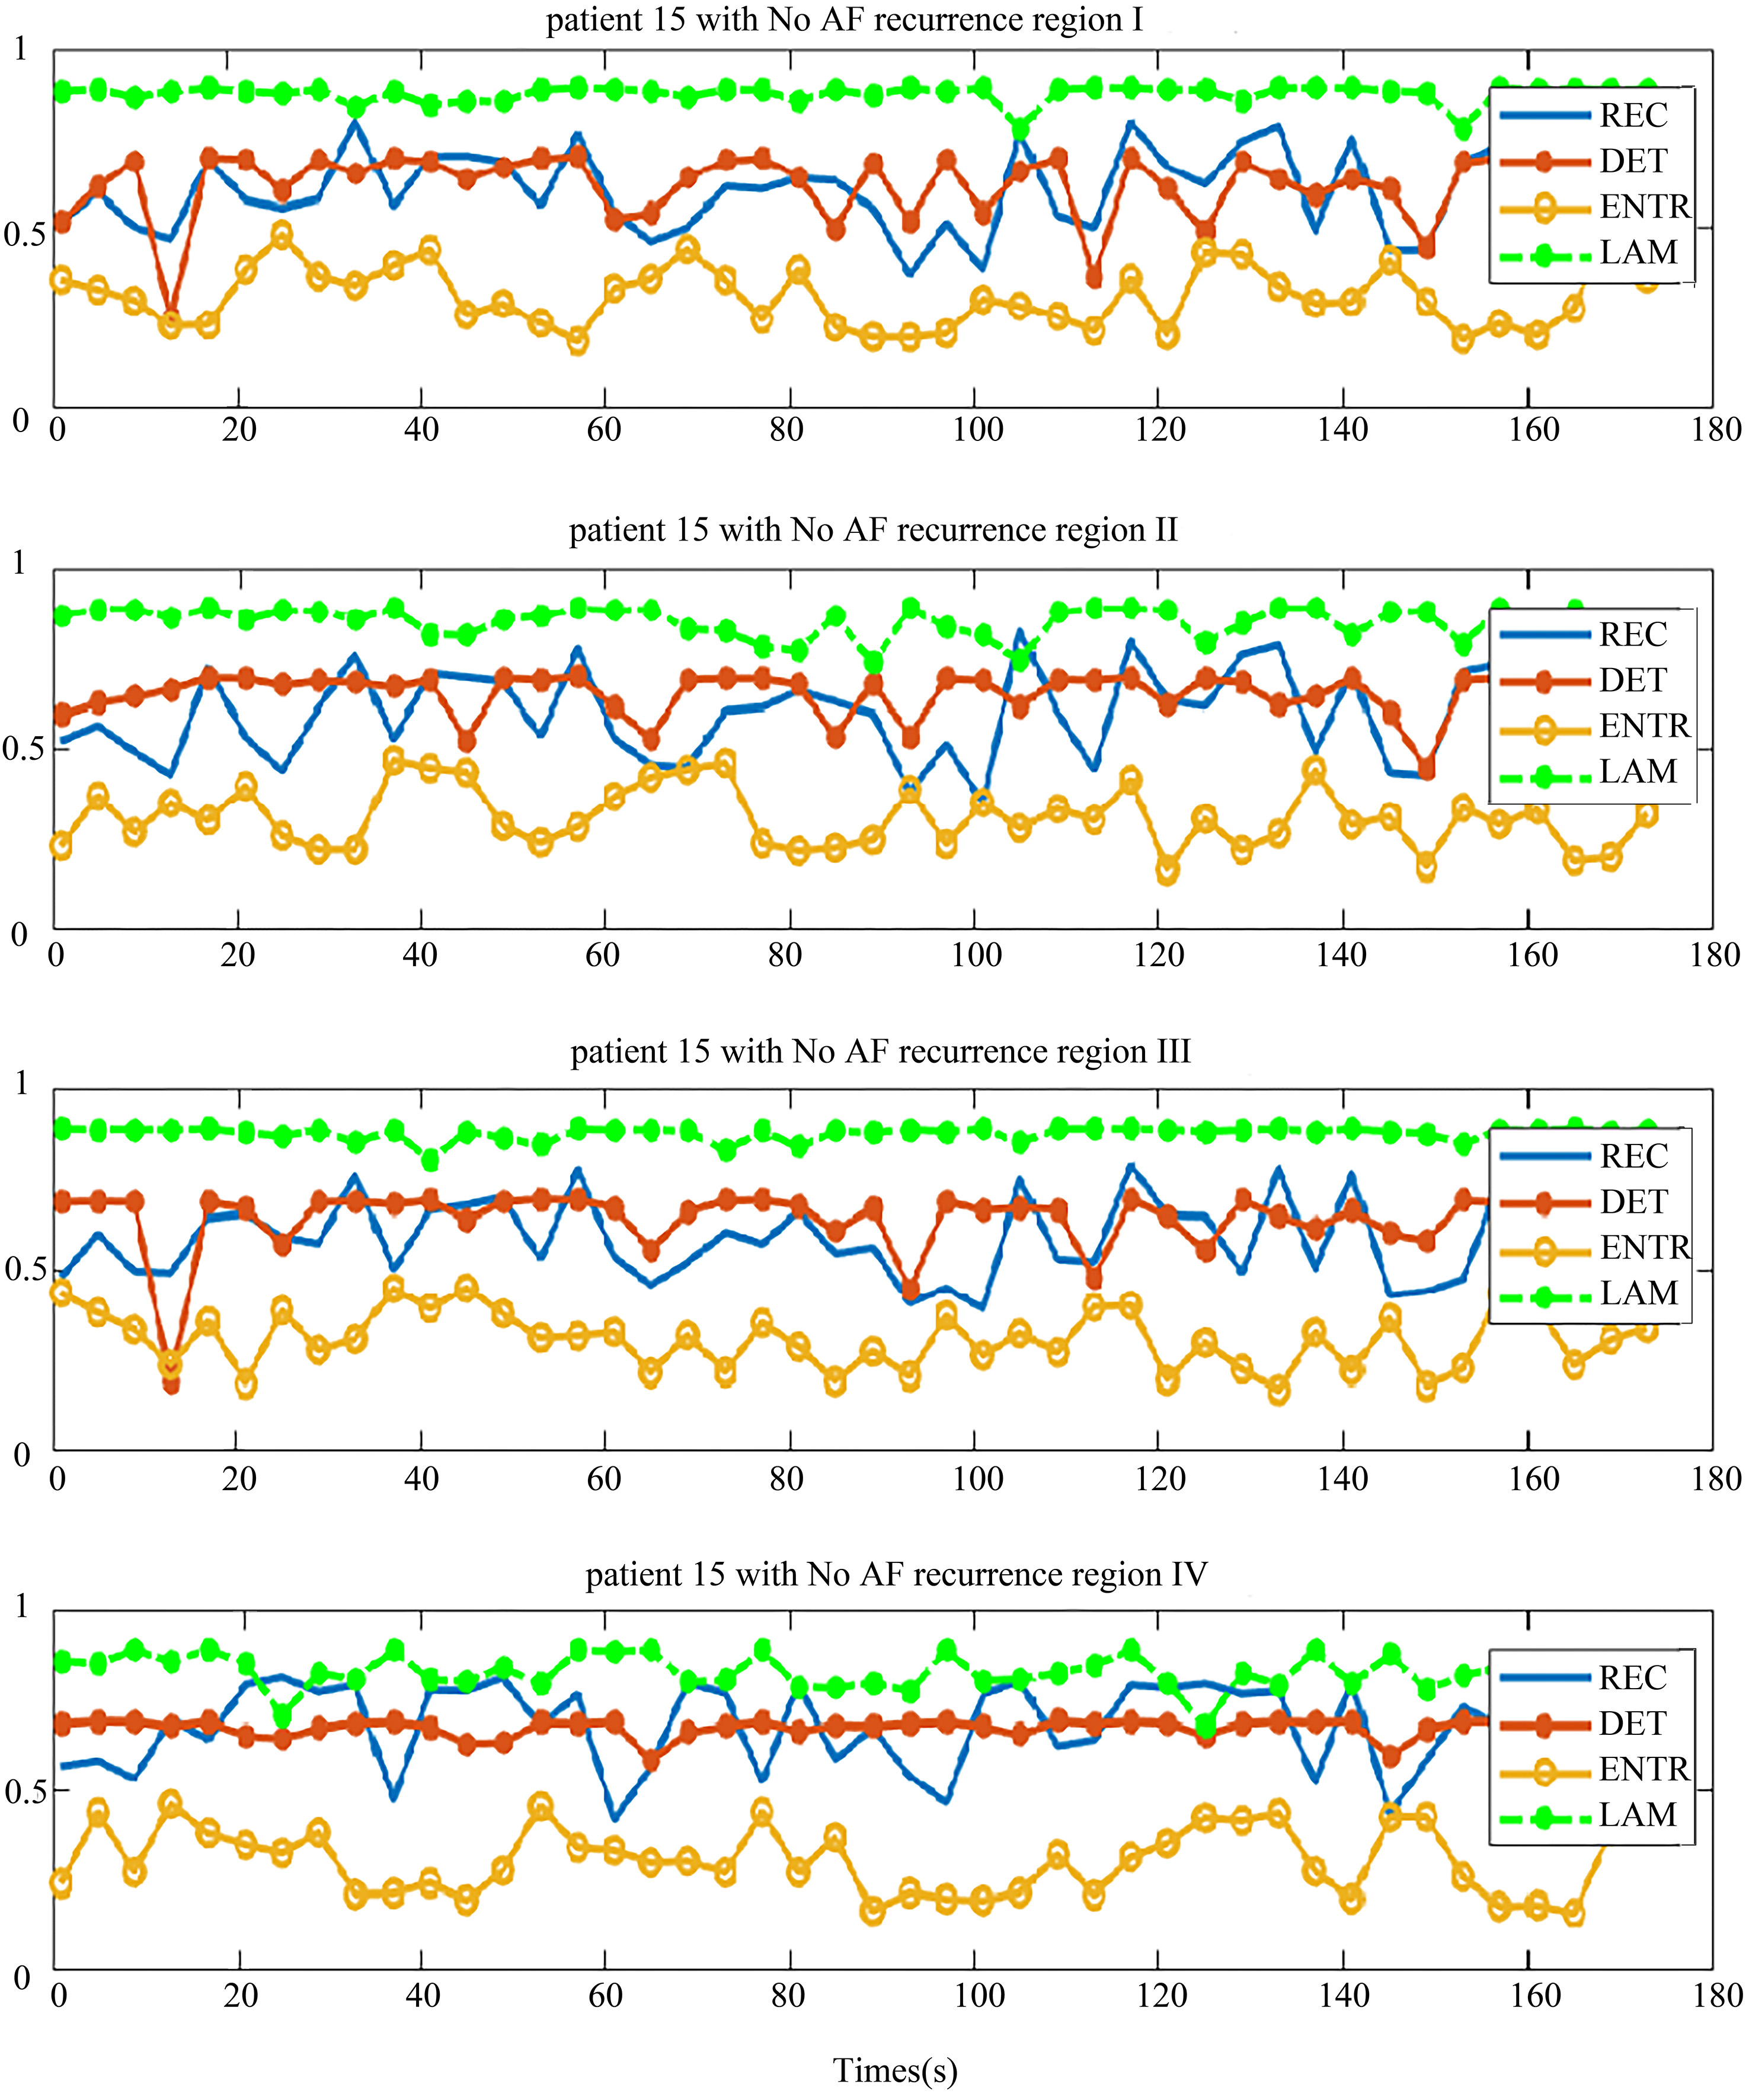
Four regional parameters for patients with no recurrence of AF. The region I, II, III and IV, and four parameters are drawn in each chart from top-down.
The 12 lead ECG is the standard graphical tool that was obtained from the 128-channel BSPMs. The conventional 12 leads were taken as the reference, and electrodes V1–V6 were selected. The specific locations of electrodes to obtain 12-lead ECGs from 128-channel BSPMs are as follows: Right arm – electrode 29, left arm – electrode 93, left leg – electrode 37, V1 – electrode 121, V2 – electrode 2, V3 – center of electrode 2, 3, 11, 12; V4 – electrode 12, V5 – electrode 21, V6 – electrode 31 [12]. The 12-lead ECG from the 128-channel BSPMs is shown in Fig. 4. As the BSPMs, 500 segments of 12-lead ECG of the preoperative AF patients are used to construct the complex network.
3.Results and discussions
3.1Recurrence complex network analysis for four regions
The distribution of the body surface electrodes was divided into four regions as shown in Fig. 2. After the pre-processing, we transformed each patient’s BSMPs of the preoperative to the recurrence complex network according to the Eq. (1) in these four regions respectively. Then the REC, DET, ENTR and LAM of each region were calculated. For example, these four parameters of the complex network in respective four regions are given in Figs 5 and 6. The patient in Fig. 5 had no recurrence of AF found after the maze operation in one year. The patient in Fig. 6 was found to get the recurrence of AF, after three months after the operation.
Figure 6.
Four regional parameters for patients with recurrence of AF. The region I, II, III and IV, and four parameters are drawn in each chart from top-down.
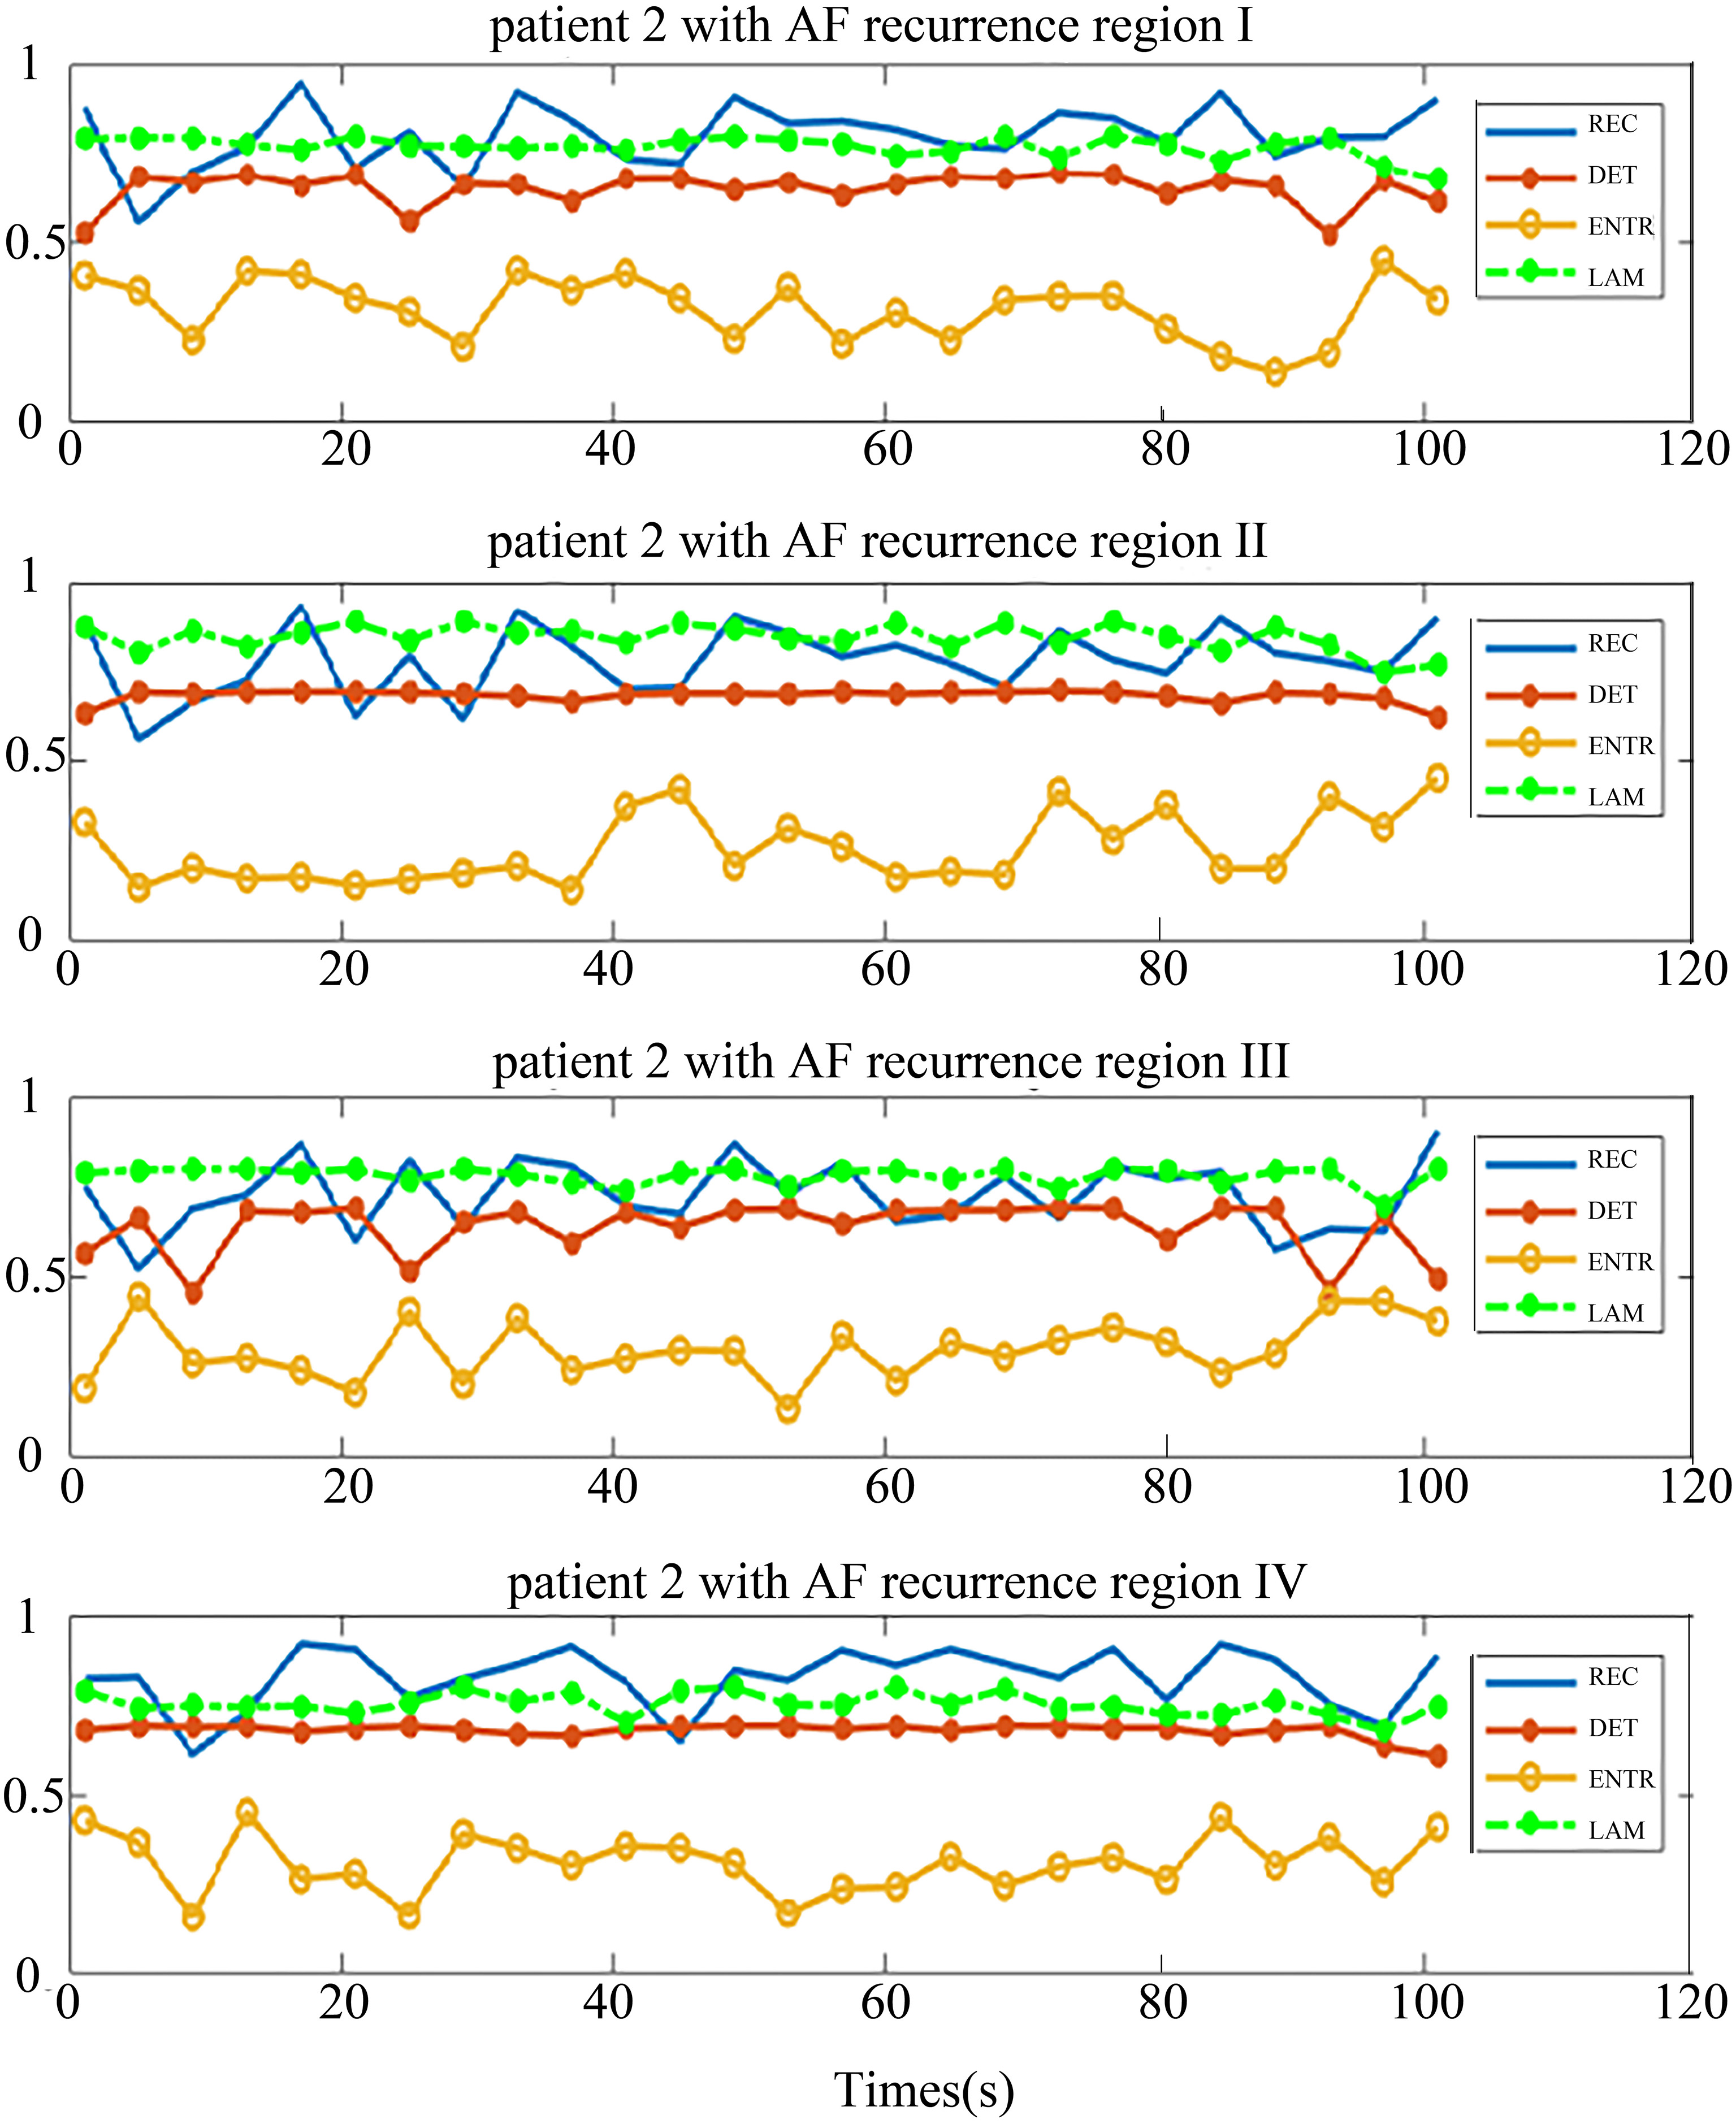
It can be seen from the chart that each parameter in the same region shows better consistency, both in the no-AF recurrence patient and AF recurrence patient. This implies that the phase space trajectory of the atrial heart in each four parts exhibited a same trend of change. This is consistent with the electrophysiological conduction characteristics.
In the patient with no recurrence of AF, the distribution of DET and REC were similar in four regions (Fig. 5), and the distribution of LAM and ENTR were apart. But in-total, the distribution of these four parameters was not far away from each other. By comparing the distribution of these parameters, we observed some rules to distinguish the patients who had no recurrence of AF, based on the relationship of the distribution of parameters.
In contrast, Fig. 6 shows the situation of one patient who had recurrence of AF. The trend of the distribution of the parameters is very different from Fig. 5. The distribution of REC, DET and LAM were similar in the four regions and the distribution of ENTR was away from them. There is a distance between two parameter group (ENTR and REC, DET, LAM).
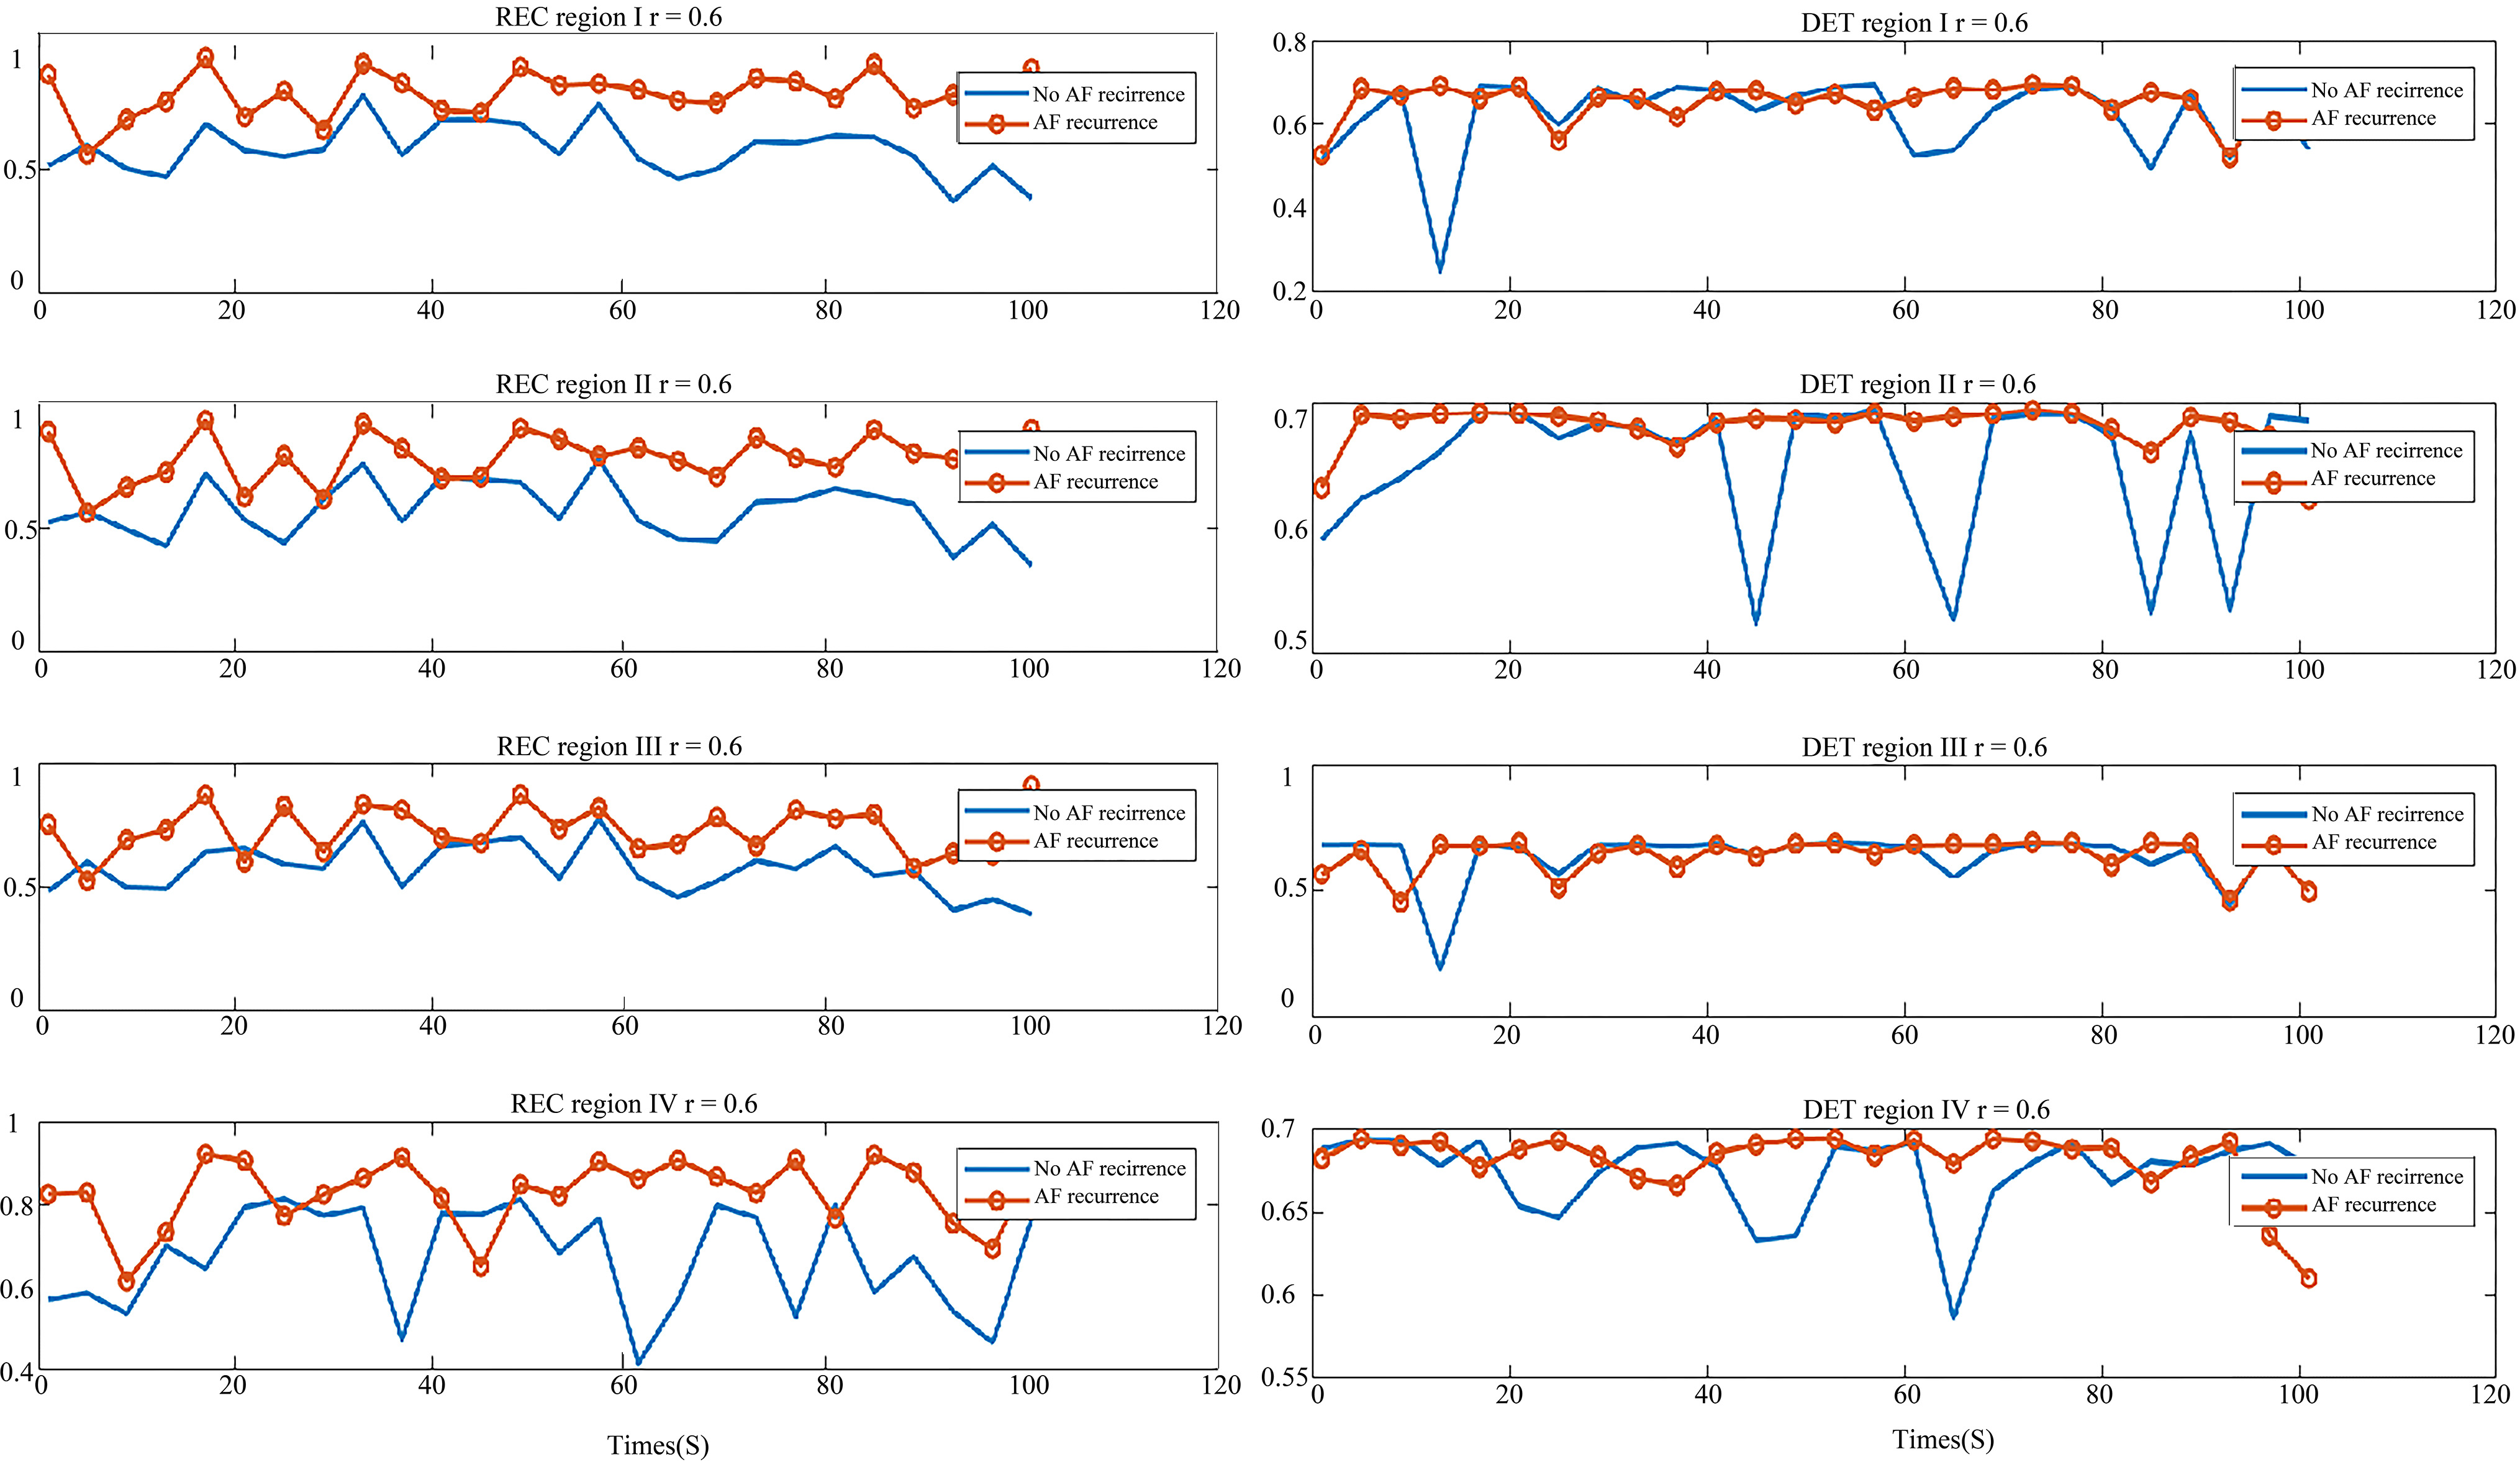
In order to display their differences better, we compared the parameters of each of the four regions in two types of patients, shown in Figs 7 and 8. In Fig. 7, the graph on the left is REC comparison of the AF recurrence patient and no-AF recurrence patient in four regions, the right is DET comparison graph. As shown in the graph, REC of the AF recurrence patient is greater than that of the no-AF recurrence patient. This shows that in the same period, the recursive state of atrial system in the AF recurrence patient is more than that of the no-AF recurrence patient, and hence the ability of the aggregation of phase space orbit is stronger. The DET value distribution of the two types of patients was similar, which shows that the ability to continue a steady approximation in the phase space of both types was similar.
Figure 7.
Comparison of parameters in the AF recurrence patient and no-AF recurrence patient. Left: the REC comparison of region I, II, III and IV; Right: the DET comparison of region I, II, III and IV. The red line with circle indicates the AF recurrence patient parameter, and the blue line is the parameter of the no-AF recurrence patient.
In Fig. 8, the graph on the left is the ENTR comparison of two types of patients in the four regions and the right is the LAM comparison graph. Like the DET value distribution, the ENTR distribution of these two types of patients was similar. From the right graph of Fig. 8, the LAM of no-AF recurrence patient was greater than that of AF recurrence, which means the atrial system stability of those two patient types was different. Thus, the REC and LAM showed a difference between the no-AF recurrence patient and AF recurrence patient, which may be used as indicators to predict the AF recurrence.
Table 2
Statistical analysis of REC and LAM in patients who had recurrence of AF after ablation in four regions
| # | I | II | II | IV | |
|---|---|---|---|---|---|
| 1 | REC | 0.8581 | 0.9261 | 0.9144 | 0.9256 |
| LAM | 0.7718 | 0.8263 | 0.7570 | 0.7421 | |
| 2 | REC | 0.8031 | 0.7803 | 0.7290 | 0.8268 |
| LAM | 0.7713 | 0.8436 | 0.7819 | 0.7537 | |
| 3 | REC | 0.8614 | 0.8779 | 0.8335 | 0.8423 |
| LAM | 0.7676 | 0.8535 | 0.7704 | 0.7706 | |
| 4 | REC | 0.8829 | 0.8979 | 0.9075 | 0.9063 |
| LAM | 0.7637 | 0.8409 | 0.7525 | 0.7515 |
Figure 8.
Comparison of parameters in the AF recurrence patient and no-AF recurrence patient. Left: the ENTR comparison of region I, II, III and IV; Right: the LAM comparison of region I, II, III and IV. The red line with circle indicates the AF recurrence patient parameter, and the blue line is the parameter for the no-AF recurrence patient.
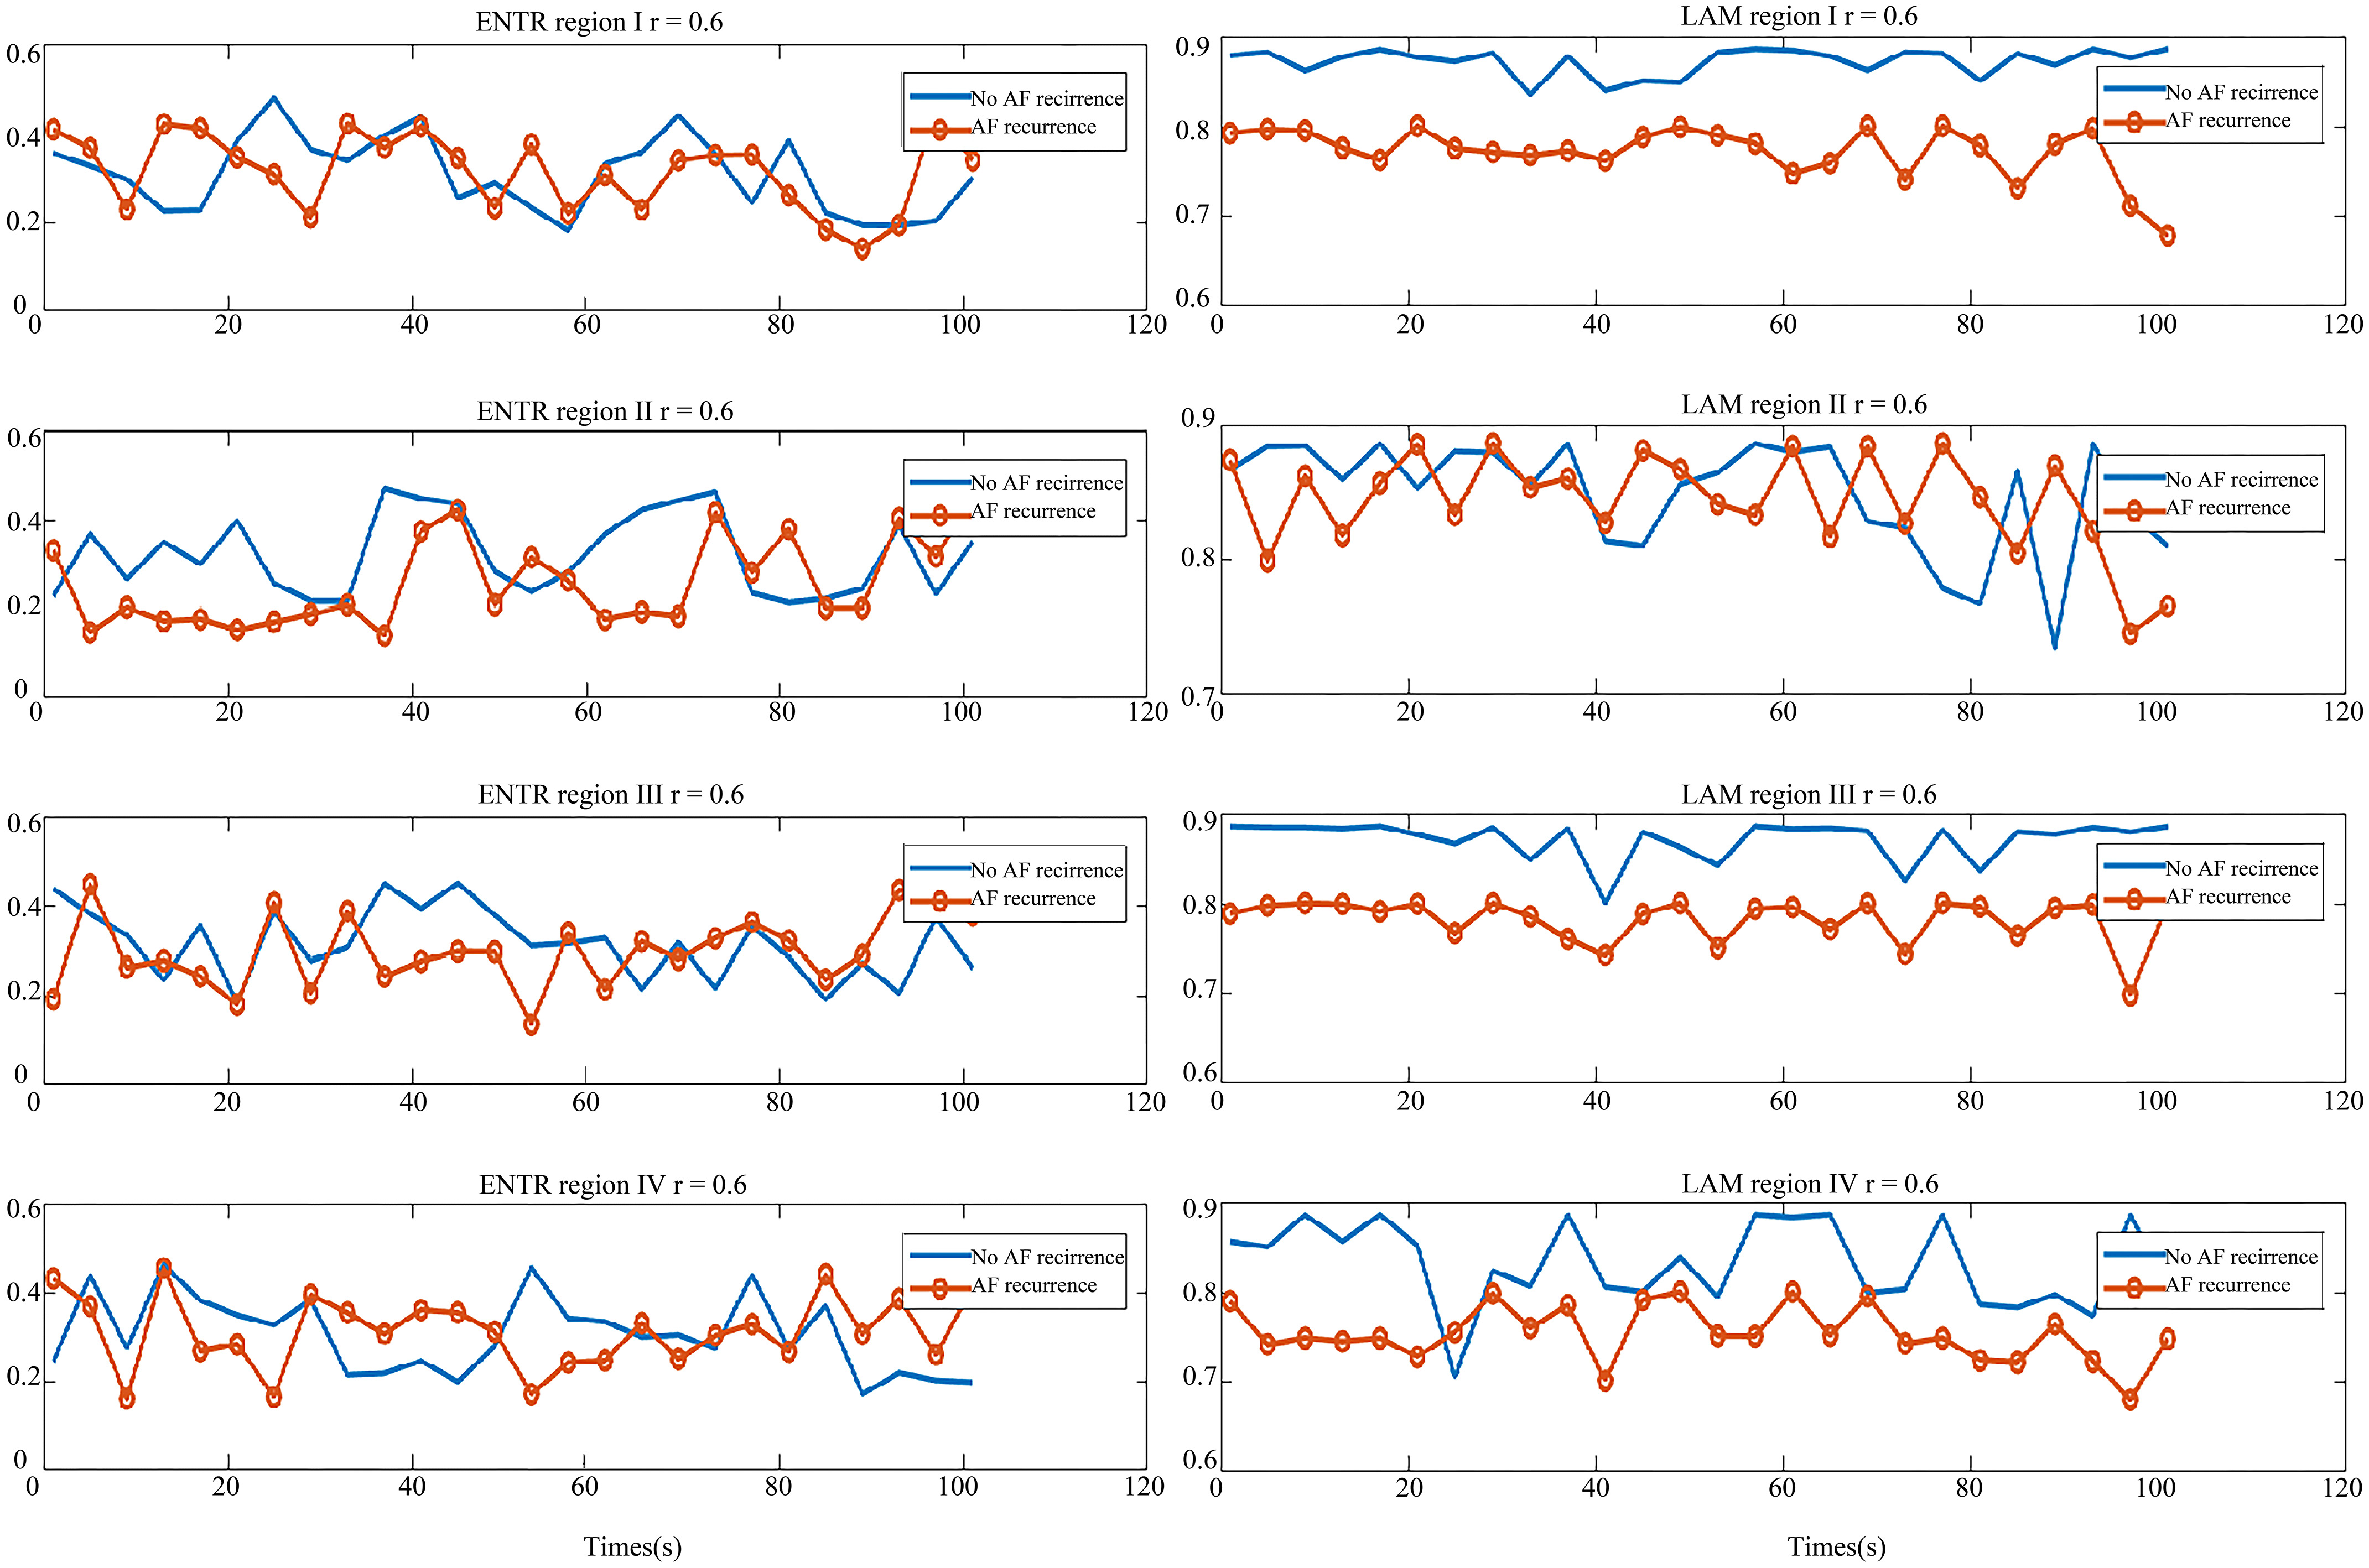
Table 3
Statistical analysis of REC and LAM in patients who had no recurrence of AF after ablation in four regions
| # | I | II | III | IV | |
|---|---|---|---|---|---|
| 5 | REC | 0.7246 | 0.7655 | 0.7746 | 0.7640 |
| LAM | 0.8433 | 0.8413 | 0.8358 | 0.8438 | |
| 6 | REC | 0.7690 | 0.7345 | 0.7725 | 0.7432 |
| LAM | 0.8074 | 0.8234 | 0.8131 | 0.8212 | |
| 7 | REC | 0.7453 | 0.7377 | 0.7861 | 0.7875 |
| LAM | 0.8354 | 0.8533 | 0.8226 | 0.8459 | |
| 8 | REC | 0.66963 | 0.6878 | 0.7263 | 0.6668 |
| LAM | 0.8746 | 0.8621 | 0.8523 | 0.8666 | |
| 9 | REC | 0.7152 | 0.5943 | 0.7269 | 0.5853 |
| LAM | 0.8429 | 0.8501 | 0.8340 | 0.8621 | |
| 10 | REC | 0.6923 | 0.6490 | 0.6955 | 0.7020 |
| LAM | 0.8646 | 0.8714 | 0.8749 | 0.8732 | |
| 11 | REC | 0.6584 | 0.6726 | 0.6851 | 0.6846 |
| LAM | 0.8697 | 0.8676 | 0.8673 | 0.8661 | |
| 12 | REC | 0.5929 | 0.5875 | 0.5794 | 0.6827 |
| LAM | 0.8709 | 0.8474 | 0.8744 | 0.8252 |
In addition, the statistical parameters of the REC and LAM for those two types patient are shown in Tables 2 and 3. ANOVA comparison of the parameters between groups indicates that both REC and LAM between AF recurrence group and non-AF recurrence group were significantly different with 95% confidence interval [REC, F(0.4559, 0.9600)
The dominant frequency (DF) analysis method in the previous study had shown that region I gets a better result because the electrodes in region I are closest to the heart and hence the potential is big enough [12]. There were no differences between the regions when analyzed in the same patient in this study. Our approach is not limited by this conclusion, because the recurrence complex network reveals the internal law of the atrial system that concerns with the relationship of system orbits over a short period of time.
Based on the above analysis, it can be assumed that, if a patient has a greater REC than the threshold of preoperative BSPMs, he might have a higher possibility of AF recurrence, after ablation. Hence, such patients need more close attention, both during the operation and post-operation. On the other hand, the patients with a smaller LAM than the threshold in preoperative BSPMs, will have a little possibility for the recurrence of AF. This rule can be used as a reference among the clinicians to predict the recurrence of AF. More BSPM data of the patients with clinical AF is needed to verify the rule and to select the appropriate threshold.
It is worth pointing that the previous study has shown that the atrial system with high ENTR and LAM values will be more likely for the occurrence of AF. But, for REC and DET, it is totally contrary, which means the greater value of REC and DET indicates the low possibility of AF [14]. This is different from the conclusion of this study. The reason is partly because the different signal that was employed in this study. The signal used in this study was from the body surface potential mapping signals instead of the epicardial signals used in the earlier study [14]. More importantly, we collected signals from patients with AF before surgery, rather than the sinus signals before the occurrence of AF. Finally, the subjects in this paper study included the patients with persistent AF with RHD or other heart diseases, while the literature study subject are Canine. A deeper interpretation is required with more experimentation and data analysis.
3.2Recurrence complex network analysis of 12-lead ECG obtained from BSPMs
The recurrence complex network analysis results of 12-lead ECG are displayed in Fig. 6. The quality of the signals was evaluated by the spectral concentration [12]. The parameters of the patient with AF recurrence are shown at the bottom in Fig. 9 and parameters of no-AF is shown at the top.
Figure 9.
Four parameters of AF recurrence and no-AF recurrence patients.
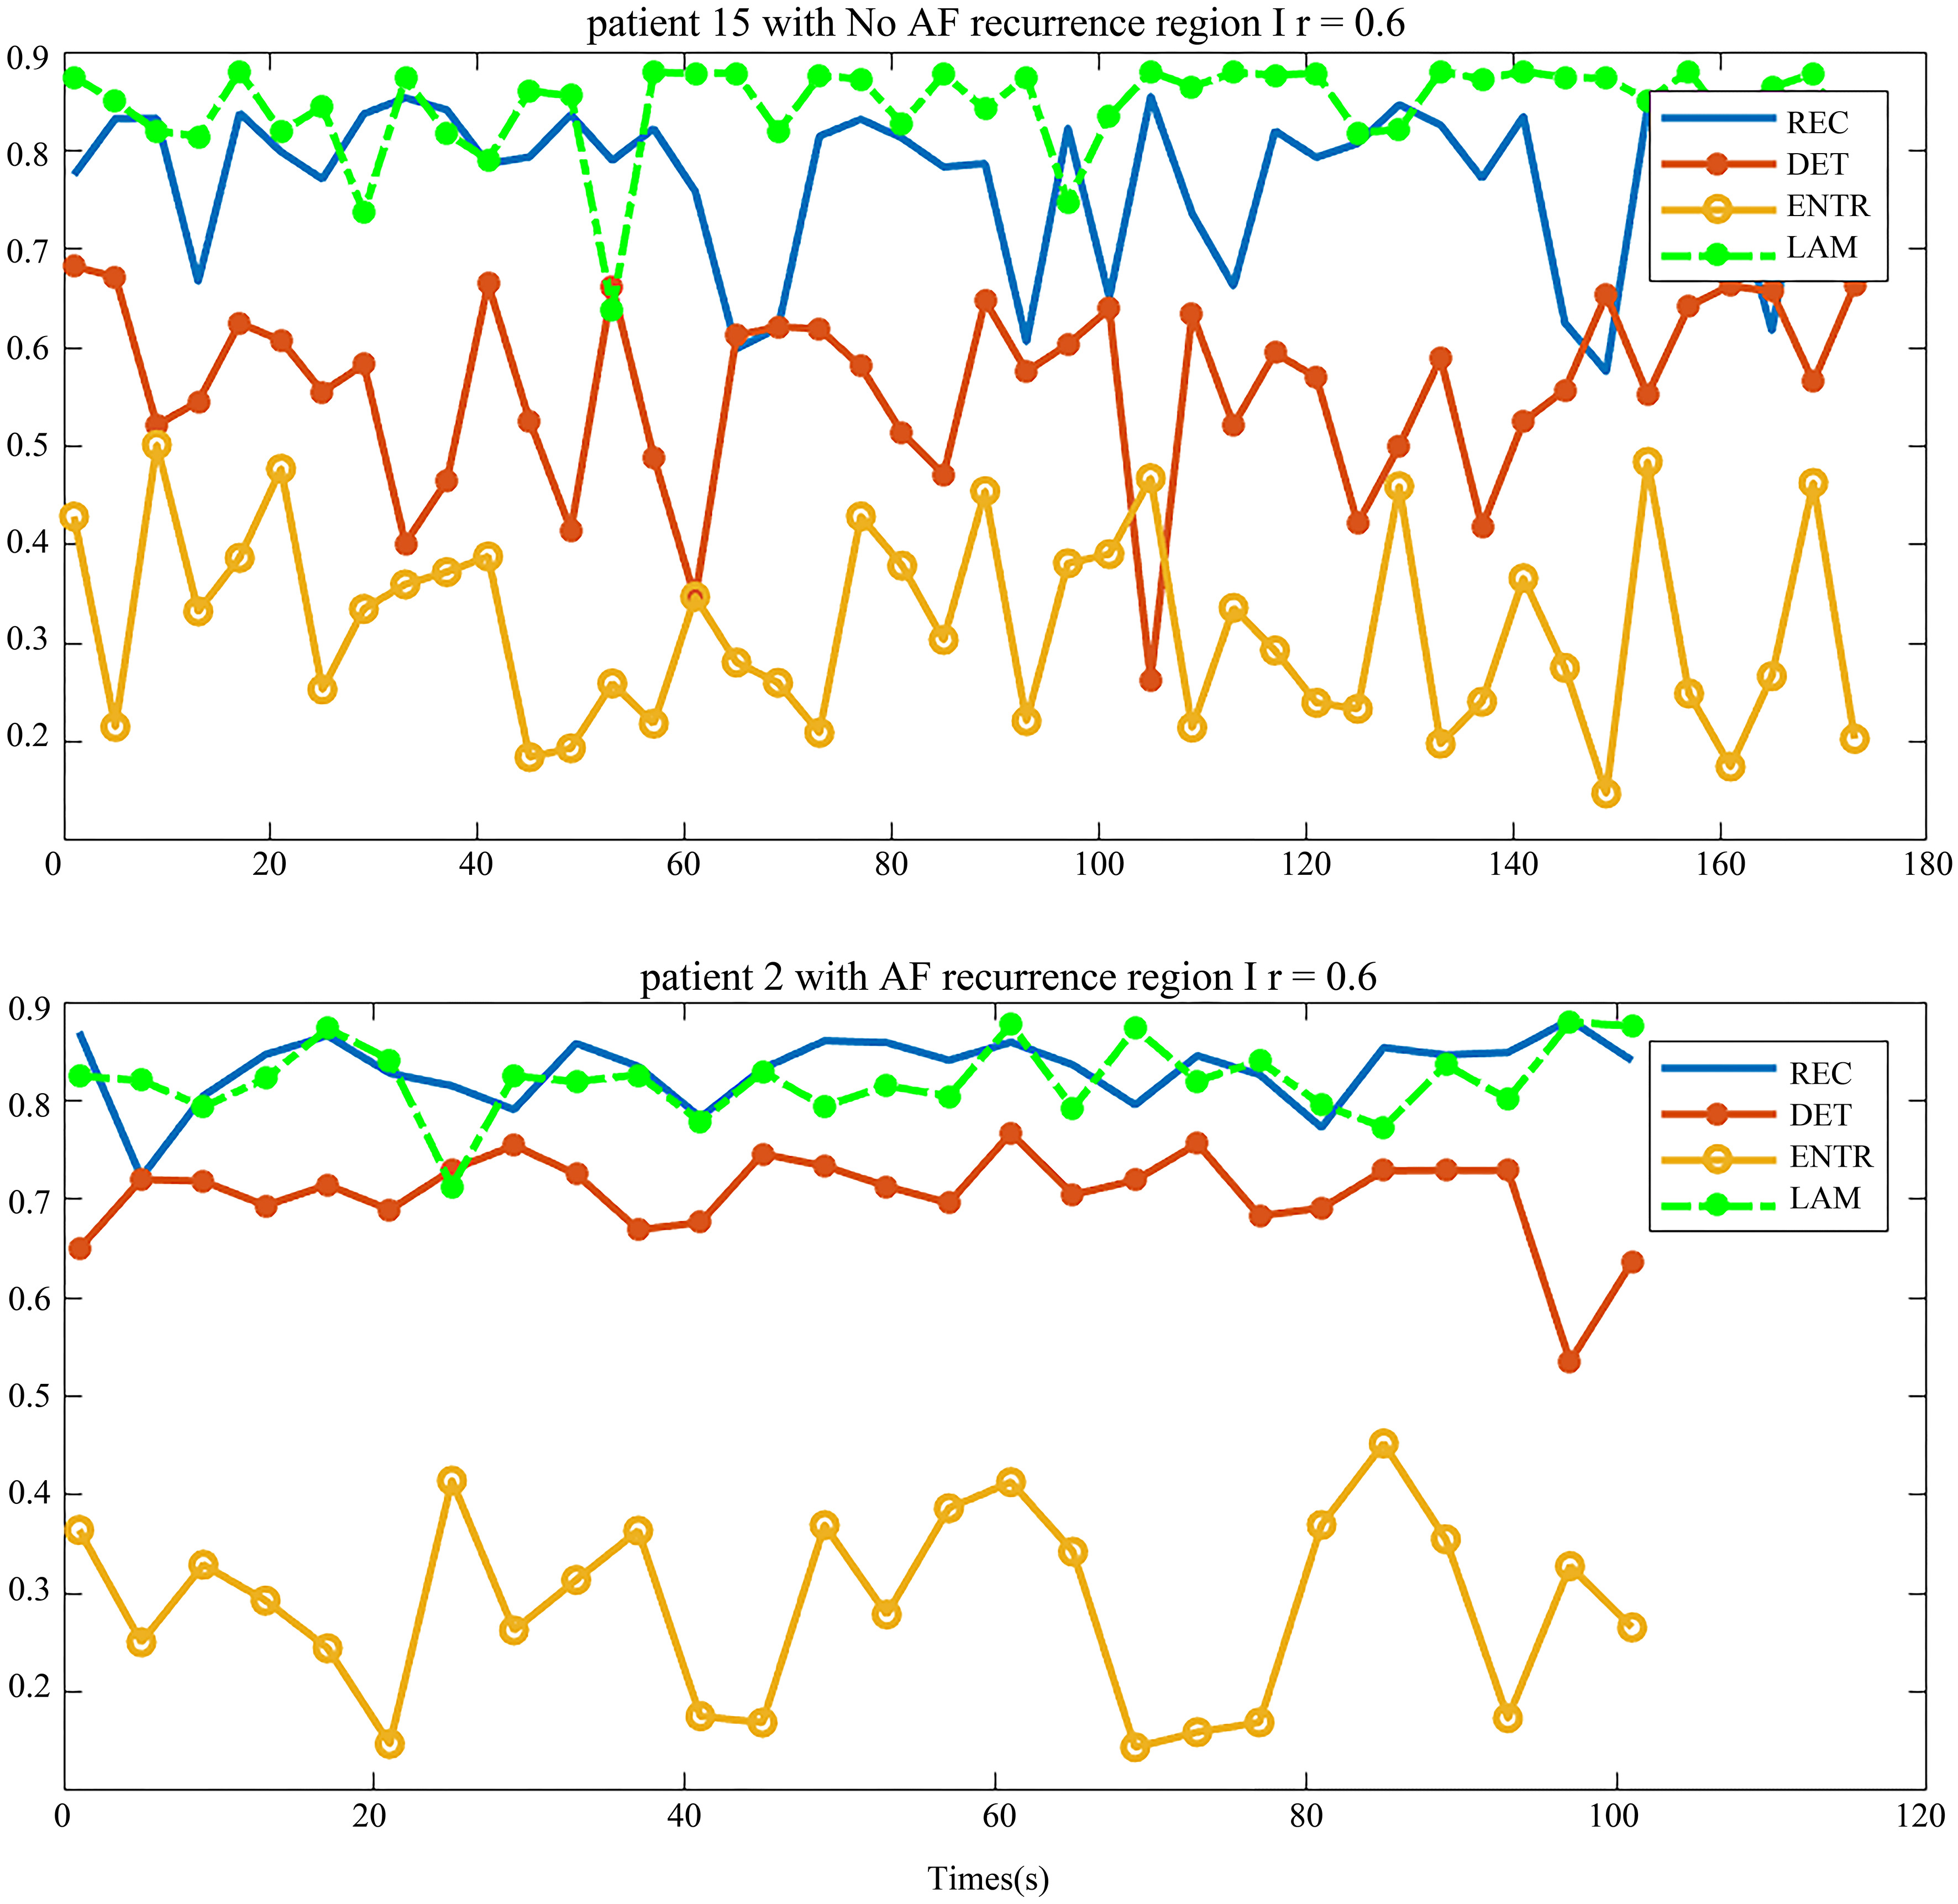
Compared to the parameters in the 12-lead ECG with the parameters from four regions of 128 leads BSPMs, the parameter distribution in a same type patient is similar. However, apart from DET that showed a little difference, the value distributions of REC, ENTR and LAM in two types of patients are similar. Thus, the AF recurrence prediction ability of BSPMs is better than that of the 12-lead ECG. This is due to the fact that the BSPMs contains much more potential propagation information. Therefore, the conventional ECG which merely contains the partial information of the anterior body surface is incomplete for predicting the recurrence of AF.
4.Conclusion
The recurrence complex network analysis method was applied into BSPMs for the prediction of AF recurrence. In patients with AF, whose preoperative BSPMs have higher REC and lower LAM, can have greater possibility of AF recurrence after surgery. Compared with the DF method, this method is insensitive to the lead position and it pays more attention to the relationship of the different leads which can reveal the inner law of the atrial system. Hence it performs better in the prediction of the AF recurrence. Nevertheless, more attention needs to be paid to obtain more data from the clinical scenario to confirm the results.
We also analyzed the 12-lead ECG by the same method, the results show that BSPMs have a potential to provide much more information and perform better in predicting the recurrence of AF than 12-lead ECG.
Acknowledgments
This research was supported by the National Natural Science Foundation of China (61071004, 60701002, 81371638 and 81671777), Shanghai Natural Science Foundation (16ZR1446800), the Shanghai Young Teachers Training Program for University (ZZJKYX15005) and the Shanghai Industrial-Academic-Research Program (CXYJKXY15002).
Conflict of interest
None to report.
References
[1] | Chugh SS, Blackshear JL, Shen WK, Hammill SC, Gersh BJ. Epidemiology and natural history of atrial fibrillation: clinical implications. Journal of the American College of Cardiology. (2001) ; 37: (2): 371-378. |
[2] | Rahman F, Kwan GF, Benjamin EJ. Global epidemiology of atrial fibrillation. Nature Reviews Cardiology. (2014) ; 11: : 639-654. |
[3] | Calkins H, Kuck KH, Cappato R, Brugada J, Camm AJ, Chen SA, et al. 2012 HRS/EHRA/ECAS expert consensus statement on catheter and surgical ablation of atrial fibrillation: recommendations for patient selection, procedural techniques, patient management and follow-up, definitions, endpoints, and research trial design. Journal of Interventional Cardiac Electrophysiology. (2012) ; 33: (2): 171-257. |
[4] | Fuster V, Rydén LE, Cannom DS, Crijns, HJ, Curtis AB, Ellenbogen KA, et al. 2011 ACCF/AHA/HRS focused updates incorporated into the ACC/AHA/ESC 2006 guidelines for the management of patients with atrial fibrillation: a report of the American College of Cardiology Foundation/American Heart Association task force on practice guidelines developed in partnership with the European Society of Cardiology and in collaboration with the European Heart Rhythm Association and the Heart Rhythm Society. Journal of the American College of Cardiology. (2011) ; 57: (11): e101-e198. |
[5] | Mathew ST, Patel J, Joseph S. Atrial fibrillation: mechanistic insights and treatment options. European Journal of Internal Medicine. (2009) ; 20: (7): 672-681. |
[6] | Schoonderwoerd BA, Van Gelder IC, Van Veldhuisen DJ, Van den Berg MP, Crijns HJ. Electrical and structural remodeling: role in the genesis and maintenance of atrial fibrillation. Progress in Cardiovascular Diseases. (2005) ; 48: (3): 153-168. |
[7] | Lovett EG, Ropella KM. Time-frequency coherence analysis of atrial fibrillation termination during procainamide administration Annals. of Biomedical Engineering. (1997) ; 25: (6): 975-984. |
[8] | Huang C, Ye S, Chen H, Li D, He F, Tu Y. A novel method for detection of the transition between atrial fibrillation and sinus Rhythm. IEEE Transactions on Biomedical Engineering. (2011) ; 58: (4): 1113-1119. |
[9] | Chiarugi F, Varanini M, Cantini F, Conforti F, Vrouchos G. Noninvasive ECG as a tool for predicting termination of paroxysmal atrial fibrillatio. IEEE Transactions on Biomedical Engineering. (2007) ; 54: (8): 1399-1406. |
[10] | Censi F, Barbaro V, Bartolini P, Calcagnini G, Cerutti S. Non-linear dynamics of atrial rate during atrial fibrillation assessed by recurrence plot analysis. Computers in Cardiology: Cleveland; (1998) . |
[11] | Shao ZG. Network analysis of human heartbeat dynamics. Applied Physics Letters. (2010) ; 96: (7): 073703. |
[12] | Zhang Q, Yang C, Wang D, Li Z, Wu Z, Zhu X, Chen Y. Atrial Fibrillation Prediction Based on the Rhythm Analysis of Body Surface Potential Mapping Signals. Journal of Medical Imaging and Health Informatics. (2018) ; 8: (1): 145-150. |
[13] | Bai B, Wang Y, Yang C. Predicting atrial fibrillation inducibility in a canine model by multi-threshold spectra of the recurrence complex network. Medical Engineering & Physics. (2013) ; 35: (5): 668-675. |
[14] | Bai B, Wang Y, Yang C. Analyzing atrial electricity activity dynamical structure by recurrence complex network. 4th International Congress on Image and Signal Processing: Shanghai; (2011) . |
[15] | Borgstadt JA, Zinn MR, Ferrier NJ. Multi-modal localization algorithm for catheter interventions. IEEE International Conference on Robotics and Automation: Seattle; (2015) . |
[16] | Stephens DN, Foiret J, Lucero S, Ferrara KW, Shivkumar K, Yakub PK. HIFU Power Network Optimization for Catheter Based Cardiac Interventions. IEEE International Ultrasonics Symposium: Tours; (2016) . |
[17] | Liu C, Eggen MD, Swingen CM, Iaizzo PA, He B. Noninvasive mapping of transmural potentials during activation in swine hearts from body surface electrocardiograms. IEEE Transactions on Medical Imaging. (2008) ; 31: (9): 1777-1785. |
[18] | Modre R, Tilg B, Fischer G, Wach P. Noninvasive myocardial activation time imaging: a novel inverse algorithm applied to clinical ECG mapping data. IEEE Transactions on Biomedical Engineering. (2002) ; 49: (10): 1153-1161. |
[19] | Ramanathan C, Ghanem RN, Jia P, Ryu K, Rudy Y. Noninvasive electrocardiographic imaging for cardiac electrophysiology and arrhythmia. Nature Medicine. (2004) ; 10: (4): 422-428. |
[20] | Han C, Liu Z, Zhang X, Pogwizd S, He B. Noninvasive three-dimensional cardiac activation imaging from body surface potential maps: a computational and experimental study on a rabbit model. IEEE Transactions on Medical Imaging. (2008) ; 27: (11): 1622-1630. |
[21] | Zhou C, Zemanová L, Zamora G, Hilgetag CC, Kurths J. Hierarchical organization unveiled by functional connectivity in complex brain networks. Physical Review Letters. (2006) ; 97: (23): 238103. |
[22] | Donges JF, Zou Y, Marwan N, Kurths J. Complex networks in climate dynamics. The European Physical Journal Special Topics. (2009) ; 174: (1): 157-179. |
[23] | Dunne JA, Williams RJ, Martinez ND. Food-web structure and network theory: the role of connectance and size. Proceedings of the National Academy of Sciences of the United States of America. (2002) ; 99: (20): 12917-12922. |
[24] | Donner RV, Zou Y, Donges JF, Marwan N, Kurths J. Recurrence networks – a novel paradigm for nonlinear time series analysis. New Journal of Physics. (2010) ; 12: : 033025. |
[25] | Olyaee MH, Yaghoubi A, Yaghoobi M. Predicting protein structural classes based on complex networks and recurrence analysis. Journal of Theoretical Biology. (2016) ; 404: : 375-382. |
[26] | Donner RV, Small M, Dongers JF, Marwan N, Zou Y, Xiang R, Kurths J. Recurrence-based time series analysis by means of complex network methods. International Journal of Bifurcation and Chaos. (2011) ; 21: (4): 1019-1046. |
[27] | Marwan N, Donges JF, Zou Y, Donner RV, Kurths J. Complex network approach for recurrence analysis of time series. Physics Letters A. (2009) ; 373: (46): 4246-4254. |
[28] | Takens F. Detecting strange attractors in turbulence. Lecture Notes in Mathematics. (1981) ; 898: : 366-381. |
[29] | Wang D, Yang C. Research on f wave extraction methods of body surface potential mapping recordings from patients with atrial fibrillation. Chinese Journal of Scientific Instrument. (2016) ; 37: (10): 2359-2365. |


