
Experimental study on healthy volunteers based on magnetic induction brain edema monitoring system
Abstract
BACKGROUND:
Cerebral edema is a common secondary disease after stroke. It is very important to realize real-time continuous monitoring of cerebral edema for stroke patients.
OBJECTIVE:
A non-contact magnetic induction phase shift (MIPS) detection system is used to monitor the change of global brain electrical conductivity during cerebral edema.
METHODS:
In order to verify the feasibility of this system monitoring, we carry out salt solution simulation experiments and healthy people breath holding experiments. As a comparison of later clinical experiments, 13 young healthy volunteers aged 22–35 are selected for this study to carry out a 10 minute/time monitoring experiment.
RESULTS:
It is found that the MIPS values measured by the salt solution of edema and the salt solution of bleeding are significantly different. The results show that the MIPS value of healthy young people is in a stable state with an MIPS mean value of 1.106 (
CONCLUSIONS:
We preliminarily verify that the system can be used for cerebral edema monitoring.
1.Introduction
Cerebral edema is a common secondary disease after stroke. It can increase the brain volume, cause and aggravate the increase in intracranial pressure, even lead to brain displacement and brain hernia, and eventually lead to death of the patient. In addition, there is evidence that cerebral edema is an independent predictor of prognosis in stroke patients [1, 2]. Therefore, the real-time continuous monitoring of cerebral edema plays a very important role in clinical observation condition, guiding treatment, judging the timing of surgery and evaluating prognosis of patients with brain diseases.
At present, cerebral edema monitoring technology is divided into invasive and non-invasive methods. Invasive method such as intracranial pressure monitoring [3] can monitor edema changes in real time, but it causes discomfort to patients and easily lead to complications such as bleeding and infection [4]. Non-invasive methods are mainly PET, CT, MRI and other imaging methods. These methods can obtain detailed information about edema development, but their equipment is bulky and irremovable with low time resolution, and cannot monitor bedside in real time, which may delay diagnosis and surgical decision [5]. Transcranial Doppler, Near Infrared Spectroscopy and Bioelectrical Impedance can also be used as non-invasive methods to evaluate cerebral edema, but they are not accurate and real-time compared with traditional invasive methods [6, 7, 8].
Magnetic induction phase shifting (MIPS) technique is a new method of measuring the conductivity of intracranial tissues, which has the advantages of non-invasiveness, non-contact, strong penetrability, and portability. The research basis of this method comes from the electromagnetic induction detection technology of biological tissue [9]. In 1993, Netz et al. first used magnetic induction method to study cerebral edema [10]. In 2011 Griffiths and others further improved MIPS detection theory [9]. Then Gonzalez et al verified the correlation between phase shift, frequency and edema volume based on animal models. They found that when the detection frequency is higher than 1 MHz, the phase shift increases [11, 12] with the increase in frequency and solution volume. In 2013, the team monitored 46 healthy volunteers and 8 cerebral edema patients based on a volume electromagnetic phase shift (VEPS) medical diagnostic equipment. The results show that the instrument can distinguish between healthy volunteers and patients in the 26 MHz–39 MHz band, and between edema patients and hematoma patients in 153 MHz–166 MHz band [13]. In 2018, a volumetric impedance phase shift spectroscopy (VIPS) device was used to detect stroke in clinical, but neither using for edema or for monitoring [14].
The main objective of this study is to provide a control for clinical experiments and select 13 healthy young volunteers for real-time MIPS monitoring. The research is based on an MIPS monitoring system with non-contact, high sensitivity and good stability. The feasibility of using MIPS in edema monitoring and real-time human body monitoring is verified respectively through physical experiments and human breath holding experiments. The results show that the system can be used to monitor the conductivity changes of human brain. Through long-term monitoring, the MIPS value of healthy young people has not changed significantly, which indicates that, the brain conductivity of healthy young people remains stable. As a preliminary analysis, this article finally chooses a patient with subarachnoid hemorrhage to conduct a monitoring experiment. Compared with healthy volunteers, the MIPS value of the patient fluctuates more greatly and is related to the course of the disease. MIPS increases when edema occurs and reaches the maximum at the peak of edema.
2.Material and methods
2.1Magnetic induction detection principles
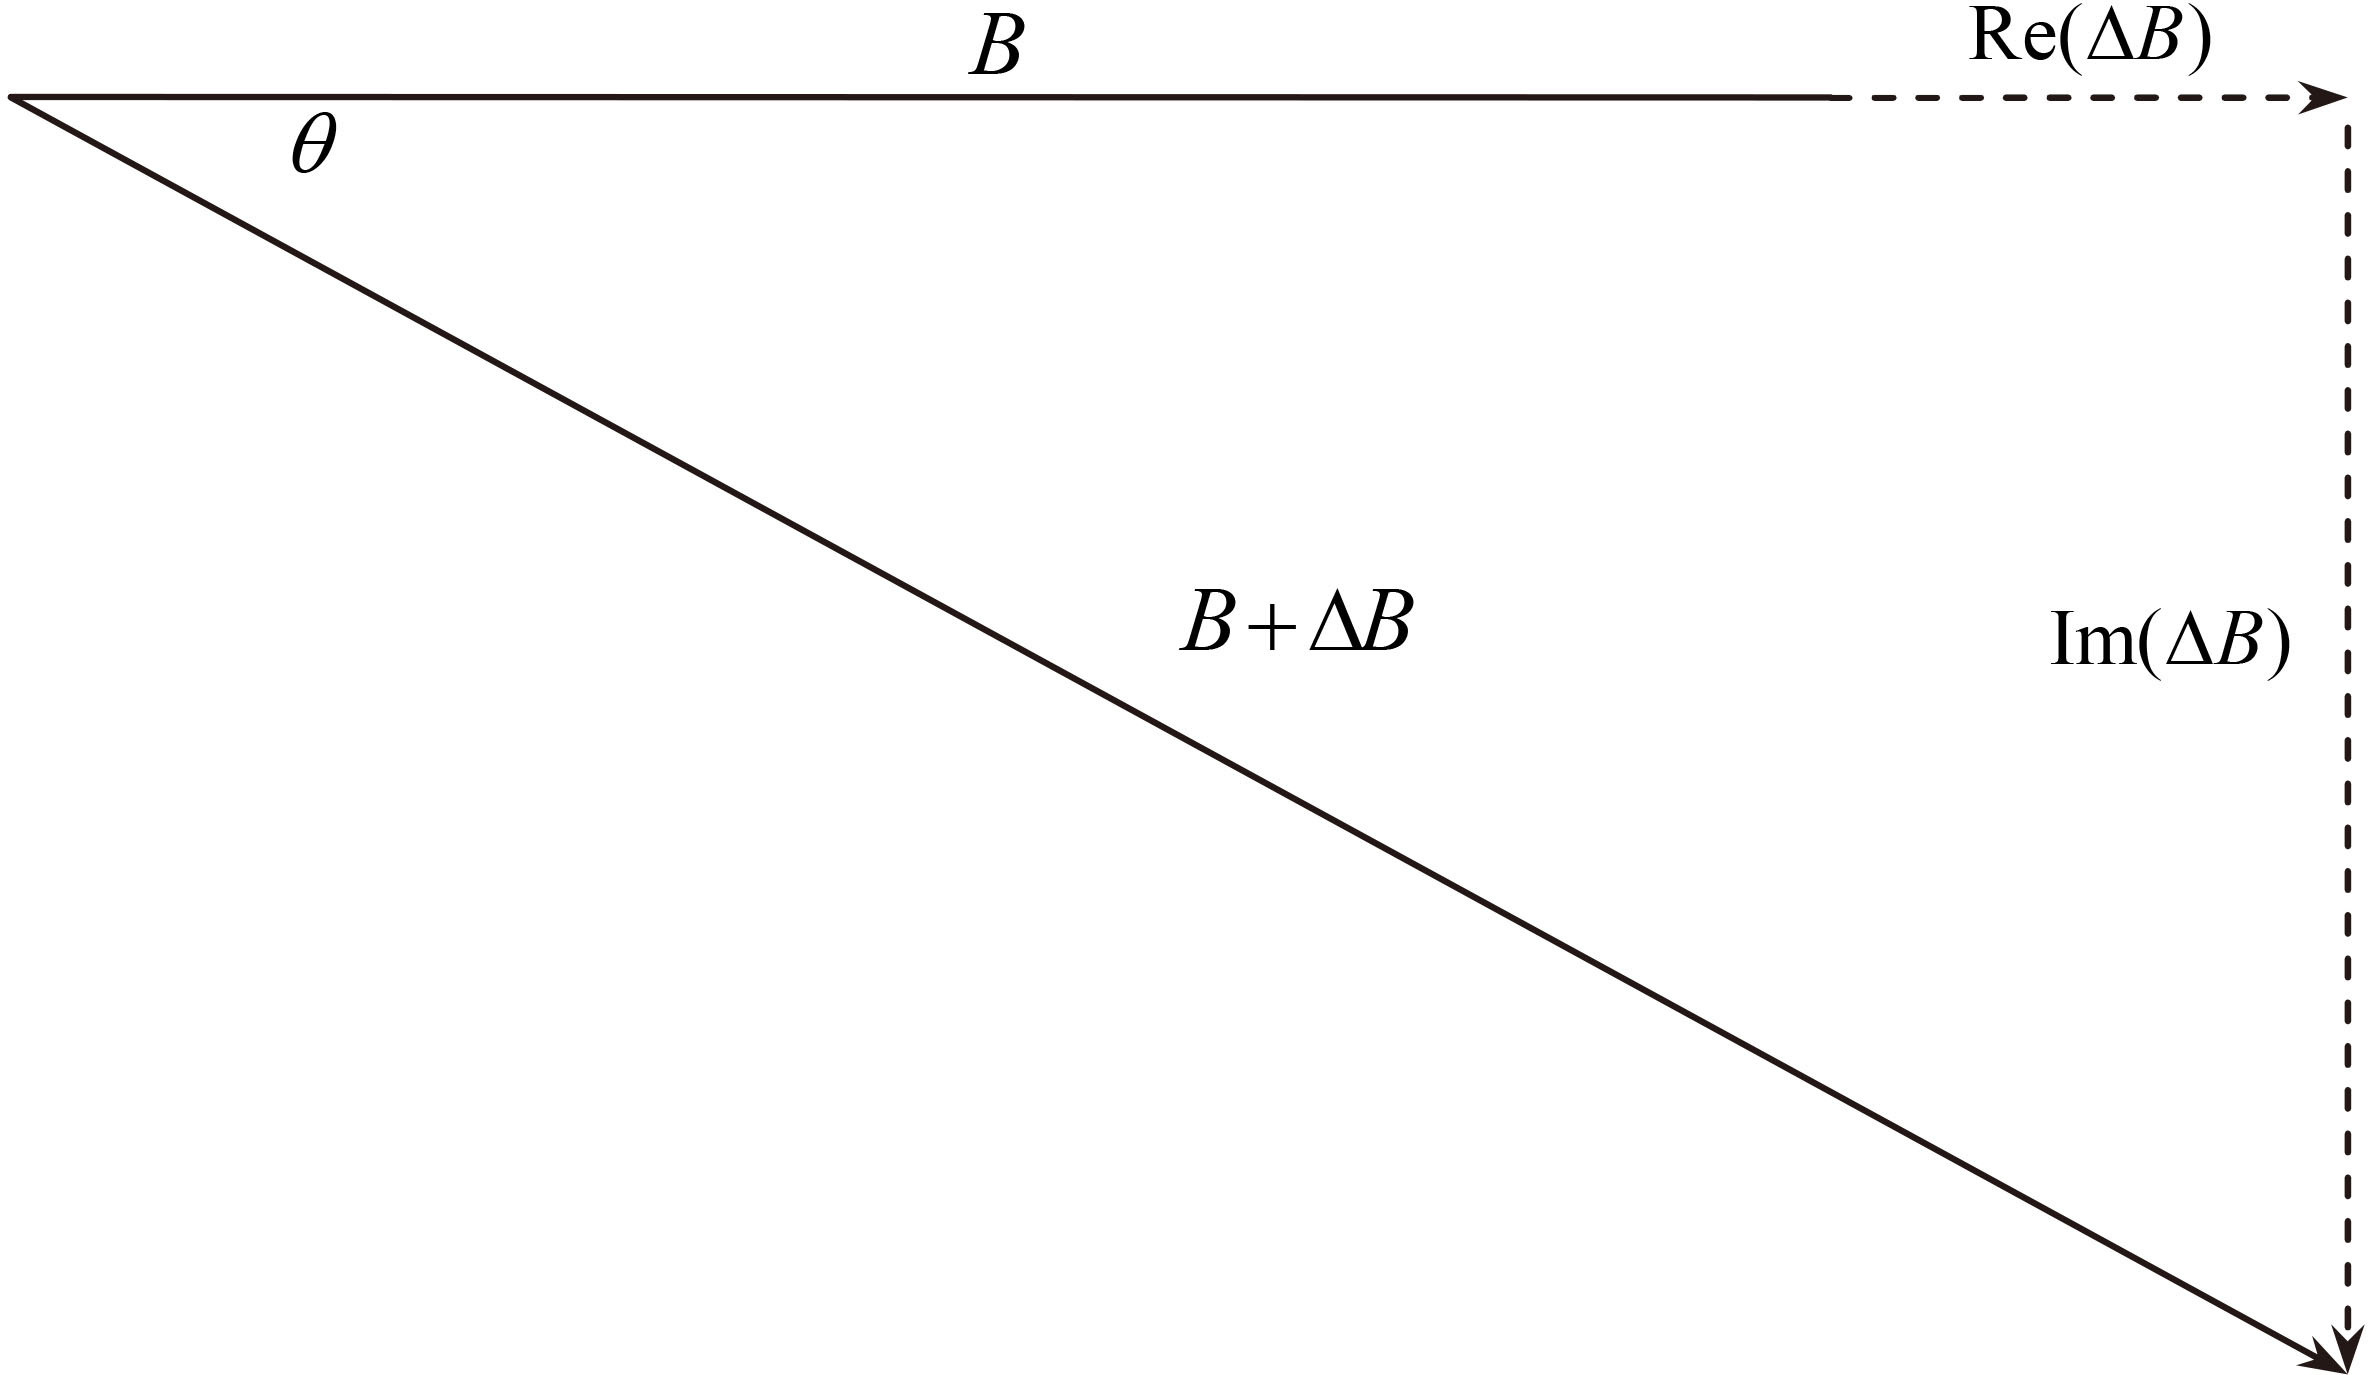
Cerebral edema detection system is based on the following magnetic induction theory: human body as conductor generates eddy current and induction field under the action of high frequency main magnetic field
where
Figure 1.
The vector relationship of induction field and main field.
2.2System structure and parameters
The detection system includes four parts: a detection sensor including a detection coil and an excitation coil; the National Instruments (NI) PXI-based system including a signal generator card and an acquisition card; a power amplifier; a phase discrimination and display platform based on LabView. The system structure is shown in Fig. 2.
Figure 2.
Schematic diagram of detection system.
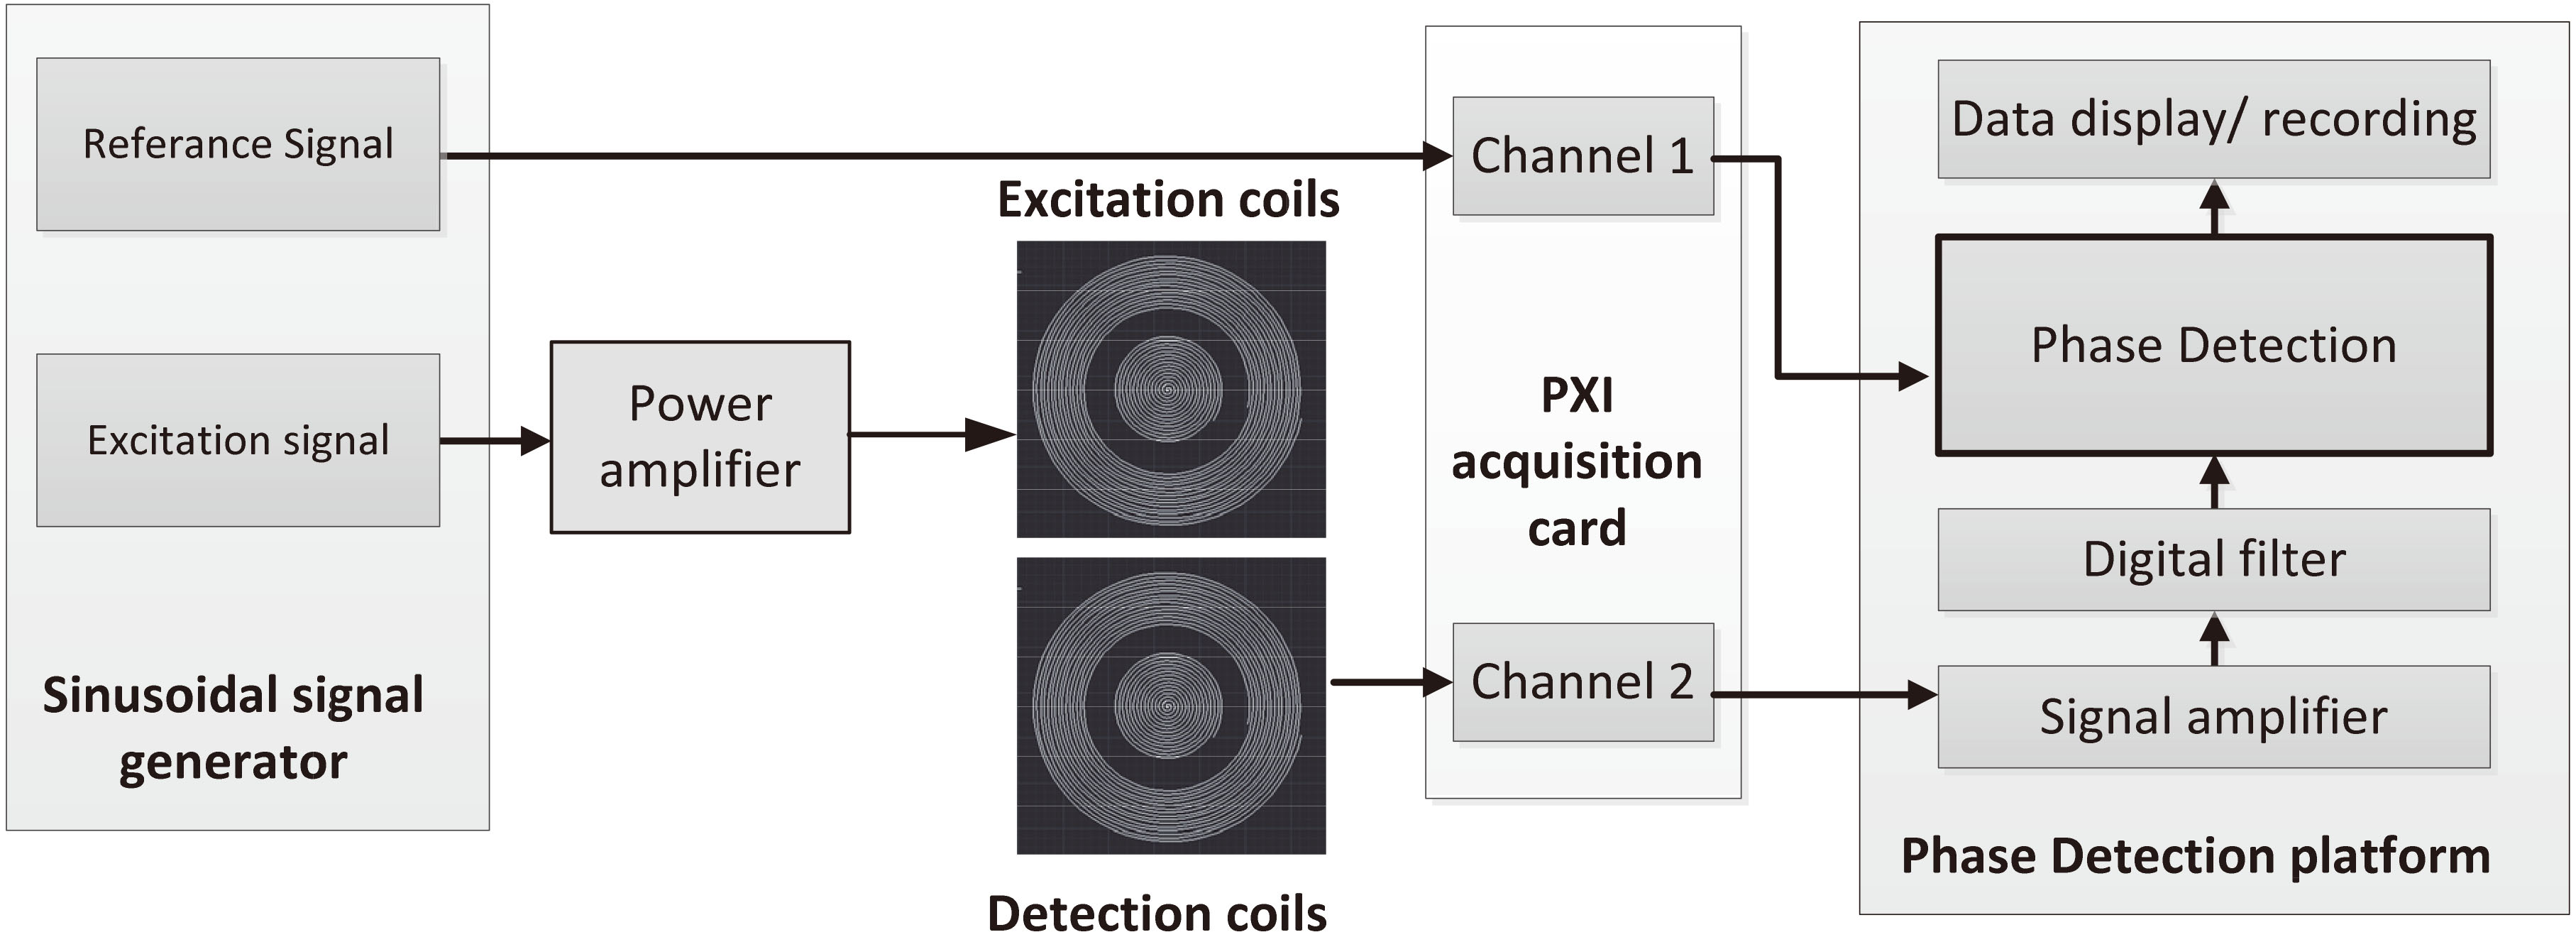
The signal generator generates two sinusoidal signals of the same frequency, one as an excitation signal and the other as a reference signal. The reference signal is directly sent to the phase discrimination platform through the acquisition card. The excitation signal is amplified by the power amplifier and sent to the excitation coil to generate the main magnetic field. The change of the secondary magnetic field caused by the measured object in the main magnetic field is obtained by the detection coil and also transmitted to the acquisition card. The phase discrimination platform combines the reference signal and the detection signal to obtain the phase shift value.
The sampling frequency of the detection system is 200 MHz and the multiple of amplifier on PXI-based system is 100. In LabVIEW software, Fast Fourier transforms phase detection algorithm is used to calculate the phase shift using 400,000 sampling points. The frequency of excitation signal is set to 15.1 MHz; the output signal amplitude of the power amplifier is 5 V
2.3Sensor design for human trials
At present, there are few sensors suitable for practical clinical application and operation. Since patients usually lie on their back after surgery or when they are unconscious, the research team has designed a new type of head-mounted sensor based on Archimedes coil which is comfortable and convenient to wear. Considering the physiological structure of the skull, the center of the sensor is placed at the H – shaped seam of the skull.
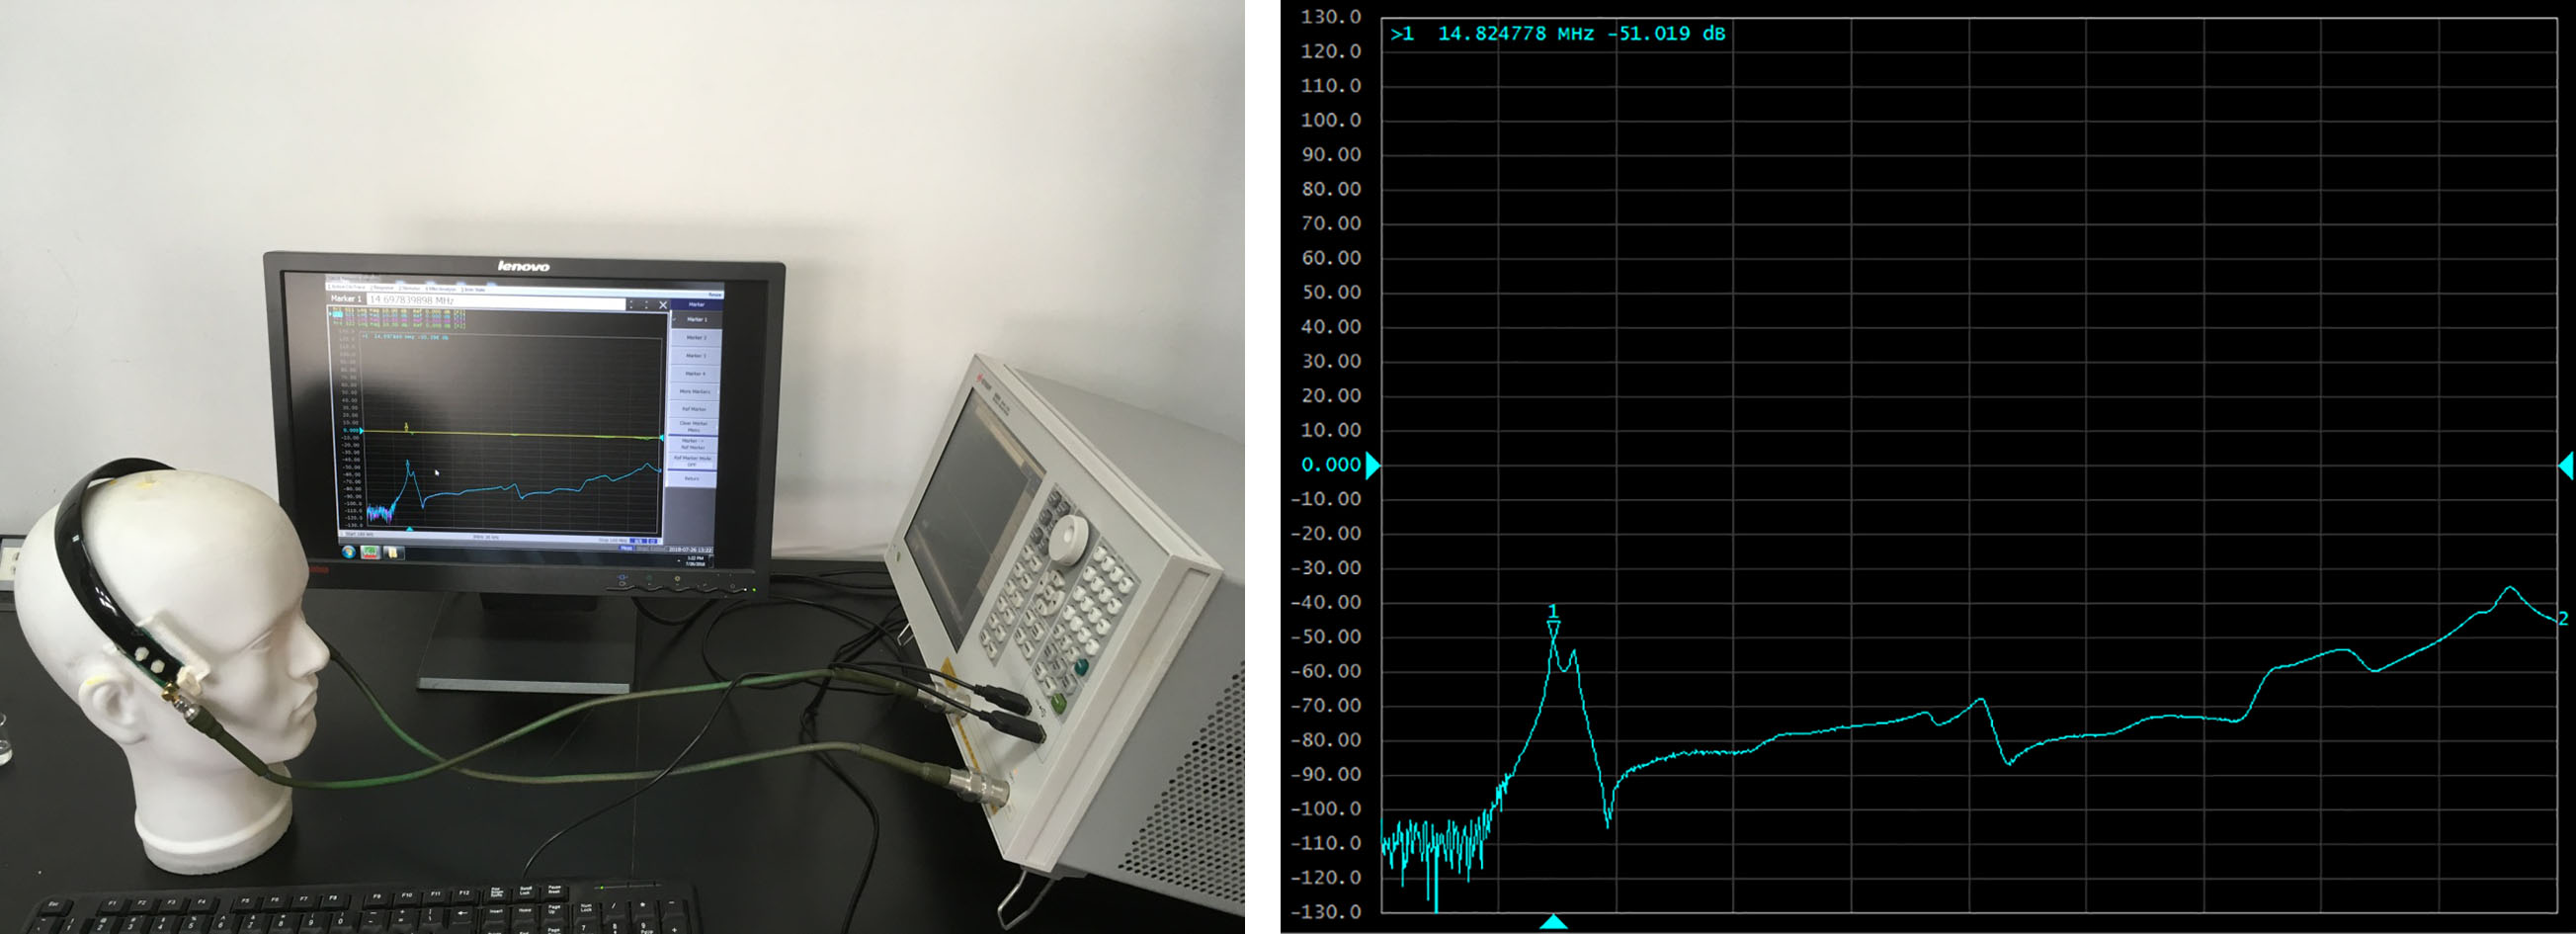
The sensor consists of two identical coils placed on both sides of the skull. If necessary, any coil can be used as an excitation coil, while the other coil can be used as a detection coil. Using the vector network analyzer to detect the working frequency of the sensor, it is found that the resonant frequency band of the sensor is 14–16 MHz (Fig. 3). In this frequency band, the sensor has the highest measurement sensitivity. Therefore, 15.1 MHz is selected as the excitation signal frequency of this experiment.
Figure 3.
The scanning frequency test of the sensor.
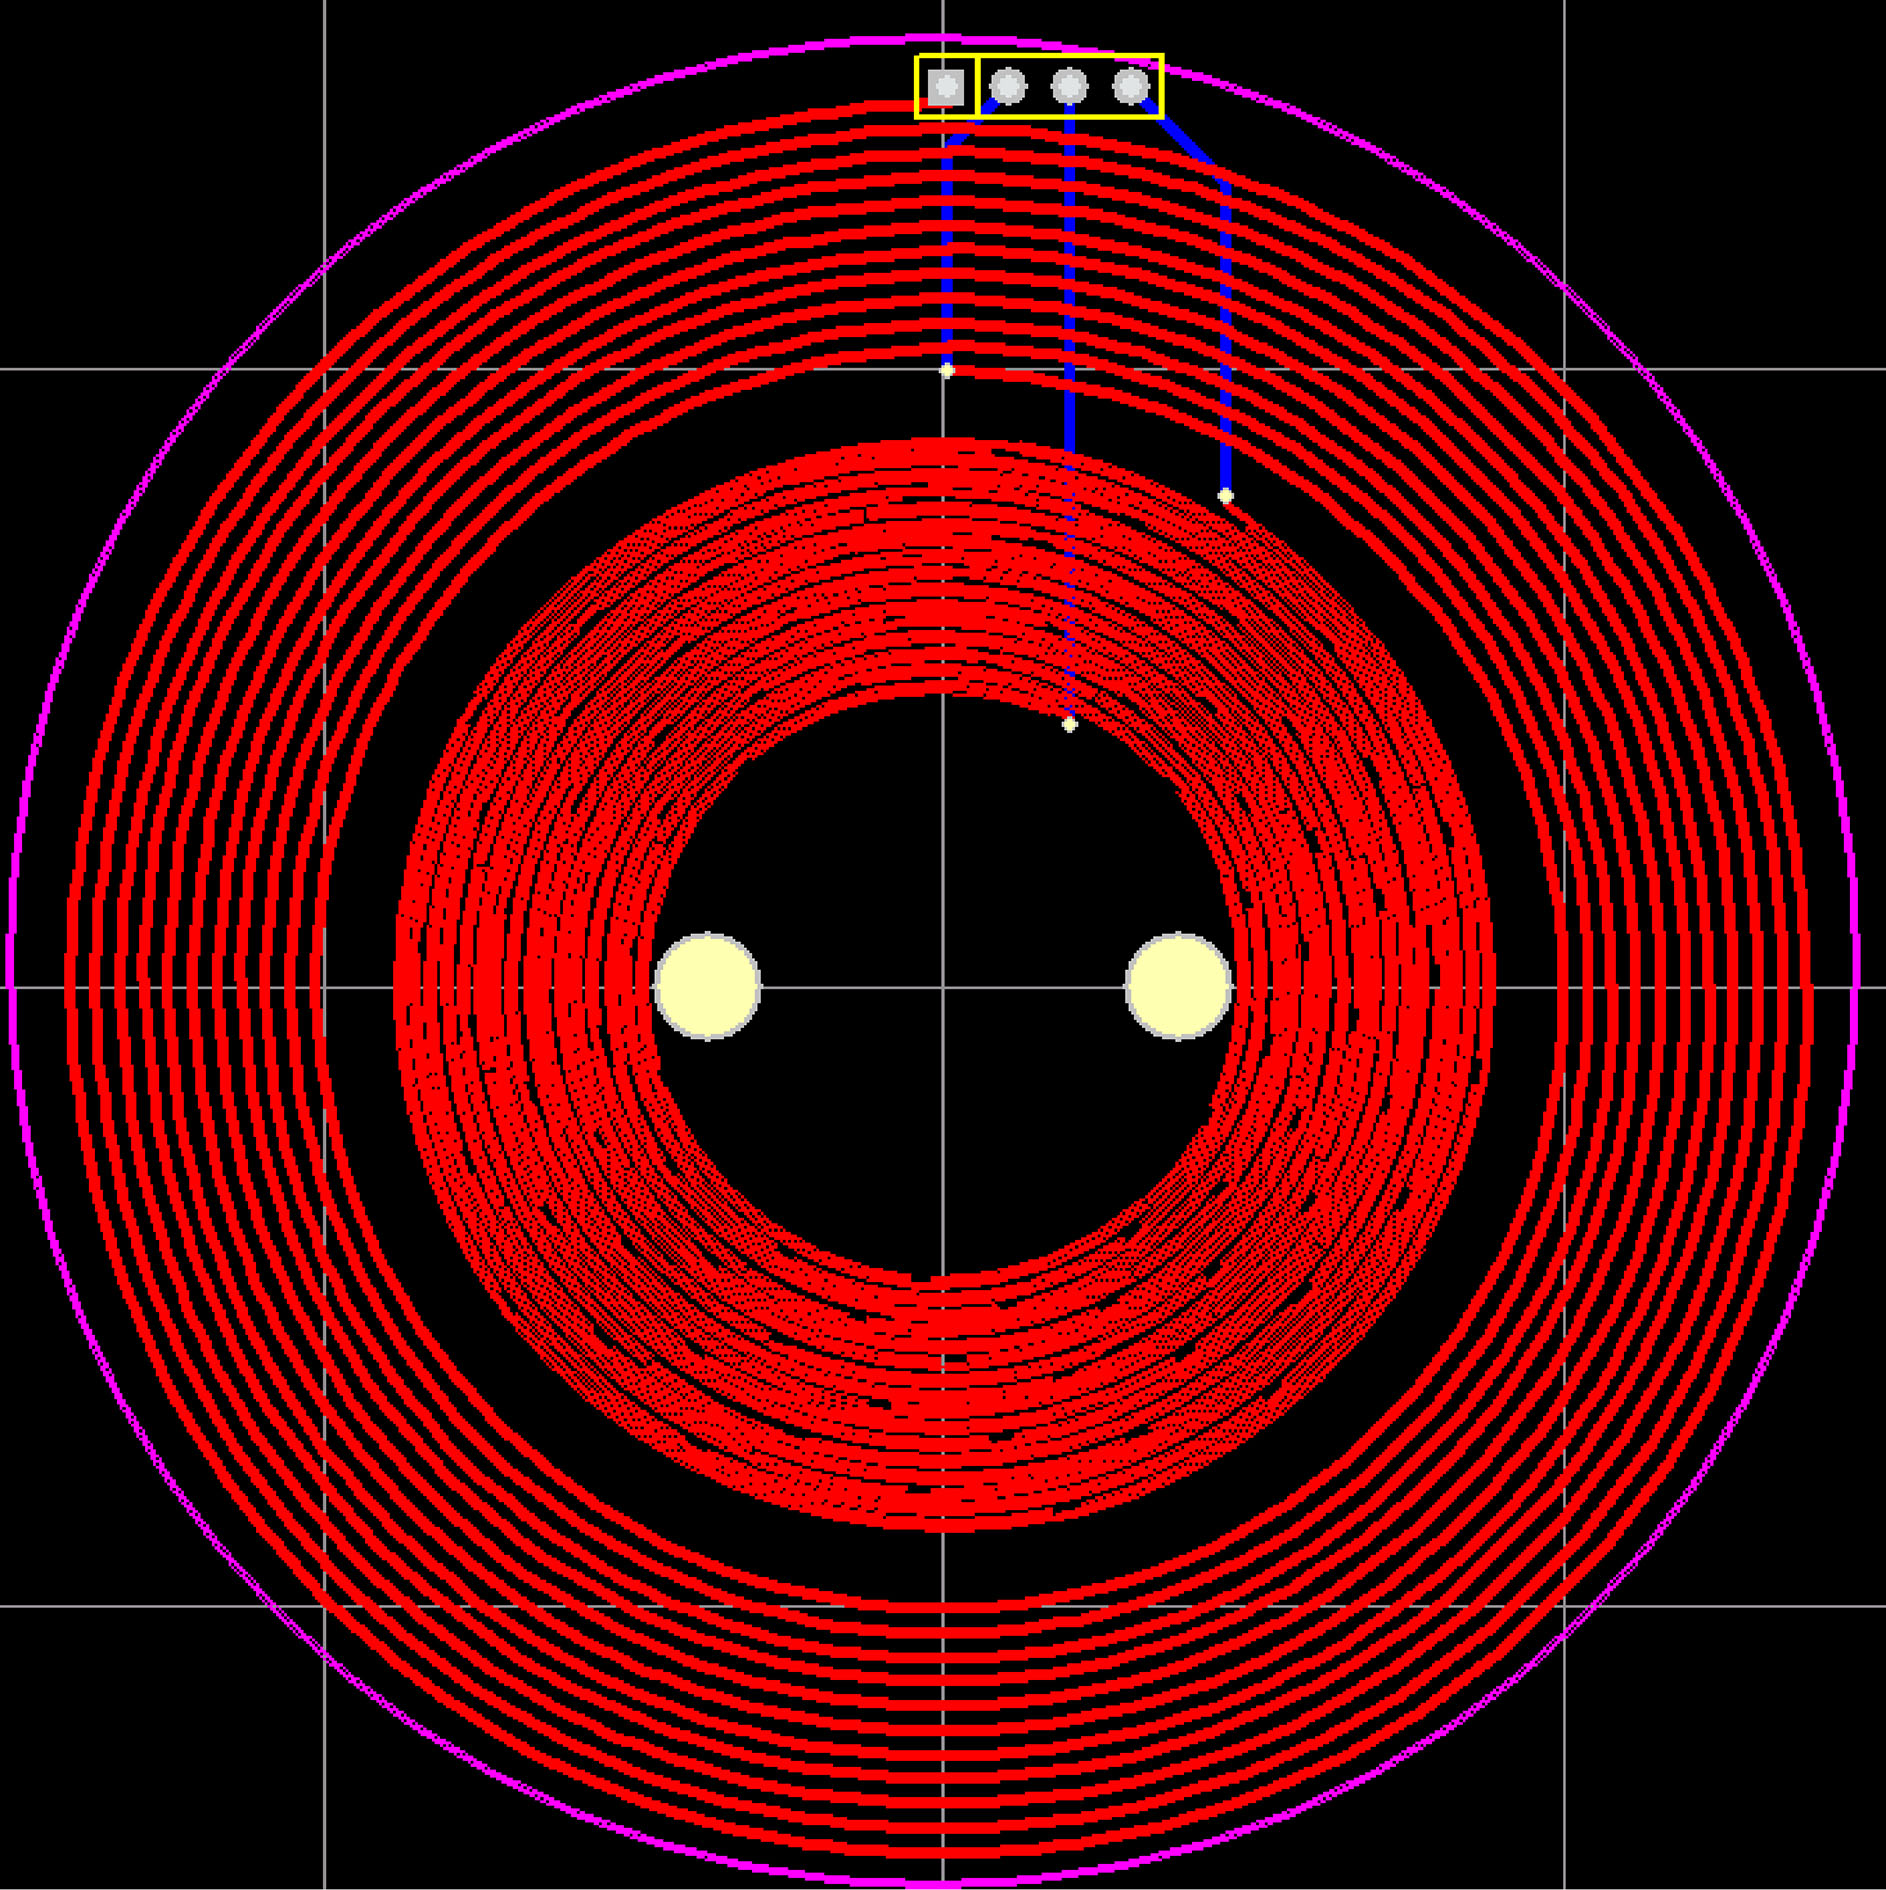
The coil of the sensor is made of printed circuit board and consists of coaxial coplanar outer excitation coil and inner detection coil. The coil structure is shown in Fig. 4. The exciting coil is 11 turns, the wire diameter is 0.5 mm, and the wire spacing is 0.5 mm; the detection coil is 16 turns, the wire diameter is 0.3 mm, and the wire spacing is 0.3 mm. The two ends of the excitation coil are connected to one output of the signal generator through wires. The two ends of the detection coil are connected to one input of acquisition card. The connecting wires are not connected to the coils when passing through the coils.
Figure 4.
The excitation and detection coils.
2.4Experimental design
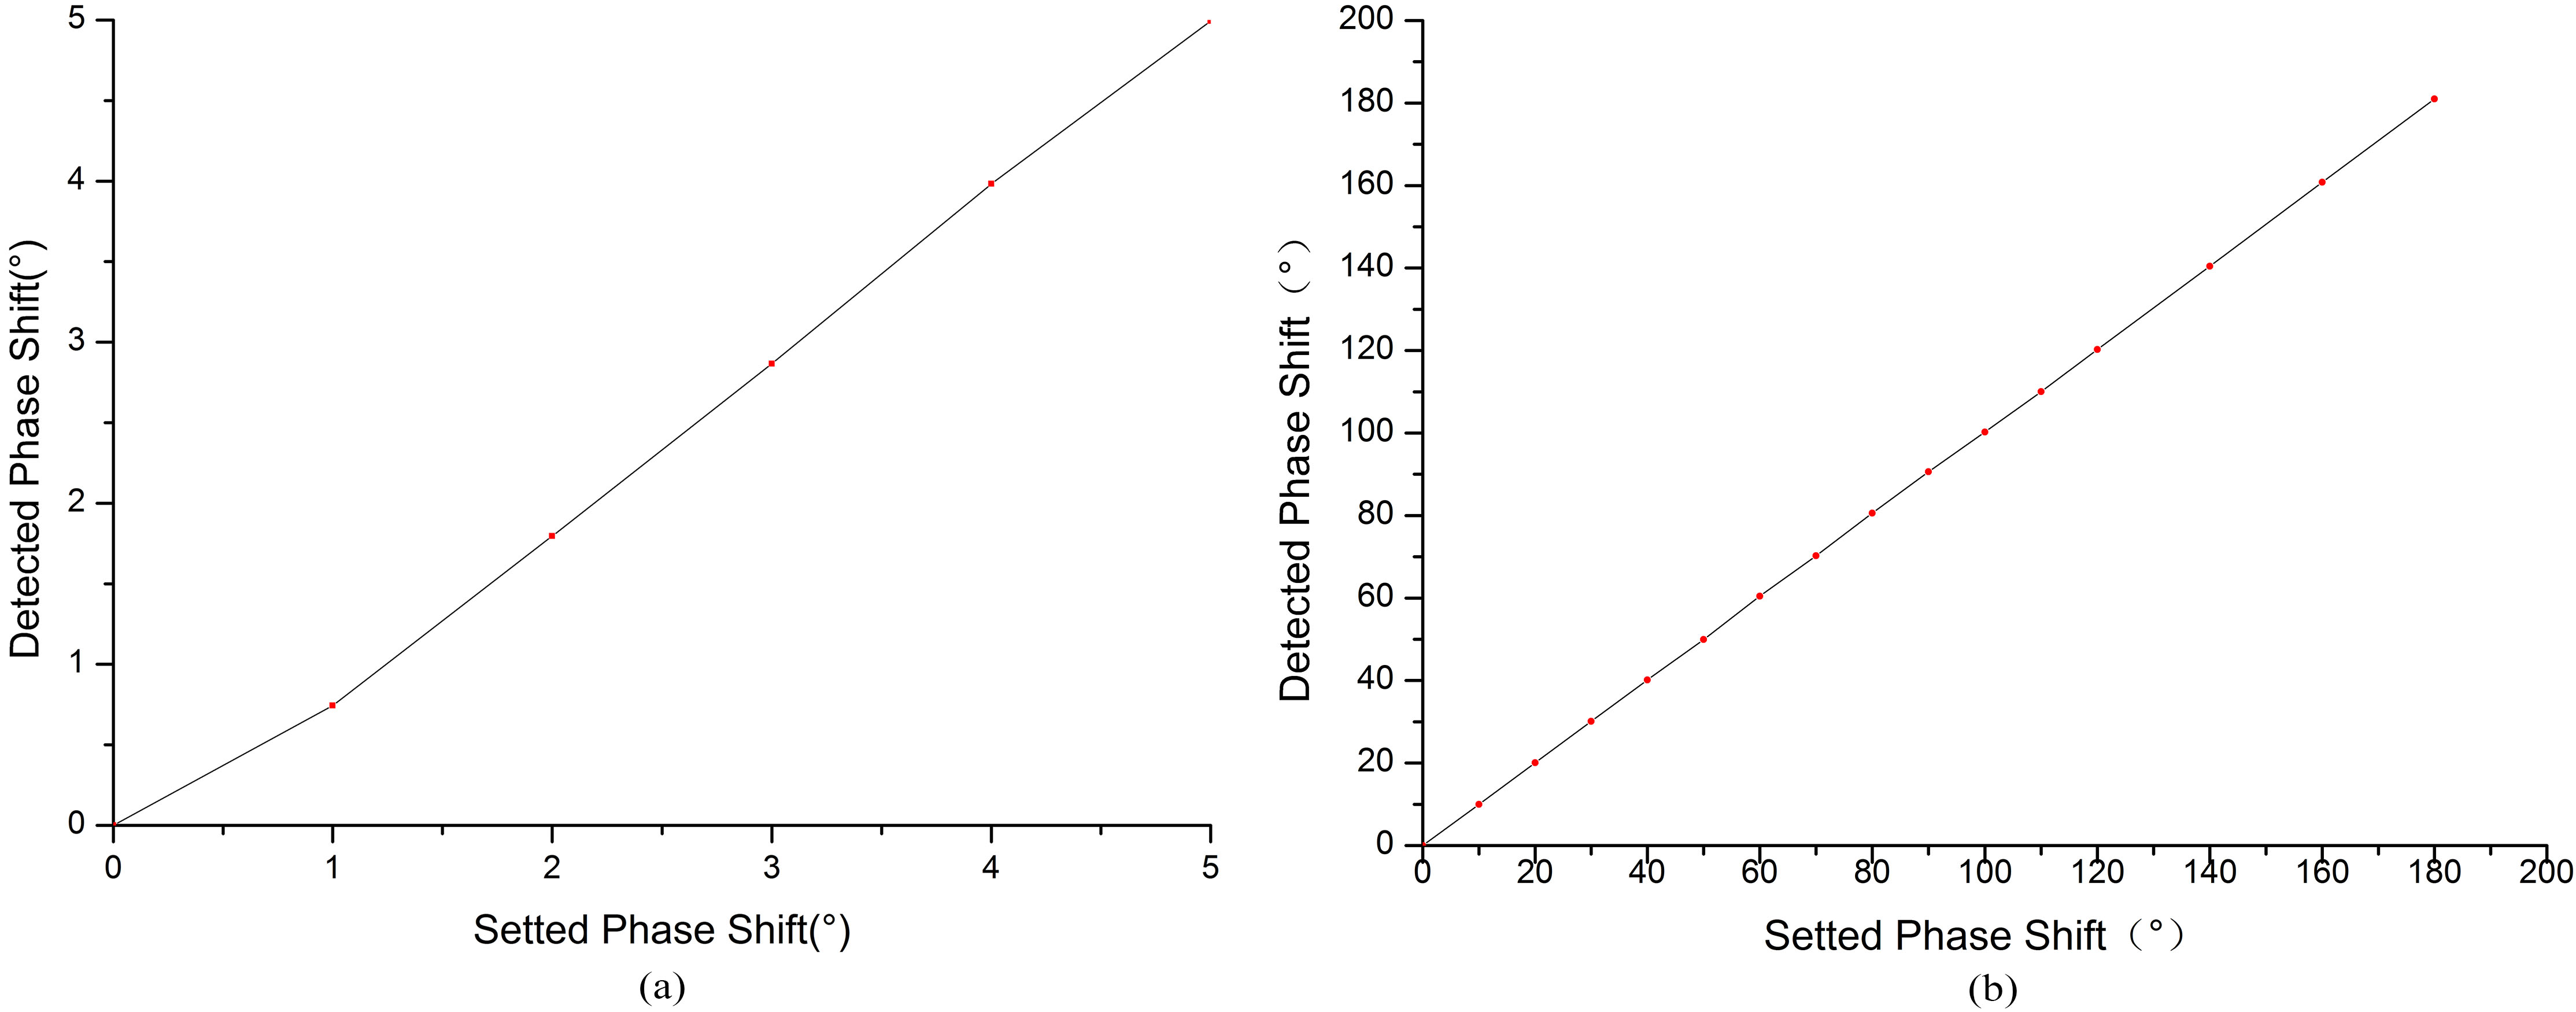
The system is based on the NI-PXI platform(PXIe-8840) and has a phase accuracy of 0.01 degrees. It contains an arbitrary signal generator card PXI-5451 and an acquisition card PXI-5124. These PXI cards are both dual-channel as connection described in Section 2.2. We measure the phase drift and the phase linearity of this system. In order to ensure the stability of the experimental system, all experiments are conducted after the system is turned on and preheated for 1 hour, and the system state is stable. System operating parameter is described in Section 2.2.
In order to test the phase linearity, the input voltages of the two channels are set to 5 V
In order to prove the feasibility of the system, we carry out a salt solution simulation experiment and a breath holding experiment with healthy volunteers. According to the dielectric properties of human tissues [15], edema is simulated with salt solution with conductivity of 0.24 s/m, and cerebral hemorrhage is simulated with salt solution with conductivity of 1 s/m. At the same time, 9% physiological saline with conductivity of 0.8 s/m is measured. The salt solution is manually injected into the beaker, injecting 1 ml each time. Then the three salt solutions are monitored to observe the MIPS difference caused by the volume change of the solution with different conductivity.
At the same time, according to Oziel et al. [16], when people hold their breath, the global brain conductivity changes with the change of blood flow in order to maintain the oxygen supply to the brain. Therefore, we are carrying out breath-holding experiments on healthy volunteers to test the sensitivity of the system to the changes in the human brain conductivity. Thirteen healthy volunteers aged between 20 and 35 are selected for the test. The subjects are in a lying position in monitoring. After each volunteer calmed down, the MIPS value of holding breath for 30 seconds is monitored, followed by MIPS monitoring of normal breathing for another 10 minutes.
Figure 5.
The actual detection system of healthy volunteers.
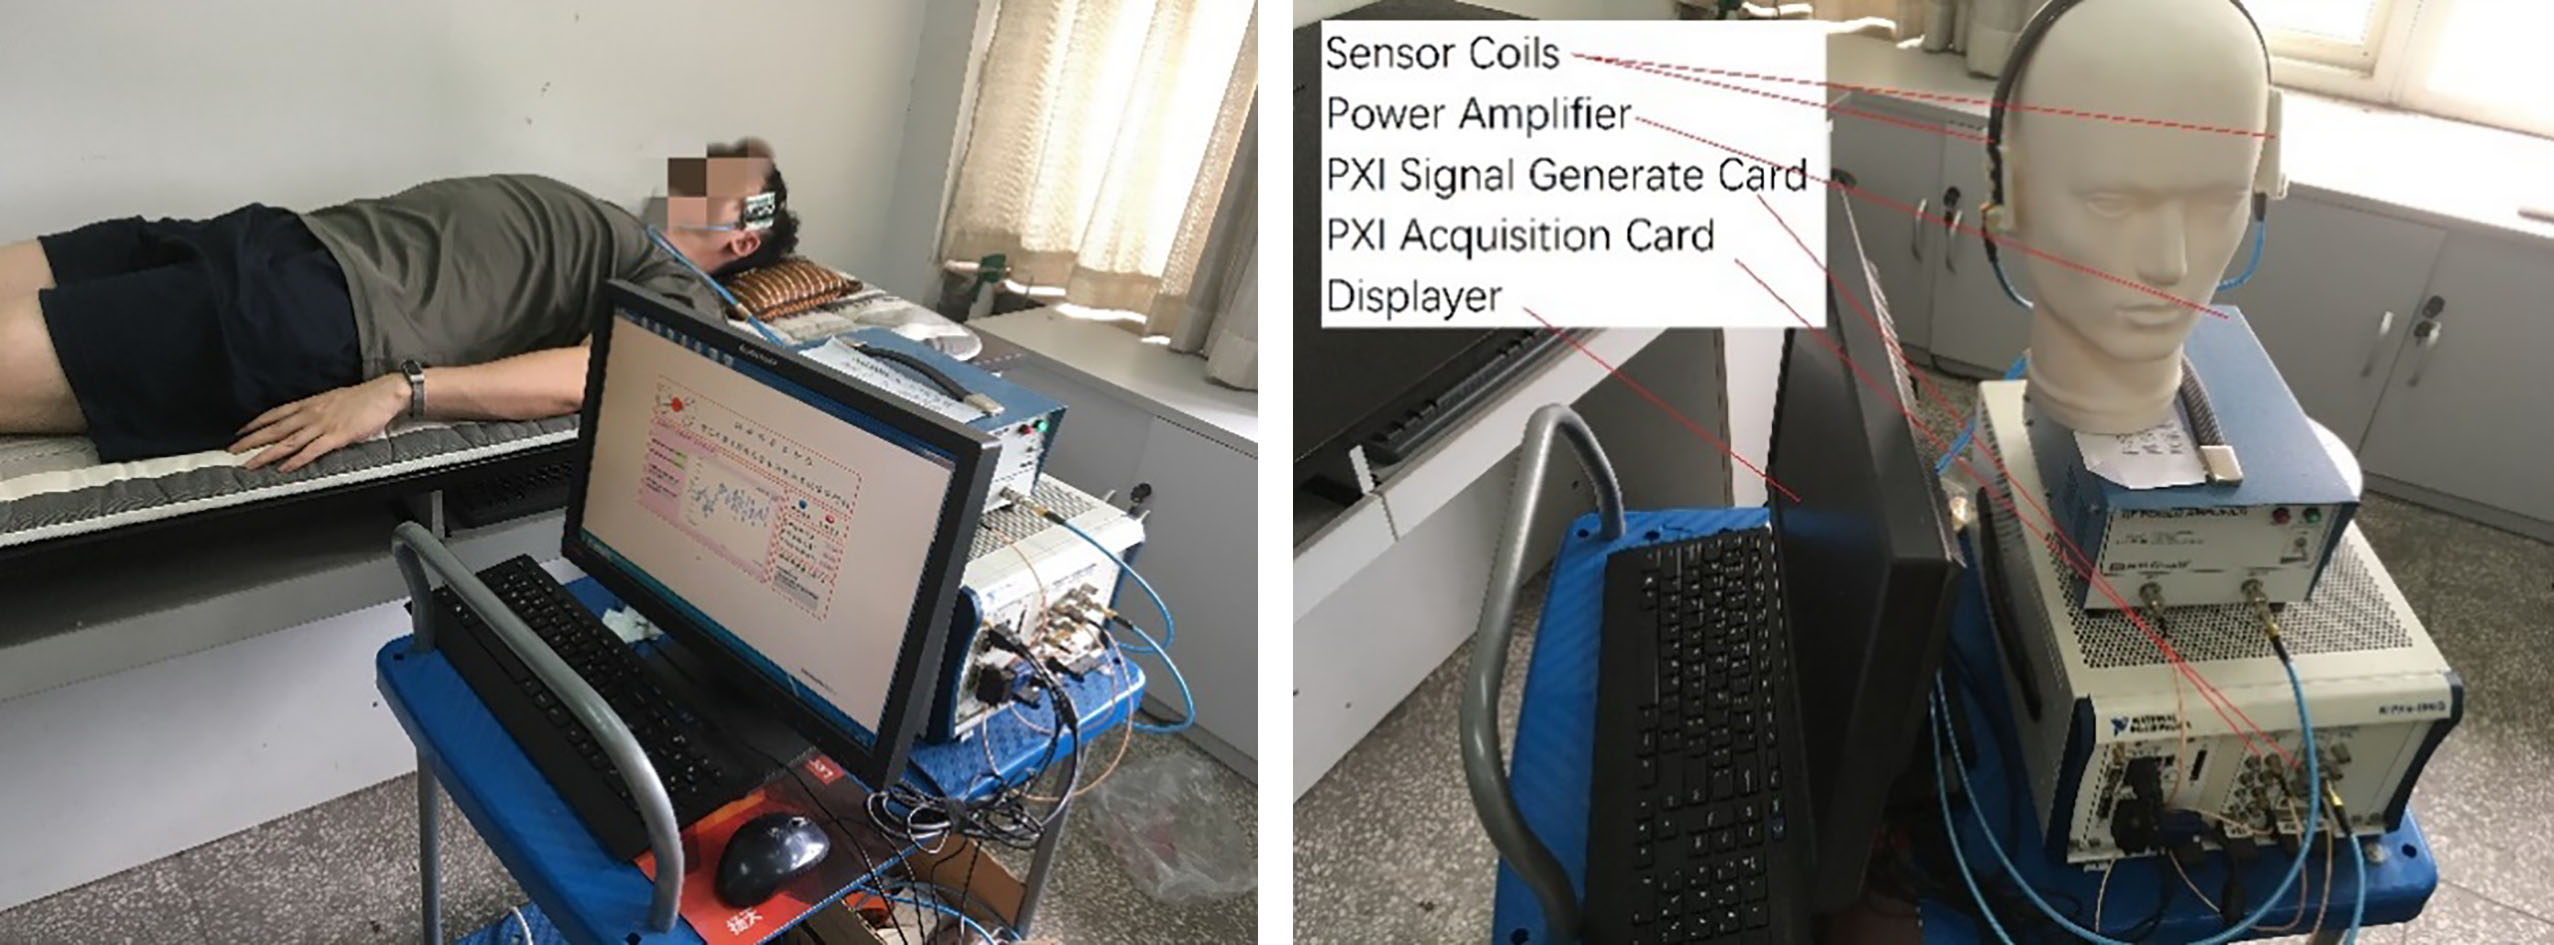
Figure 6.
The phase linear curve. (a) The phase linearity curve below 5
The long-term MIPS monitoring experiment of healthy volunteers is shown in Fig. 5. The MIPS relationship of different healthy volunteers and different times monitoring is evaluated. This experiment can provide a control for clinical cerebral edema patient monitoring in the later study. The experiment is conducted on the same group of volunteers. The sensor is positioned at the wing point of the skull, also in the supine position. Volunteers keep breathing normally and maintain as still as possible during monitoring. Each volunteer continuously monitors for 10-minutes and measures 3 times, interval 12-hour. The subjects’ blood pressure are measured before the experiment. The mean systolic blood pressure is 113.38 (
The clinical trial is conducted in neurosurgery (Southwest Hospital, Army Medical University). The MIPS value of a patient with clinical cerebral hemorrhage (postoperative edema) is repeatedly measured, also 10-minutes each time. The patient’s intracranial pressure (ICP), mean arterial pressure (MAP), cerebral perfusion pressure (CPP) values and computer tomographic (CT) images are also used for comparison with MIPS values.
The study is approved by the Ethics Committee of Army Medical University and obtained informed consent from healthy volunteers and patients.
3.Results
3.1System detection experiment
The phase linearity curve below 5
Figure 7.
The phase drift curve of the MIPS system. (a) The phase drift in ten minutes; (b) The phase drift in 3 hours.
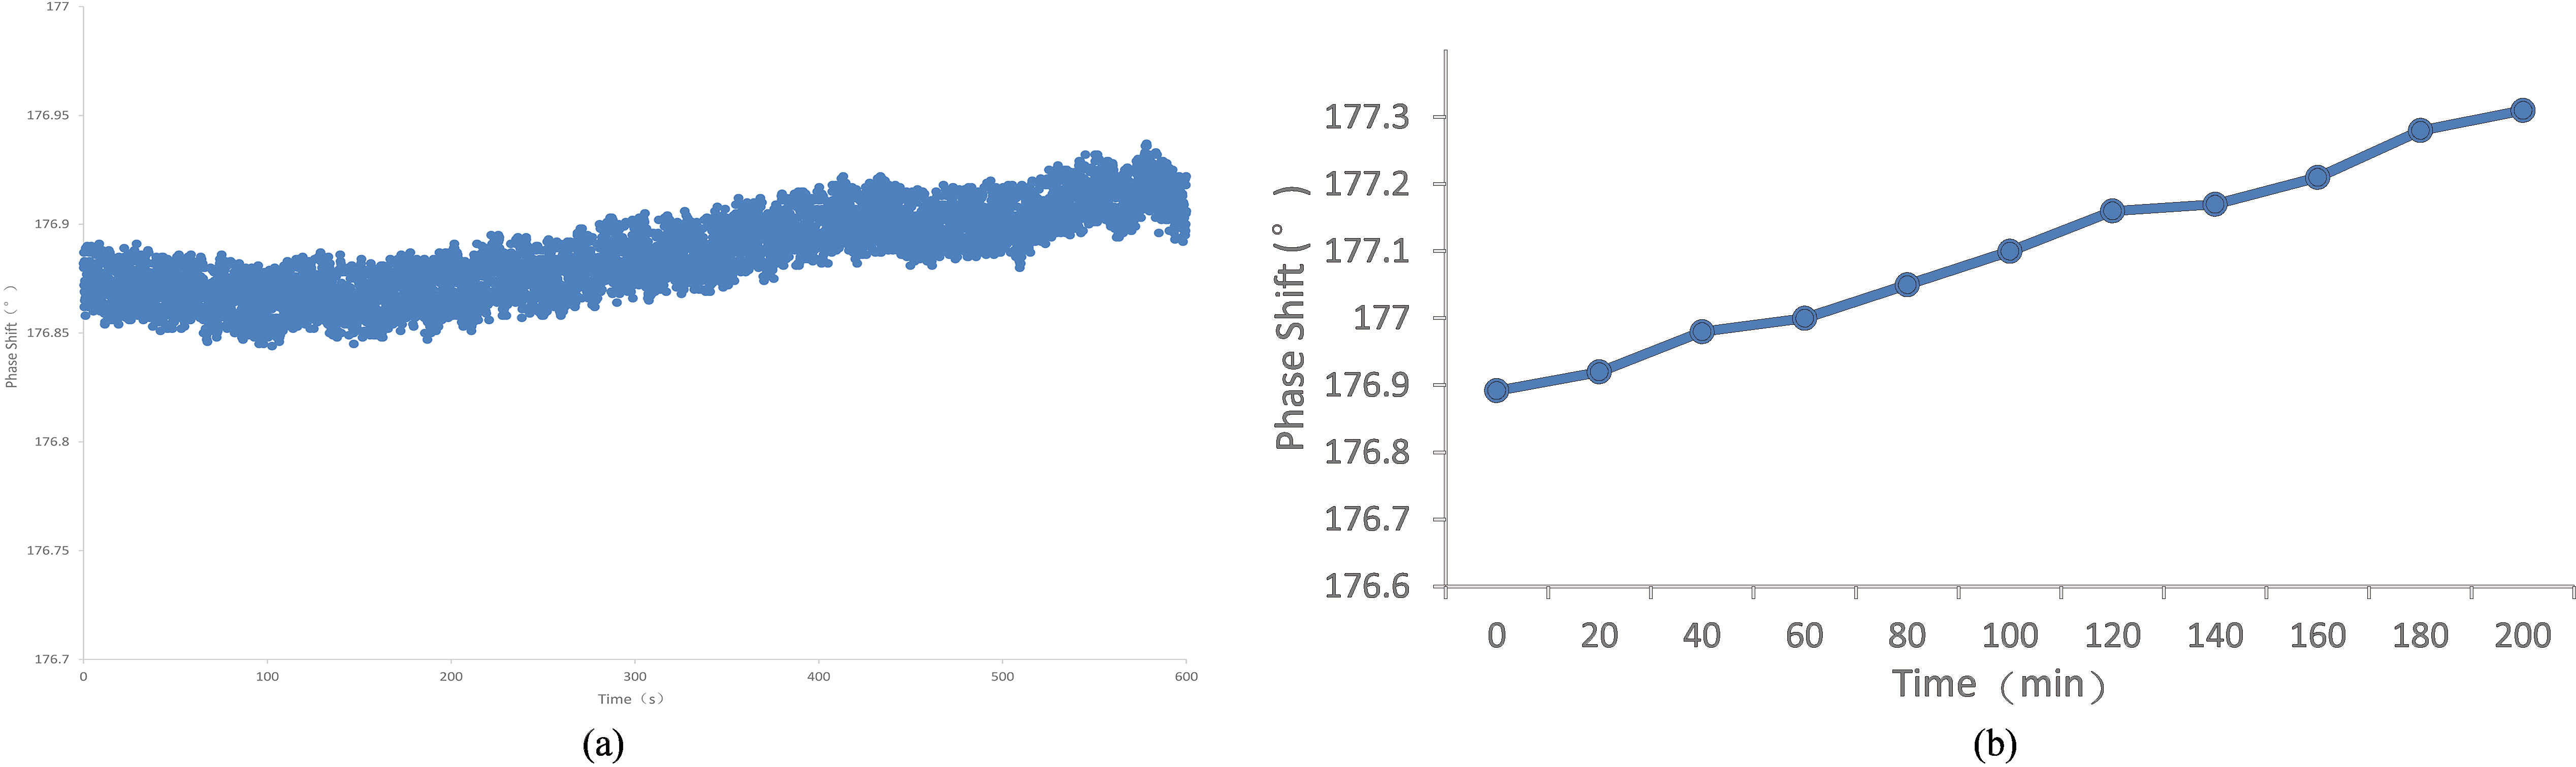
Figure 8.
The change trend of MIPS with the increase of volume of simulated brain tissue. 0.24 s/m salt solution simulates the electrical conductivity of cerebral edema, 1.1 s/m salt solution simulates the electrical conductivity of cerebral hemorrhage, and 0.8 s/m is the electrical conductivity of 9% saline.
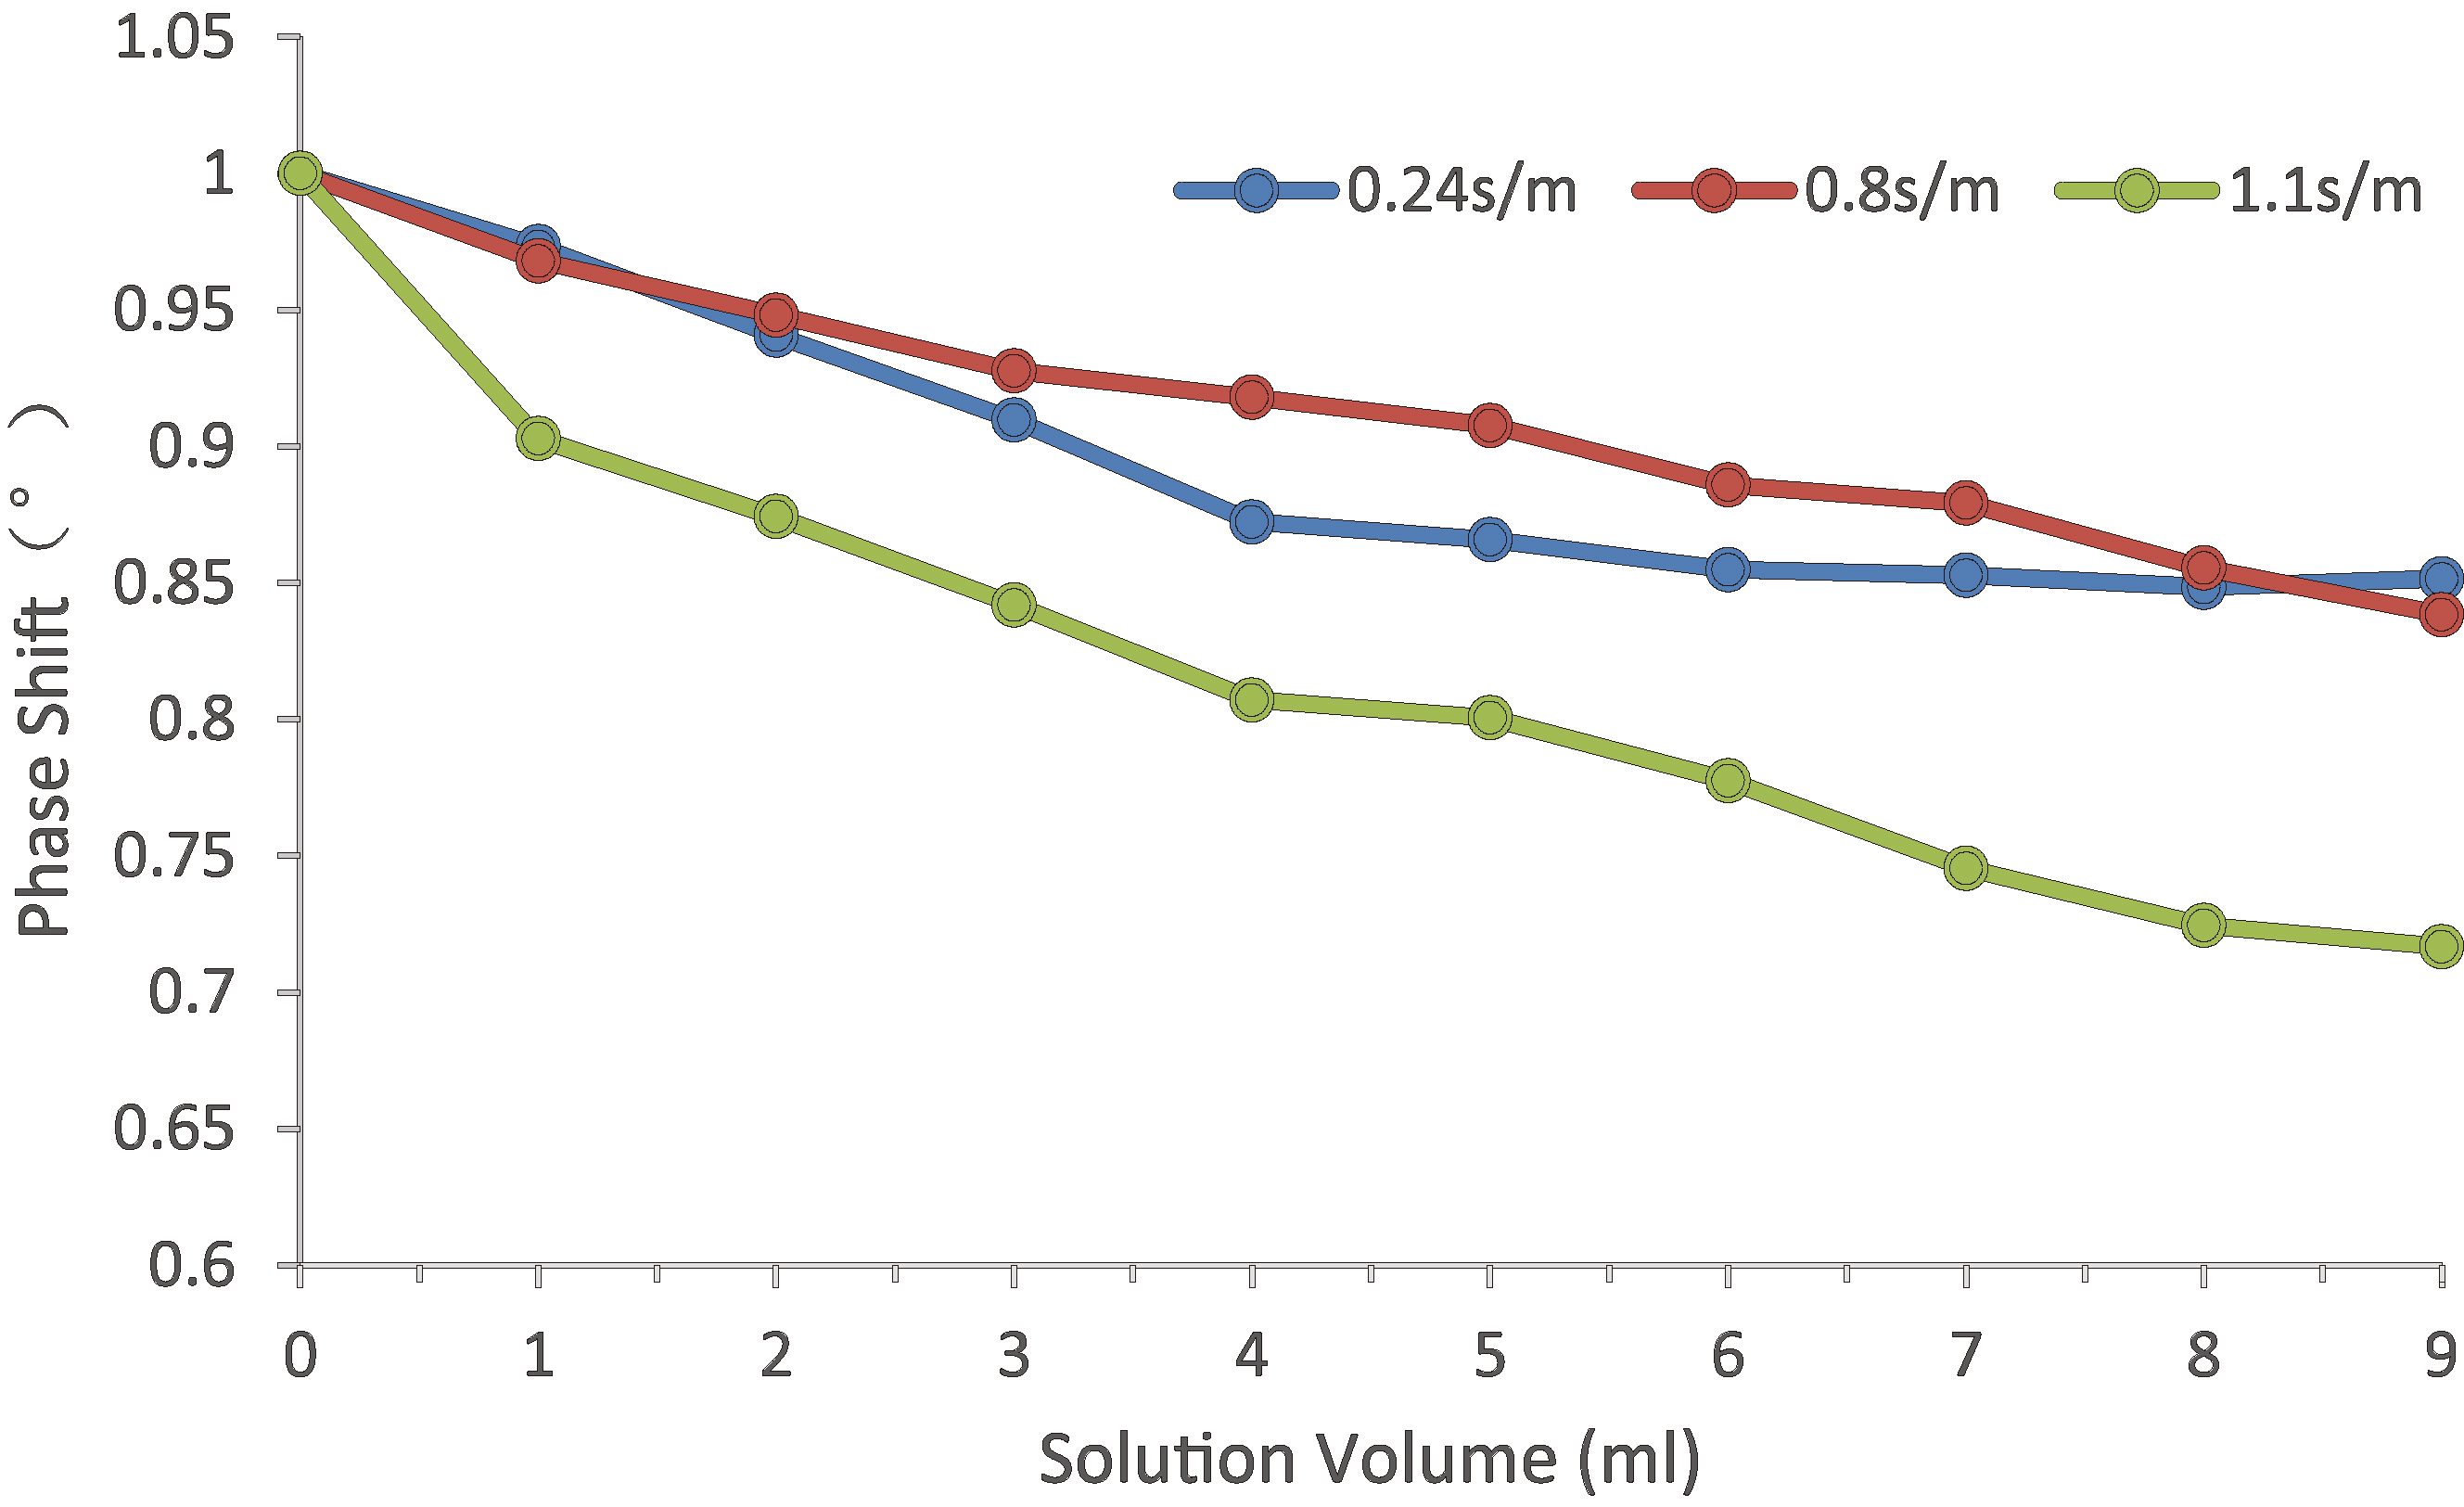
Physical experiment shows that the system can be used to detect the volume change of saline solution for cerebral edema and cerebral hemorrhage. The MIPS trend changes with the volume increase, as shown in Fig. 8. The MIPS trend of 1 s/m saline solution (simulated bleeding) decreases more quickly than that of 0.24 s/m saline solution (simulated edema). The change of 9% saline solution is similar to that of 0.24 s/m saline solution. At the same time, it is found that the MIPS change caused by adding 1 ml solution is larger than the system phase drift during the measurement.
The human breath holding experiment proves that the system can be used to monitor the change of brain conductivity caused by breath holding. The MIPS value of healthy volunteers decreases after holding their breath, as shown in Fig. 9, volunteer 6. When hold breath, volunteers’ brain blood flow increase to maintain oxygen supply in the brain, and MIPS value decrease. This change is consistent with the result of physical experiment, that the MIPS decreases with the bleeding volume increasing (2.4 s/m salt solution). Since some volunteers cannot hold their breath for 30 seconds, only the data of 10 subjects enter the statistics. The MIPS decreases by 1.288 (
Figure 9.
MIPS of healthy volunteers during Normal Breath and Holding Breath (volunteer No. 6).
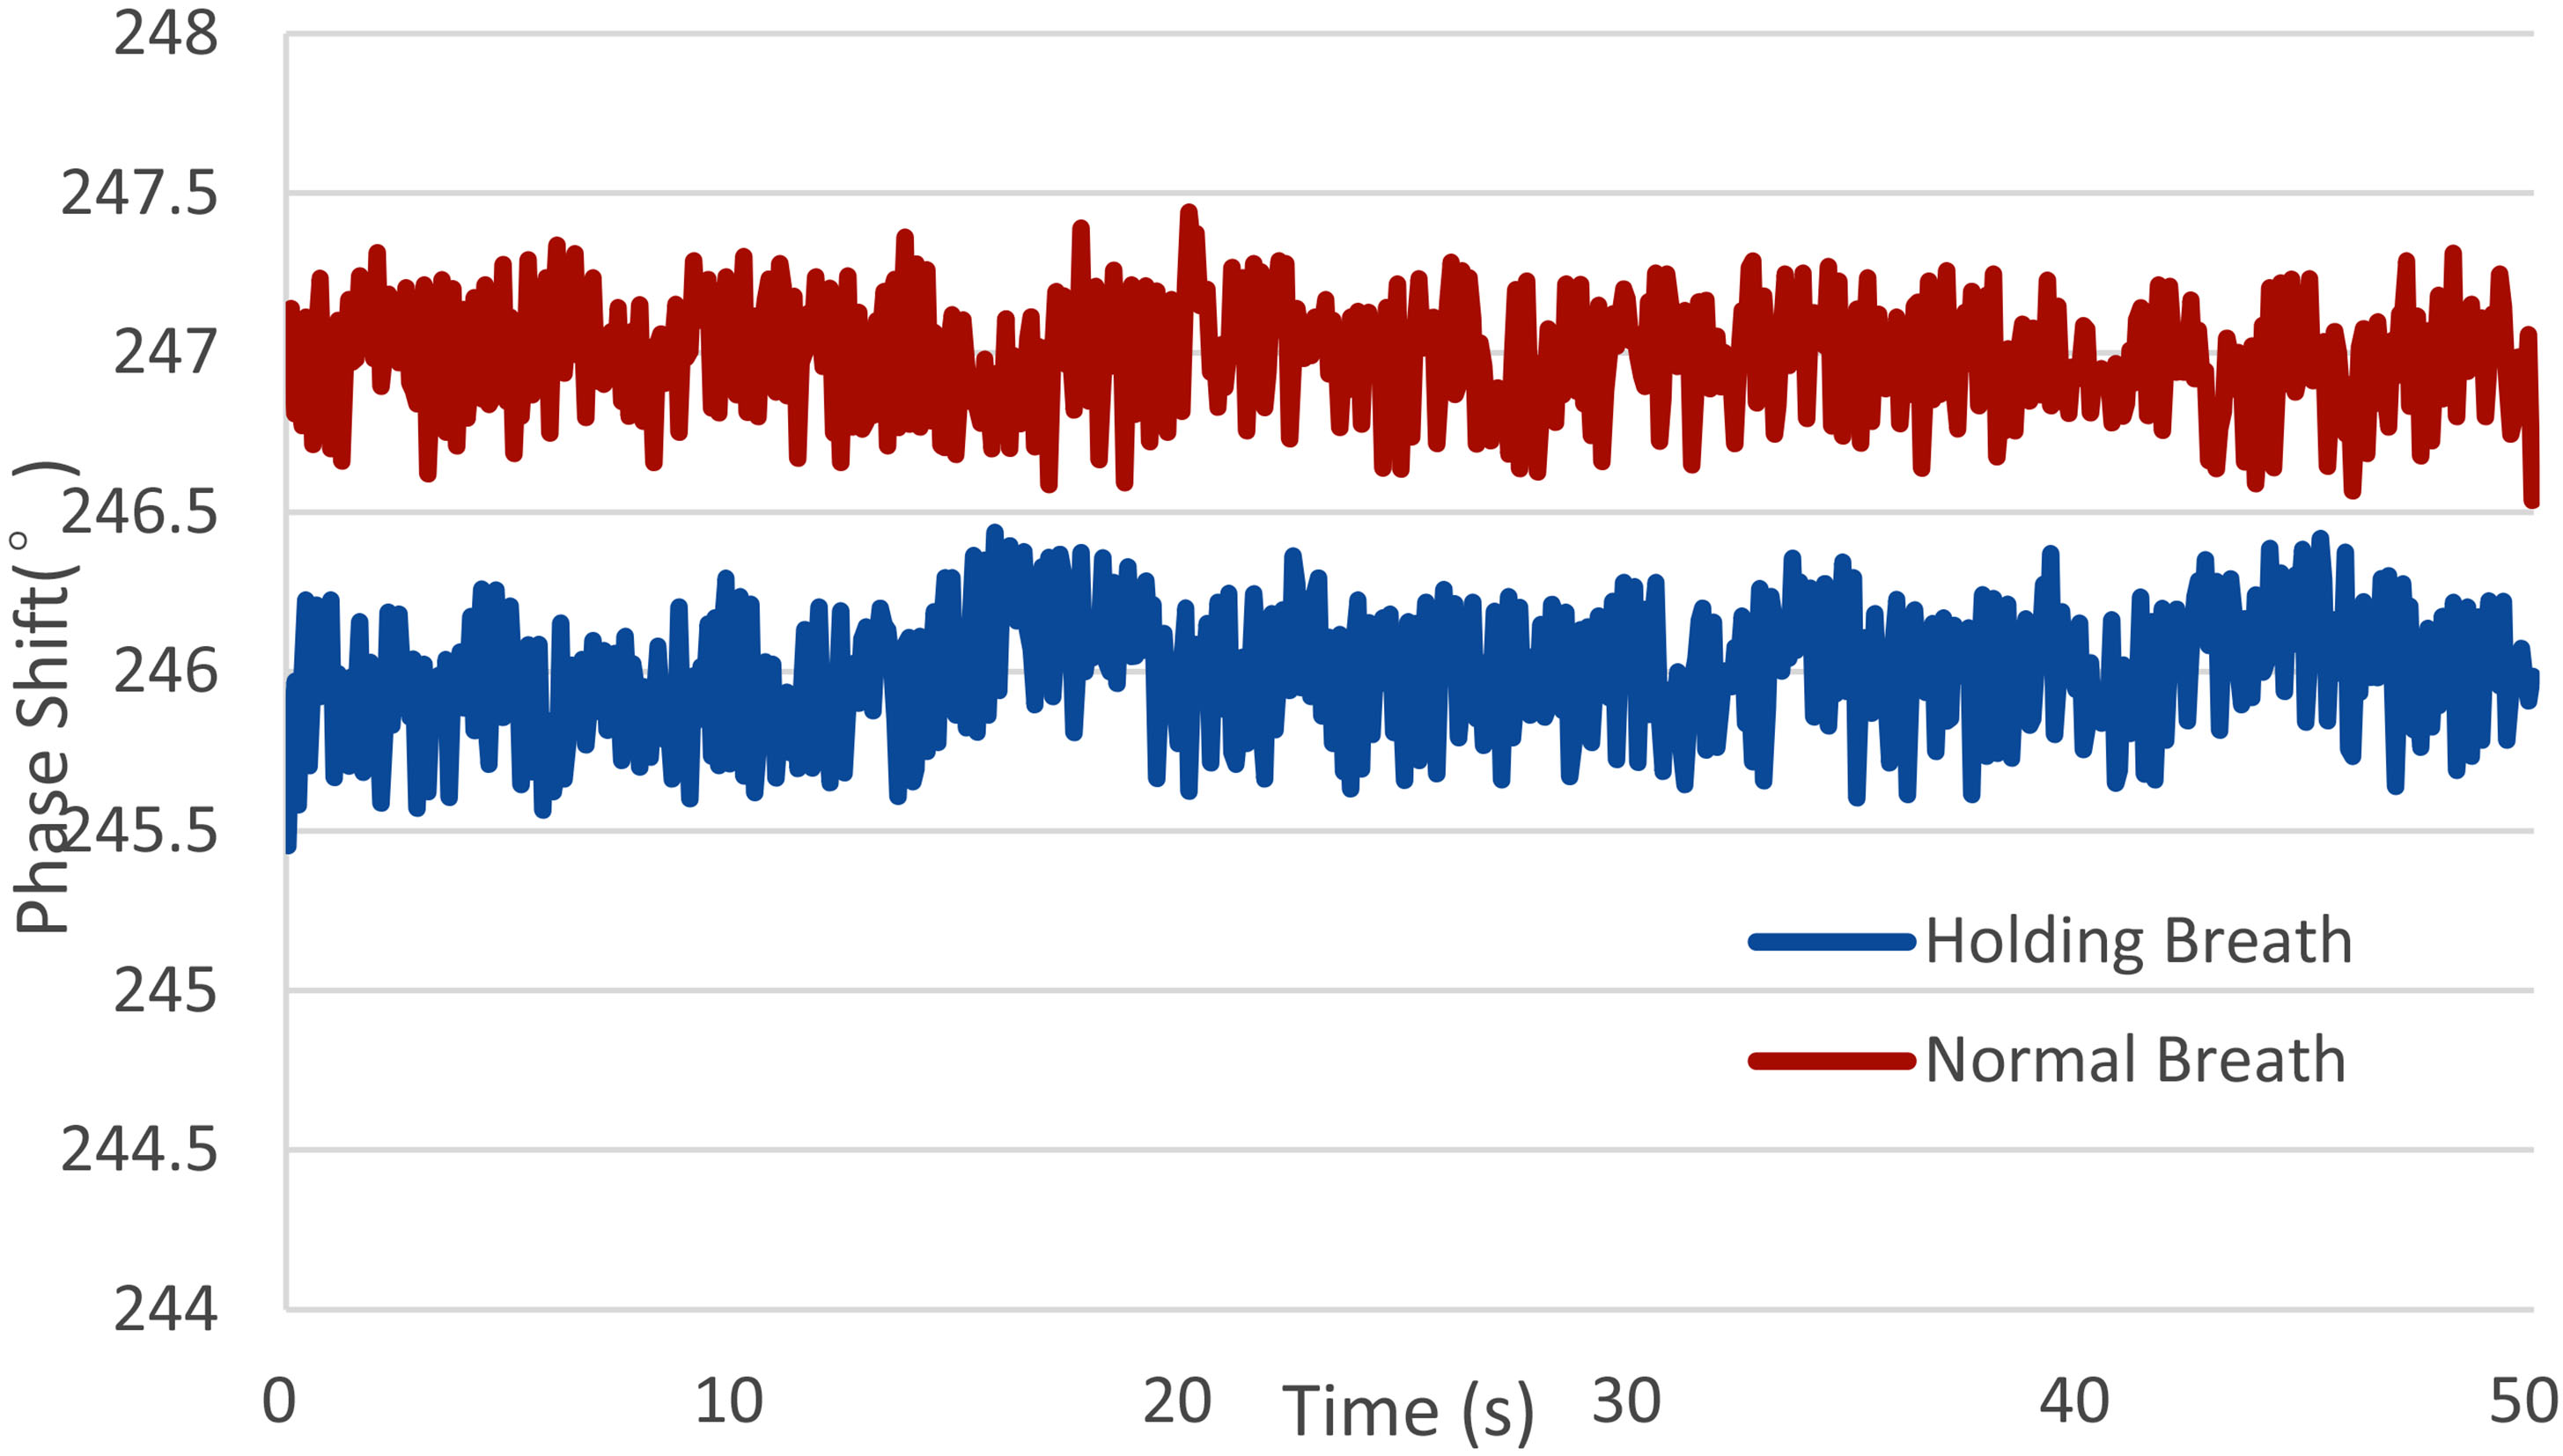
Figure 10.
The MIPS value and the mean value of 13 healthy volunteers within 24 hours.
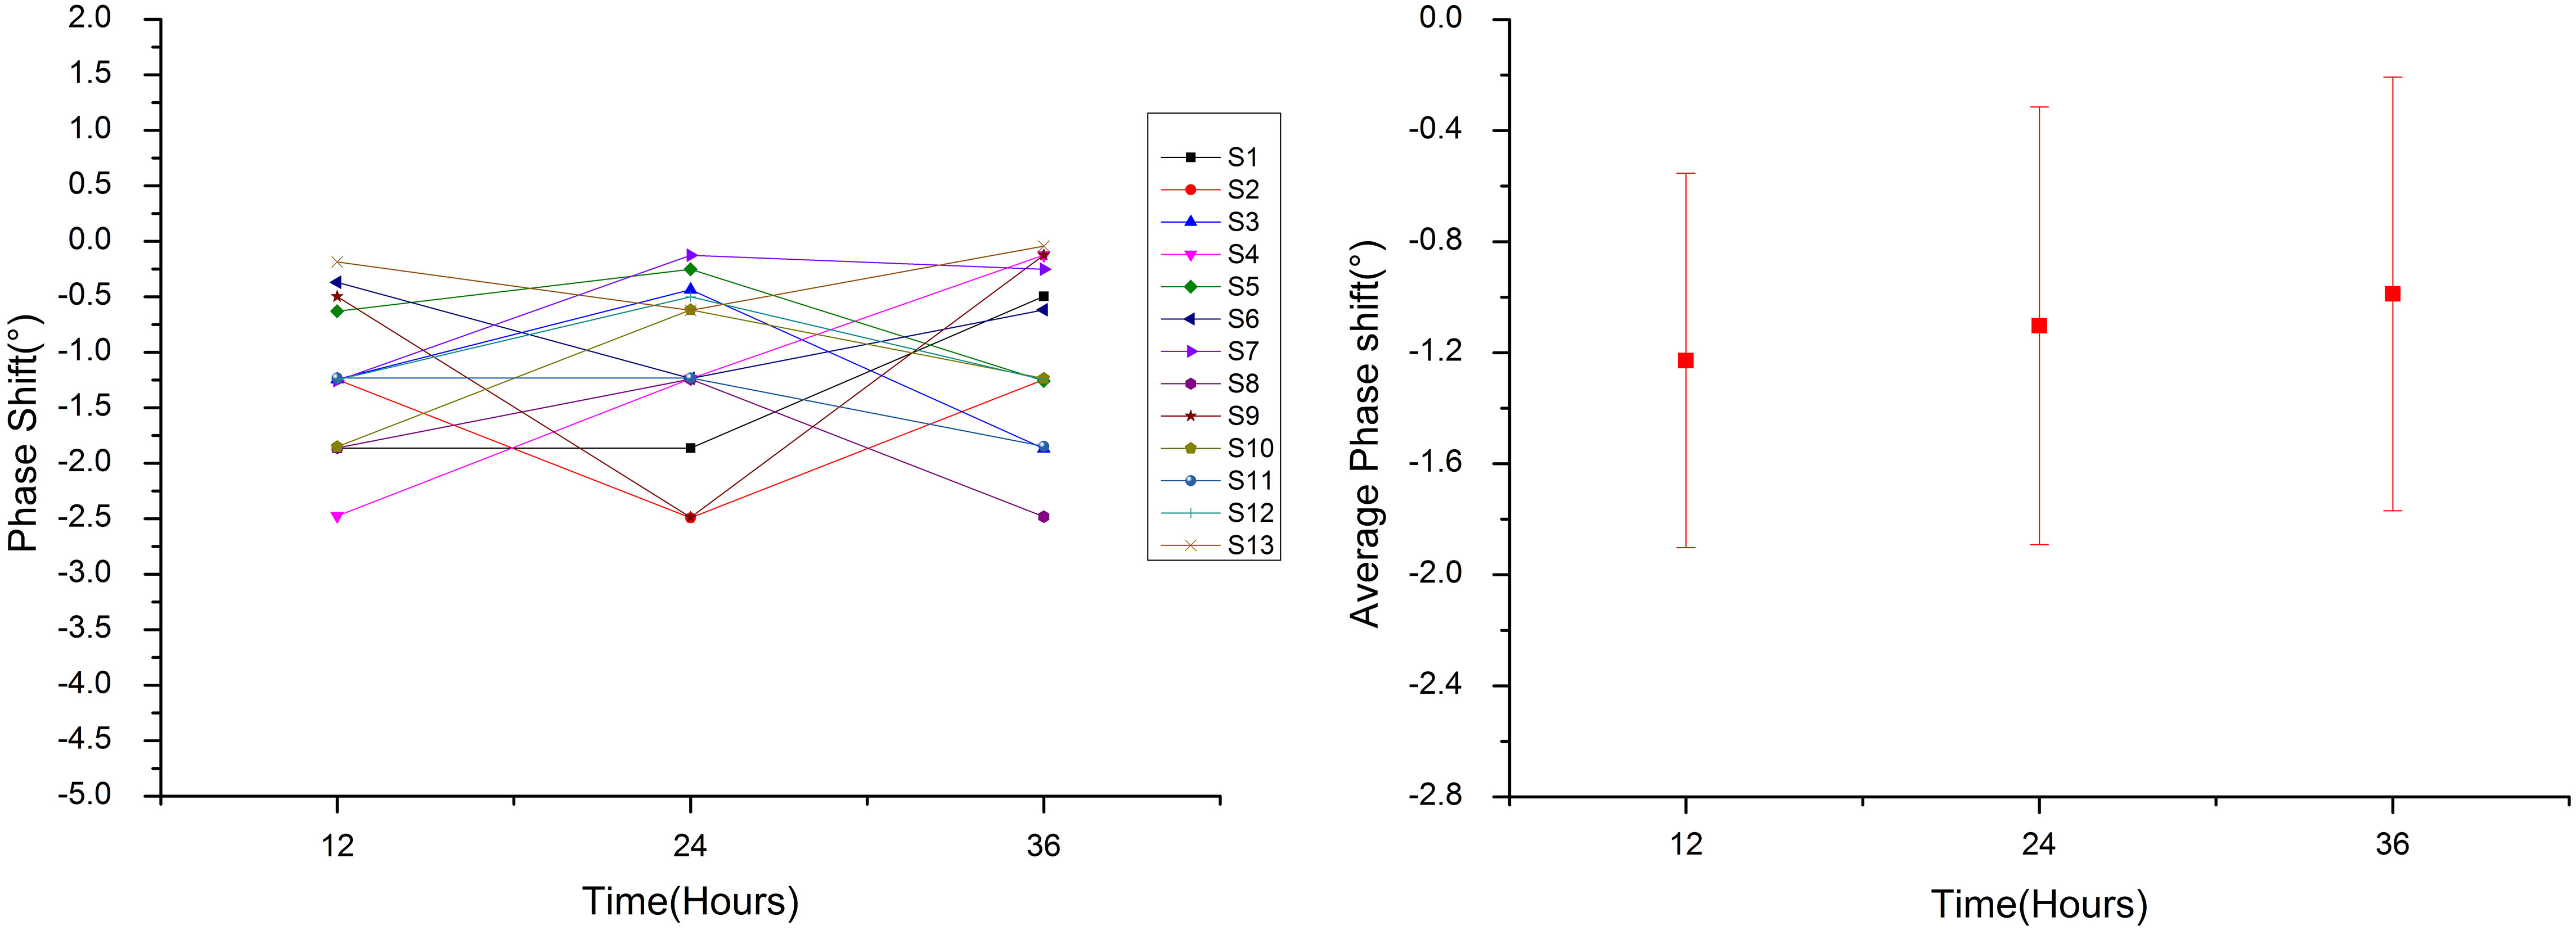
3.2Healthy volunteer experiment
In order to provide a reference to clinical trials, we monitor the MIPS values of 13 healthy volunteers. Based on this system, the MIPS values of volunteers in 24 hours are similar, and the MIPS mean value of three times measurements of each volunteer is 1.106 (
Figure 11.
MIPS change from 0-hour to12-hour and from 12-hour to 24-hours of healthy volunteers.
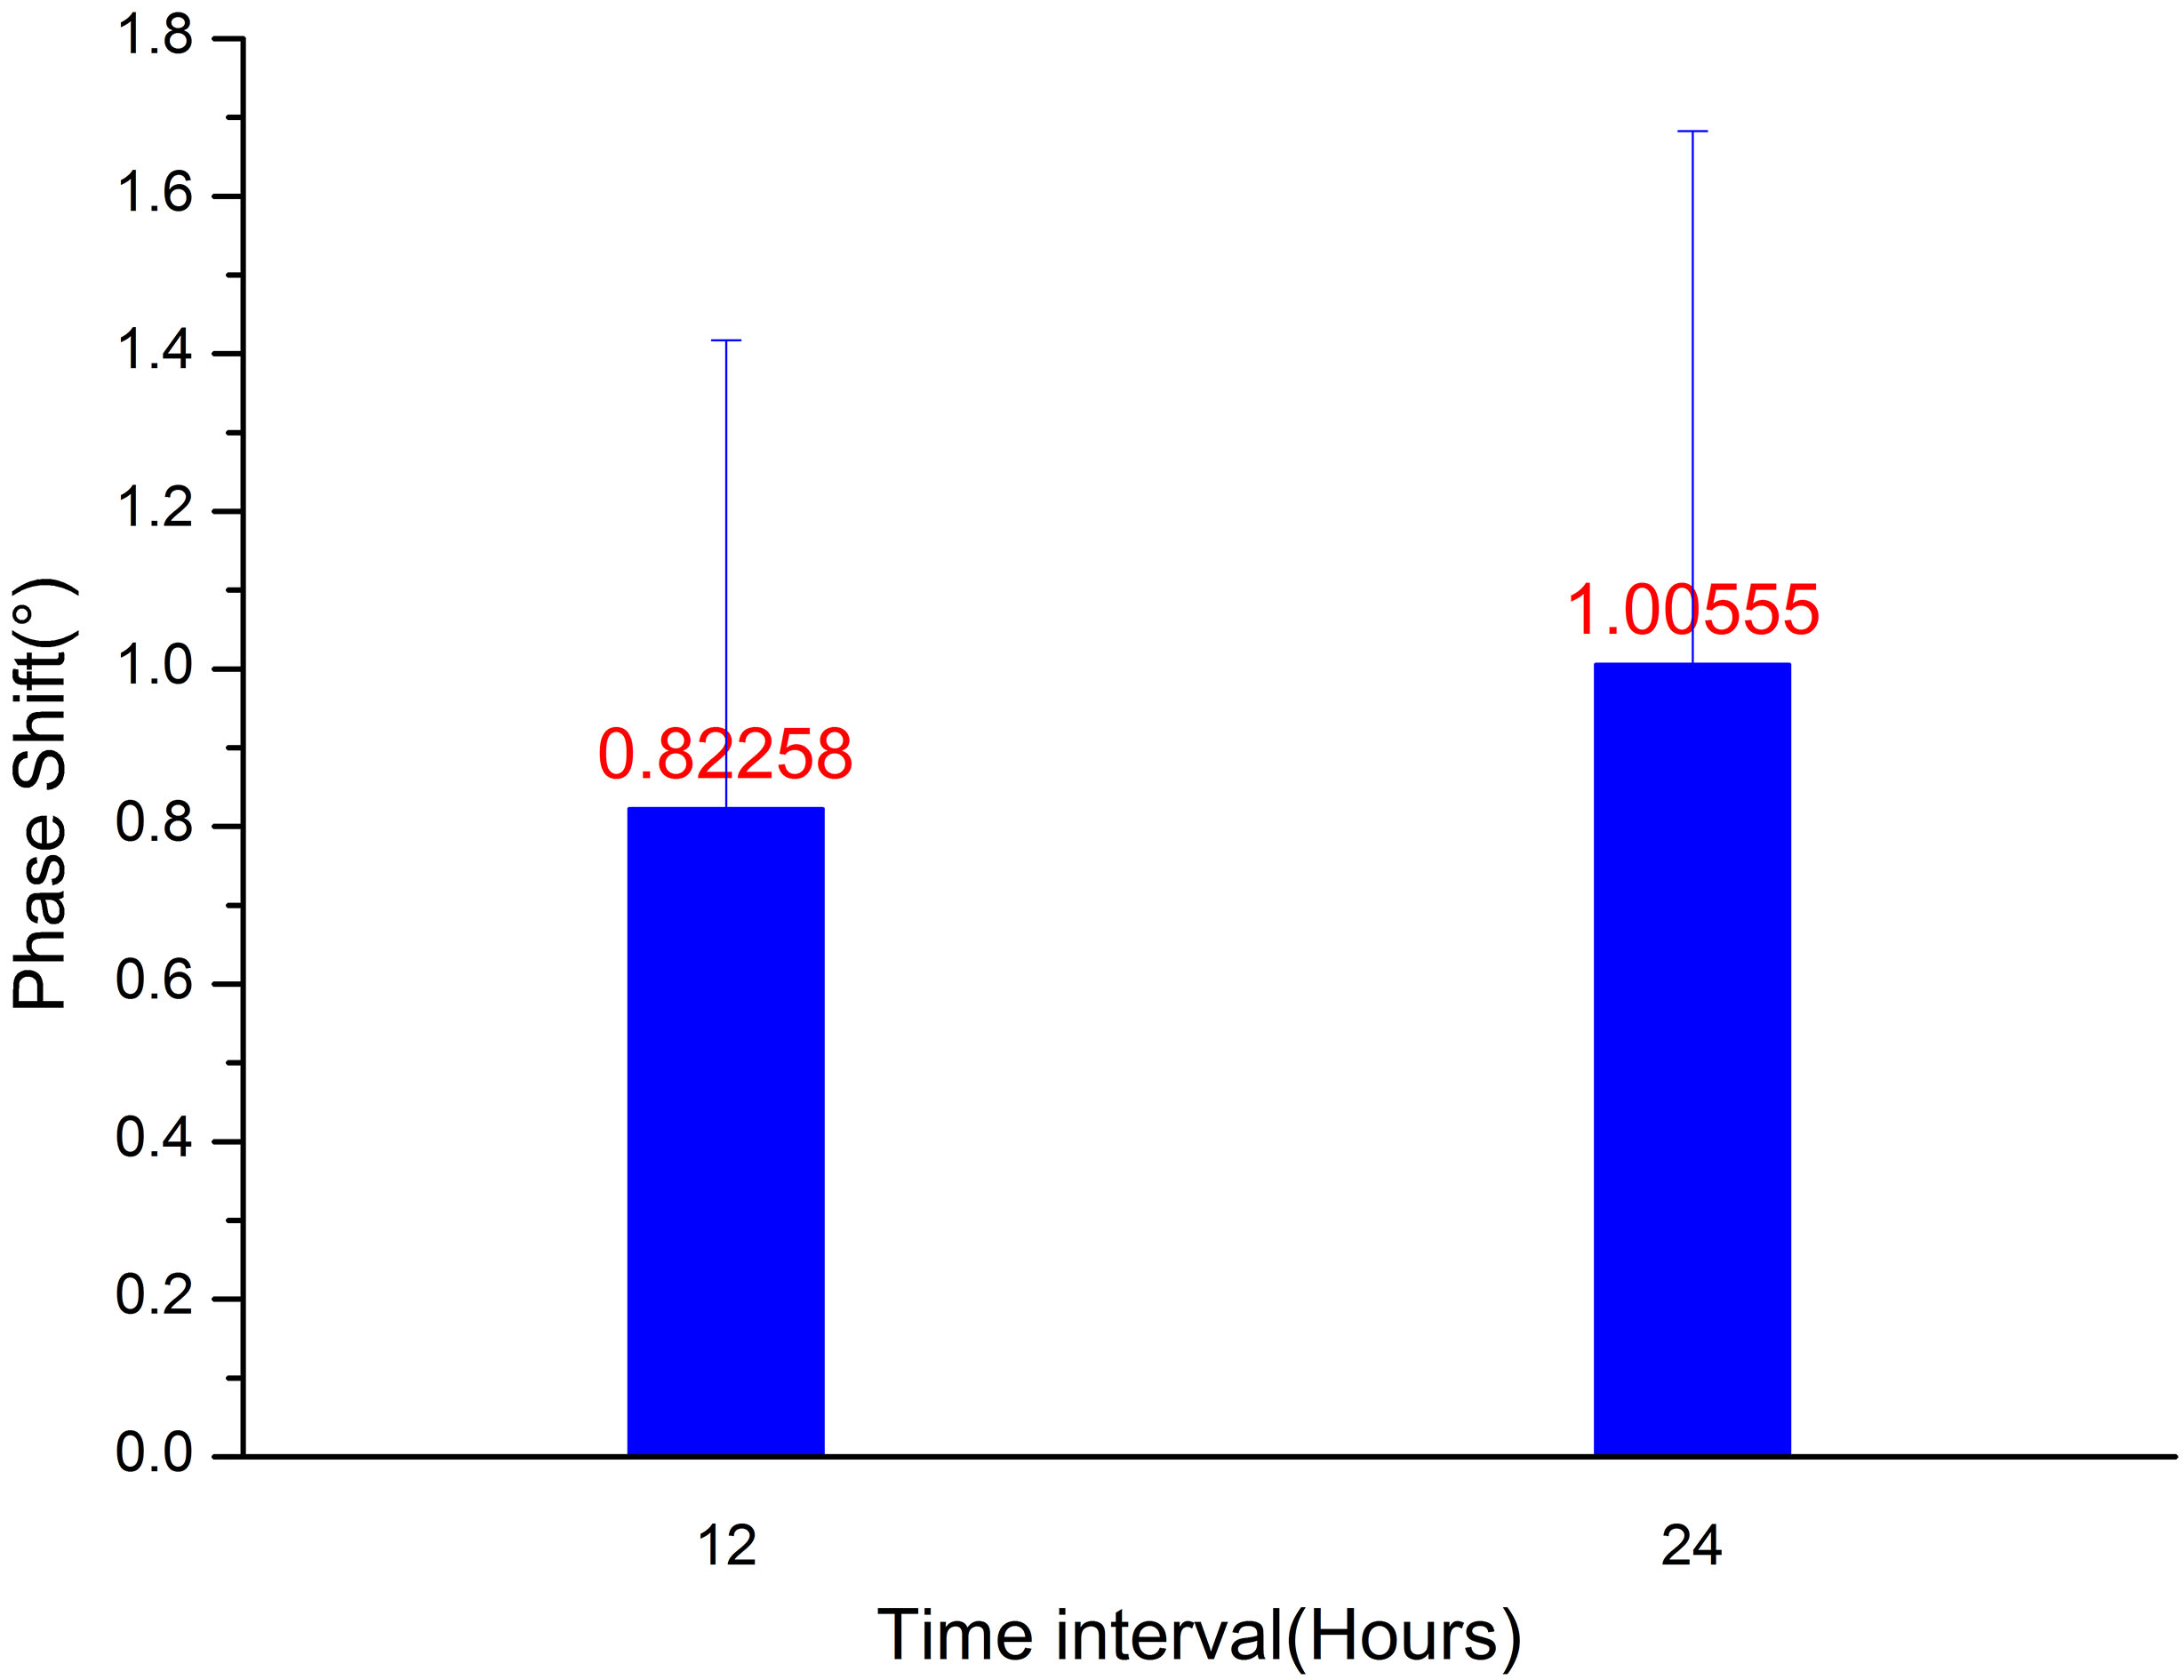
Figure 12.
Comparison of postoperative MIPS and ICP in patient with cerebral hemorrhage.
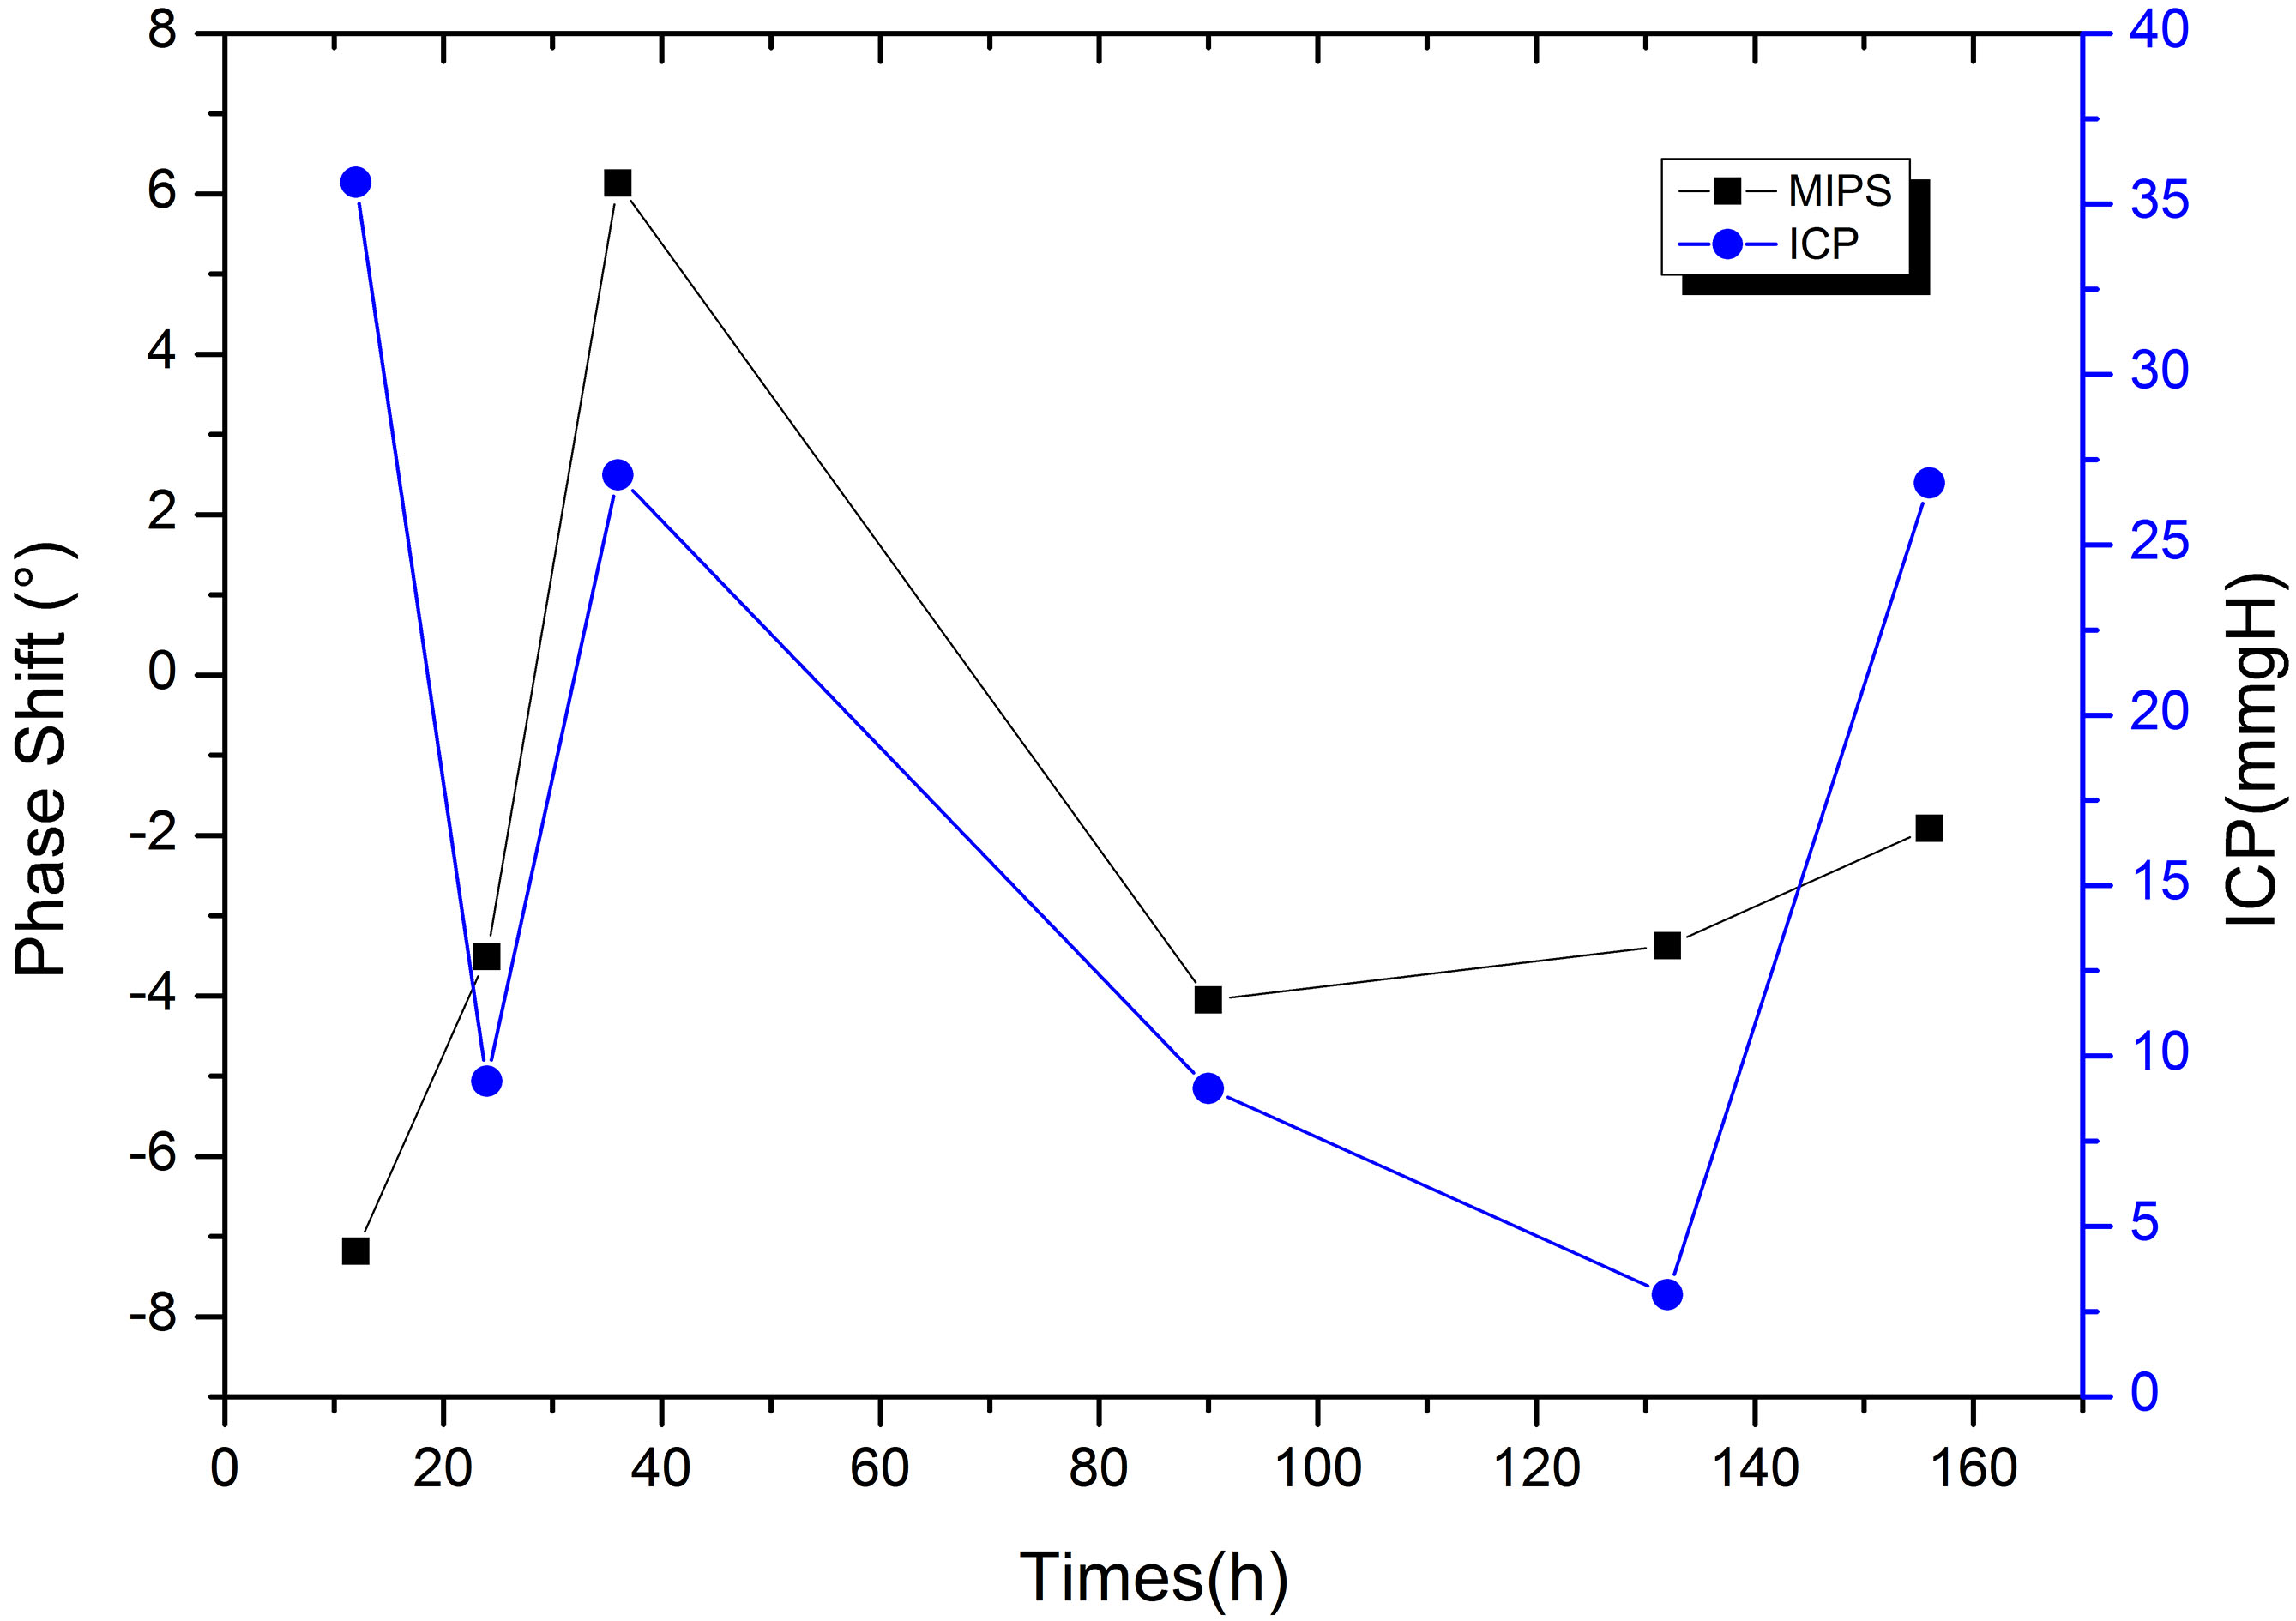
Figure 13.
Relationship between CT and MIPS in patient with cerebral hemorrhage. (a) Preoperative; (b) Postoperative, MIPS declines 3.51
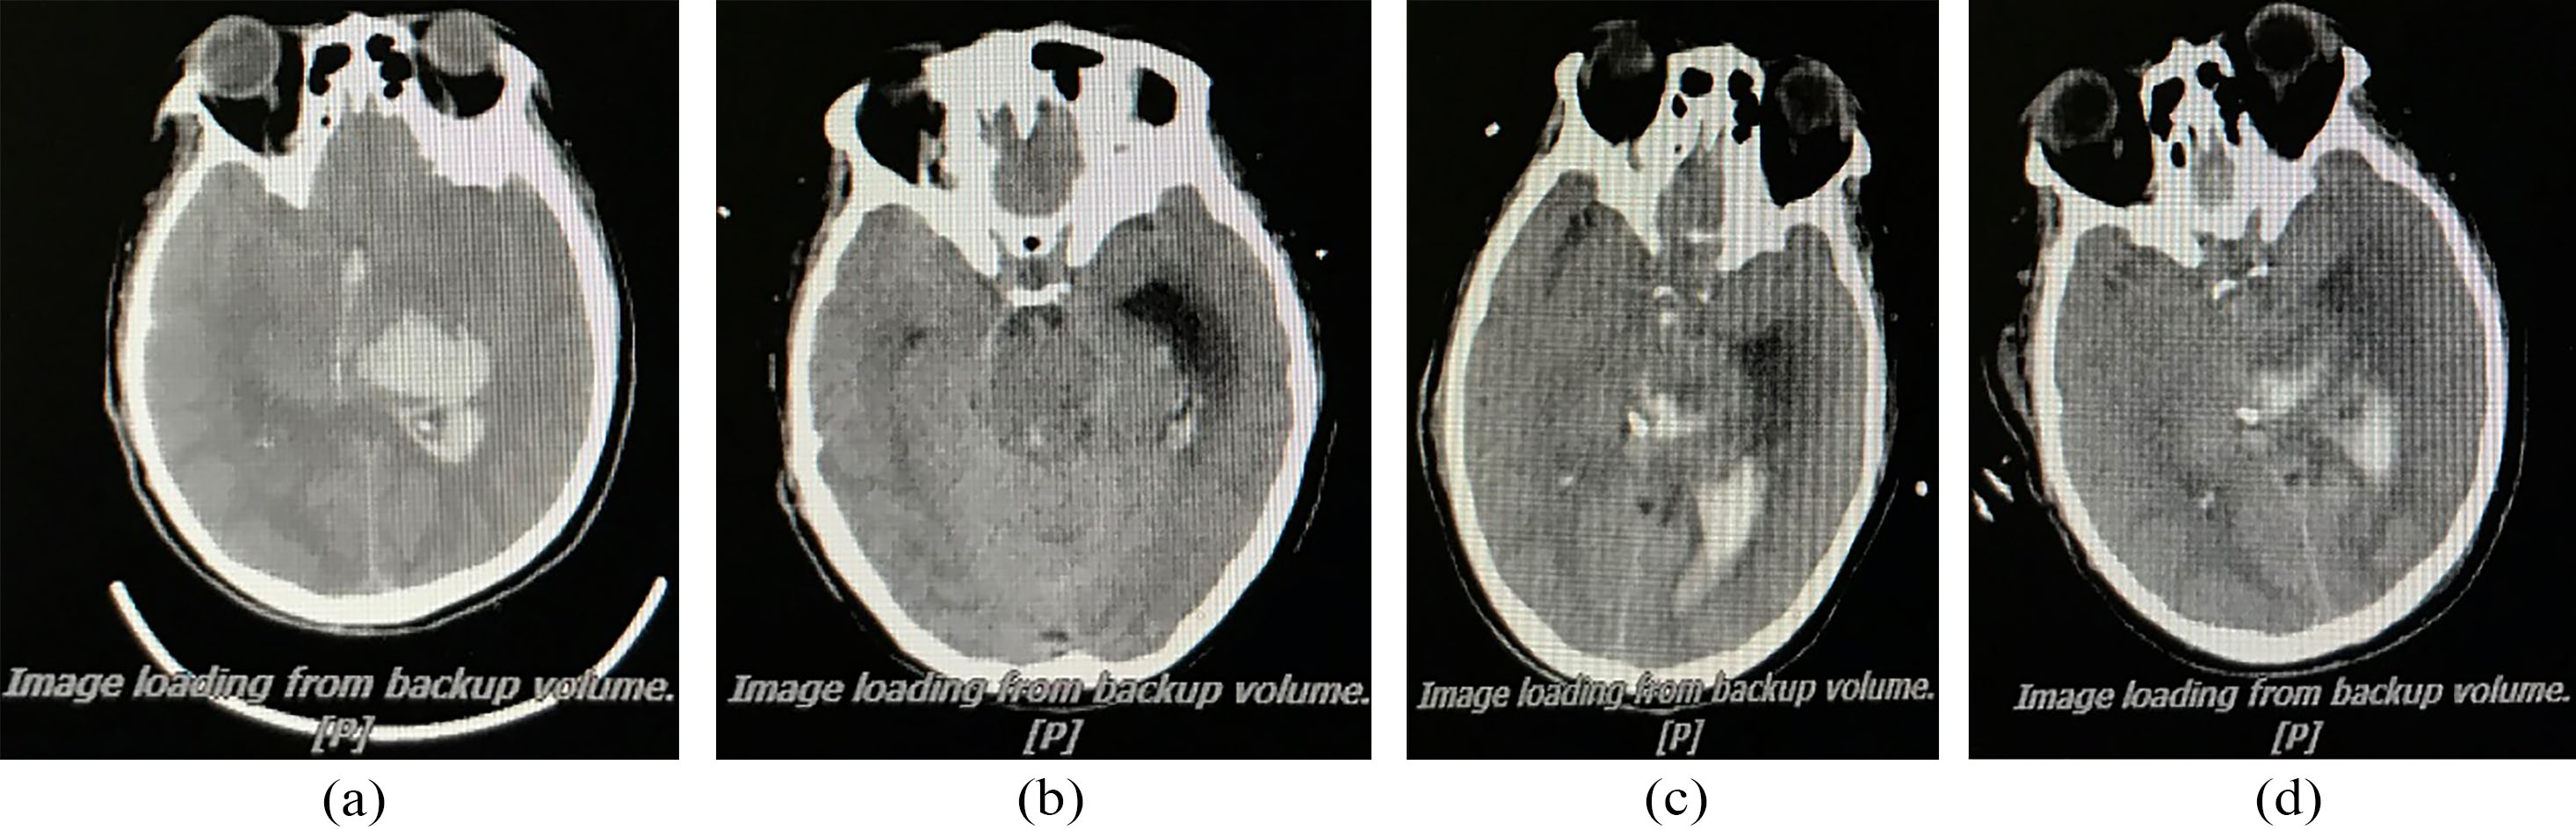
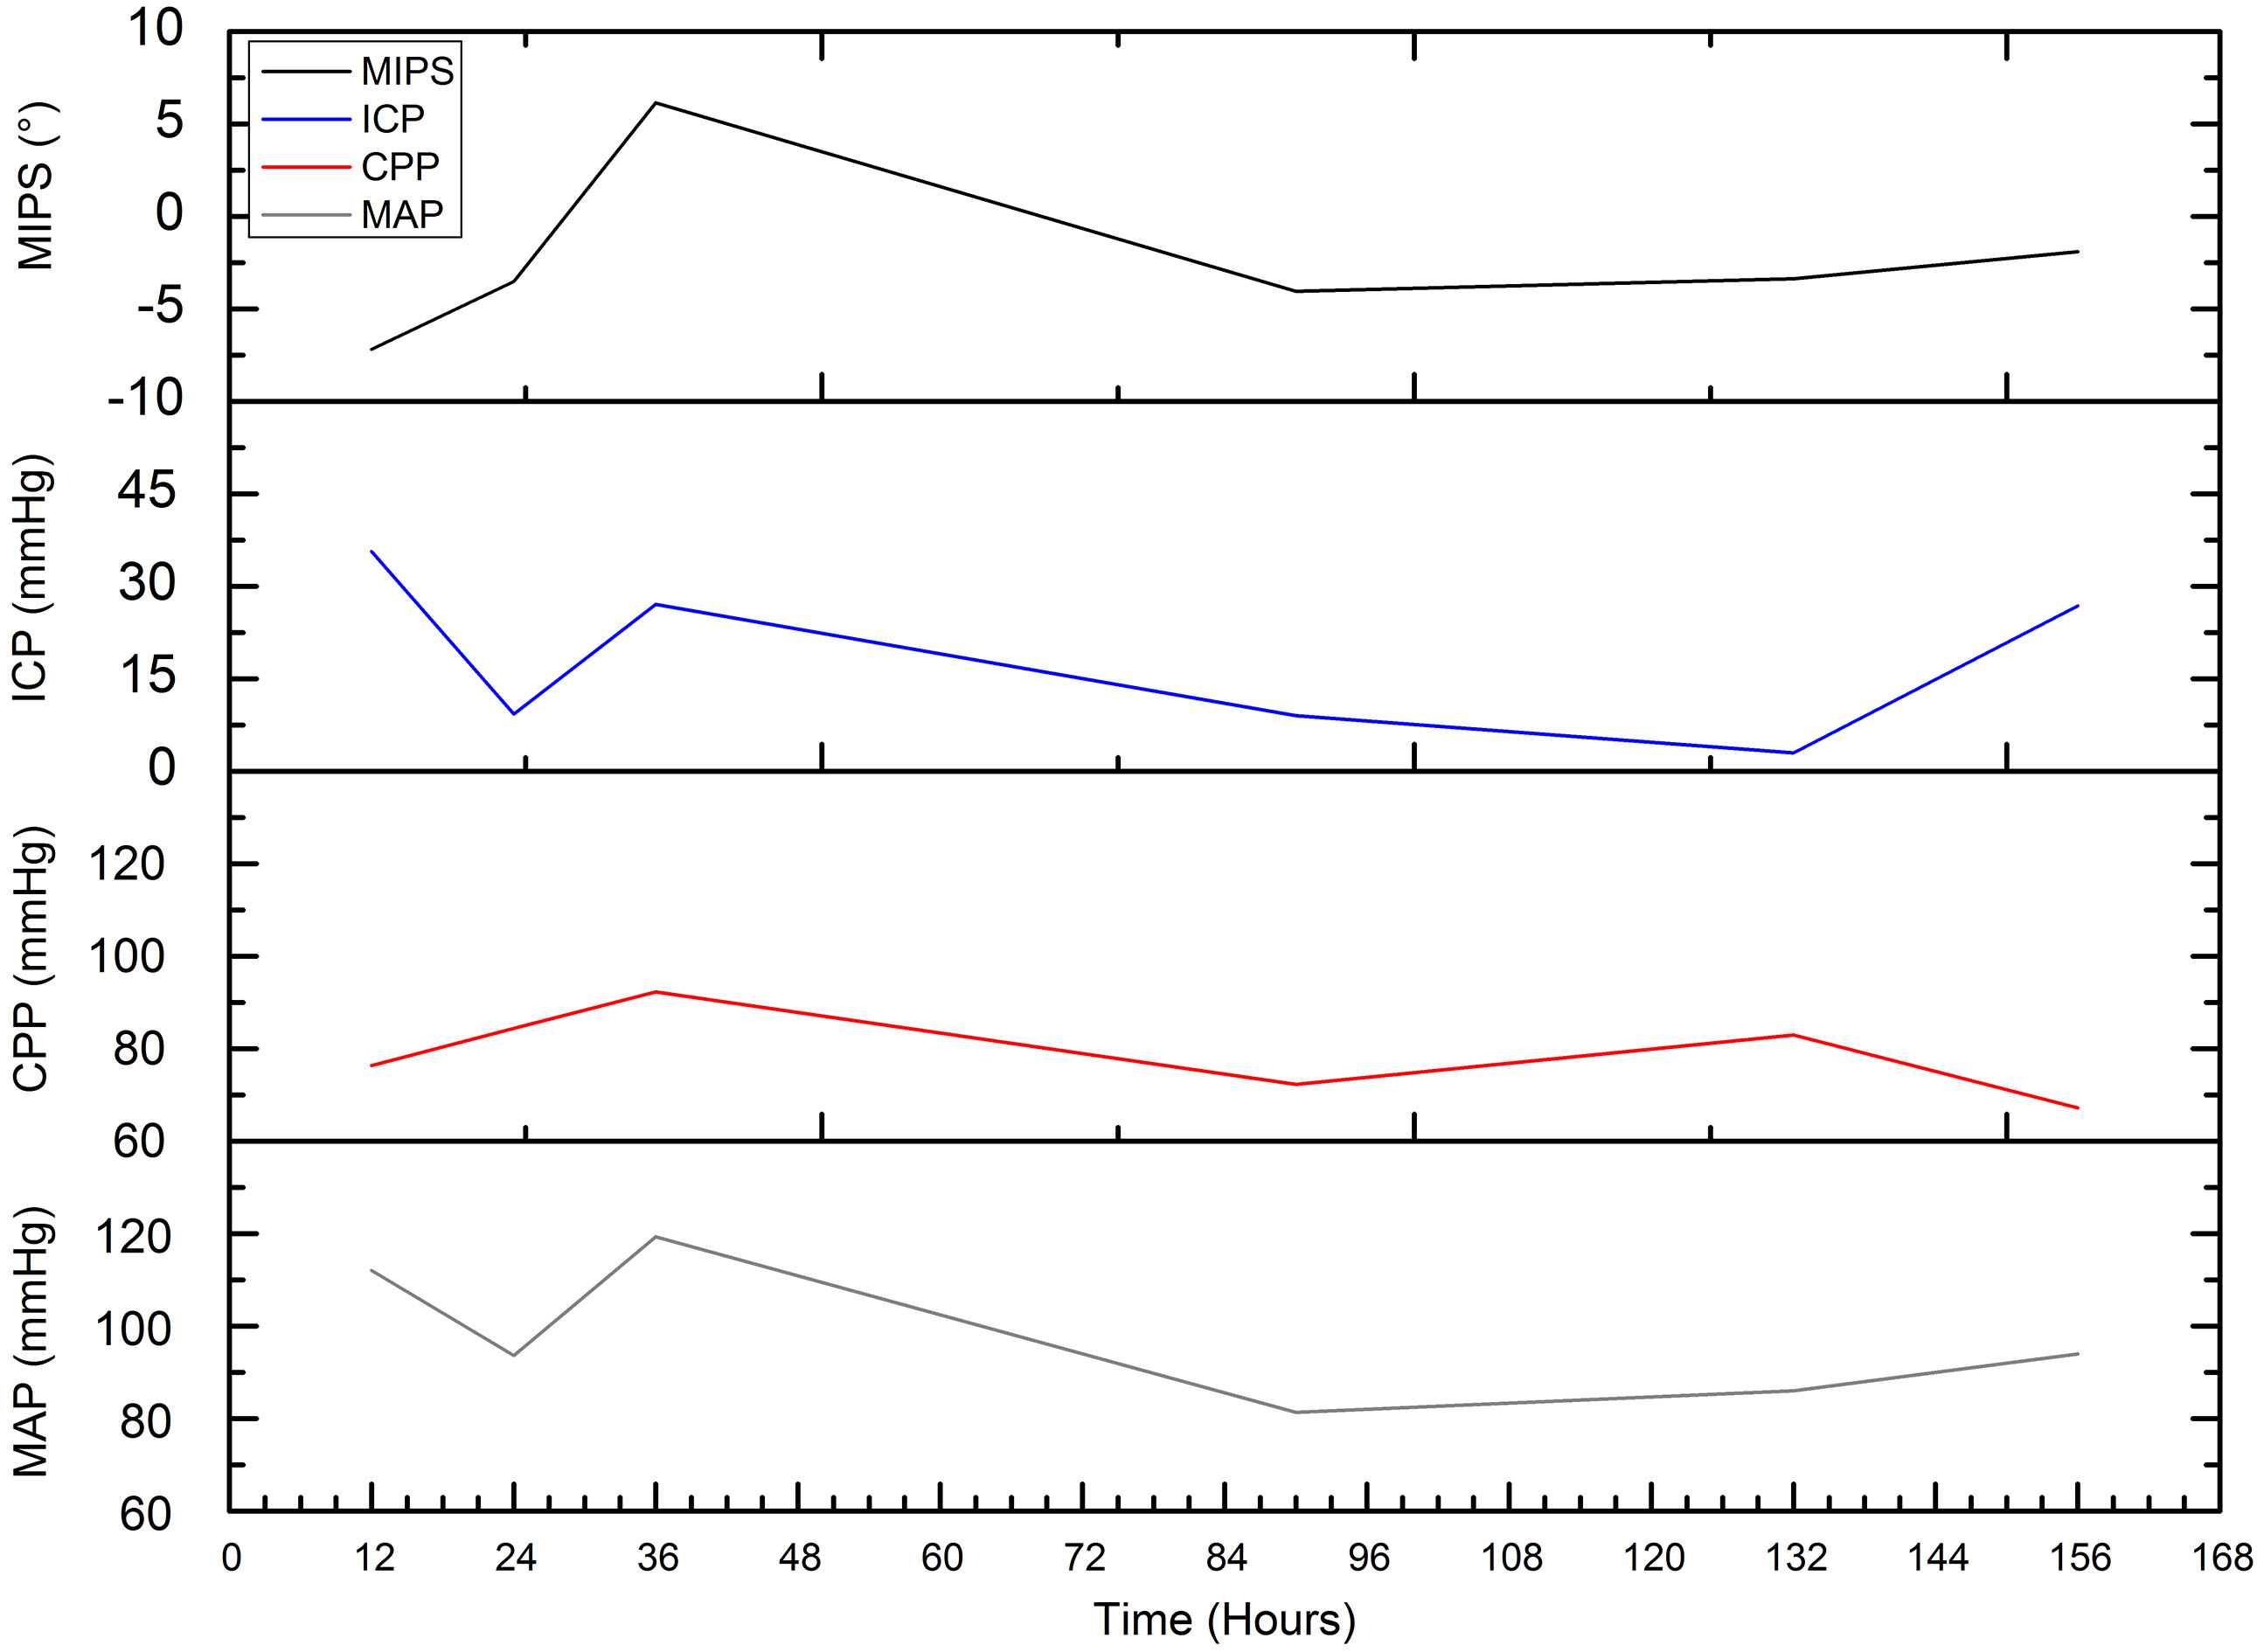
Figure 14.
Comparison of postoperative MIPS, ICP, CPP and MAP in the patient during cerebral edema.
We perform postoperative MIPS monitoring on a patient with subarachnoid hemorrhage. Figure 12 shows the measurement results of MIPS value for 10 minutes each time. The value of MIPS fluctuates sharply due to pathological reasons, which is different from that of healthy patients. After the operation, MIPS reduce by 3.51
4.Conclusions
In this study, a highly sensitive measurement system is established, which can be used to monitor the changes of brain conductivity caused by cerebral edema. We design a wearable sensor that can be used in human experiment. The feasibility of measuring cerebral edema with this system is verified by physical experiments and breath holding experiments. In order to observe the changes of brain conductivity in healthy volunteers, MIPS values of 13 healthy young people are monitored in this study as a control in subsequent clinical trials.
In this experiment, a new sensor is used to monitor the changes of electrical conductivity of human brain under physiological and pathological conditions. Sensor is placed on both sides of the skull to obtain a highly sensitive signal. When the middle arteries are blocked, the change of conductivity in the cerebral infarction area can be directly collected by the sensor in this position. Considering the safety and reliability of human body measurement, the system uses a 15.1 MHz, safety and low-frequency and single-frequency electromagnetic signal as excitation signals. We also find a significant difference in MIPS values between healthy people and edema patients, which is consistent with Gonzalez’s research result [13]. Unlike their use of the 26 MHz–39 MHz band to distinguish, we have achieved this with single lower-frequency signal and without any complicated pattern recognition methods. For human body test, however, the detection depth of the sensor is not confirmed and needs to be evaluated in subsequent clinical monitoring.
In the study, we measure the phase linearity and the phase drift that are most concerned about, but other parameters of the system are not measured. Although the preliminary results of the experiment are good, we find that the human body movement has a great influence on the measurement results and needs to remove the motion artifacts manually. At the same time, when the sensor is unloaded, the center frequency of measurement shift, so impedance matching of the sensor is required. On the other hand, the study selects young healthy volunteers aged 22 to 35, not including the middle-aged and the elderly people, and also without analyzing the correlation between MIPS value and variables such as gender, cranial circumference, heart rate and respiratory rate. The number of samples of this experiment is small. Subsequent research needs to expand the number of subjects and simultaneously detect other parameters.
Through this study, we find that the MIPS values of healthy people are at the same stable level, and preliminarily verify that the system can be used for cerebral edema monitoring. In the process of measuring healthy volunteers, the difference of MIPS is largely related to the repeatability of the coil position and the system phase drift. Patient with cerebral edema has lower and more volatile MIPS compared to healthy volunteers, that is similar to the results of previous animal experiments [17]. The results shows that the change of MIPS in patient with edema are closely related to intracranial lesions. After surgery, the patient’s ICP increases while MIPS moves down due to edema and hydrocephalus. Later, treatment reduces intracranial pressure, thus may also cause slight increase in MIPS. 36 hours after surgery, ICP hit peak value caused by severe edema. The MIPS increase, which may owe to ventricle drainage (exhausting bloody liquid 180 ml). The high pressure reduces the cerebral blood flow. Under sympathetic regulation, the heart rate is accelerated and the MAP and CPP are increased to motivate blood supply. After that, ICP decrease, blood supply is stable, so do MAP and CPP. In our opinion, at this time, the reduction of MIPS is caused by the edema and hydrocephalus.
The study also finds that there are significant differences in MIPS in the simulation experiment of edema and bleeding salt solution, but patients often have both edema and hemorrhage in the course of pathological changes, and the identification of stroke type still needs to be studied. However, this study includes only one patient with edema. Further research needs to expand the clinical subjects and study the effectiveness of edema identification by comparing clinical imaging method.
Acknowledgments
This work was sponsored by the National Natural Science Foundation of China (Nos. 51607181, 61801483), China Postdoctoral Science Foundation (No. 2017M613316) and Natural Science Foundation of Chongqing, China (No. cstc2018jcyjAX0671). The funders had no role in the study design, data collection and analysis, decision to publish, or preparation of the manuscript.
Conflict of interest
None to report.
References
[1] | Lee KR, Kawai N, Kim S, et al. Mechanisms of edema formation after intracerebral hemorrhage: effects of thrombin on cerebral blood flow, blood-brain barrier permeability, and cell survival in a rat model[J]. Journal of Neurosurgery, (1997) ; 86: (2): 272. DOI: 10.3171/jns.1997.86.2.0272. |
[2] | Wykes V, Vindlacheruvu R. Intracranial pressure, cerebral blood flow and brain oedema[J]. Surgery, (2015) ; 33: (8): 355-362. DOI: 10.1016/j.mpsur.2015.06.001. |
[3] | Shao Q, Sun XY, Ding LS, et al. Invasive intracranial pressure monitoring in craniocerebral trauma[J]. Journal of Clinical Neurosurgery, (2018) . |
[4] | Morton R, Ko A, Browd SR, et al. Intracerebral abscess associated with the Camino intracranial pressure monitor: case report and review of the literature[J]. Neurosurgery, (2012) ; 71: (1): 193-8. DOI: 10.1227/NEU.0b013e318232e250. |
[5] | Chen M, Yan Q, Sun J, et al. Investigating the Relationship between Cerebrospinal Fluid and Magnetic Induction Phase Shift in Rabbit Intracerebral hematoma expansion Monitoring by MRI[J]. Scientific Reports, (2017) ; 7: (1): 11186. DOI: 10.1038/s41598-017-11107-1. |
[6] | Behrens A, Lenfeldt N, Ambarki K, et al. Transcranial Doppler pulsatility index: not an accurate method to assess intracranial pressure[J]. Neurosurgery, (2010) ; 66: (6): 1050-1057. DOI: 10.1227/01.NEU.0000369519.35932.F2. |
[7] | Robertson CS, Gopinath S, Chance B. Use of near infrared spectroscopy to identify traumatic intracranial hemotomas[J]. Journal of Biomedical Optics, (1997) ; 2: (1): 31-41. DOI: 10.1117/12.261680. |
[8] | Kanti BT. Bioelectrical Impedance Methods for Noninvasive Health Monitoring: A Review:[J]. J Med Eng, (2014) ; 2014: (2014): 1-28. DOI: 10.1155/2014/381251. |
[9] | Griffiths H. Magnetic induction tomography[J]. Journal of Communications Technology and Electronics, (2001) ; 12: (8): 1126. DOI: 10.1088/0957-0233/12/8/319. |
[10] | Netz J, Forner E, Haagemann S. Contactless impedance measurement by magnetic induction – a possible method for investigation of brain impedance[J]. Physiological Measurement, (1993) ; 14: (4): 463. |
[11] | González CA, Rubinsky B. The detection of brain oedema with frequency-dependent phase shift electromagnetic induction[J]. Physiological Measurement, (2006) ; 27: (6): 539-552. DOI: 10.1088/0967-3334/27/6/007. |
[12] | Gonzalez CA, Horowitz L, Rubinsky B. In Vivo Inductive Phase Shift Measurements to Detect Intraperitoneal Fluid[J]. IEEE Trans Biomed Eng, (2007) ; 54: (5): 953-956. DOI: 10.1109/TBME.2006.889183. |
[13] | Gonzalez CA, Valencia JA, Mora A, et al. Volumetric Electromagnetic Phase-Shift Spectroscopy of Brain Edema and Hematoma[J]. Plos One, (2013) ; 8: (5): e63223. DOI: 10.1371/journal. pone.0063223 |
[14] | Kellner CP, Sauvageau E, Snyder KV, et al. The VITAL study and overall pooled analysis with the VIPS non-invasive stroke detection device[J]. Journal of NeuroInterventional Surgery, 2018:neurintsurg-2017-013690. |
[15] | Hasgall PA, Di Gennaro F, Baumgartner C, Neufeld E, Lloyd B, Gosselin MC, Payne D, Klingenböck A, Kuster N, IT’IS Database for thermal and electromagnetic parameters of biological tissues, Version 40. www.itis.ethz.ch/database. (2018) . |
[16] | Oziel M, Hjouj M, Gonzalez C, et al. Non-ionizing radiofrequency electromagnetic waves traversing the head can be used to detect cerebrovascular autoregulation responses[J]. Scientific Reports, (2016) ; 6: . DOI: 10.1038/srep21667. |
[17] | Li G, Ma K, Sun J, et al. Twenty-Four-Hour Real-Time Continuous Monitoring of Cerebral Edema in Rabbits Based on a Noninvasive and Noncontact System of Magnetic Induction[J]. Sensors, (2017) ; 17: (3): 537. DOI: 10.3390/s17030537. |


