
Tumor cell pH detection based on CdSe quantum dots’ fluorescence charateristics
Abstract
The incidence of cancers has increased year by year and the early diagnosis for cancer is important to prevent cancers. Due to abnormal metabolism of tumor cells, the acidification of extracellular environment is an important feature for cancer cells. To achieve efficient and accurate pH measurement, this paper proposes a new detection method based on the fluorescence characteristics of CdSe quantum dots detection, which uses CdSe QDs with unique optical properties as sensitive substances for pH detection. PBS buffer (0.2 mol/L) with different pH has been used to simulate cell metabolites at different pH values and use 365 nm laser source to excite mixture liquid. The emitted light was detected by a fluorescence detection device. A mathematical model between fluorescence intensity and pH was finally obtained. The experimental results show the method show better effectiveness than other pH detection methods and has a high resolution of 0.037 within a pH range of 6.1–7.8 and a measurement resolution of 0.037 pH units. This method has high temperature stability and short testing time, which shows high potential for pH detection. This method has its superiority in all the testing methods. It exhibits a new way of generalizing to pH detection.
1.Introduction
In recent years, as the incidence of cancer increases year by year, early diagnosis of cancer becomes more important. The extracellular environment becomes acidified because more lactic acid is produced by metabolism and excreted into the extracellular environment [1]. Therefore, acidification in the extracellular environment is one of the important features to measure whether normal cells become cancer cells. According to relevant clinical data, the vast majority of tumors has an extracellular pH of 6.0 to 7.0, which is much lower than normal cells (from 7.3 to 7.4). The reason is that rapid proliferation of tumors leads to an insufficient supply of oxygen and the accumulation of acidic substances [2]. Therefore, real-time monitoring for the pH and environmental changes of cancer cells can reveal whether the cells have become cancerous and can provide important quantitative prior information for the early diagnosis and treatment of cancer.
At present, common methods include magnetic resonance spectroscopy, chemical exchange saturated transfer, amide proton transfer, microelectrode, fiber color modulation and fluorescence spectroscopy [3]. Among them, magnetic resonance spectroscopy, chemical exchange saturated transfer and amide proton transfer are magnetic resonance imaging (MRI) measurements. The measurement accuracy is low and MRI can only measure one pH unit. Microelectrode method is an electrochemical method and the accuracy is higher than MRI. However, the method also has some problems such as complicated operation, low reuse rate, long measurement time and so on. Fiber color modulation method has high measurement accuracy but low measurement range (usually can measure only one pH unit) and the cost of this method is too much. Fluorescence spectrometry has high measurement accuracy (can measure 0.01 pH unit), high time resolution (with millisecond time accuracy), simple operation technique (without limitation of cell concentration and size) and multi-dimensional measurement of cells, but the measurement range is very small (about 1 pH unit) [4]. Therefore, these pH detection methods can hardly satisfy the needs of tumor cell detection.
Between these pH detection methods, fluorescence spectroscopy is the most promising method. However, its progress mainly depends on the development of fluorescent probes. Common fluorescent probes are mostly various organic dyes, but they have the following disadvantages: (1) Organic dyes have a problem of poor optical stability and organic dyes are easy to photobleach under strong light irradiation. It is also difficult to obtain the signals during the test [5]; (2) The organic dye test results are closely related to the reaction temperature and are greatly influenced by the temperature. So test temperature must be strictly controlled [6]. Therefore, it is imperative to choose better new fluorescent probe materials.
Among the fluorescent probe materials, quantum dots successfully solved the above problems. Semiconductor quantum dots are inorganic nanoparticles with unique photophysical properties and also have some advantages such as excellent light stability, long lifetime, biocompatibility and insensitivity to temperature. Because of these advantages, quantum dots are used as sensors to detect small molecules, monitor DNA hybridization and test enzymatic activity [7]. Besides these, semiconductor quantum dots are also used for biological imaging and sensing [8]. Because of the light advantages, semiconductor quantum dots are used as an efficient photocatalyst to improve photocatalytic performance [9].
This paper proposes a method for measuring pH of metabolites in tumor cells with CdSe quantum dots and fluorescence spectroscopy. The method has a wide range of pH detection (from 6.1 to 7.8). The measurement resolution is 0.037 and it can meet the needs of pH measurement. At the same time, the method is insensitive to temperature. The measurement speed is fast and the testing time is about 10 minutes. The test efficiency is high and the method can achieve rapid measurement for pH of tumor cells.
2.Materials and methods
2.1Materials
Cadmium oxide (CdO, AR), stearic acid (98%), (OA, 99%), selenium powder, octylamine, HAD and diethylzinc (ZnEt2) (Aladdin), TOPO (98%), TOP (95%), poly (acrylic acid) (PAA, molecular weight (MW) 1,800), 1-ethyl-3-[3-dimethylaminoporpyl] carbodiimide hydrochloride (EDC, 98.5%), NHS (98%), Bovine serum albumin (MP Biomedicals Company), Bis sulfide (Tokyo Chemical Industry), Liquid paraffin, chloroform, ethanol, hydrochloric acid (HCl), 2-(4-morpholino) ethanesulfonic acid, Ndimethylformamide, paraformaldehyde, Tween-20 (Sinopharm Chemical Reagent).
2.2Fluorescence spectrophotometer
For the fluorescence detection device, we use the fluorescence spectrophotometer for fluorescence testing. The fluorescence spectrophotometer is Hitachi FL-4600. The detection device has high precision and high sensitivity.
2.3Experimental method
2.3.1Preparation of CdSe quantum dots
In this paper, a highly luminescent CdSe quantum dot-containing ZnS core-shell is made by a pyrolysis method of an organometallic reagent in a coordination solvent at a temperature of 200
2.3.2pH test method
For each test, mix 2
Figure 1.
Quantum dot mixture to be tested.
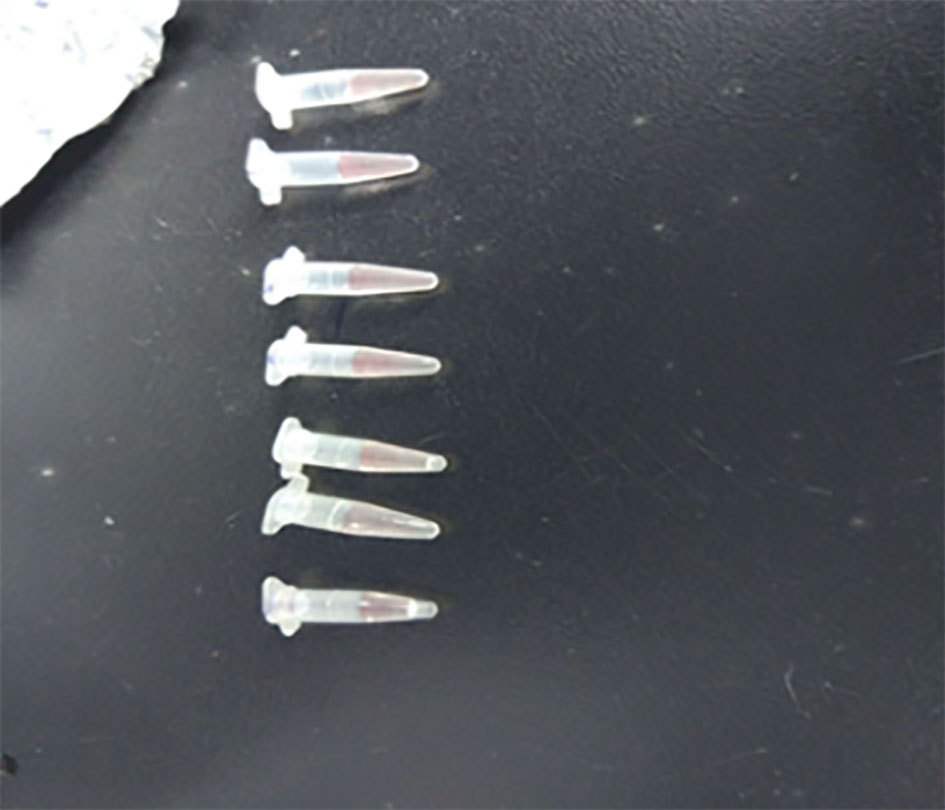
After sufficient reaction, transfer solution to the slit cuvette. The cuvette is placed in the fluorescence test apparatus and continuously irradiated for 10 min by 365 nm ultraviolet laser. The excitation light wavelength is 365 nm. Read data each 1 minute and test for 10 minutes. Finally, record the fluorescence intensity.
2.3.3Temperature characteristics test
Because the traditional organic solvent is greatly affected by temperature, as an excellent pH-testing material-quantum dot, we investigate the influence of temperature on the performance of the quantum dot test. Due to temperature, it is difficult to perform extremely precise control during the actual experimental operation. The experiments are carried out on four groups of buffers with pH of 6, 6.5, 7 and 7.5 respectively at different temperatures. Each group of buffers is measured at three temperatures of 4
3.Results and analysis
3.1Fluorescence data processing
The wavelength of light absorbed by CdSe quantum dots in paper is 365 nm and the wavelength of the fluorescence spectrum is about 625 nm. The fluorescence spectrum of the quantum dots is analyzed by using the fluorescence detection device. The synthesized quantum dots show strong fluorescence in Fig. 2. With the signal and narrow emission spectra, CdSe QDs synthesized by this method have narrow particle and normal size.
Figure 2.
Quantum dots fluorescence spectroscopy.
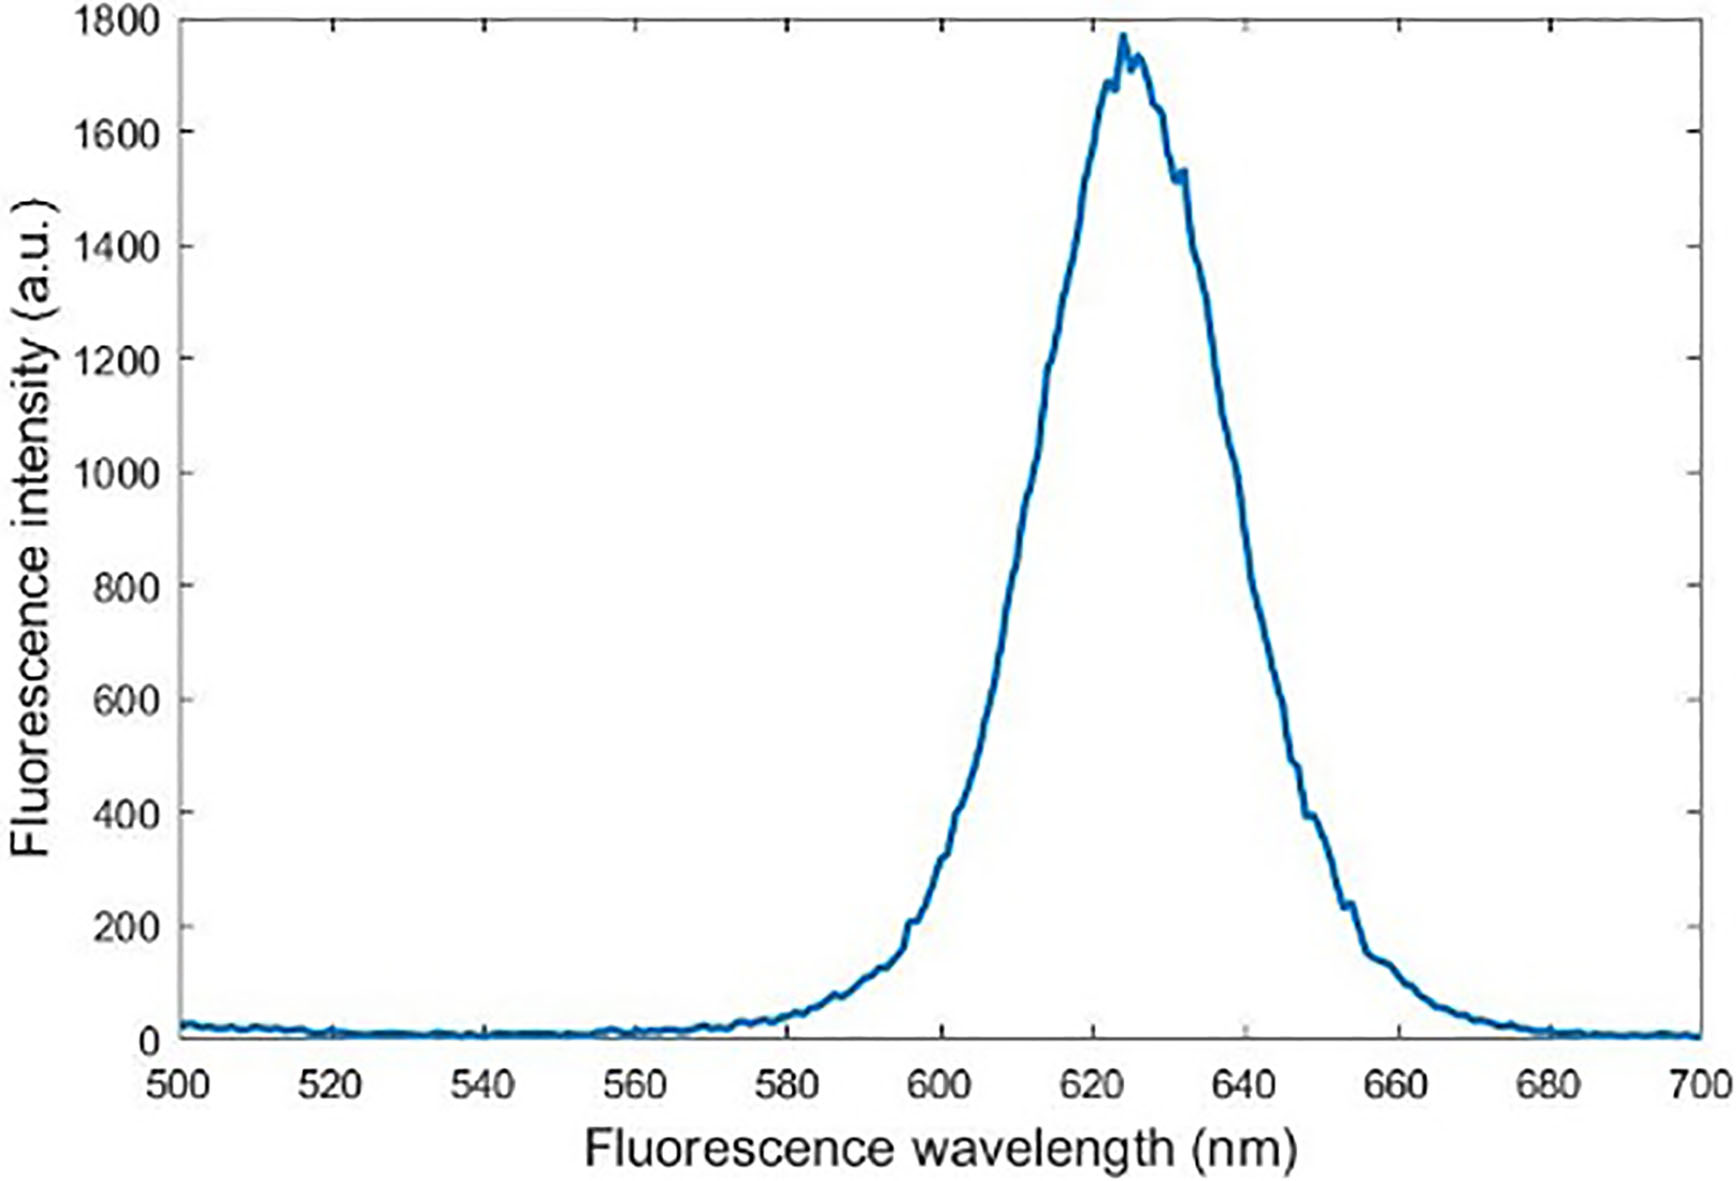
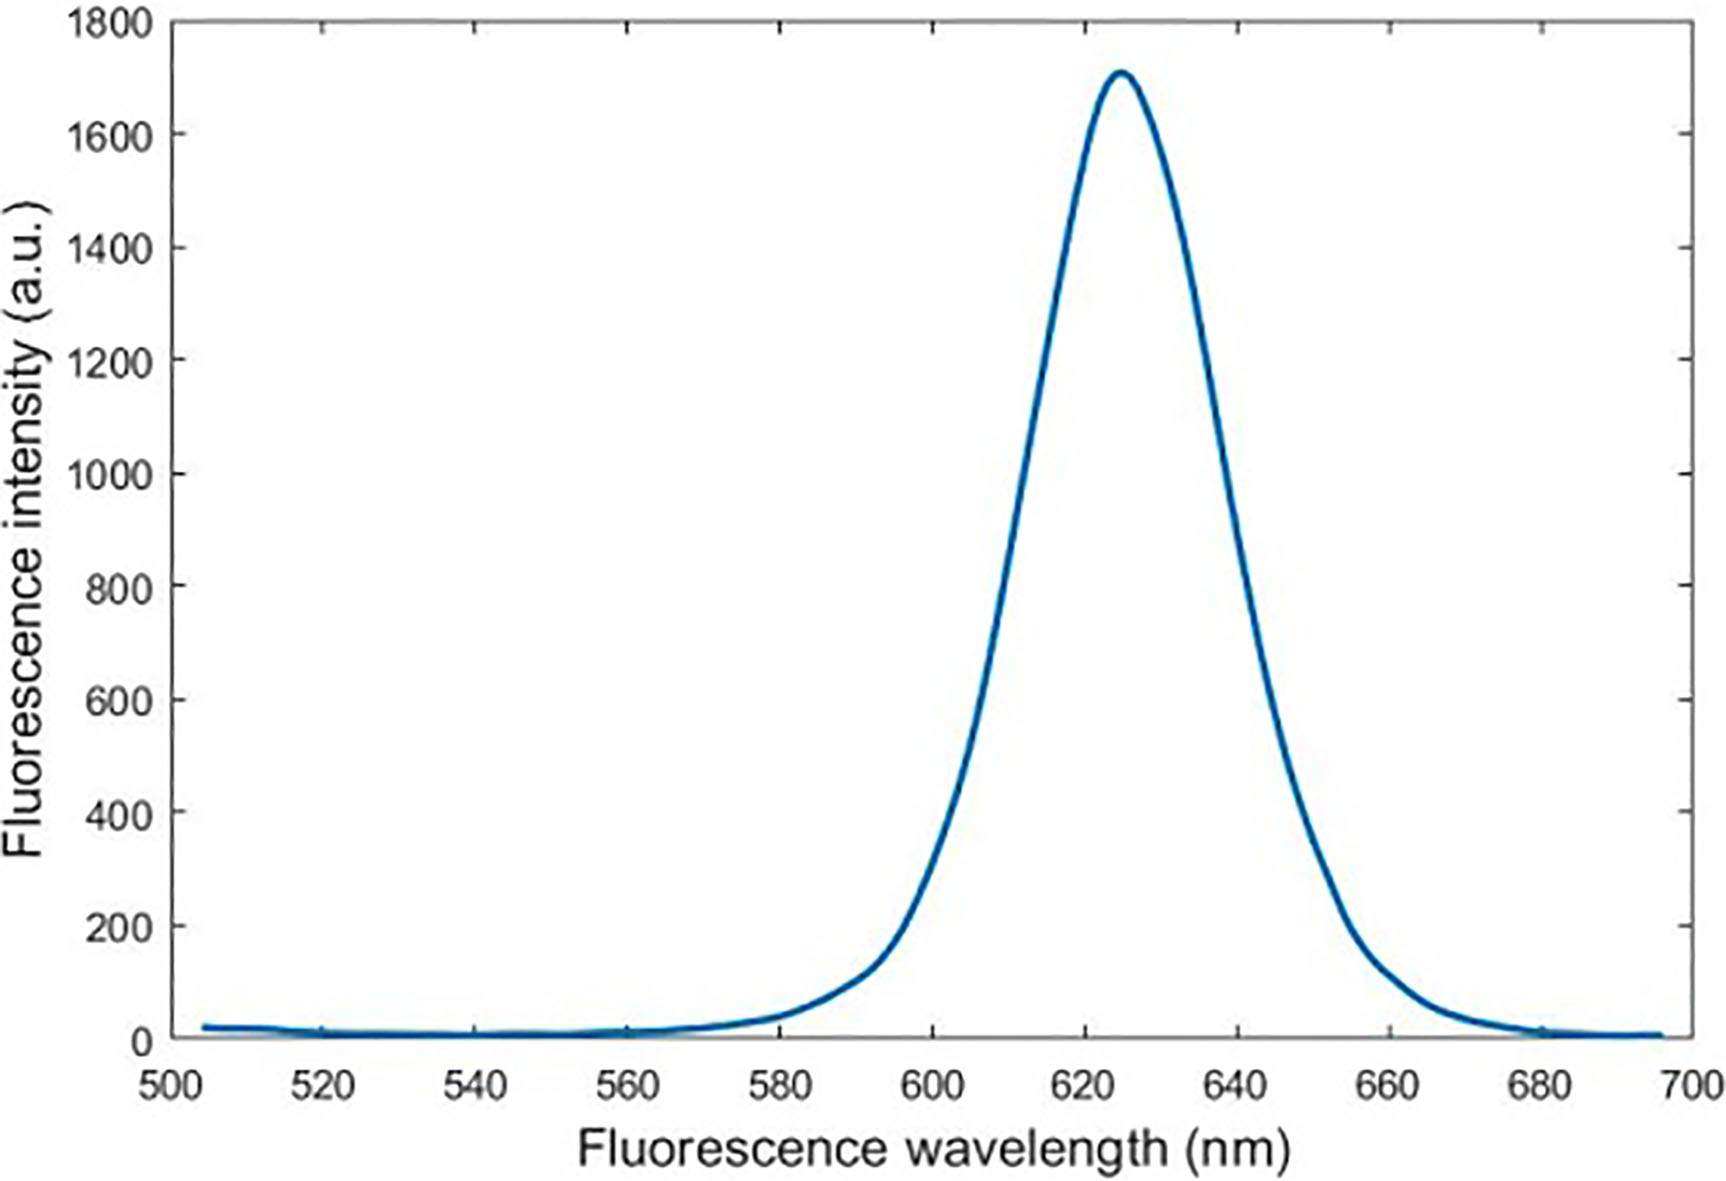
Figure 3.
Moving average filtered fluorescence spectra of quantum dots.
Because the quantum dot fluorescence intensity at 625 nm is the largest and the data is the most accurate and easy to analyze, the fluorescence intensity data used in this test is derived from the fluorescence intensity data at 625 nm in the QD photoluminescence spectrum.
Because fluorescence spectrum obtained by fluorescence detection device still has noise, to obtain a more accurate fluorescence emission peak of the quantum dot, use a moving average filter to perform filtering to obtain the emission peak of the quantum dot accurately and the result is shown in Fig. 3.
3.2pH results
The raw data for the 10 minutes test is shown in Table 1.
Table 1
The raw data for the 10 minutes test
| pH | The fluorescence intensity (a.u) | Average | ||||||
|---|---|---|---|---|---|---|---|---|
| 1 | 2 | 3 | 4 | 5 | 6 | 7 | value | |
| 6.13 | 1546 | 1562 | 1488 | 1496 | 1502 | 1498 | 1522 | 1516 |
| 6.22 | 1597 | 1600 | 1612 | 1578 | 1623 | 1589 | 1622 | 1603 |
| 6.33 | 1895 | 1885 | 1864 | 1905 | 1882 | 1903 | 1917 | 1893 |
| 6.4 | 1998 | 1969 | 1907 | 1911 | 1960 | 1956 | 1948 | 1950 |
| 6.5 | 1998 | 2037 | 2039 | 2063 | 2053 | 2001 | 2026 | 2031 |
| 6.65 | 2077 | 2063 | 2016 | 2027 | 2018 | 2047 | 2022 | 2039 |
| 6.75 | 2127 | 2148 | 2156 | 2187 | 2150 | 2108 | 2207 | 2155 |
| 6.9 | 2170 | 2112 | 2254 | 2148 | 2206 | 2148 | 2168 | 2172 |
| 7 | 2221 | 2234 | 2290 | 2265 | 2292 | 2267 | 2218 | 2255 |
| 7.15 | 2366 | 2610 | 2571 | 2554 | 2445 | 2477 | 2487 | 2501 |
| 7.3 | 2635 | 2577 | 2578 | 2639 | 2640 | 2698 | 2658 | 2632 |
| 7.58 | 2889 | 2844 | 2731 | 2717 | 2683 | 2743 | 2689 | 2757 |
| 7.67 | 3069 | 3054 | 2997 | 2962 | 2976 | 3028 | 3014 | 3014 |
| 7.8 | 3888 | 3940 | 3897 | 3835 | 3789 | 3763 | 3783 | 3842 |
| 7.9 | 3650 | 3677 | 3589 | 3700 | 3679 | 3623 | 3625 | 3649 |
| 8 | 3422 | 3448 | 3389 | 3500 | 3484 | 3427 | 3422 | 3442 |
| 8.2 | 3200 | 3222 | 3299 | 3188 | 3233 | 3212 | 3216 | 3224 |
The average value of test data for 10 minutes is calculated as the fluorescence intensity at the corresponding pH value. Figure 4 shows the test results of pH ranging from 6.1 to 8.2.
Figure 4.
Experimental results.
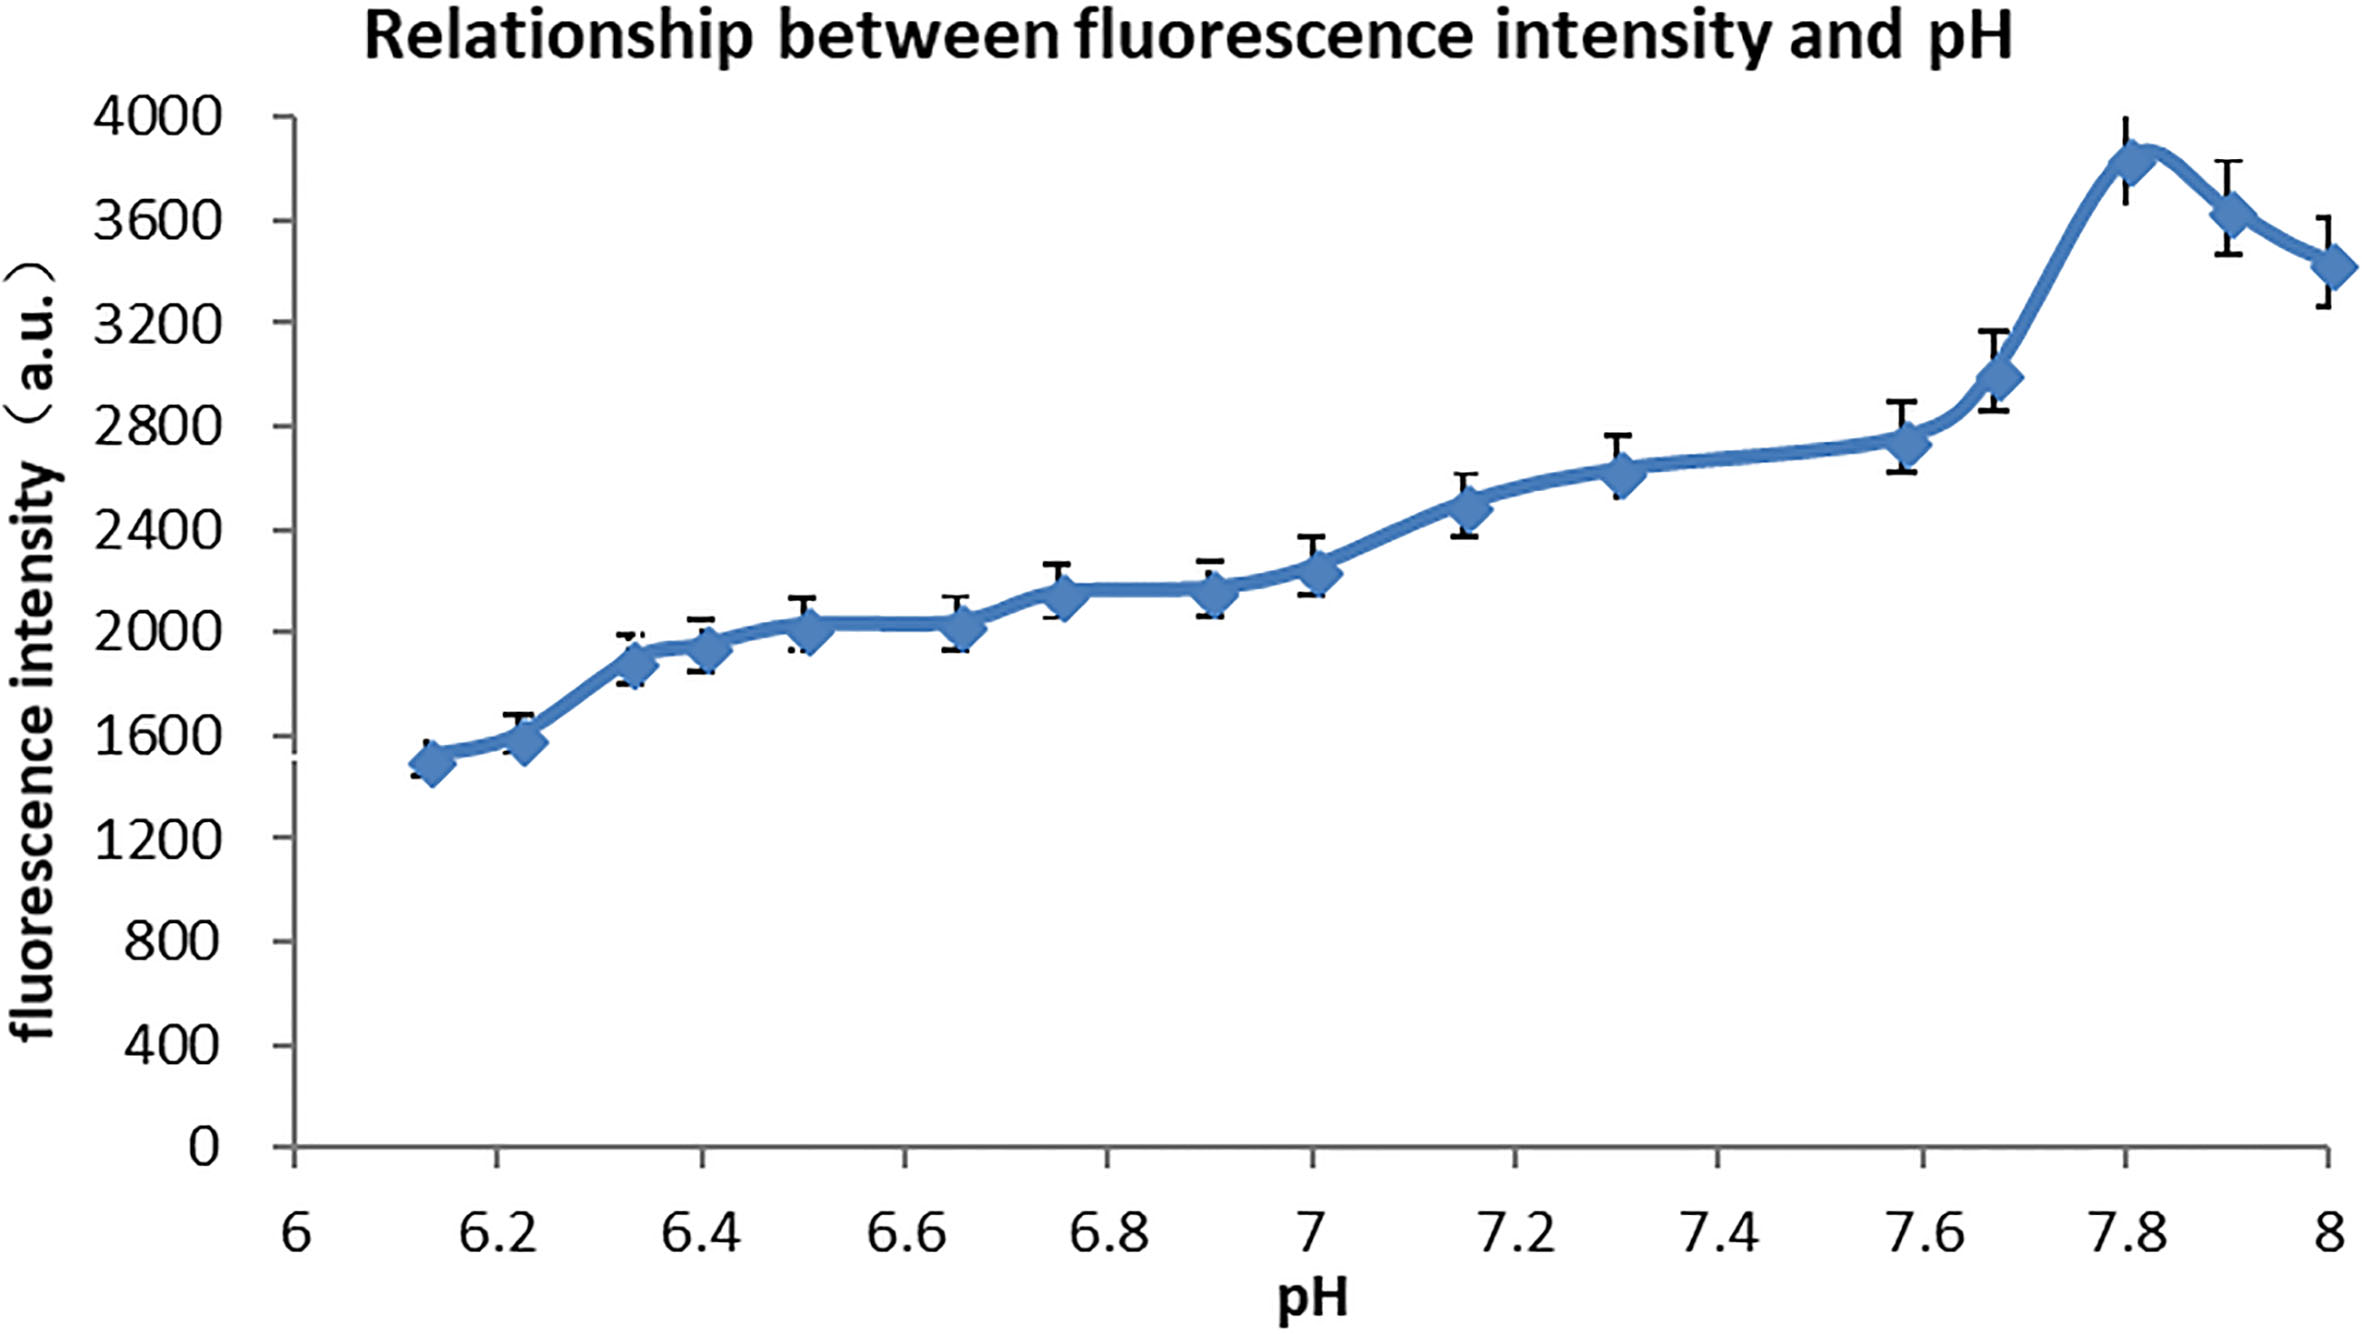
While the pH value of the solution is between 6.1 and 7.8, the fluorescence intensity of the quantum dots increases gradually with the increase of the pH value. At pH
The reason is that the stabilizer on the surface of the quantum dot is affected by the change of hydrogen ions in the solution. The quantum dots prepared in paper are in an optimal stable state when the pH is close to 7.8, so the overall fluorescence intensity is the highest when pH decreases. When it increases, the surface stabilizer changes and the defect is weakened, the fluorescence intensity is weakened.
Table 2
Data of experiments under different temperatures
| Temperature ( | pH | pH | pH | pH |
|---|---|---|---|---|
| 4 | 1648 | 2105 | 2300 | 2866 |
| 17 | 1502 | 2000 | 2255 | 2759 |
| 25 | 799 | 1635 | 1897 | 2657 |
The quantum dot reaches the maximum fluorescence intensity at pH
Figure 5.
pH
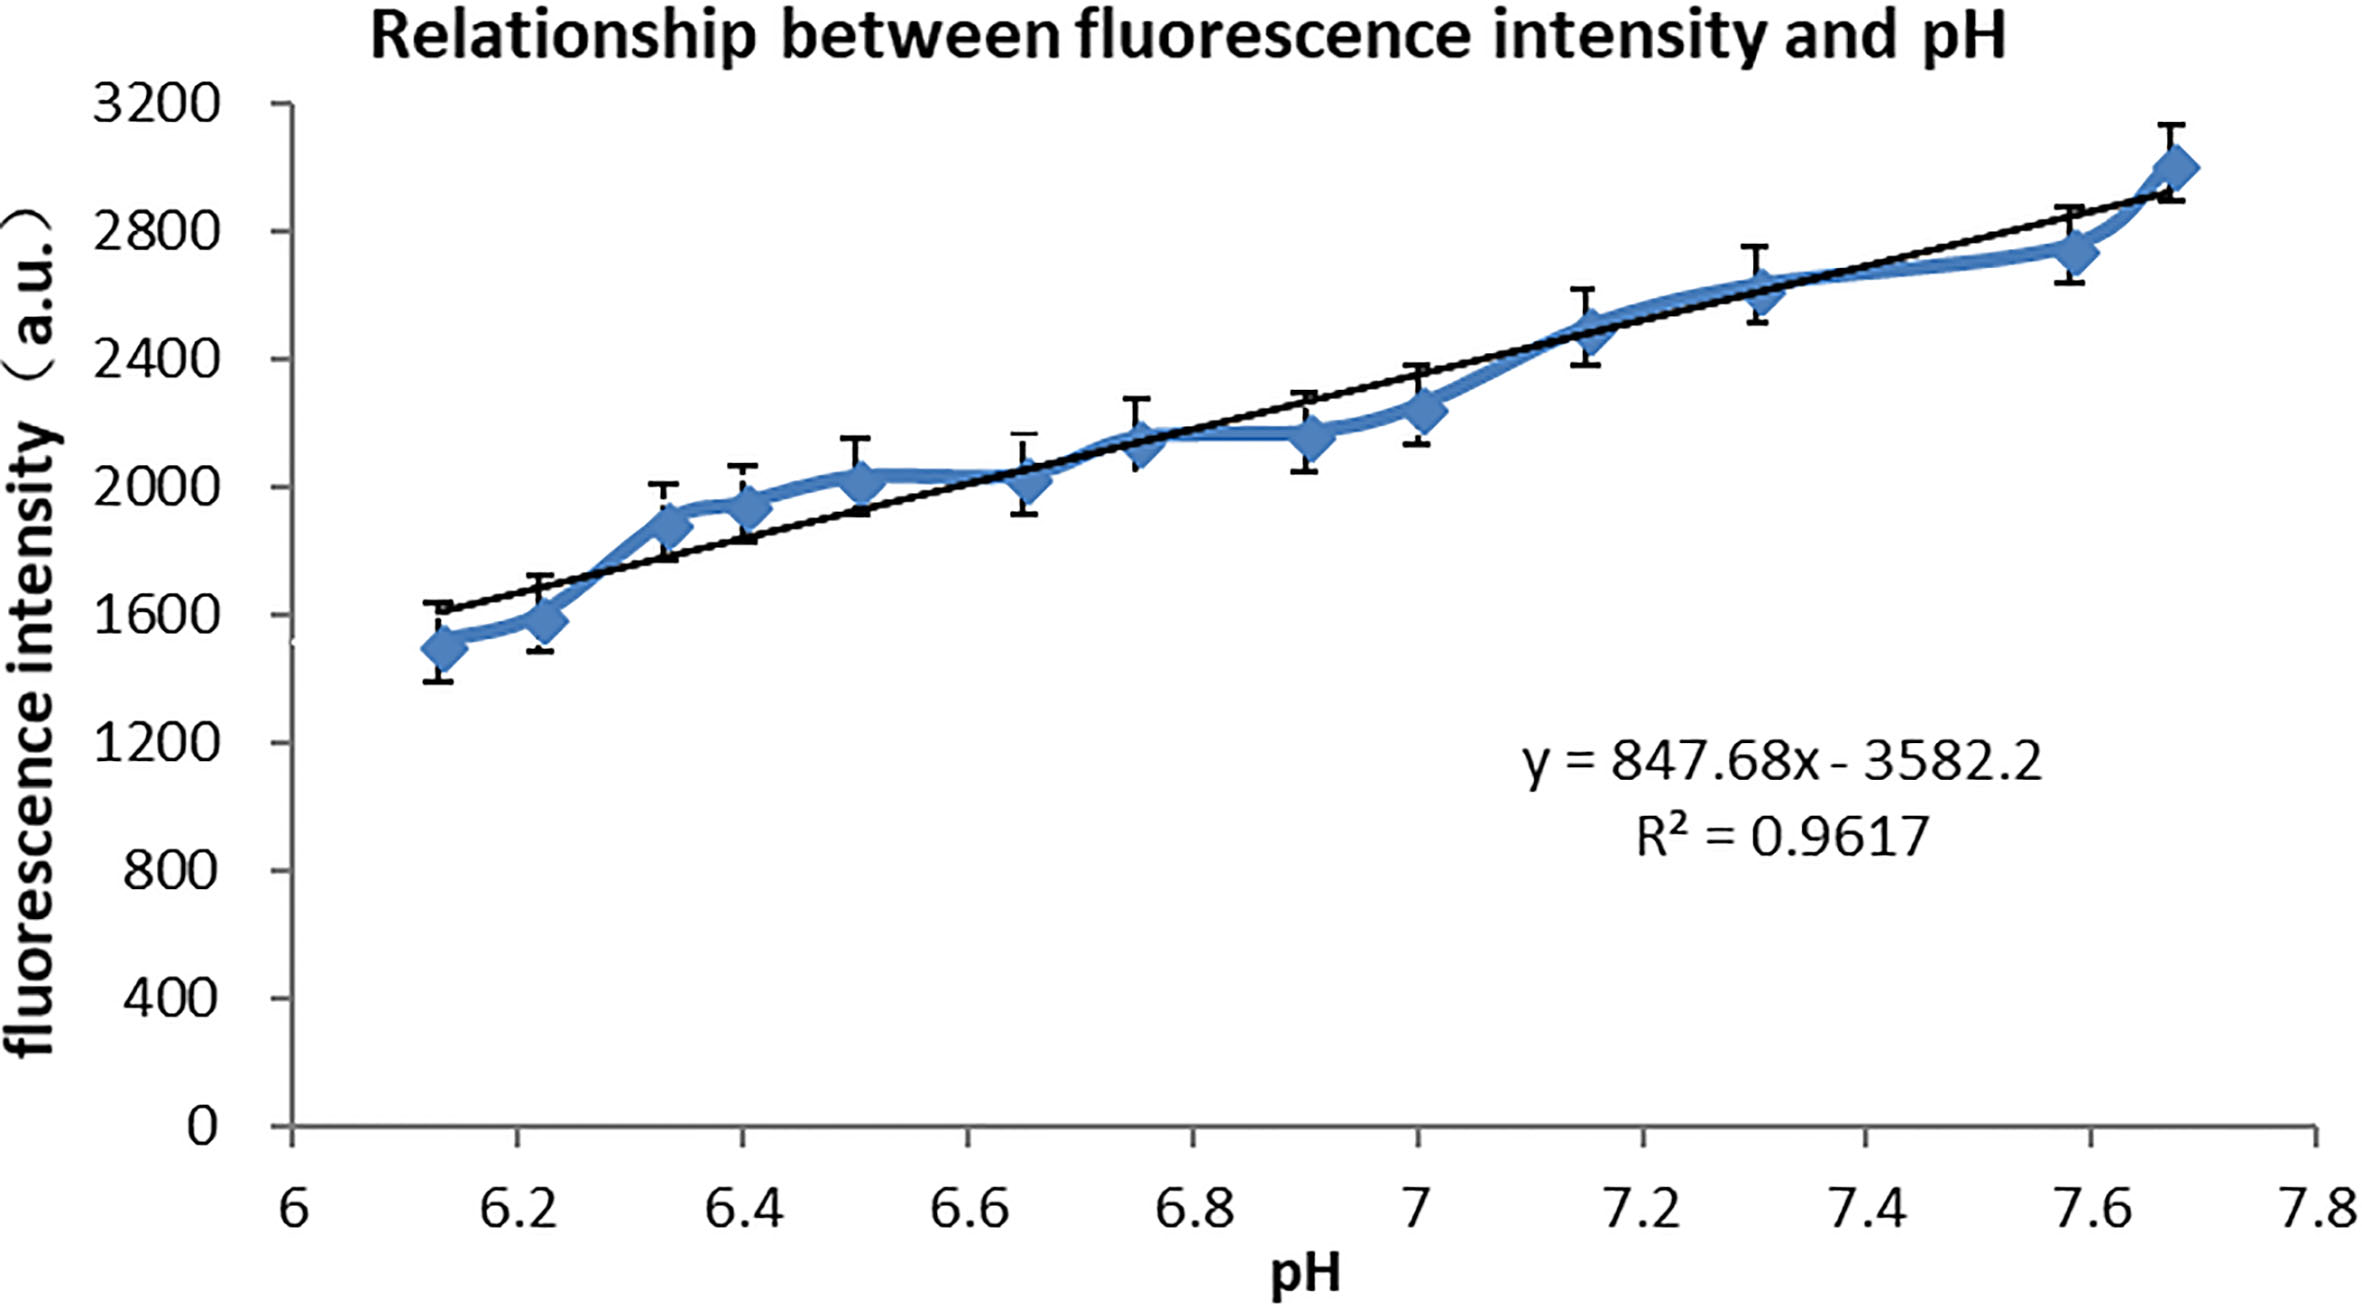
At this point, the mathematical model R
The linear fitting results of pH
According to literature research, fluorescence sensitivity of fluorescence spectrometry is about 0.1. So the quantum dot has a higher sensitivity limit and more accurate measurement than organic solvents [13].
According to the experimental process, the quantum dot reaction process can reach the millisecond level. The time required for the whole experimental operation process is around 10 minutes. It can measure the pH of tumor cells quickly. Fluorescence spectroscopy by using an organic solvent needs at least 10 minutes to finish the test. If this operation become more automatically, the test time will continue to be shortened [14].
3.3Temperature impact test results and analysis
The results show that during the temperature rise from 20
Figure 6.
Temperature characteristics at pH values.
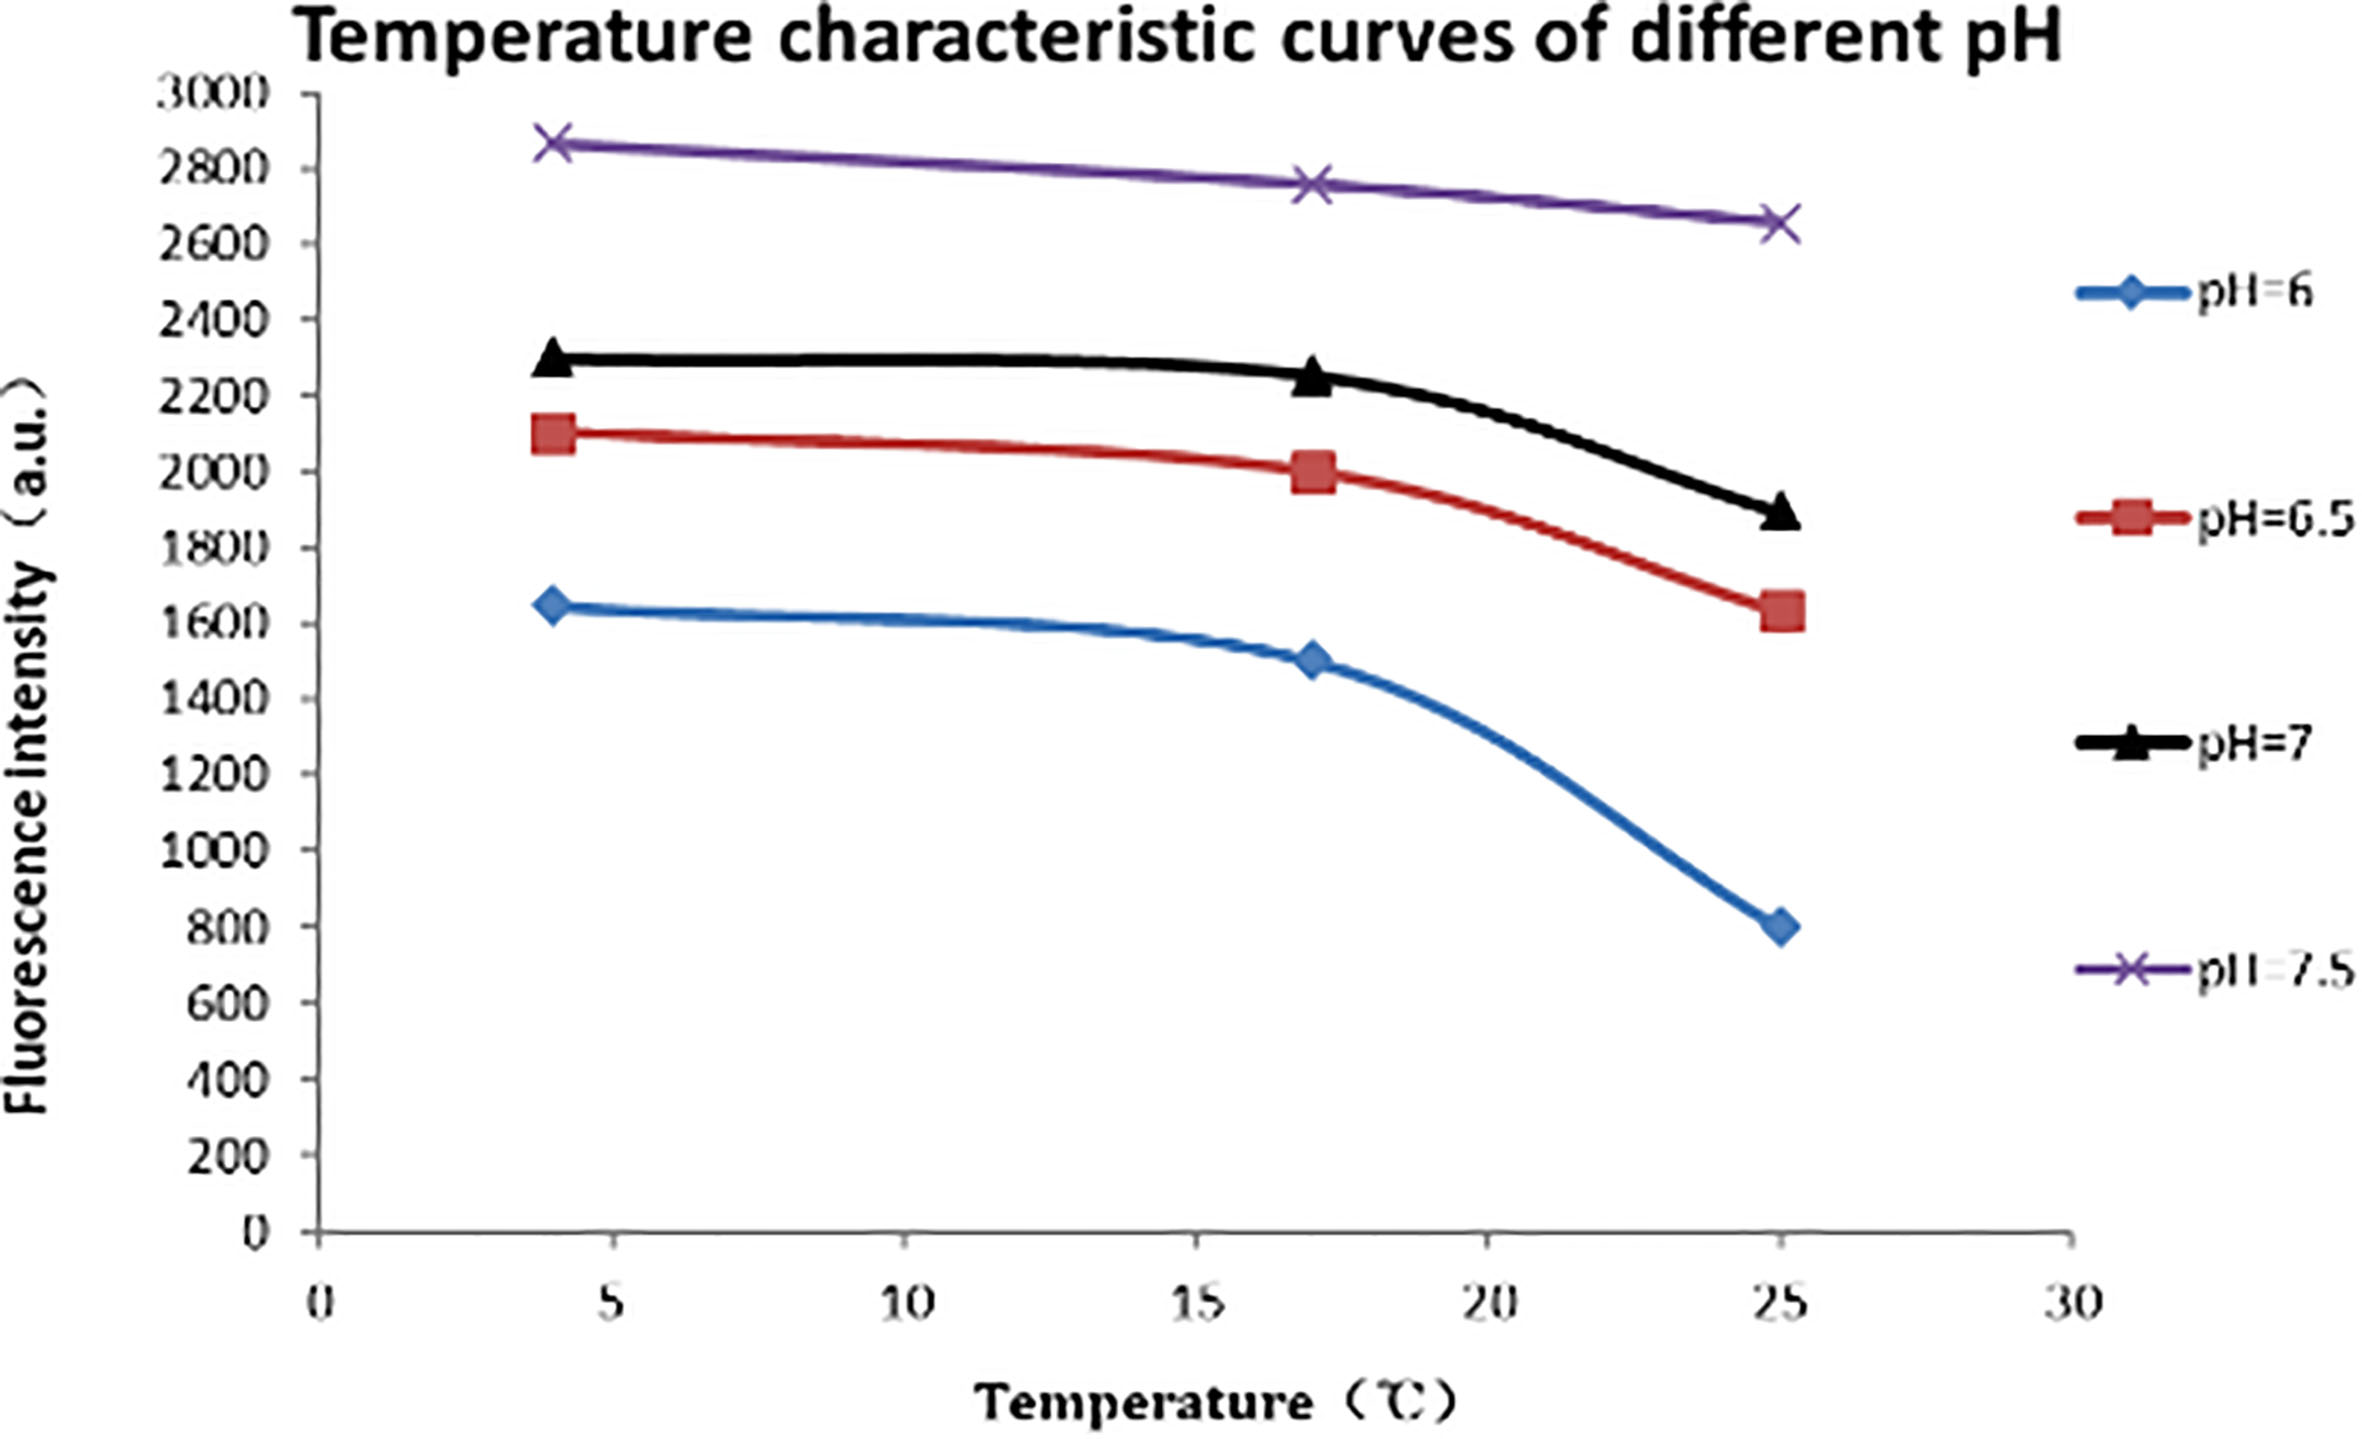
After linear fitting, we find that the fluorescence intensity of CdSe quantum dots shows a slight decrease when the temperature increases (in Fig. 6). Temperature coefficient is approximately
4.Discussion
4.1Mechanism analysis of pH influence on quantum dots fluorescence intensity
The photoluminescence mechanism of quantum dots is that the low-level electrons of quantum dots are excited by excitation light [16]. The surface modification of quantum dots has a large number of stabilizers. When a physical or chemical reaction causes a change in the surface properties of a quantum dot, the fluorescence or electrochemiluminescence of the quantum dot changes. So the change of hydrogen ion concentration in the solution easily leads to the loss of the surface stabilizer of the quantum dot. The change of the charge of the surface stabilizer leads to surface defects, which causes the quantum yield of the quantum dot to decrease and the fluorescence intensity to decrease. So the pH of liquid to be tested is finally measured.
4.2The possibility of detecting the pH of cancer cells’ metabolic fluid
Many studies have speculated that hypoxia increases the body’s glucose consumption. The adaptation of cells to the acidic home environment is through the use of a potassium exchanger and other proteins, such as carbonic anhydrase, to regulate the pH upregulation. A decrease in pH can result in a variety of protein and structural abnormalities such as DNA helicase and polymerase which plays important roles in DNA replication.
In addition, the acidic microenvironment can promote tumor invasion. As early as 1965, Warburg proposed that tumor cells can undergo strong anaerobic glycolysis to obtain energy. This way produce a large amount of H
The effective test range of the CdSe quantum dots made by the test preparation is 6.1–7.7 and the test range covers the external environment pH of normal cells and tumor cells. The extracellular environmental metabolic fluid is simulated by using PBS buffers of different pH values and finally the CdSe quantum dots are tested for the pH value of the tumor cells.
4.3The possibility of using quantum dot materials to increase the efficiency of pH testing
In the present method, the time for the experiment is not more than 15 minutes (consisted of continuous laser irradiation for 10 minutes and preparation for 5 minutes). However, in practical applications, since the quantum dot fluorescence intensity is stable at the same pH, the actual test does not require continuous laser irradiation for 10 minutes and we can only use one irradiation to obtain the test result. At the same time, because the experimental preparation is currently manual operation, after we mechanize the operation of the method in the future, we can shorten the time for the experiment to 1–2 minutes. Finally, we can measure pH quickly.
5.Conclusion
In this paper, we propose a pH detection method based on the analysis of fluorescence characteristics of CdSe quantum dots. The experiment results show that the sensitivity limit of the measurement method can reach 0.037 in the range of pH 6.1–7.8, which is better than other methods. At the same time, the method has a fast operation process and good stability. The method can solve the problem that the test results of other methods are unstable. The resolution of the method can reach 0.037 pH unit and it is a relatively excellent result in the relevant measurement methods. The measured pH range perfectly conforms to the external environment metabolites of the cells and tumor cells. The method is less affected by temperature and solves the problem that the traditional dyes of organic fluorescence are more affected by temperature and have poor stability. The method is simple in operation. The local detection time can reach the millisecond level. The time for the experiment only takes 5 minutes and the test speed is fast and the measurement result is stable. In summary, the method can realize the measurement of the extracellular environment metabolic fluid with high precision, high stability and high speed. It also realizes the detection of pH of the tumor cells and can realize the early diagnosis of cancer. So this method has very high practical meaning.
Acknowledgments
This work is supported by the National Natural Science Foundation of China under Grant No. 61503246.
Conflict of interest
None to report.
References
[1] | Vander Heiden MG, Cantley LC, Thompson CB. Understanding the Warburg effect: the metabolic requirements of cell proliferation [J]. Science (2009) ; 324: (5930): 1029-1033. |
[2] | Felber AE, Marie-Hélène D, Leroux JC. pH-sensitive vesicles, polymeric micelles, and nanospheres prepared with polycarboxylates[J]. Advanced Drug Delivery Reviews (2012) ; 64: (11). |
[3] | Wu P, Liang C. Advances in research on pH measurement methods of tissue cells [J]. Int J Med Radiol (2016) Jul; 39: (4): 410-415. |
[4] | Shi XL, Mao GJ, Zhang XB, et al. Rhodamine-based fluorescent probe for direct bio-imaging of lysosomal pH changes[J]. Talanta (2014) ; 130: (130): 356-362. |
[5] | Redy-Keisar O, Huth K, Vogel U, et al. Enhancement of fluorescent properties of near-infrared dyes using clickable oligoglycerol dendrons[J]. Org Biomol Chem (2015) ; 13: : 4727-4732. |
[6] | Samouilov A, Efimova OV, Bobko AA, et al. In vivo proton-electron double-resonance imaging of extracellular tumor pH using an advanced nitroxide probe[J]. Anal Chem (2014) ; 86: : 1045-1052. |
[7] | Françisco M. Raymo Yildiz I. Luminescent chemosensors based on semiconductor quantum dots[J]. Physical Chemistry Chemical Physics (2007) ; 9. |
[8] | Tyrakowski CM, Snee PT. A primer on the synthesis, water-solubilization, and functionalization of quantum dots, their use as biological sensing agents, and present status[J]. Physical Chemistry Chemical Physics (2013) ; 16. |
[9] | Reshak AH. Quantum Dots in Photocatalytic Applications: Efficiently Enhancing Visible Light Photocatalytic Activity by integrating CdO quantum dots as sensitizer[J]. Physical Chemistry Chemical Physics (2017) ; 19: (36): 24915-24927. |
[10] | Jasieniak J, Bullen C, van Embden J, Mulvaney P. Phosphine-free synthesis of CdSe nanocrystals. J Phys Chem B (2005) ; 109: : 20665-20668. |
[11] | Clapp AR, Goldman ER, Mattoussi H. Capping of CdSe–ZnS quantum dots with DHLA and subsequent conjugation with proteins. Nat Protoc (2006) ; 1: : 1258-1266. |
[12] | Mattoussi H, Heine J, Kuno M, Michel J, Bawendi M, Jensen K. Evidence of photo-and electrodarkening of (CdSe) ZnS quantum dot composites. Jpn J Appl Phys (2000) ; 87: : 8526-8534. |
[13] | Bermingham JF, Chen YY, McIntosh RL, Wood AW. A measurement and modeling study of temperature in living and fixed tissue during and after radiofrequency exposure [J]. Bioelectromagnetics (2014) ; 35: (3): 181-91. |
[14] | Kong Y, Chen J, Gao F, Li W, Xu X, Pandoli O, Yang H, Ji J, Cui D. Amultifunctional ribonuclease-A-conjugated CdTe quantum dot cluster nanosystem for synchronous cancer imaging and therapy. Small (2010) ; 6: : 2367-2373. |
[15] | Raghunand N, Mahoney B, van Sluis R, et al. Acute metabolic al2 kalosis enhances response of C3H mouse mammary tumors to the weak base m itoxantrone [J]. Neop Lasia (2001) ; 3: (3): 227-35. |
[16] | Raghunand N, He X, Sluis RV, et al. Enhancement of chemotherapy by manipulation of tumour pH[J]. British Journal of Cancer (1999) ; 80: (7): 1005-1011. |
[17] | Laurencot CM, Kennedy KA. Influence of pH on the cytotoxicity of cisplatin in EMT6 mouse mammary tumor cells [J]. Oncology Research (1995) ; 7: (7-8): 371. |


