
Voluntary wheel running delays brain atrophy in aged mice
Abstract
BACKGROUND:
Physical exercises have been shown to be a surprisingly effective strategy to take advantage of the brain’s natural capacity for plasticity, and prevent brain degeneration in mouse histological studies. In vivo magnetic resonance microscopy (MRM) provides highly resolved anatomical images and allows quantitative assessment of brain atrophy in the aged mouse model.
OBJECTIVE:
The aim of the present study was to investigate, through the effects of 10 weeks voluntary wheel running, the mouse’s brain atrophy.
METHODS:
Sixteen C57BL/6J mice, aged 21 months, were randomized to the exercise or sedentary group. Each mouse was scanned in a 7.0-T MRM scanner at two time points: 22 months old baseline and a follow-up three months later. Multi-atlas based brain segmentation approach was used to obtain volumes of 39 brain regions.
RESULTS:
The results showed that mice in the exercise group had less brain atrophy compared with the mice in the sedentary group.
CONCLUSIONS:
The results provide new insights into exercise induced brain plasticity in aged animals.
1.Introduction
Aging is accompanied by structural and neurophysiological changes in the brain [1, 2]. The brain shrinks with aging, and its atrophy is the major risk factor for memory loss symptoms and dementia [3, 4, 5]. Decline in cognitive function is associated with the progression of brain atrophy [6]. Some degree of brain atrophy occurs gradually with normal aging, and there is a progressive accumulation of brain tissue loss throughout multiple brain regions with advanced age [7, 8]. Given the projected rapid growth in aged populations, age-related neurodegenerative disorders are dramatically becoming a major health issue in our society. For healthy old people, the delay of brain atrophy contributes to the prevention of subsequent cognitive impairment and age-related neurodegenerative diseases. Even though brain shrinkage is progressive, a growing number of researchers [9, 10] believe that brain atrophy is by no means inevitable; the shrinkage can be slowed or even reversed. Given the projected vast financial and social burden of AD (Alzheimer Disease), an effective non-pharmacological strategy that may reduce or reverse brain degeneration is therefore, in great demand.
Abundant data suggest that moderate levels physical exercise broadly enhances brain health and brain function of aging [11, 12] and diseased [13] populations. Exercise has been proposed as one of the best non-pharmacological strategies to antagonize age-related brain dysfunction [14]. Understanding how exercise can influence brain shrinkage in aged mice has potential value in understanding brain aging. A great deal of attention is being paid toward investigating the effect of exercise as a means of protecting and restoring the brain on rodent animal models. This could allow for isolating the effect of exercise on brain atrophy, as well as bridging the gap between animal and human studies. Our current knowledge on the evolution of brain atrophy during exercise is derived mostly from cross-sectional histological studies, reporting rat motor cortex thickness increases [15], rat motor cortex angiogenesis [16] and mouse hippocampus cell proliferation and neurogenesis [17]. Unlike studies with longitudinal design, those studies are incapable of directly gauging brain changes and individual differences. Magnetic resonance microscopy (MRM), applying longitudinal design, is increasingly recognized as a useful tool not only for its high resolution and noninvasive nature, but also as a possible candidate for tracking degeneration of brain structures with high precision and statistical power [18]. Several rodent MRM studies have shown the reversed regional atrophy patterns induced by exercise. In one study, Biedermann et al. [19] found the significant hippocampal volume increase in exercising mice using voxel-based morphometry. The advances in image registration have allowed us to utilize high-resolution in vivo 3D MRM in combination with multi-atlas based segmentation to investigate whether voluntary wheel running would induce atrophy-slowing effects for neuroprotection.
2.Materials and methods
2.1Animals
All animal experiments conformed to the guidelines for the use and care of laboratory animals, and the study was approved by Institutional Animal Care and Use Committee of our University. Sixteen healthy C57BL/6J mice, aged 21 months [20], were used in this study. The mice were housed in standard plastic cages (L
Table 1
Body weights
| Experimental group | Body weight (g) of the first scan | Body weight (g) of the second scan |
|---|---|---|
| Sedentary group | 28.8 | 28.6 |
| Exercise group | 29.0 | 28.5 |
The mice were scanned on 22 months old and a follow-up three months later on a 7T Bruker horizontal bore (Bruker BioSpin, Ettlingen, Germany) Biospec 70/30 small-animal MRM System using a 72 mm-inner diameter linear birdcage coil for excitation and a four-element phased array surface coil for reception. Animals were anesthetized with isoflurane (1%) with oxygen and air at a 1:3 ratio and placed in an animal bed restraint system with bite and ear bars for head fixation. Temperature was maintained by a heating block. Coronal T2-weighted images of the mouse brain MRM were obtained with a standard 3D Cartesian Fast Spin Echo (FSE) using following imaging parameters: repetition time (TR)
2.2Exercise training protocols
A running wheel was attached to one of the walls of the cage. Mice in the exercise group had continuous access to a running wheel (15.5-cm diameter aluminum wheel) in a standard cage individually. Wheel revolutions were wirelessly relayed via telemetry to a computer in the facility. To eliminate the effect of wheel climbing or physical activities, the sedentary group was housed individually in identical cages without running wheels. The number of wheel rotations and running time spent were recorded each morning.
2.3Image preprocessing
Bias field inhomogeneities in MRM is one of the major determinants of errors in atrophy estimations. Non-parametric non-uniform intensity normalization (N3) bias correction technique proposed by Sled et al. [21] (http://www.bic.mni.mcgill.ca/software/N3/) was applied to correct heterogeneous signal intensity with optimized protocol [22]. Brain extraction is a critical step in neuroimaging analysis pipeline, a hybrid method that combines brain template and adaptive threshold approach [23] was applied to separates mouse brain from other non-brain parts such as skull or scalp. Since the research was performed in the Franklin-Paxinos space, T2 images were aligned to this space to facilitate multi-atlas based segmentation of the neuroanatomical structures.
2.4Multi-atlas based segmentation
Automated segmentation of anatomical structures on MRM is important for quantitative analysis of structural brain changes. Optimized image registration based on Advanced Normalization Tools (ANTS) toolbox was combined with multi-atlas model for mouse brain segmentation (Fig. 1) [24]. Briefly, each target image was first registered to a mouse multi-atlas [25] (http://www.bioeng.nus.edu.sg/cfa/mouse_ atlas.html). Symmetric Normalization (SyN) registration algorithm using the ANTS deformation toolbox [26] was used with parameters appropriate for mouse brain registration [27]. The atlas is composed of five mouse brains; each of them was manually labeled into 39 independent neuroanatomical structures based on the histology atlas. Those 39 structures comprise large grey matter structures, smaller nuclei, white matter bundles and the ventricular system. Segmentations from five mouse atlases were propagated to target mouse brains for segmenting all target images. We use the majority vote for combining the labels from each atlas to the target image, which derive final labels for each voxel. The multi-atlas based segmentation described above had shown good performance in previous research [24, 27].
Figure 1.
Schematic of multi-atlas segmentation methods.
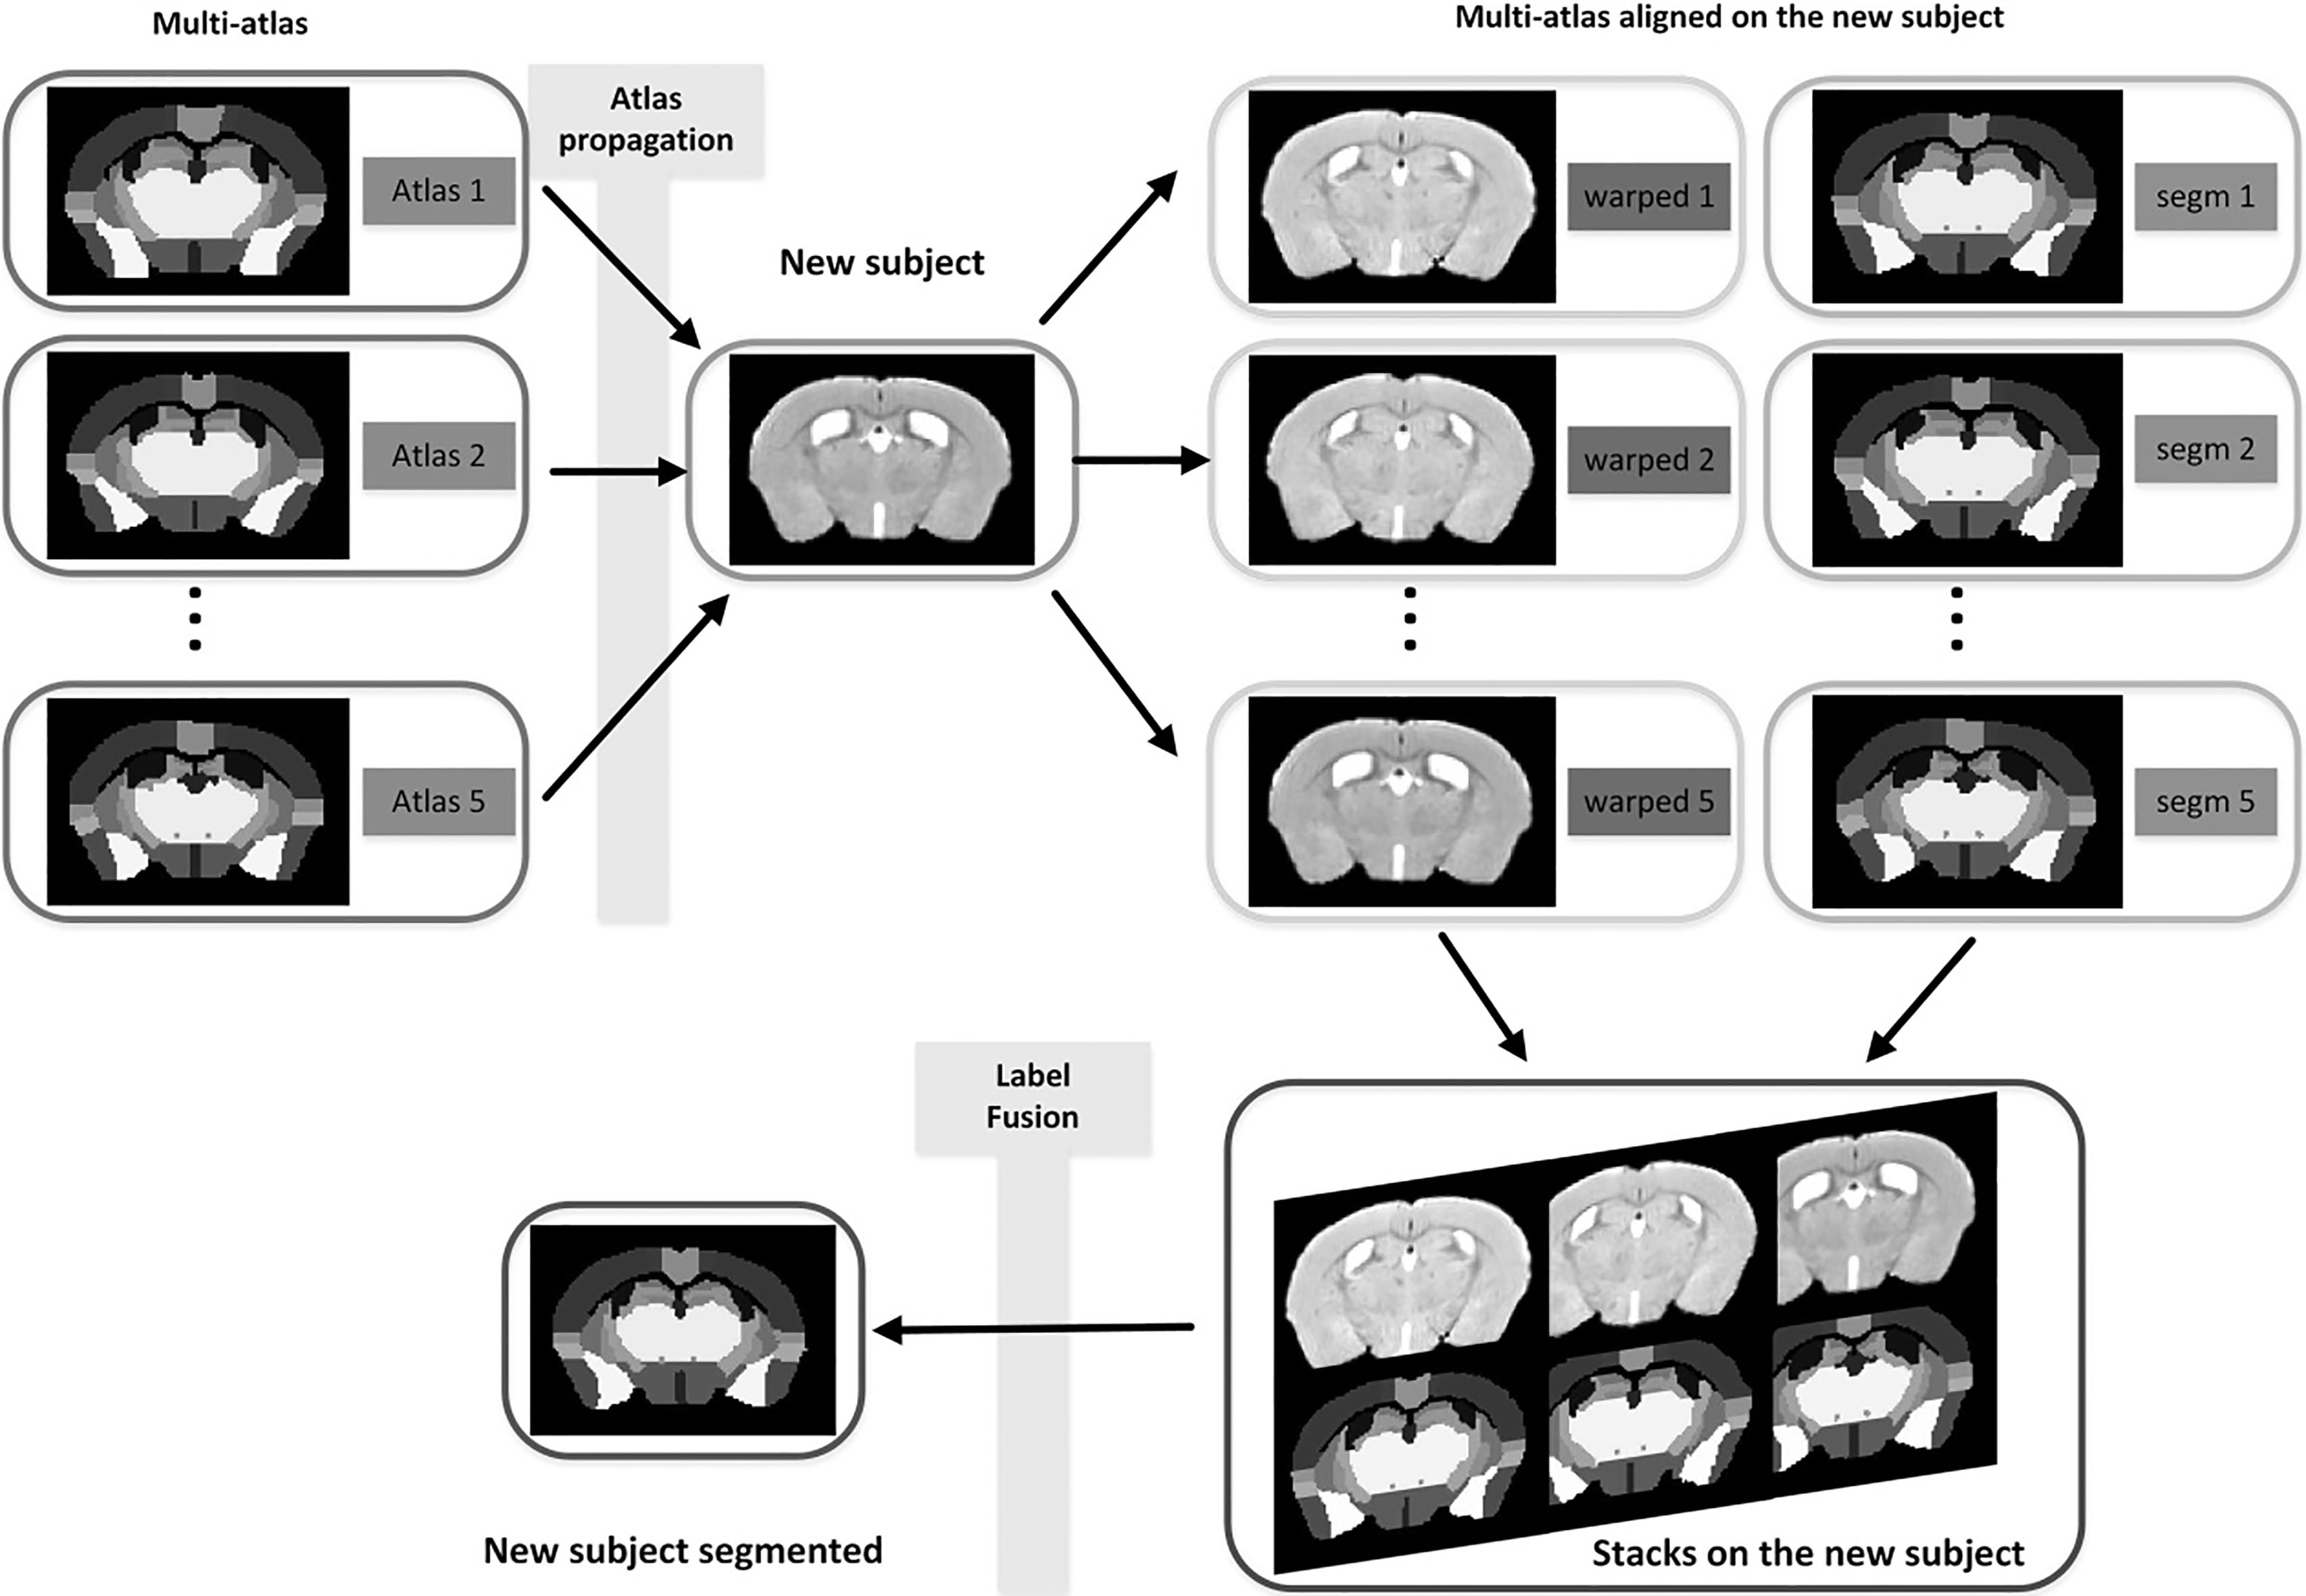
Figure 2.
Distribution of voluntary wheel running bout length in 1 minute bins.
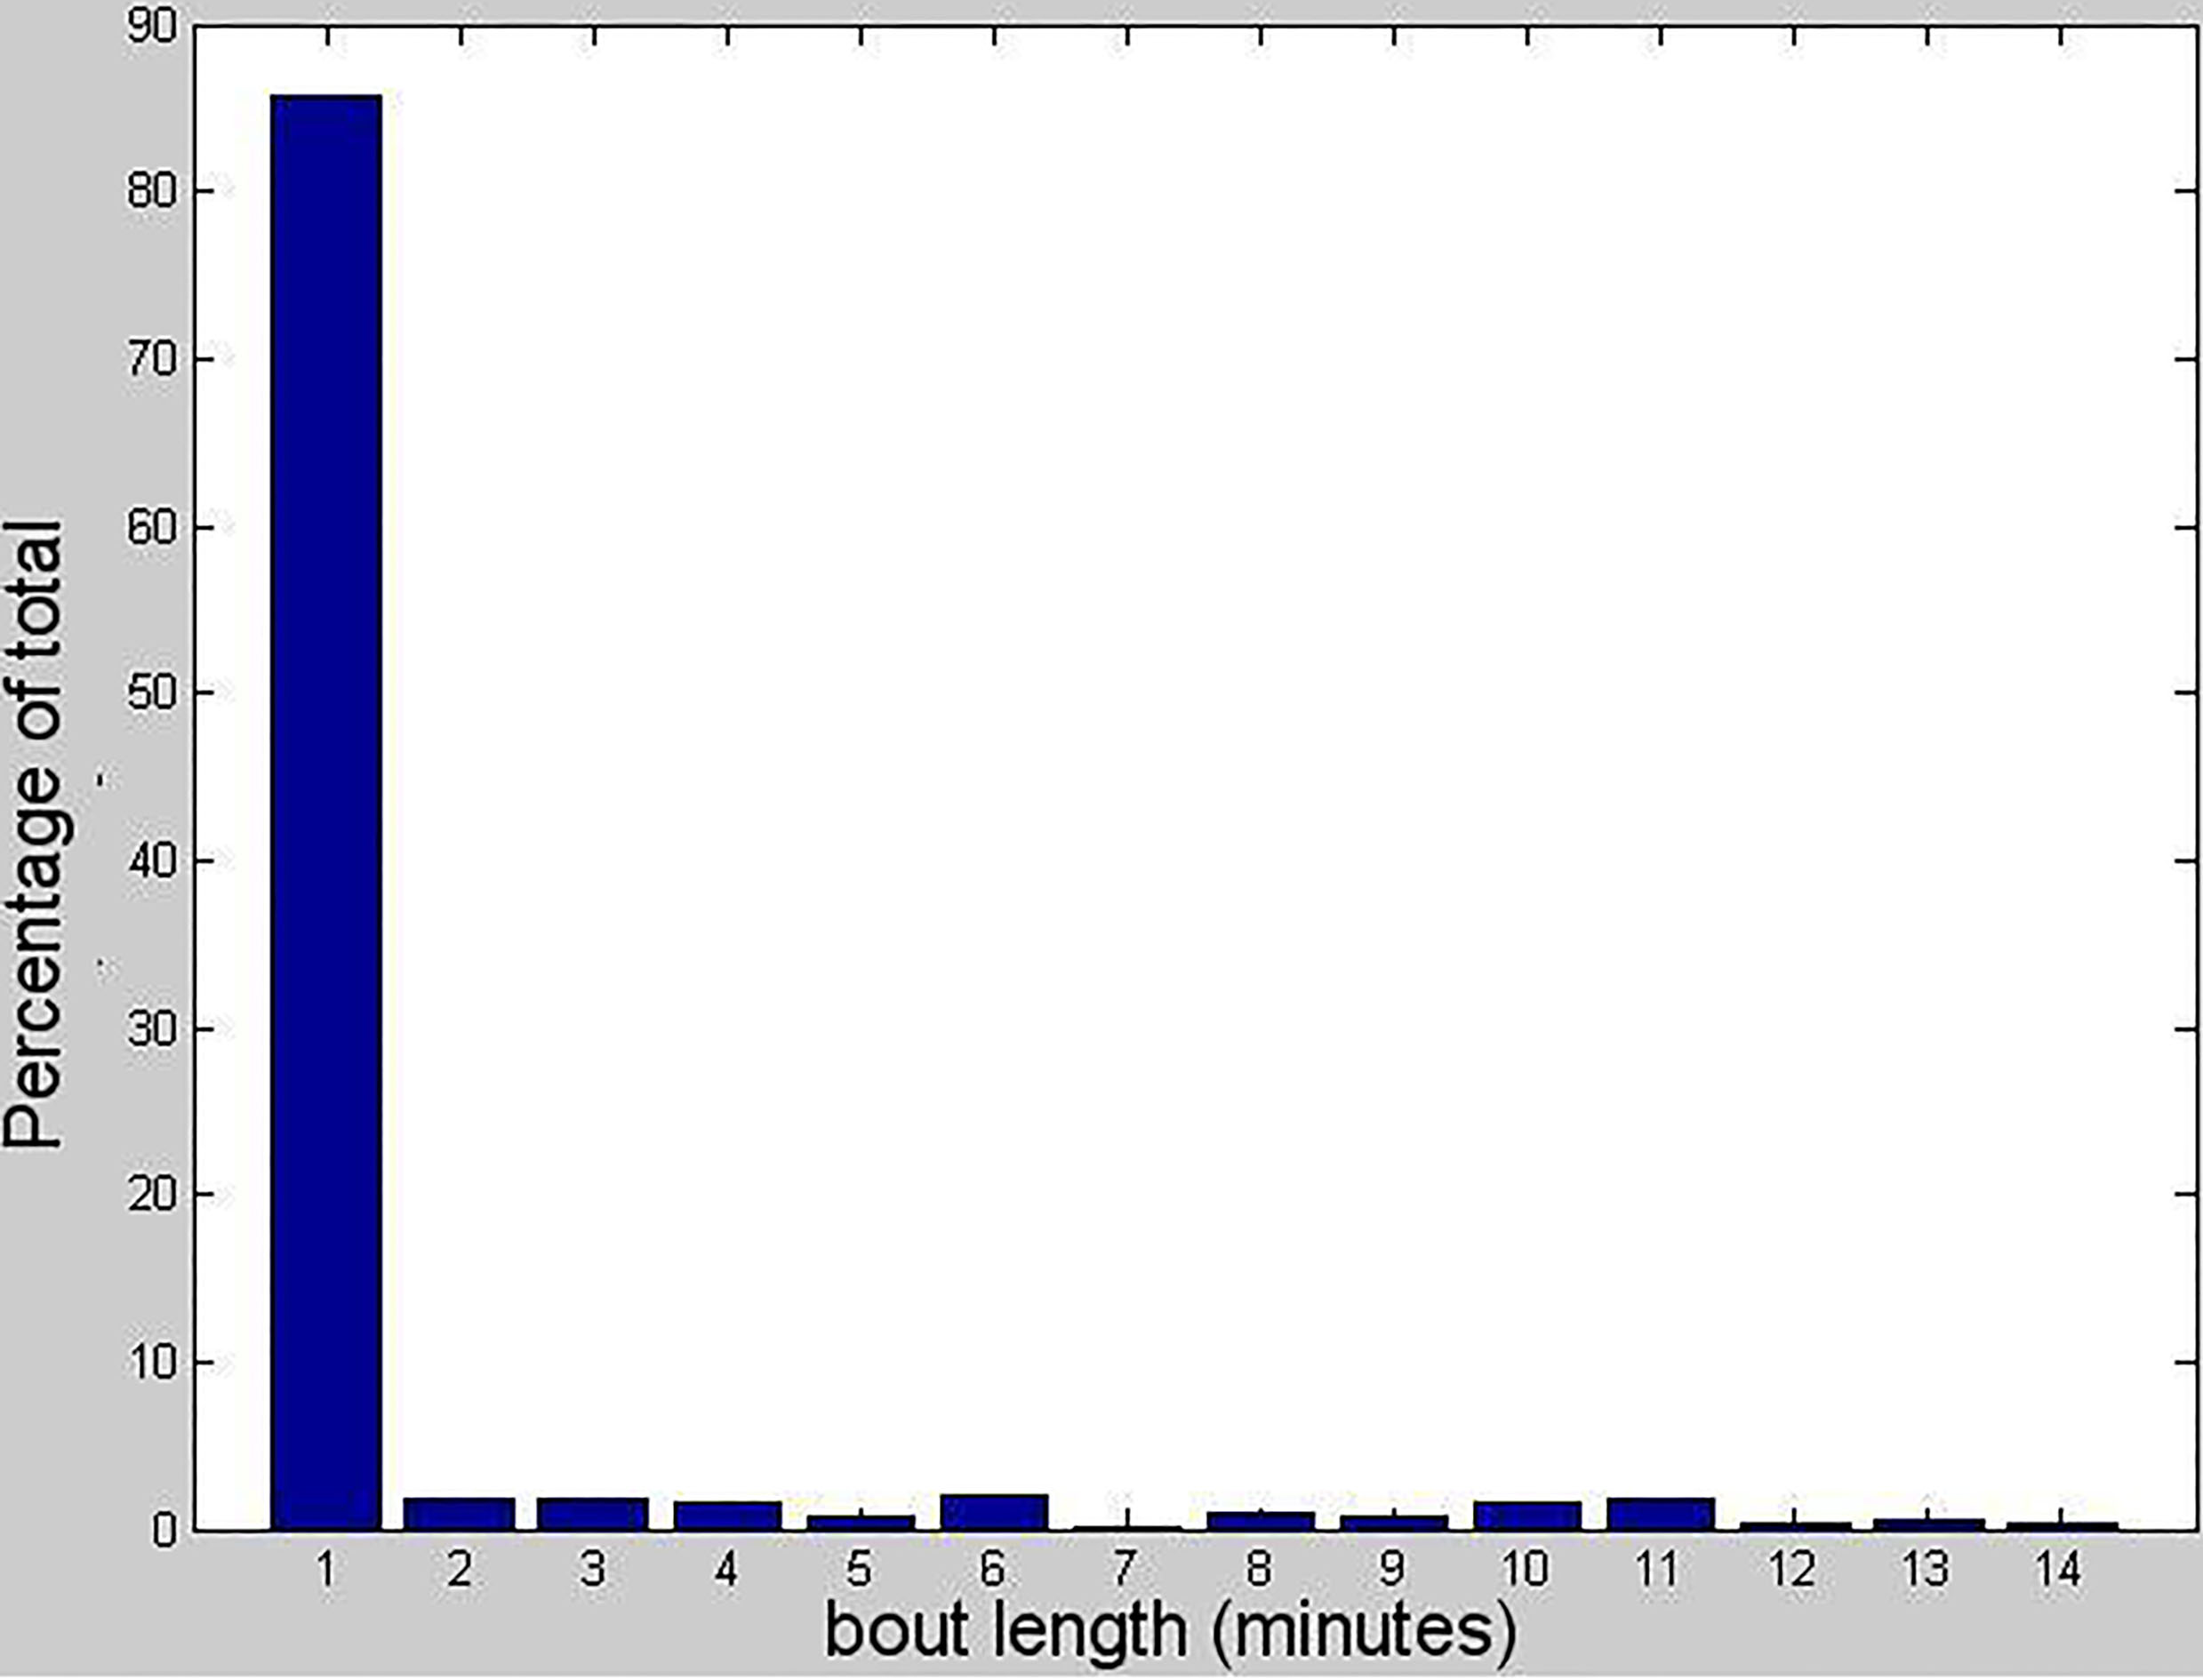
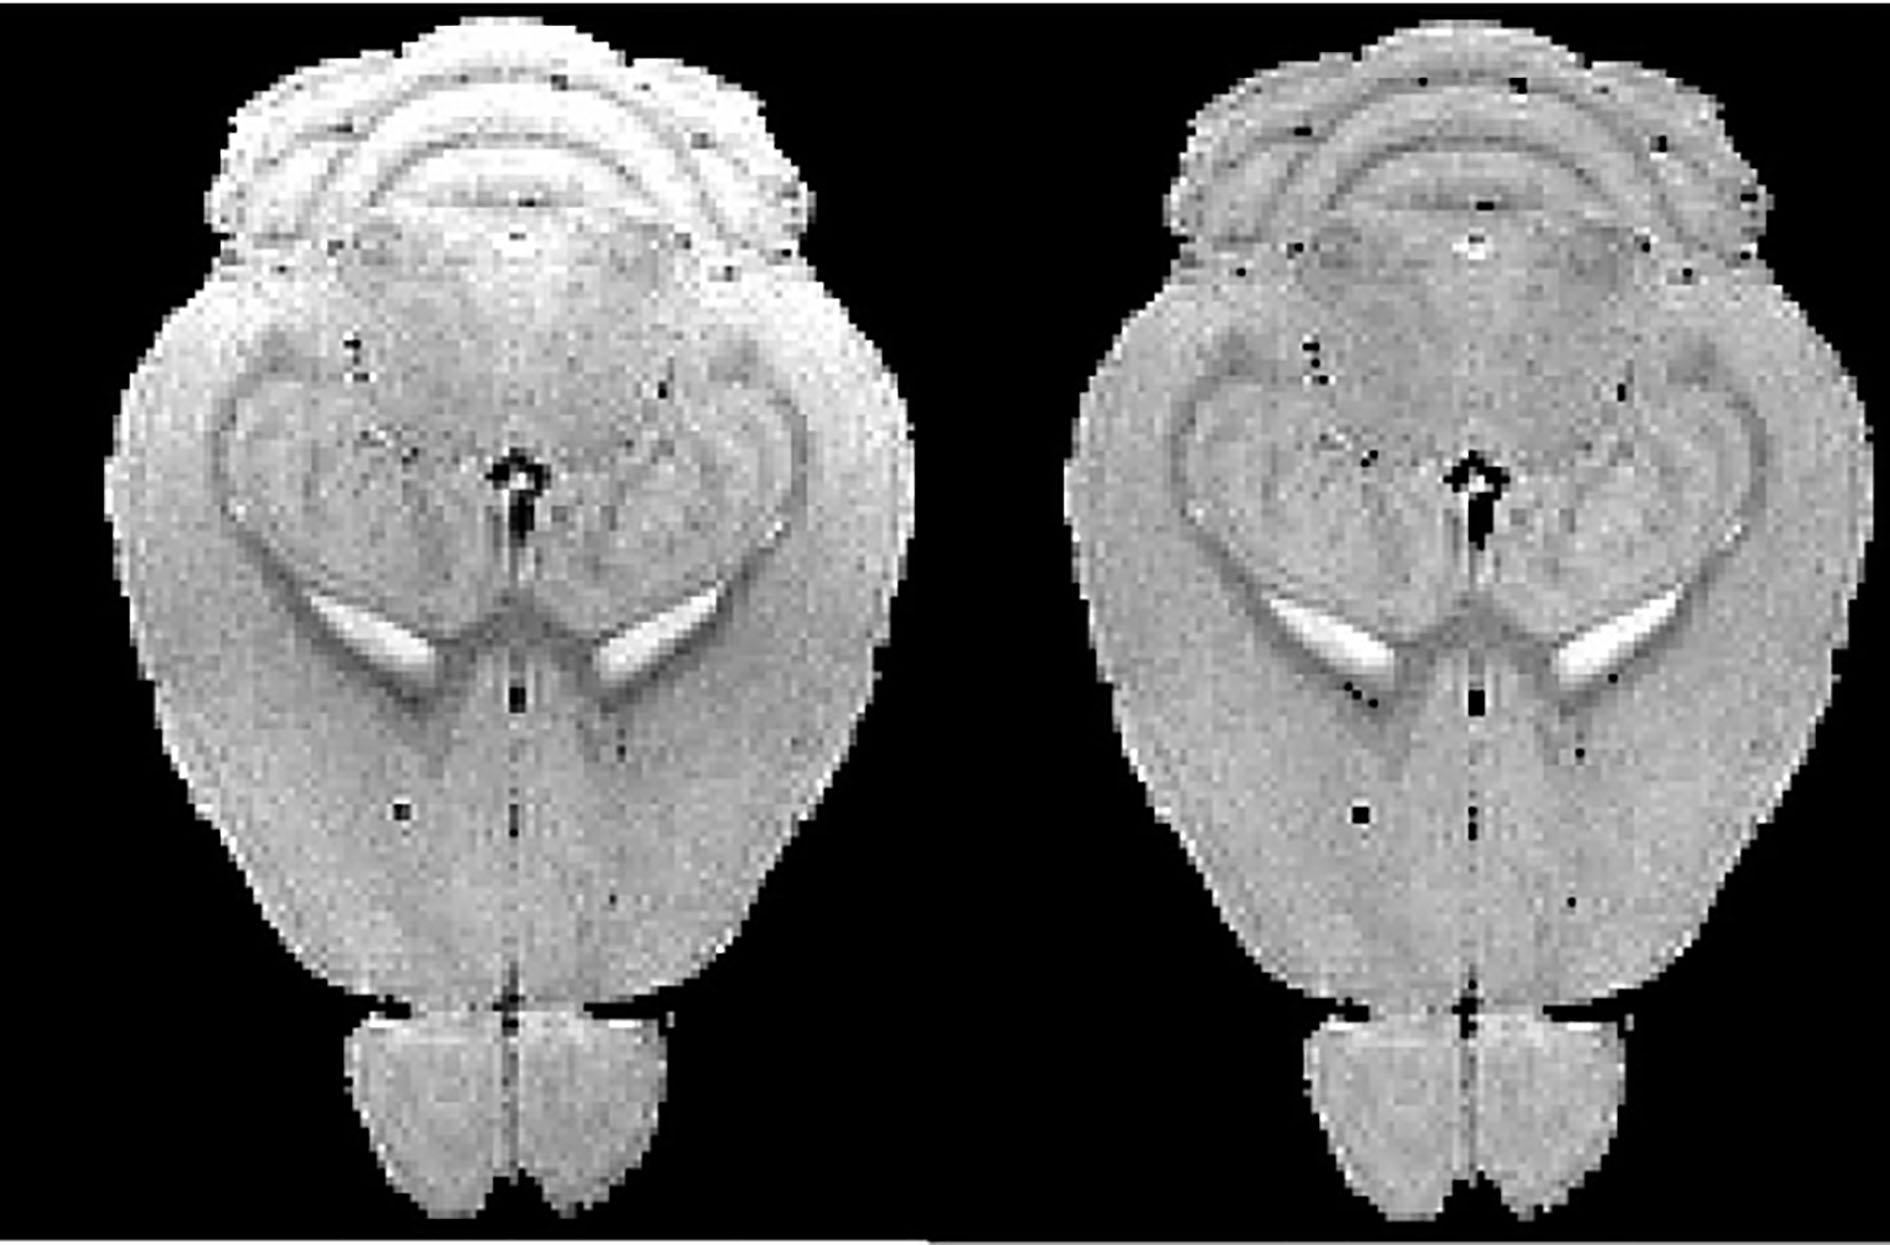
Figure 3.
Bias correction result of mouse brain MRM (from left to right: raw MRM image, corrected MRM image).
3.Results
Video recordings from a night-vision camera showed that mice left and reentered the wheel again within minutes to continue using wheels. This indicates that voluntary wheel running may well be intentional. The video also demonstrated that the wheels did not register further rotations after mice exited the wheel. Bulk of running occurred during the dark period. Mice made heavy use of running wheel, with thousand revolutions per day. The voluntary running activity was progressively increasing over the first two weeks and became more stable thereafter. Most of the mice showed a consistent intermittent running and resting pattern in dark hours. Daily running distances were calculated from the trial start time, in 24-hour periods. For 86% of the cases, they ran for less than 1 minute. The maximum duration of running is 14 minutes (Fig. 2). The average daily running distance for the mice was 4.6
Longitudinal MRM can be used to measure the progression of cerebral atrophy. Intensity inhomogeneity in MRM scans can make the measurement unreliable. From Fig. 3, we can find that N3 method with optimized protocol recovers the bias field in the mouse brain and thereby improved atrophy measurements.
From volumes of 39 brain regions generated from multi-atlas based segmentation, we found that nine regions (corpus callosum, lateral olfactory tract, motor cortex, somatosensory cortex, amygdala and hippocampus (CA1 region, CA3 region, dentate gyrus, and general region)) from the sedentary group showed a significant effect of aging, while only two regions (lateral olfactory tract and amygdala) from the exercise group showed a significant effect of aging (Fig. 4).
Figure 4.
Change in the volume of mouse brain regions between two time points. From 1 to 39 are 39 predefined brain regions (http://www.bioeng.nus.edu.sg/cfa/mouse_atlas.html). Significant differences were found for some structures between two time points (
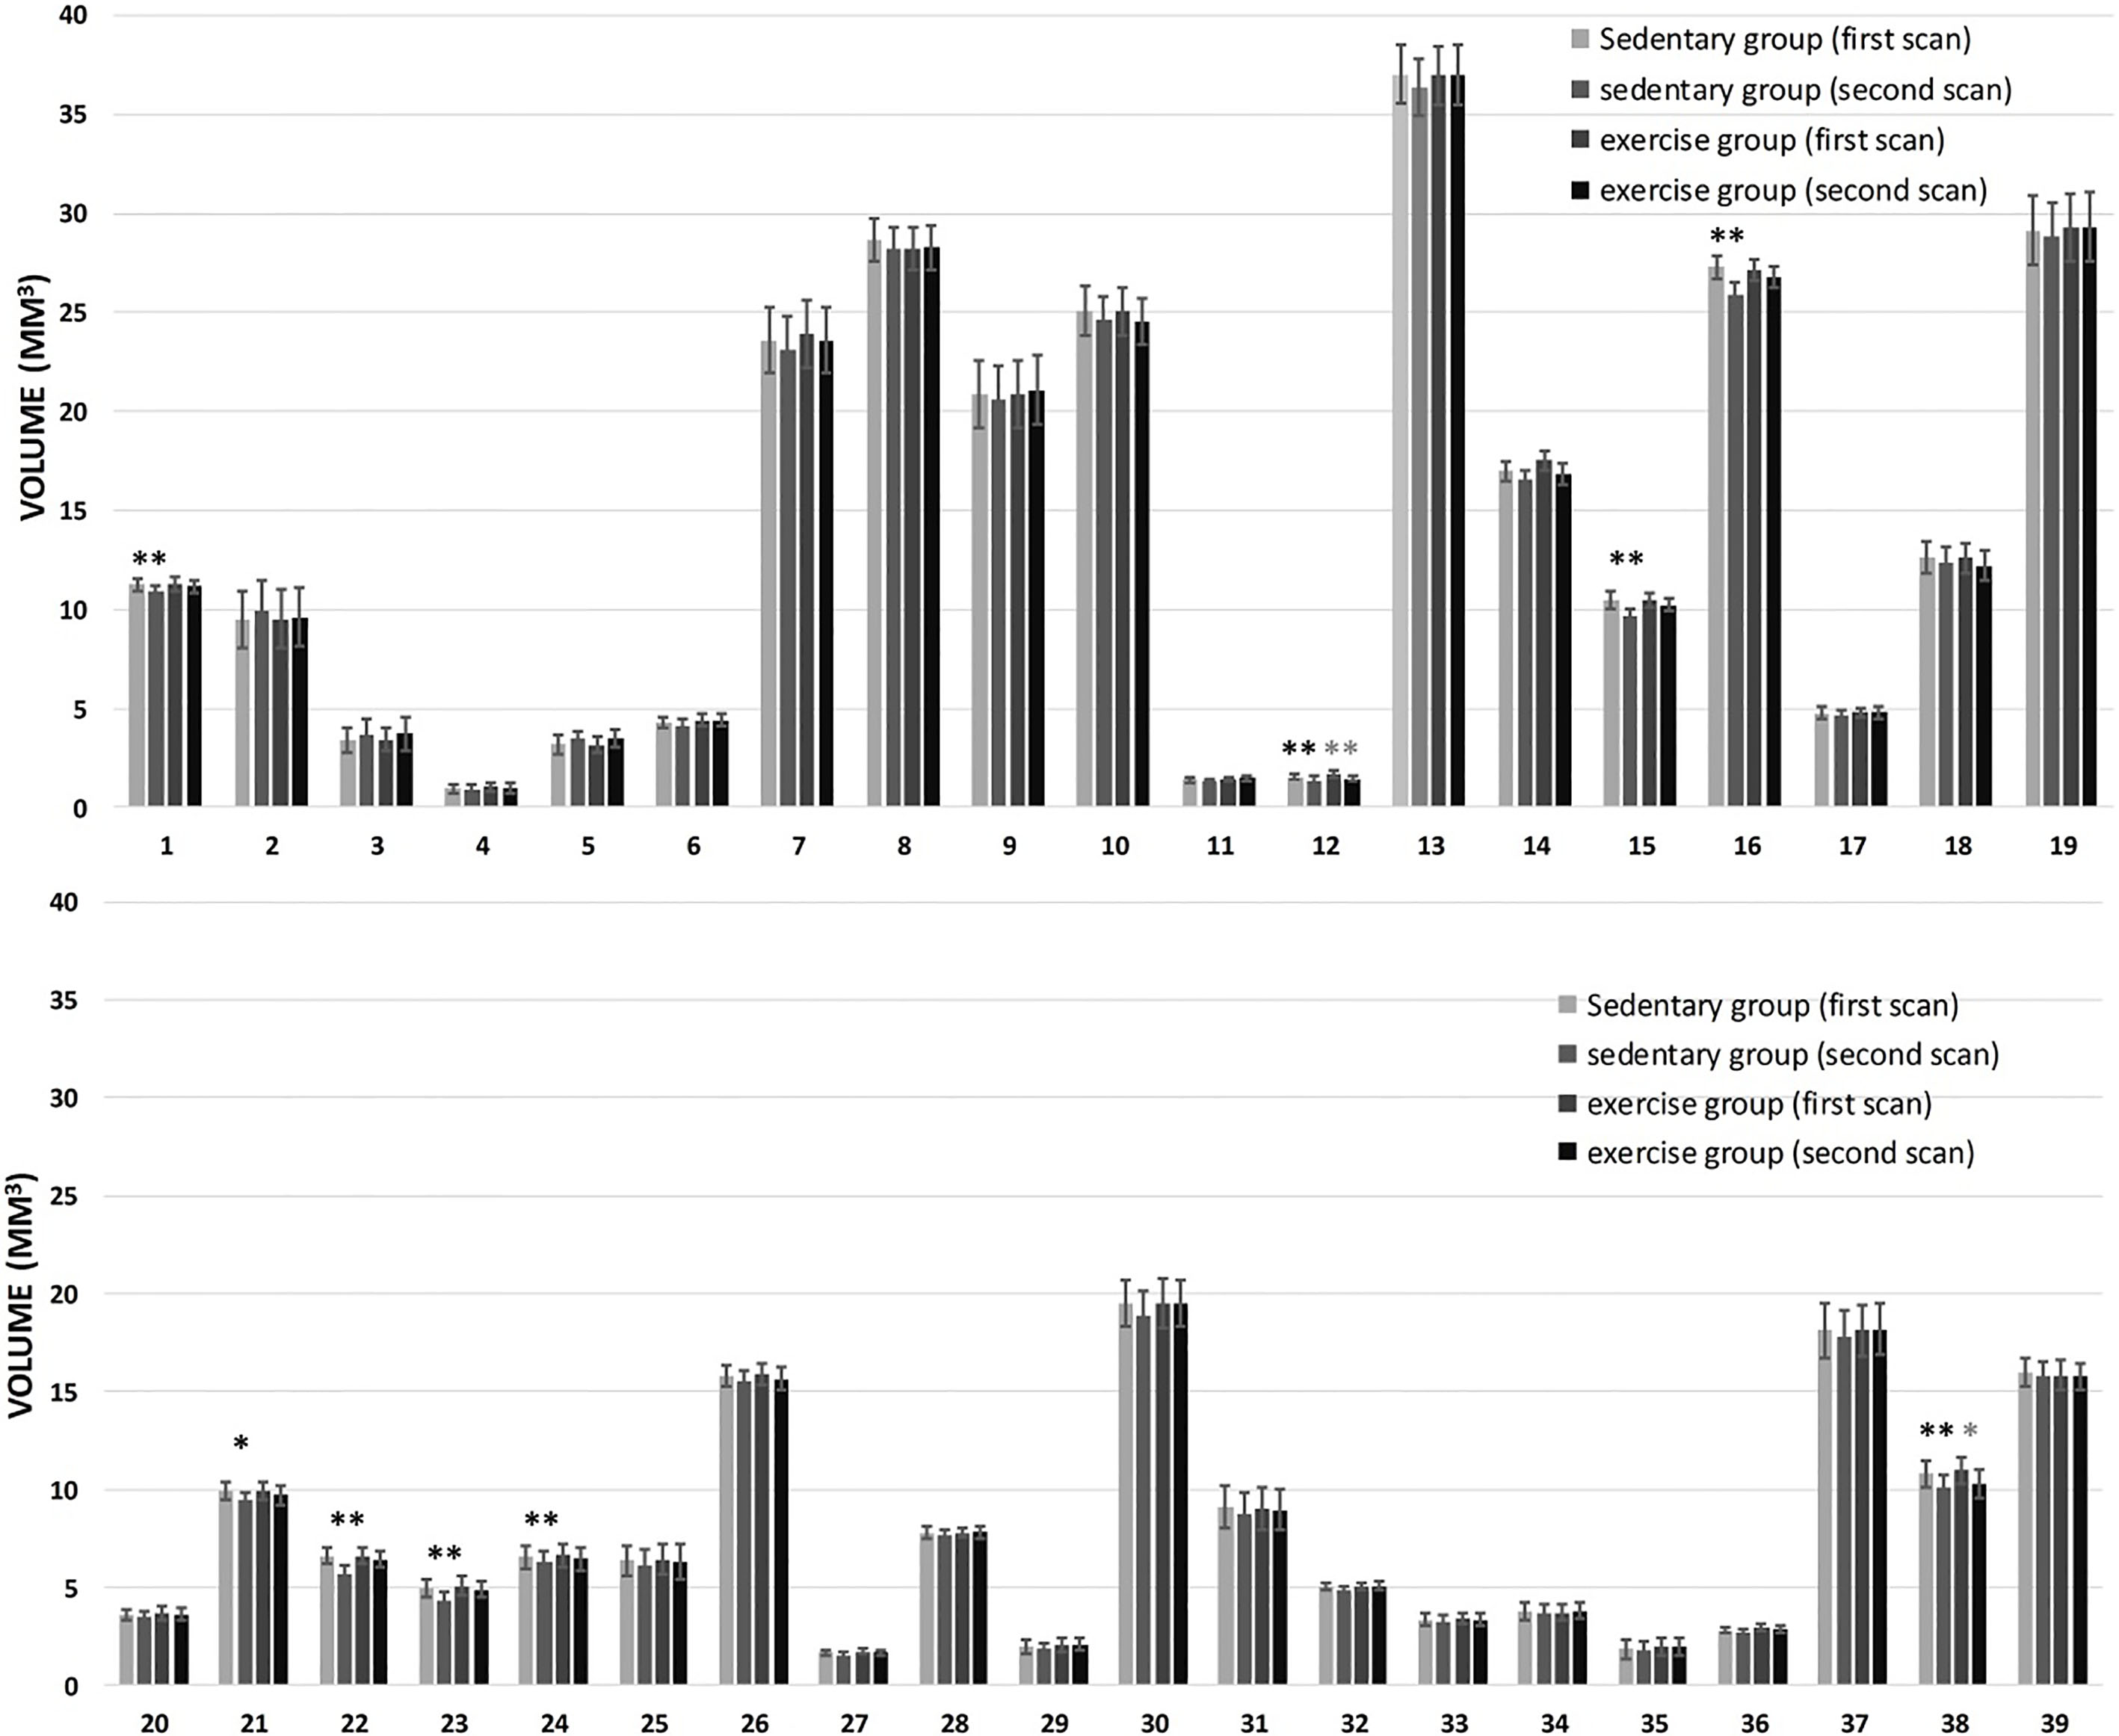
Figure 5.
Somatosensory cortex atrophy (expressed as a percentage change of baseline somatosensory cortex volume) for sedentary group and exercise group.
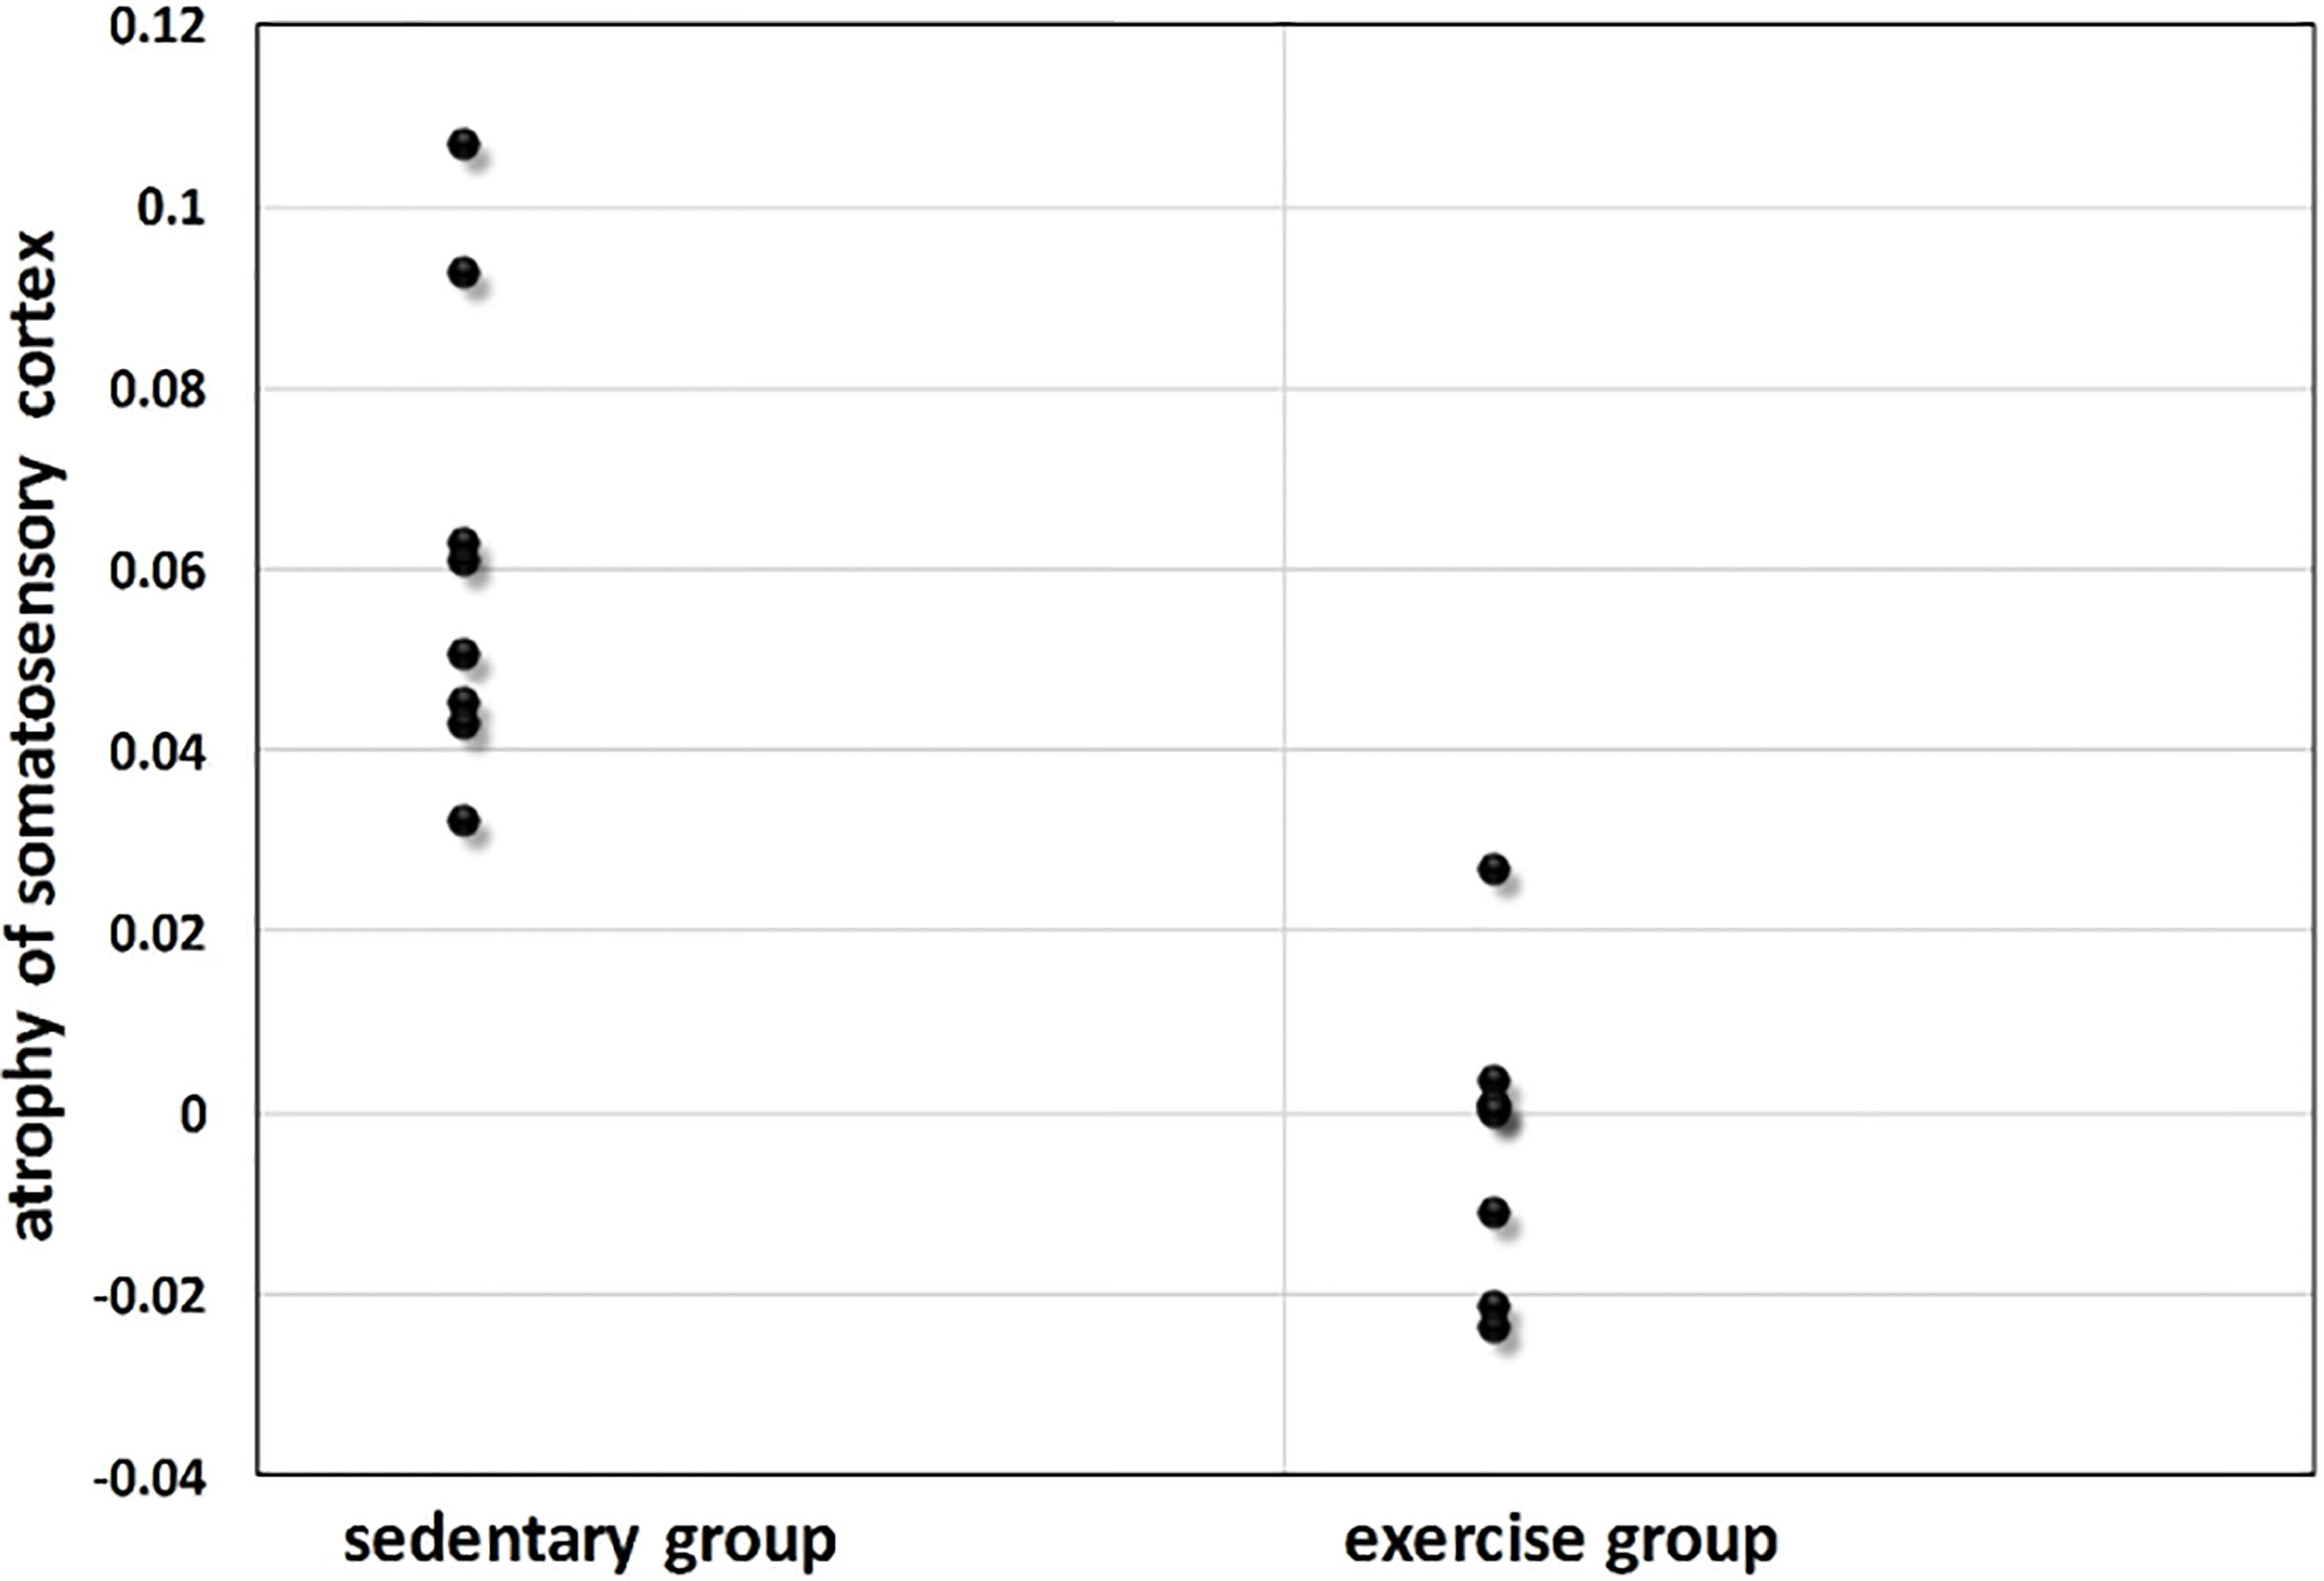
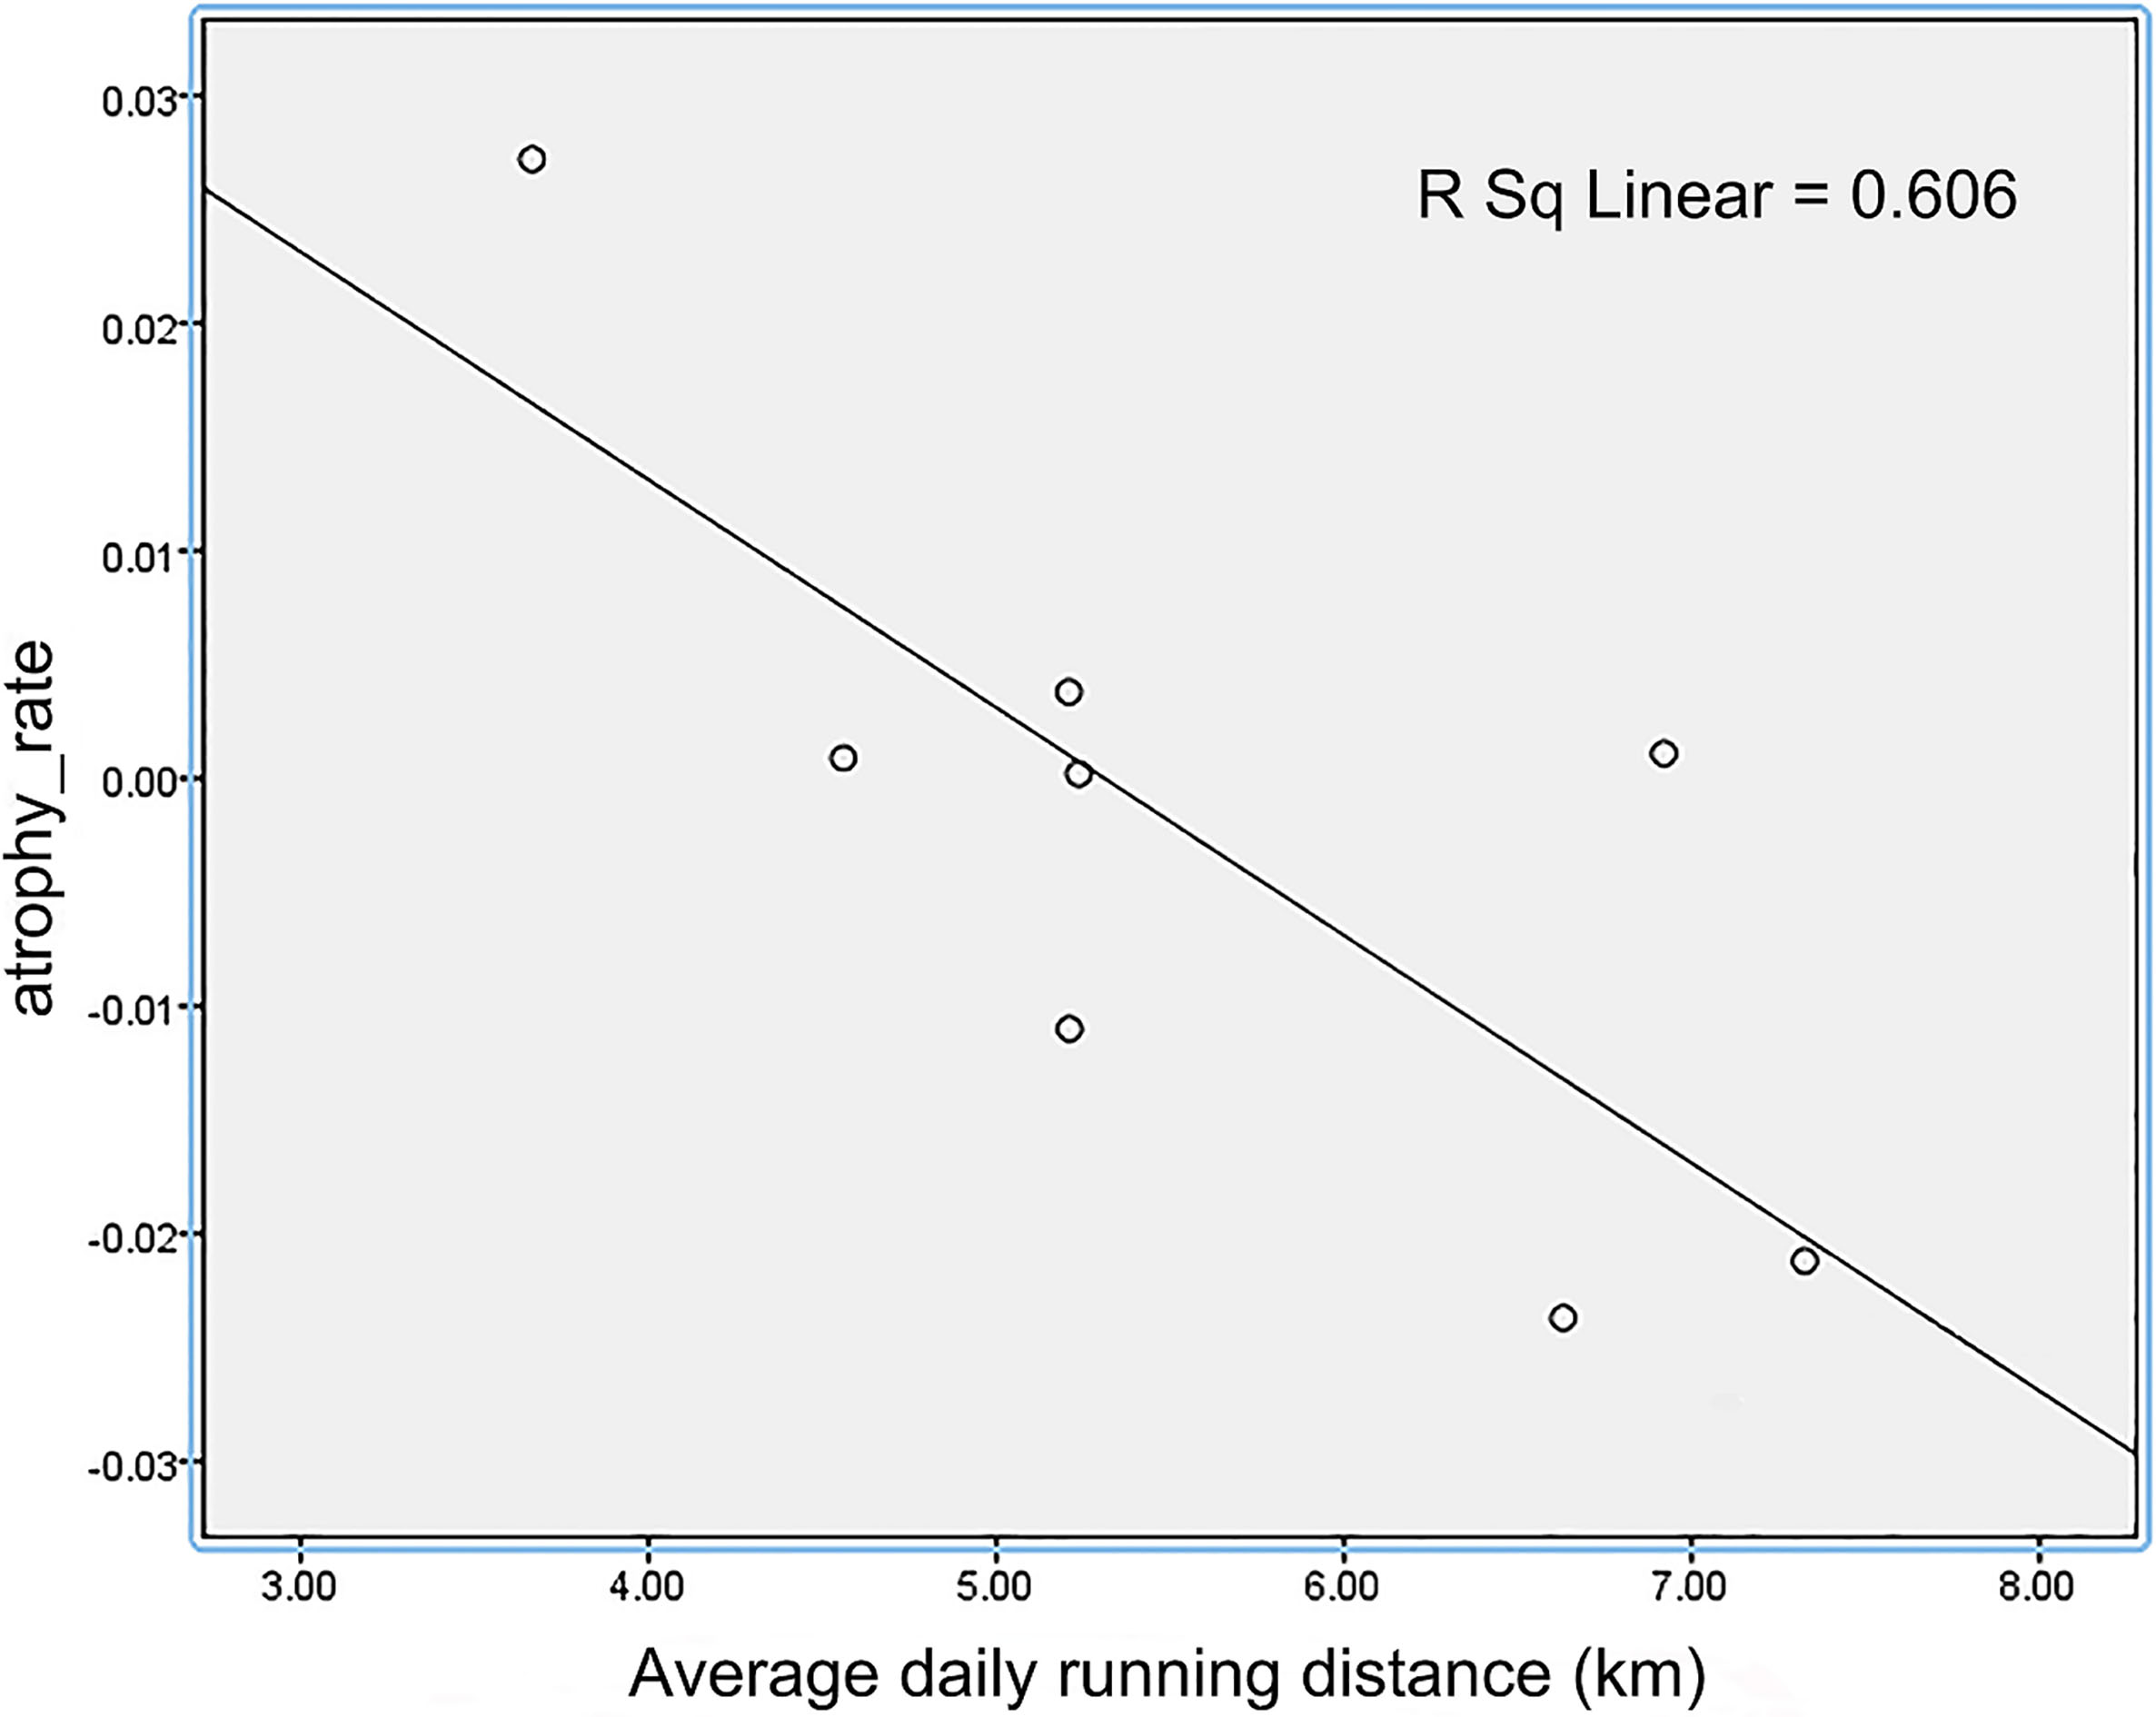
Figure 6.
The relationship of average daily running distance and atrophy of somatosensory cortex after 10 weeks of voluntary wheel running exercise.
Here we further compared the atrophy in the somatosensory cortex for two groups. The mice in sedentary group had significant reductions in somatosensory cortex volume (atrophy 6.2
4.Discussions
The human brain shrinks with increasing age, but it is also capable of plasticity in late life stage. Physical activity is known to help maintain brain health and cognition and even have a neuroprotective effect on central nervous system from age-related decline [28]. Despite the linkage between physical activity and brain plasticity by many researches. It has been well demonstrated that hippocampus areas are more inherently plastic than other brain areas [29]. However, how the neuroprotection effect of exercising in other brain regions of mice is still unclear.
The study was designed to determine whether voluntary wheel running would be involved in the enhanced the brain neuroprotection of aged mice. In the course of our study, our experimental evidence indicates that: (1) After 10 weeks of voluntary wheel running, mice in exercise group had less atrophy regions compared with mice in sedentary group. Previous human study [30] has showed that neuron proliferation was not only in hippocampal tissue, but also was widely distributed across the cerebral cortex. This suggests that voluntary wheel running activity alone is an adequate stimulus for more widespread neuron neurogenesis. Insulin-like growth factor 1 (IGF-1), as one of the most robust hallmarks of mammalian aging [31, 32], is a key mediator [33] for neurogenesis. There is experimental evidence that restoring IGF-1 in older animals improves many aging-related neural changes [34]. Exercise increases the uptake of IGF-1 [35] from the bloodstream into various brain regions. Although the detailed mechanisms of the reduced brain degeneration remain unclear, it may be related to the attenuation of aging-related neuronal death [36] and the jump-start of hippocampus neuron proliferation [37]. (2) It is worth mentioning that not all intensity-associated stress levels show the same effects on neuroplasticity. The atrophy of somatosensory cortex was negatively correlated with the distance of wheel running. It suggests a complex relationship between motivation and adaptation of brain. A potential answer to this might be that individual differences in structural brain plasticity is influenced by non-shared environmental factors [38].
5.Conclusion
MRM has emerged as a useful tool for in vivo observation of mouse brain morphology changes that are attributable directly to voluntary exercise. In this article, we evaluated exercise-induced brain volume changes among aged mice using MRM as a surrogate marker, in combination with multi-atlas based segmentation. The results demonstrated neuroprotective effect of voluntary wheel running on the mouse brain, which has delayed neurodegeneration in the exercise group. The approach used in this study can provide disease modifying evidence for animal model of chronic neurodegenerative disease in the future.
Acknowledgments
This research was financially supported by Beijing Natural Science Foundation (L182010), the Scientific Research General Project of Beijing Municipal Education Committee (KM201810005033) and the National Key Technology Support Program of China (2015BAI02B03).
Conflict of interest
The authors declare no conflict of interest.
References
[1] | Enzinger C, Fazekas F, Matthews PM, et al. Risk factors for progression of brain atrophy in aging: six-year follow-up of normal subjects. Neurology. (2005) ; 64: (10): 1704-1711. DOI: 10.1212/01.WNL.0000161871.83614.BB. |
[2] | Hedman AM, Haren NEMV, Schnack HG, et al. Human brain changes across the life span: a review of 56 longitudinal magnetic resonance imaging studies. Human Brain Mapping. (2012) ; 33: (8): 1987-2002. DOI: 10.1002/hbm.21334. |
[3] | Guo X, Steen B, Matousek M, et al. A population-based study on brain atrophy and motor performance in elderly women. The Journals of Gerontology Series A: Biological Sciences and Medical Sciences. (2001) ; 56: (10): M633-M637. |
[4] | Johansson L, Skoog I, Gustafson DR, et al. Midlife psychological distress associated with late-life brain atrophy and white matter lesions: a 32-year population study of women. Psychosomatic Medicine. (2012) ; 74: (2): 120-125. DOI: 10.1097/PSY.0b013e318246eb10. |
[5] | Olesen PJ, Guo X, Gustafson D, et al. A population-based study on the influence of brain atrophy on 20-year survival after age 85. Neurology. (2011) ; 76: (10): 879-886. DOI: 10.1212/WNL.0b013e31820f2e26. |
[6] | Rusinek H, De Santi S, Frid D, et al. Regional brain atrophy rate predicts future cognitive decline: 6-year longitudinal MR imaging study of normal aging. Radiology. (2003) ; 229: (3): 691-696. DOI: 10.1148/radiol.2293021299. |
[7] | Raz N, Rodrigue KM. Differential aging of the brain: patterns, cognitive correlates and modifiers. Neuroscience & Biobehavioral Reviews. (2006) ; 30: (6): 730-748. DOI: 10.1016/j.neubiorev.2006.07.001. |
[8] | Walhovd KB, Fjell AM, Reinvang I, et al. Effects of age on volumes of cortex, white matter and subcortical structures. Neurobiology of Aging. (2005) ; 26: (9): 1261-1270. DOI: 10.1016/j.neurobiolaging.2005.05.020. |
[9] | Akinyemi RO, Mukaetova-Ladinska EB, Attems J, et al. Vascular risk factors and neurodegeneration in ageing related dementias: Alzheimer’s disease and vascular dementia. Current Alzheimer Research. (2013) ; 10: (6): 642-653. DOI: 10.2174/15672050113109990037. |
[10] | Draganski B, Lutti A, Kherif F. Impact of brain aging and neurodegeneration on cognition: evidence from MRI. Current Opinion in Neurology. (2013) ; 26: (6): 640-645. DOI: 10.1097/WCO.0000000000000029. |
[11] | Bugg JM, Head D. Exercise moderates age-related atrophy of the medial temporal lobe. Neurobiology of Aging. (2011) ; 32: (3): 506-514. DOI: 10.1016/j.neurobiolaging.2009.03.008. |
[12] | Erickson KI, Voss MW, Prakash RS, et al. Exercise training increases size of hippocampus and improves memory. Proceedings of the National Academy of Sciences. (2011) ; 108: (7): 3017-3022. DOI: 10.1073/pnas.1015950108. |
[13] | Erickson KI, Weinstein AM, Lopez OL. Physical activity, brain plasticity, and Alzheimer’s disease. Archives of Medical Research. (2012) ; 43: (8): 615-621. DOI: 10.1016/j.arcmed.2012.09.008. |
[14] | Radak Z, Hart N, Sarga L, et al. Exercise plays a preventive role against Alzheimer’s disease. Journal of Alzheimer’s Disease. (2010) ; 20: (3): 777-783. DOI: 10.3233/JAD-2010-091531. |
[15] | Anderson BJ, Eckburg PB, Relucio KI. Alterations in the thickness of motor cortical subregions after motor-skill learning and exercise. Learning & Memory. (2002) ; 9: (1): 1-9. DOI: 10.1101/lm.43402. |
[16] | Kleim JA, Cooper NR, VandenBerg PM. Exercise induces angiogenesis but does not alter movement representations within rat motor cortex. Brain Research. (2002) ; 934: (1): 1-6. DOI: 10.1016/S0006-8993(02)02239-4. |
[17] | Van Praag H, Kempermann G, Gage FH. Running increases cell proliferation and neurogenesis in the adult mouse dentate gyrus. Nature Neuroscience. (1999) ; 2: (3): 266. DOI: 10.1038/6368. |
[18] | Lin L, Fu Z, Xu X, et al. Mouse brain magnetic resonance microscopy: Applications in a lzheimer disease. Microscopy Research and Technique. (2015) ; 78: (5): 416-424. DOI: 10.1002/jemt.22489. |
[19] | Biedermann S, Fuss J, Zheng L, et al. In vivo voxel based morphometry: detection of increased hippocampal volume and decreased glutamate levels in exercising mice. Neuroimage. (2012) ; 61: (4): 1206-1212. DOI: 10.1016/j.neuroimage.2012.04.010. |
[20] | Fahlström A, Yu Q, Ulfhake B. Behavioral changes in aging female C57BL/6 mice. Neurobiology of Aging. (2011) ; 32: (10): 1868-1880. DOI: https://doi.org/10.1016/j.neurobiolaging.2009.11.003. |
[21] | Sled JG, Zijdenbos AP, Evans AC. A nonparametric method for automatic correction of intensity nonuniformity in MRI data. IEEE Transactions on Medical Imaging. (1998) ; 17: (1): 87-97. DOI: 10.1109/42.668698. |
[22] | Lin L, Wu S, Bin G, et al. Intensity inhomogeneity correction using N3 on mouse brain magnetic resonance microscopy. Journal of Neuroimaging. (2013) ; 23: (4): 502-507. DOI: 10.1111/jon.12041. |
[23] | Lin L, Wu S, Yang C. A template-based automatic skull-stripping approach for mouse brain MR microscopy. Microscopy Research and Technique. (2013) ; 76: (1): 7-11. DOI: 10.1002/jemt.22128. |
[24] | Lin L, Wang J, Fu Z, et al. Multi-atlas segmentation of mouse brain MRM based on optimized advanced normalization tools. Science Discovery Ayutyanont. (2017) ; 5: (6): 486-491. |
[25] | Bai J, Trinh TLH, Chuang KH, et al. Atlas-based automatic mouse brain image segmentation revisited: model complexity vs. image registration. Magnetic Resonance Imaging. (2012) ; 30: (6): 789-798. DOI: 10.1016/j.mri.2012.02.010. |
[26] | Avants BB, Tustison NJ, Song G, et al. A reproducible evaluation of ANTs similarity metric performance in brain image registration. Neuroimage. (2011) ; 54: (3): 2033-2044. DOI: 10.1016/j.neuroimage.2010.09.025. |
[27] | Fu Z, Lin L, Tian M, et al. Evaluation of five diffeomorphic image registration algorithms for mouse brain magnetic resonance microscopy. Journal of Microscopy. (2017) ; 268: (2): 141-154. DOI: 10.1111/jmi.12594. |
[28] | Lautenschlager NT, Almeida OP. Physical activity and cognition in old age. Current Opinion in Psychiatry. (2006) ; 19: (2): 190-193. DOI: 10.1001/jamainternmed.2013.206. |
[29] | Kohman RA, Rodriguez-Zas SL, Southey BR, et al. Voluntary wheel running reverses age-induced changes in hippocampal gene expression. PloS One. (2011) ; 6: (8): e22654. DOI: 10.1371/journal.pone.0022654. |
[30] | Flöel A, Ruscheweyh R, Krüger K, et al. Physical activity and memory functions: are neurotrophins and cerebral gray matter volume the missing link? Neuroimage. (2010) ; 49: (3): 2756-2763. DOI: 10.1016/j.neuroimage.2009.10.043. |
[31] | Carter CS, Ramsey MM, Sonntag WE. A critical analysis of the role of growth hormone and IGF-1 in aging and lifespan. TRENDS in Genetics. (2002) ; 18: (6): 295-301. DOI: 10.1016/S0168-9525(02)02696-3. |
[32] | Lanfranco F, Gianotti L, Giordano R, et al. Ageing, growth hormone and physical performance. Journal of Endocrinological Investigation. (2003) ; 26: (9): 861-872. DOI: 10.1007/BF03345237. |
[33] | Carro E, Trejo JL, Busiguina S, et al. Circulating insulin-like growth factor I mediates the protective effects of physical exercise against brain insults of different etiology and anatomy. Journal of Neuroscience. (2001) ; 21: (15): 5678-5684. DOI: https://doi.org/10.1523/JNEUROSCI.21-15-05678.2001. |
[34] | Šerbedžija P, Ishii DN. Insulin and insulin-like growth factor prevent brain atrophy and cognitive impairment in diabetic rats. Indian Journal of Endocrinology and Metabolism. (2012) ; 16: (Suppl 3): S601. DOI: 10.4103/2230-8210.105578. |
[35] | Cetinkaya C, Sisman AR, Kiray M, et al. Positive effects of aerobic exercise on learning and memory functioning, which correlate with hippocampal IGF-1 increase in adolescent rats. Neuroscience Letters. (2013) ; 549: : 177-181. DOI: 10.1016/j.neulet.2013.06.012. |
[36] | Westwood AJ, Beiser A, DeCarli C, et al. Insulin-like growth factor-1 and risk of Alzheimer dementia and brain atrophy. Neurology. (2014) ; 82: (18): 1613-1619. DOI: 10.1212/WNL.0000000000000382. |
[37] | Walser M, Samà MT, Wickelgren R, et al. Local overexpression of GH and GH/IGF1 effects in the adult mouse hippocampus. Journal of Endocrinology. (2012) ; 215: (2): 257-268. DOI: 10.1530/JOE-12-0077. |
[38] | Freund J, Brandmaier AM, Lewejohann L, et al. Emergence of individuality in genetically identical mice. Science. (2013) ; 340: (6133): 756-759. DOI: 10.1126/science.1235294. |


