
Survival rate prediction of breast cancer patients of 0-IV stages with and without radiotherapy via a revised Taylor series expansion algorithm: A population-based study in Taiwan
Abstract
BACKGROUND:
The morbidity of breast cancer has continuously achieved a global topicality. In particular, during the last decade several ten thousand female adults in Taiwan have been confirmed as breast cancer patients.
OBJECTIVE:
To predict the survival rate of breast cancer patients at various (0-IV) stages and provide efficient assessment of proposed radiotherapy for patients.
METHODS:
The prediction algorithm proposed is based on the revised hit and target model and implies the application of Taylor series expansion to the population-based survey dataset. The proposed algorithm features a specific function comprising a single simple exponential term
RESULTS:
Its calculated values for breast cancer patients who undergone radiotherapy at different stages 0-IV were {0.0029, 0.0066, 0.0178, 0.0475, 0.1785} yr
CONCLUSIONS:
The revised algorithm successfully interpreted the breast cancer patients’ survival rate at stages 0-IV and evaluated the necessity of radiotherapy for patients at various stages as well.
1.Introduction
The morbidity of breast cancer has continuously achieved a global topicality. In particular, during the last decade several ten thousand female adults in Taiwan have been confirmed as breast cancer patients, yet, even the state-of-the-art medical care fails to mitigate the mortality rate of nearly 2,000 persons per year [1]; so high lethal rate of the breast cancer is also related to its aggravation of chronic diseases like diabetes [2]. The early diagnostics of breast cancer is given the top priority status in Taiwan, which Department of Health (DOH) provides free annual mammographic screening for females over 40 years (X-ray or ultrasonic one for the age range from 40 to 50, X-ray only for female patients over 50) [3]. Many researchers and public health officers addressed the issue of early detection of breast cancer using a limited budget, in order to drop the mortality rate.
The comprehensive analysis of bountiful information obtained from many perspective surveys is also instrumental in guiding the public health strategies on a wide assistance to breast cancer patients. Liu et al. adopted the joint point regression analysis to trace the annual relative variations of incidence, prevalence, and survival outcome for breast cancer patients [4]. Huang and Yen substantiated the notion that a medium level of radiotherapy was usually helpful for breast cancer patients who underwent surgical operation, since it was reported to effectively improve the survival rate [5]. Chuang et al. investigated the survival rate for breast cancer patients at
Thus, the primary goal of this study was to predict the effect of different factors, including therapies, on the survival rate of breast cancer patients based on the huge data array obtained from Taiwan population survey of 2002–2017. The secondary goal was to validate the feasibility of the proposed approach using results of other scholars on other (rectum and colon) cancer cases and formulate solid recommendations based on the comprehensive interpretation of the quantified results. In doing so, the survival rate versus year was predicted, according to the Taylor series expansion algorithm, while the lethal frequency [yr
2.Material and methods
2.1Revised survival function via the Taylor series expansion algorithm
The survival rate of breast cancer patients can be derived via the Taylor series expansion. The algorithm is revised from the conventional hit and target model that is widely used for deriving the survival probability of a cell with direct and indirect action of different factors controlling DNA damage (see Eq. (1)). Accordingly, the survival rate
(1)
(2)
Thus, the survival rate is derived as follows:
(3)
(4)
(5)
(6)
Define term
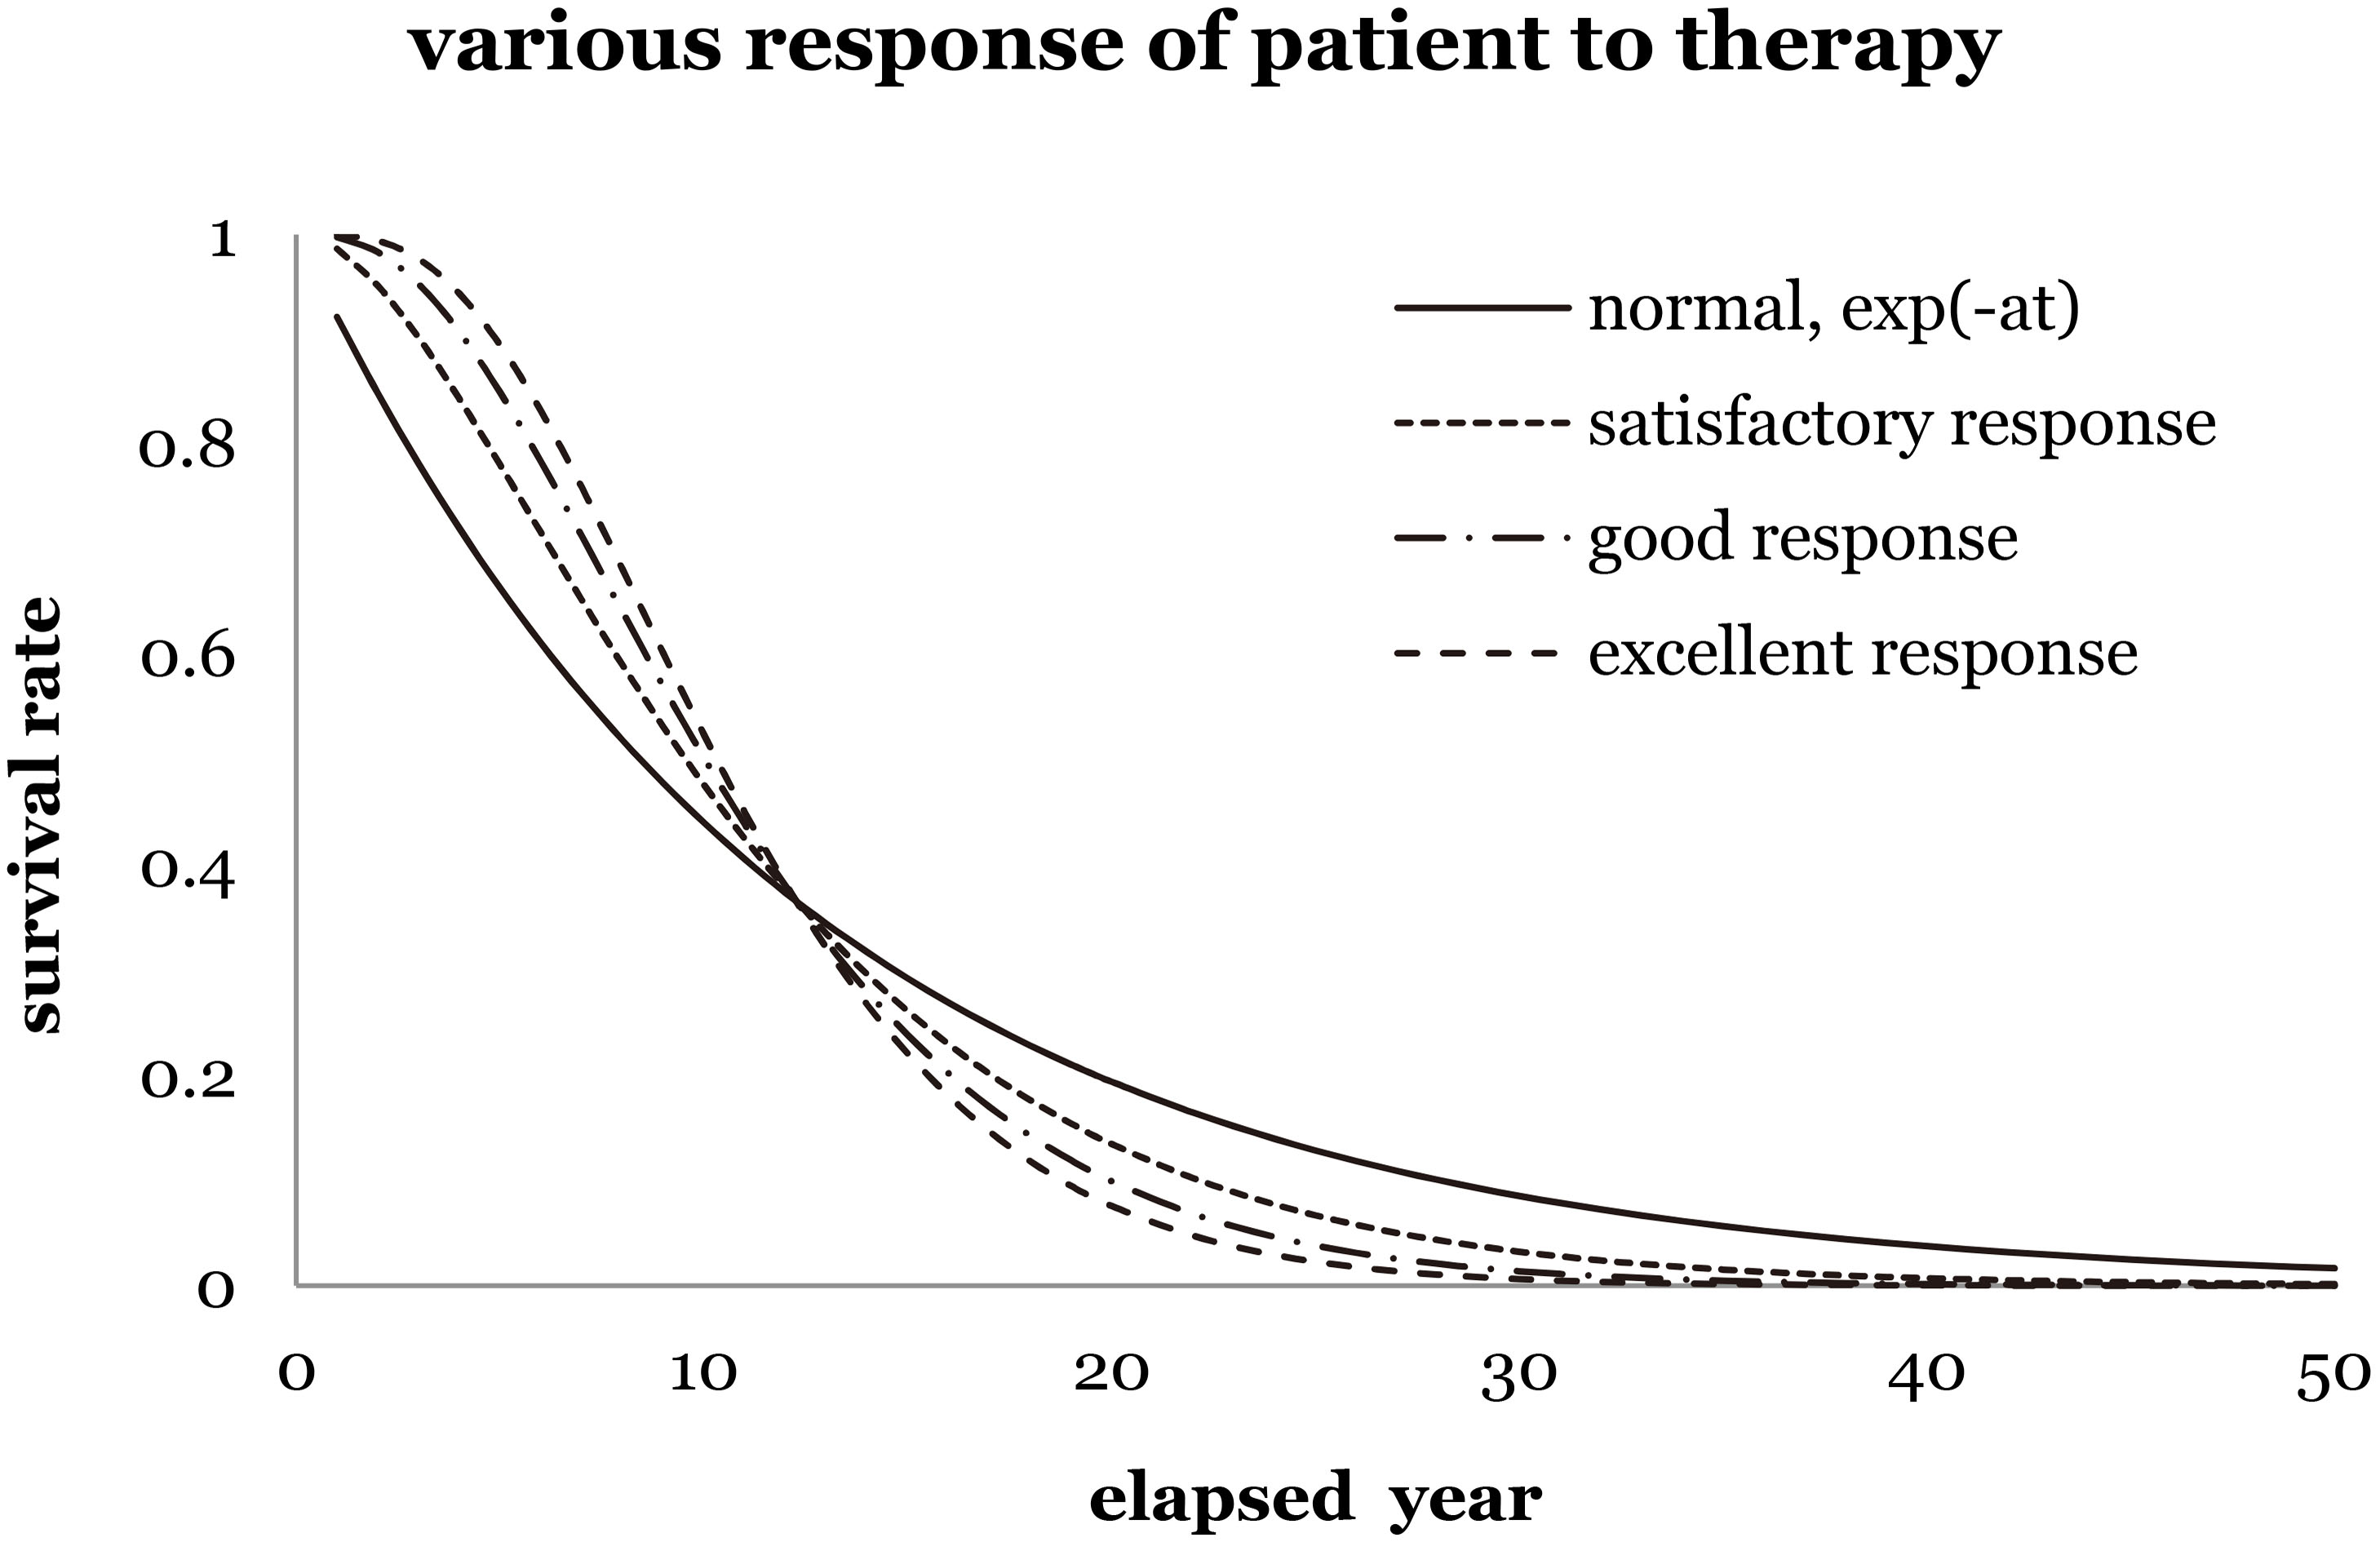
Figure 1 shows four kinds of prediction to imply different scenarios of survival rate corresponding to various levels of recovery. As clearly shown in Fig. 1, “normal exponential term” implies no additional recovery and zero shoulder effect. “Satisfactory response to therapy” indicates a satisfactory recovery of a patient, while a slight shoulder effect implies the improvement of additional survival rate. Either “good response” or “excellent response” implies good or excellent recovery of a patient, while and a medium or strong shoulder effect supports the increasing survival rate in reality.
Figure 1.
The survival rate of breast cancer female patients versus elapsed years for different responses to therapy (satisfactory, good, and excellent). For instance, set the lethal frequency is the inverse of the elapsed time of 12.20 yr of the normal exponential function,
A similar assumption was used in the hit and target model [8], which successfully interpreted the survival probability of a cell from the microscopic viewpoint. Restated, the revised algorithm is supposed to improve the prediction of survival rate from a massive data group and to interpret it from the statistical viewpoint on the basis of the Taylor series expansion. It makes use of a similarity between life predictions of cancer patients and vital radionuclides with an average decay constant
Figure 2.
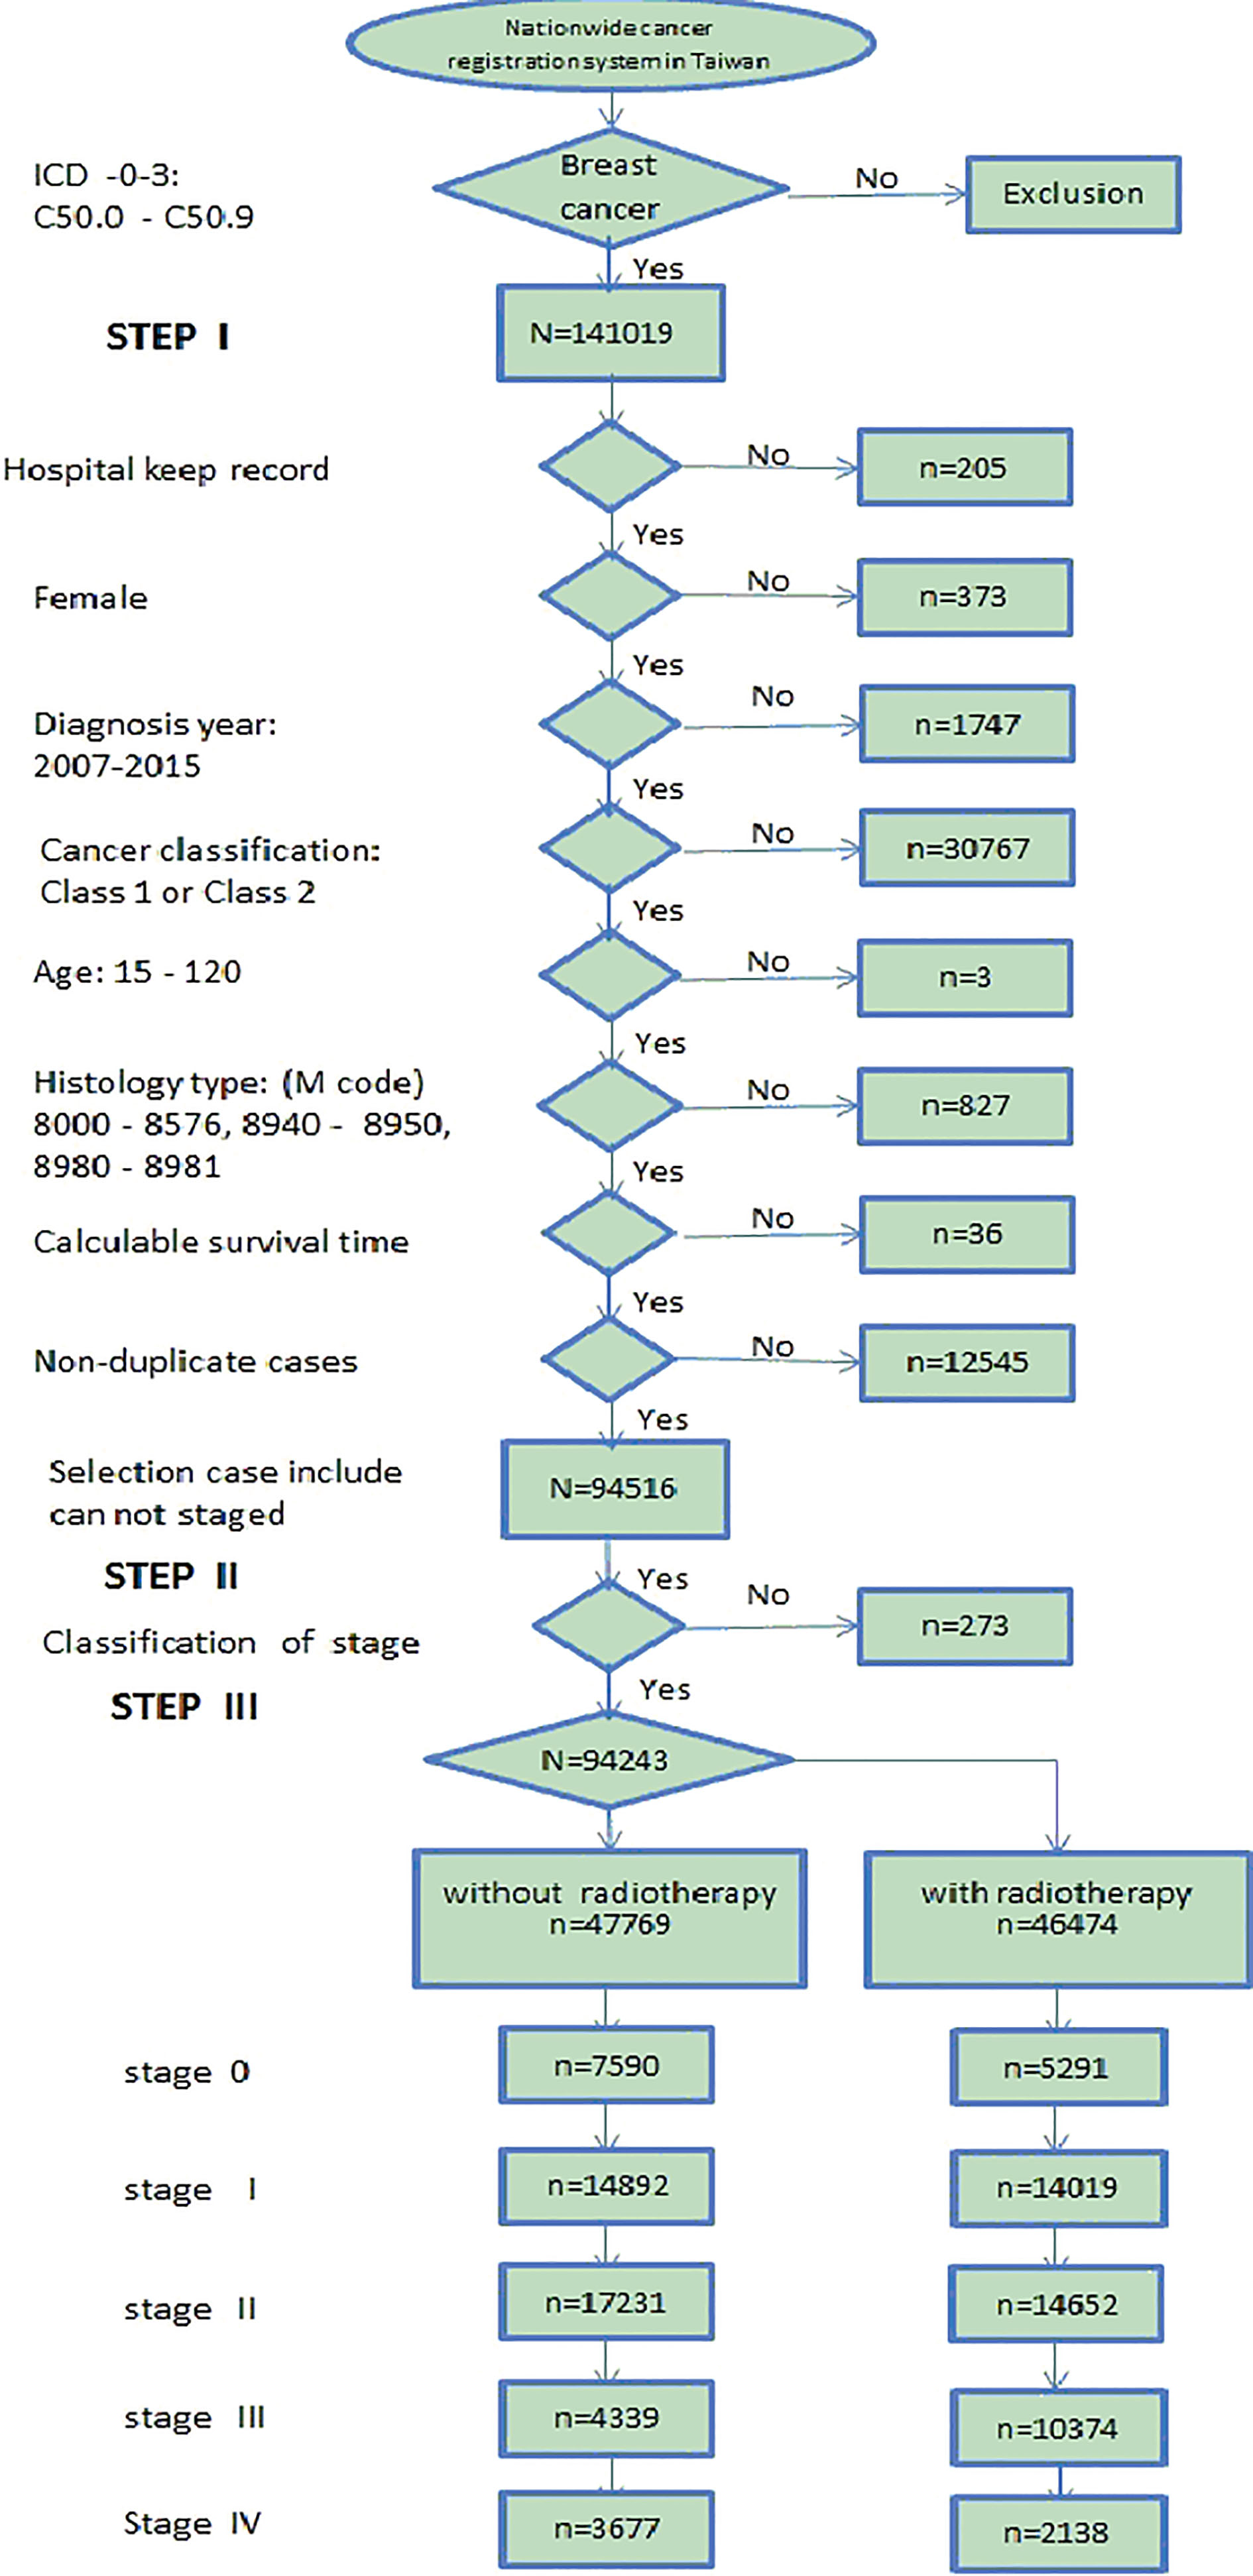
The flowchart of the data sorting in this study. The data were collected from 2007 to 2015.
2.2Data sorting for breast cancer patients
Figure 2 shows the flow chart of the data sorting in this study. The analyzed data were collected and sorted mainly from the Department of Health (DOH), Taiwan nationwide cancer registry data bank with de-identification process to create the broken point for personnel tracking. The total data for breast cancer patients were collected from 2002 to 2017, yet the analysis covered only the data starting from 2007 due to their completeness in the entire essential data recording format. The formal registered data for breast cancer patients (i.e., registry data following the code number C50.0-C50.9 by ICD-O-3 criteria) contained 141,019 events from 2007 to 2015 [10], which were subjected to the survival rate analysis at various stages in this study. Accordingly, one event was defined as one specific case dead and being recorded in the cancer registry data bank as an available “sensor” data. If the objects (cases) were still alive on December 31, 2015, then they were recorded as active and vital. The collected data were specifically focused on the cases diagnosed as breast cancer C50.0-C50.9 and excluded outliers [11], which fell into any of the following categories: (1) those excluded by hospital (207 cases), (2) not females (373 cases), (3) records were beyond the range of 2007
Table 1
The breakdown of breast cancer female patients by various stages (0-IV) in Taiwan, according to data collected from 2007 to 2015
| Stage | Without radiotherapy | With radiotherapy | Subtotal |
|---|---|---|---|
| 0 | 7600 | 5291 | 12891 |
| I | 14892 | 14019 | 28911 |
| II | 17241 | 14652 | 31893 |
| III | 4349 | 10374 | 14723 |
| IV | 3687 | 2138 | 5825 |
| Total | 47769 | 46474 | 94243 |
Table 2
Classification of various stages of breast cancer, in accordance with [11], where terms T, N and M denote tissue, lymph, and metastases, respectively
| Stage | General definition |
|---|---|
| 0 | T |
| I | T |
| II | T |
| III | T |
| IV | T |
Table 3
Major treatments for patients with breast cancer in Taiwan
| Stage | Major treatment for patients | Major treatment for patients |
|---|---|---|
| with no radiotherapy (NRT) | with radiotherapy (WRT) | |
| 0 | MRM (modified radical mastectomy) Hormone therapy if necessary | BCS (breast conservative treatment) |
| I | MRM | BCS |
| II | MRM | BCS |
| III | Similar treatment as for stage II | Neoadjuvant chemotherapy if large tumor size then BCS or MRM |
| IV | Systemic treatment (ex: chemotherapy, hormone therapy and target therapy) | Systemic treatment (ex: chemotherapy, hormone therapy, and target therapy) |
The most adopted definition of survival rate is defined as overall survival (OS), which is also referred to as observed survival. Accordingly, the purpose was to accurately predict the residual time for one event (e.g., death of a breast cancer female patient, irrelevant of its cause). This was also the most acknowledged model to assess the expediency of the respective treatment for prolonging the patient’s life from the clinical viewpoint. In this study, the analytical calculation was performed using Statistical Analysis System (SAS V9.4) software developed by SAS Institute (US) [12], while the computation of survival rate was performed via the Kaplan-Meier method, which description can be found elsewhere [13].
3.Results
3.1Survival rate of stages 0-IV of breast cancer patients
Figure 3 illustrates various survival rates of breast cancer patients of stages 0-IV as recorded from 2007 to 2015. The exponential trend of the survival rate can be easily regressed by Excel default feature for Major treatment for patients with radiotherapy (WRT) and Major treatment for patients with no radiotherapy (NRT) patients at stages 0-IV and had a high coefficient of determination,
Figure 3.
The survival rate of breast cancer patients in Taiwan with breakdown by various (0-IV) stages. The revised algorithm accurately predicted the survival rate with the lethal frequency estimation.
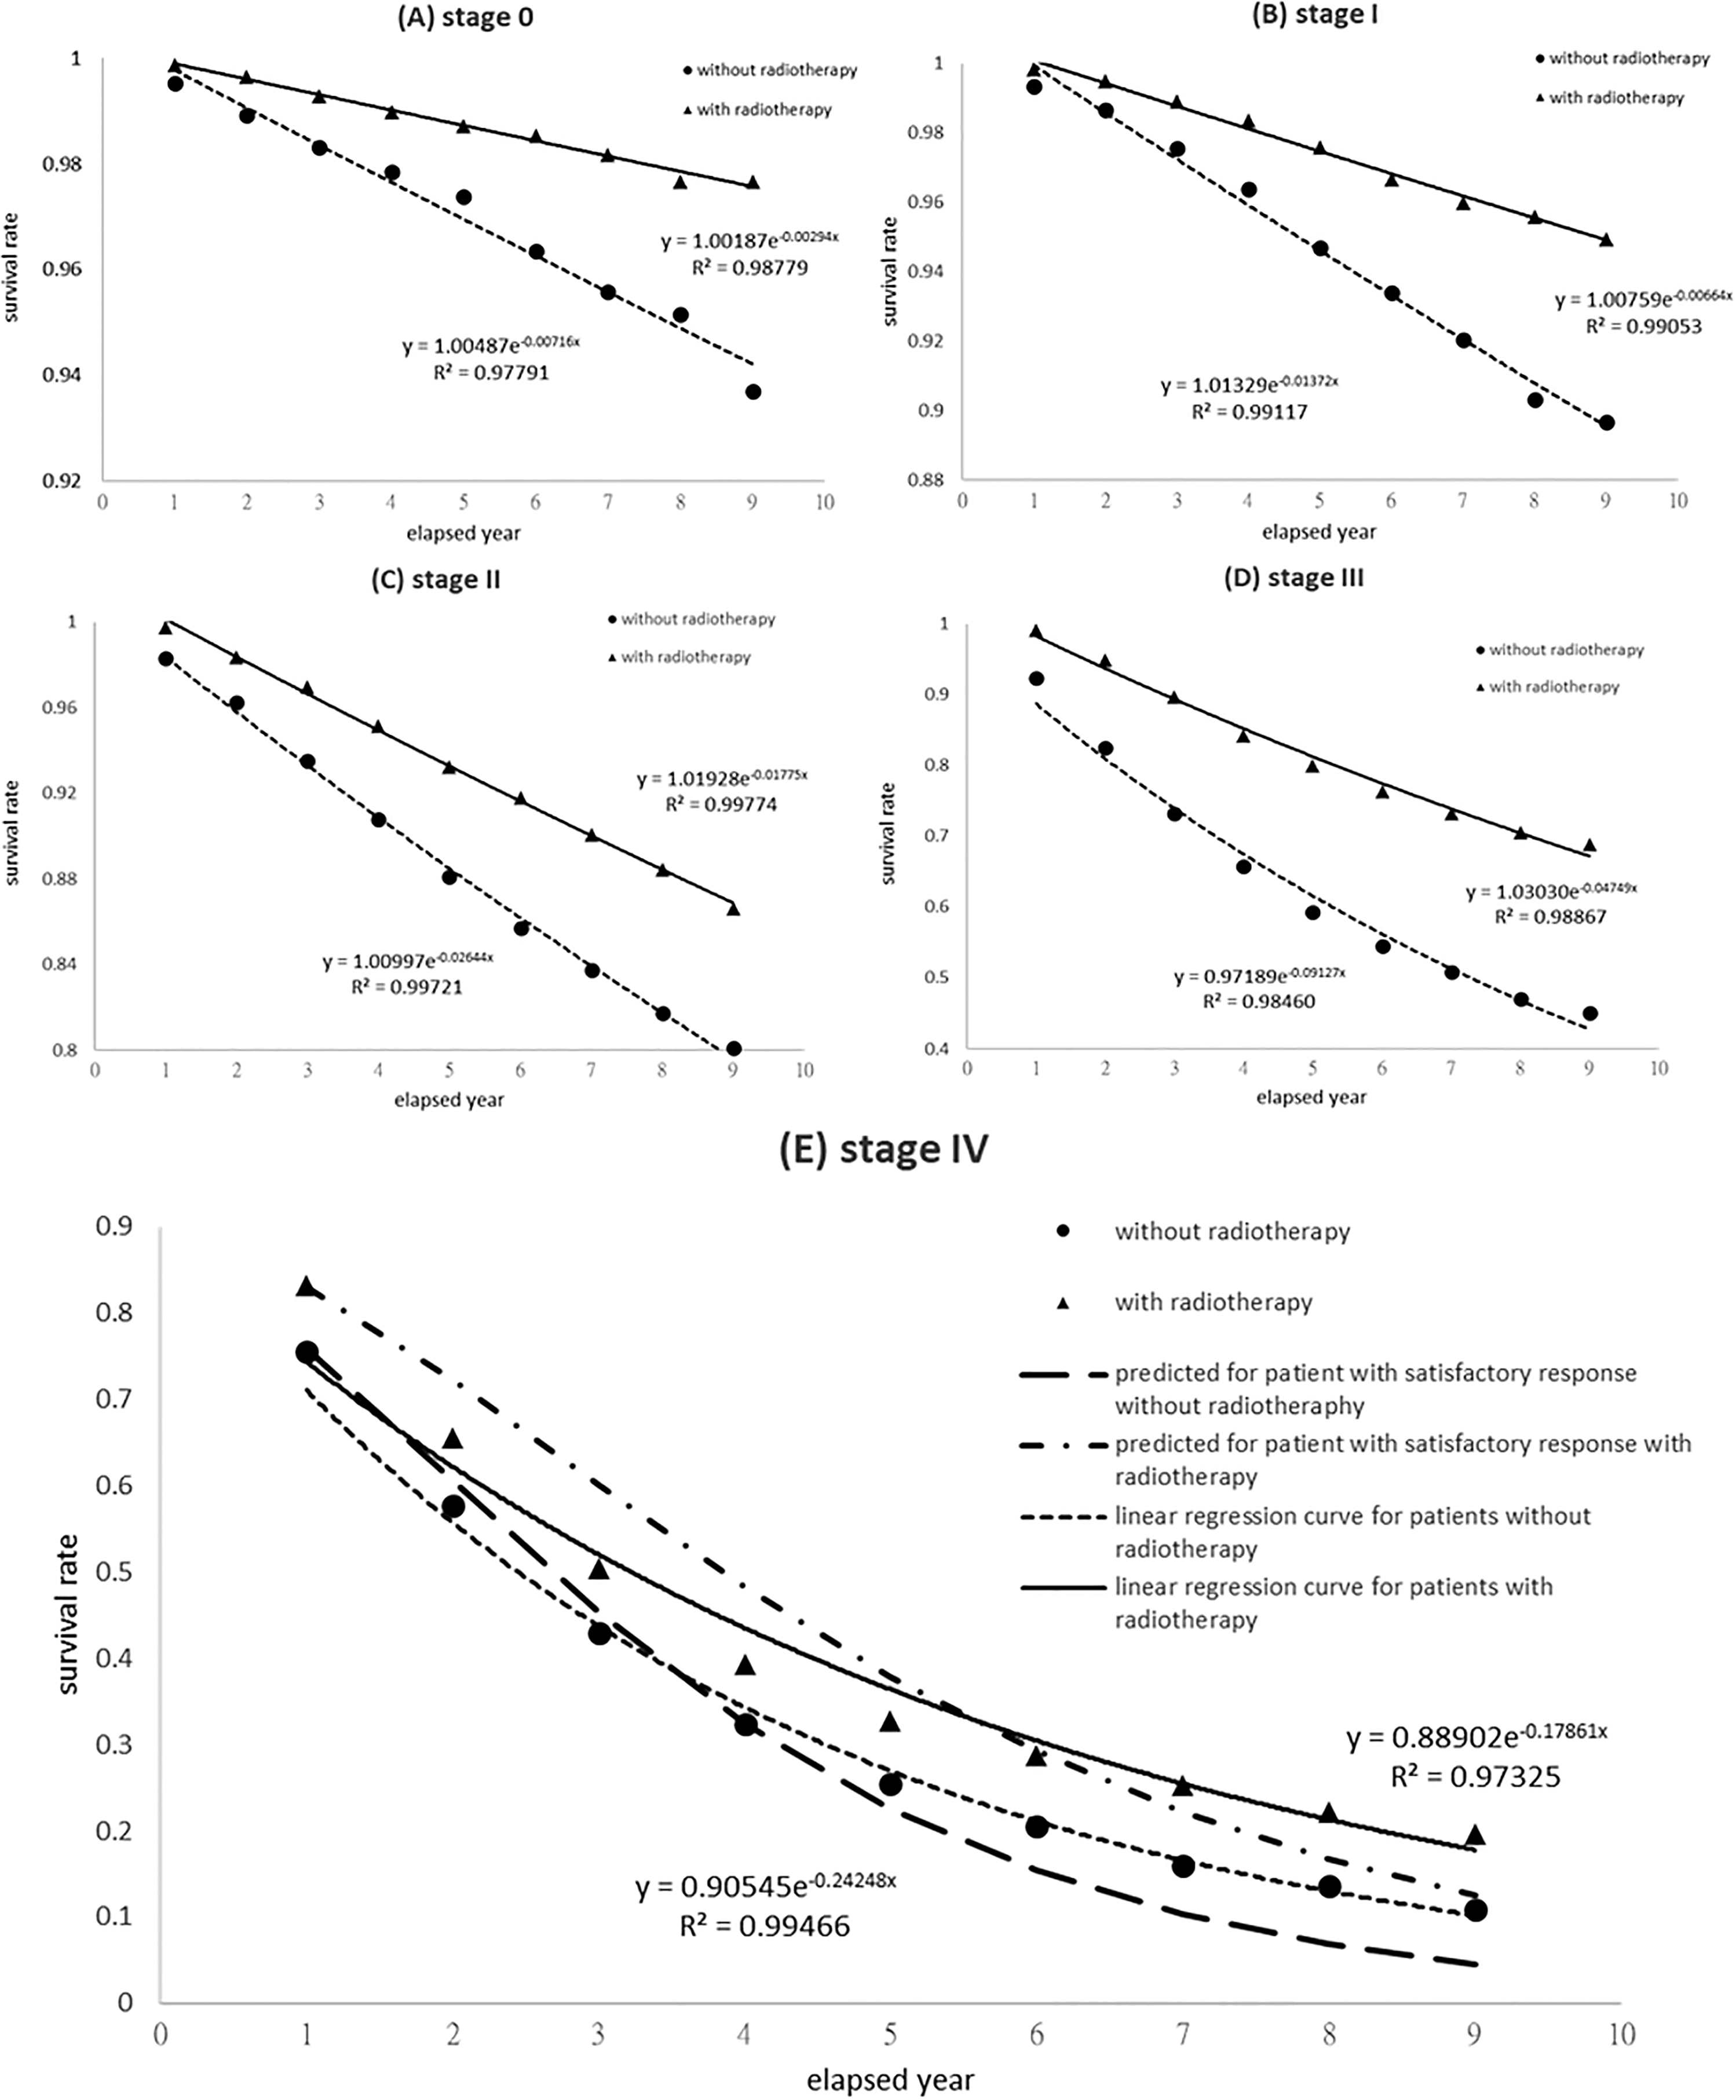
Table 4
Lethal frequency and average life estimations for breast cancer patients in Taiwan with breakdown by 0-IV stages
| Stage | Coefficient of determination, | Lethal frequency, | Average life, 1/ | |||
|---|---|---|---|---|---|---|
| No radiotherapy (NRT) | With radiotherapy (WRT) | NRT | WRT | NRT | WRT | |
| 0 | 0.97791 | 0.98779 | 0.0072 | 0.0029 | 139.7 | 340.1 |
| I | 0.99117 | 0.99053 | 0.0137 | 0.0066 | 72.9 | 150.6 |
| II | 0.99721 | 0.99774 | 0.0264 | 0.0178 | 37.8 | 56.3 |
| III | 0.98460 | 0.98867 | 0.0913 | 0.0475 | 11.0 | 21.0 |
| IV | 0.99466 | 0.97325 | 0.2425 | 0.1786 | 4.1 | 5.6 |
| IV | 0.5190 | 0.3822 | 1.9 | 2.6 | ||
3.2Taylor series expansion algorithm for patients at stage IV
To further inspect the predicted survival rate at stage IV in Fig. 3E, two thin lines (solid and doted ones) represent the linear regressed lines of raw data from Excel default feature for WRT and NRT patients, respectively, whereas another two thick lines (dashed-and-dotted and dotted ones) implied the theoretical predictions, according to the revised algorithm that assumed a satisfactory response to treatment for WRT and NRT patients, respectively (cf. Eq. (4)). As seen in Fig. 3 (E, stage IV), thick and thin lines exhibited a medium difference in the preliminary section. The derived shoulder effect disagreed with the collected events in either two groups, since a simple exponential term possessed a high coefficient of determination
4.Discussion
4.1Regrouping breast cancer patients at stage IV sorted by surgical operations
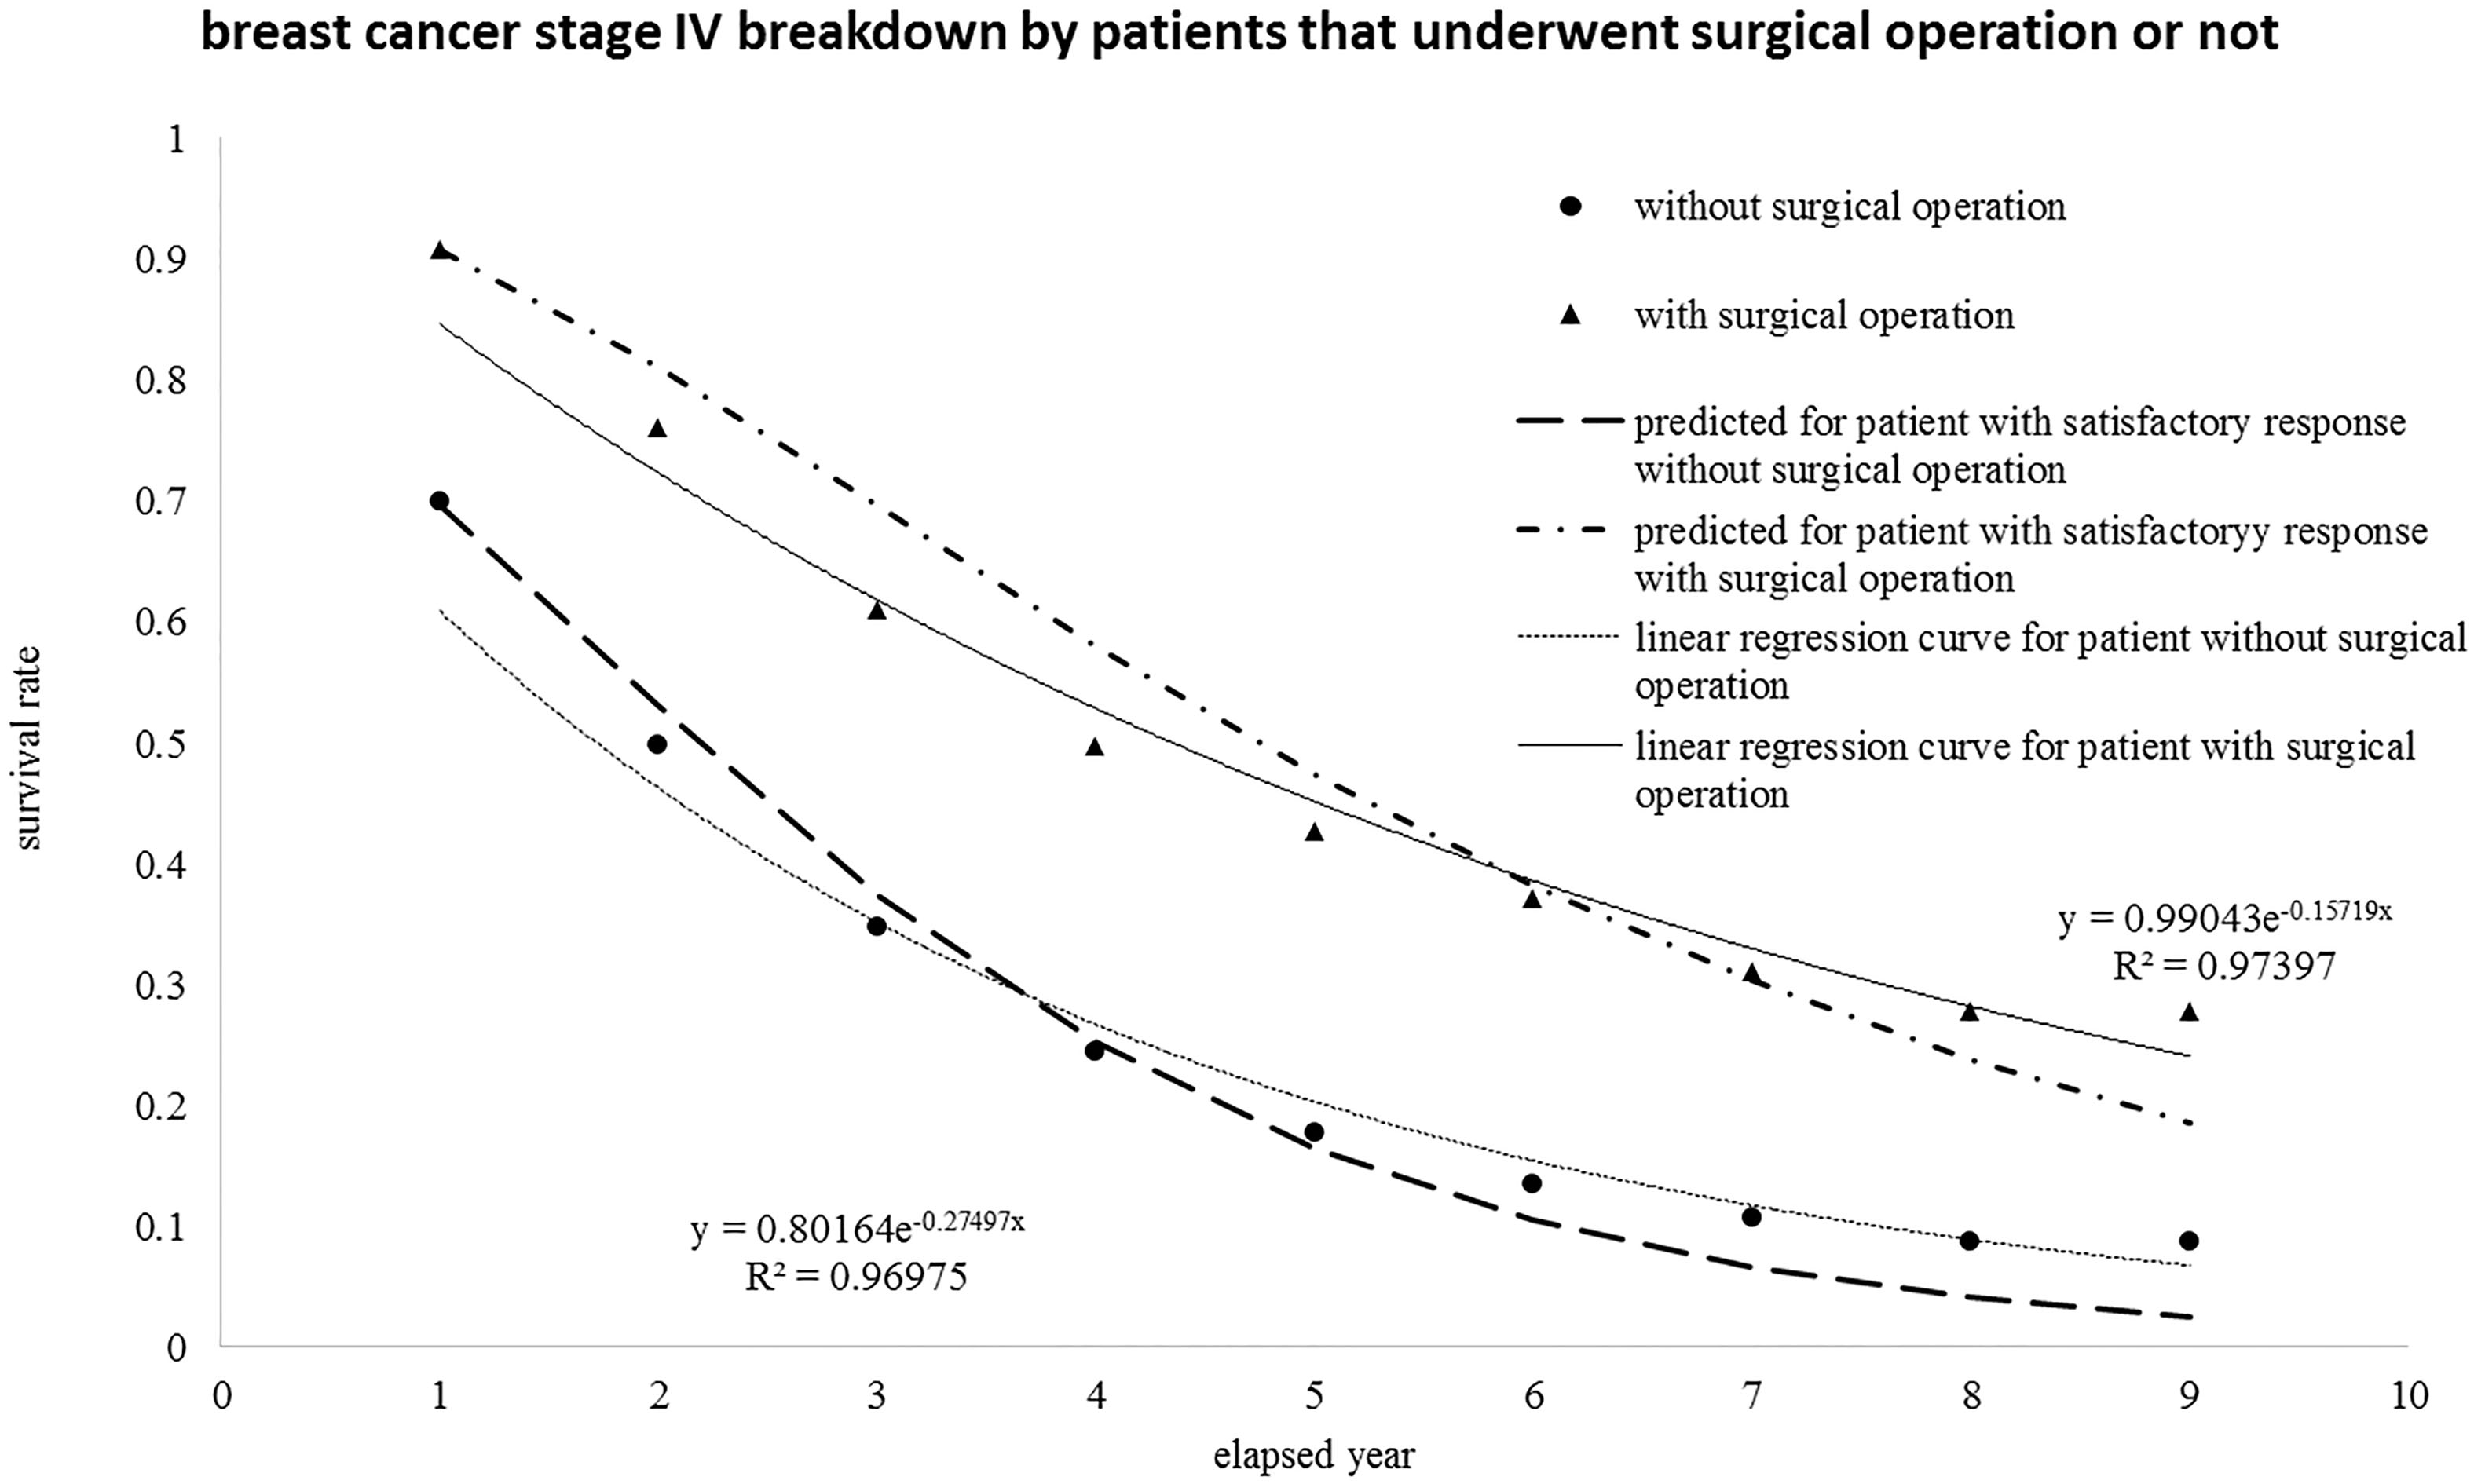
The events of breast cancer patient at stage IV can be regrouped and sorted by surgical operations. Accordingly, the new group of follow-up events at various stages undergone surgical operation or not versus annual year is {2376, 2143, 1867, 1627, 1481, 1411, 1371, 1343, 1334} and {3439, 2445, 1918, 1598, 1421, 1334, 1296, 1278, 1271}. Nevertheless, the total number of events is still 5815 (5818
Figure 4.
The same group of breast cancer patients at stage IV was reorganized with breakdown by those who underwent surgical operation or not and then re-plotted versus the elapsed year.
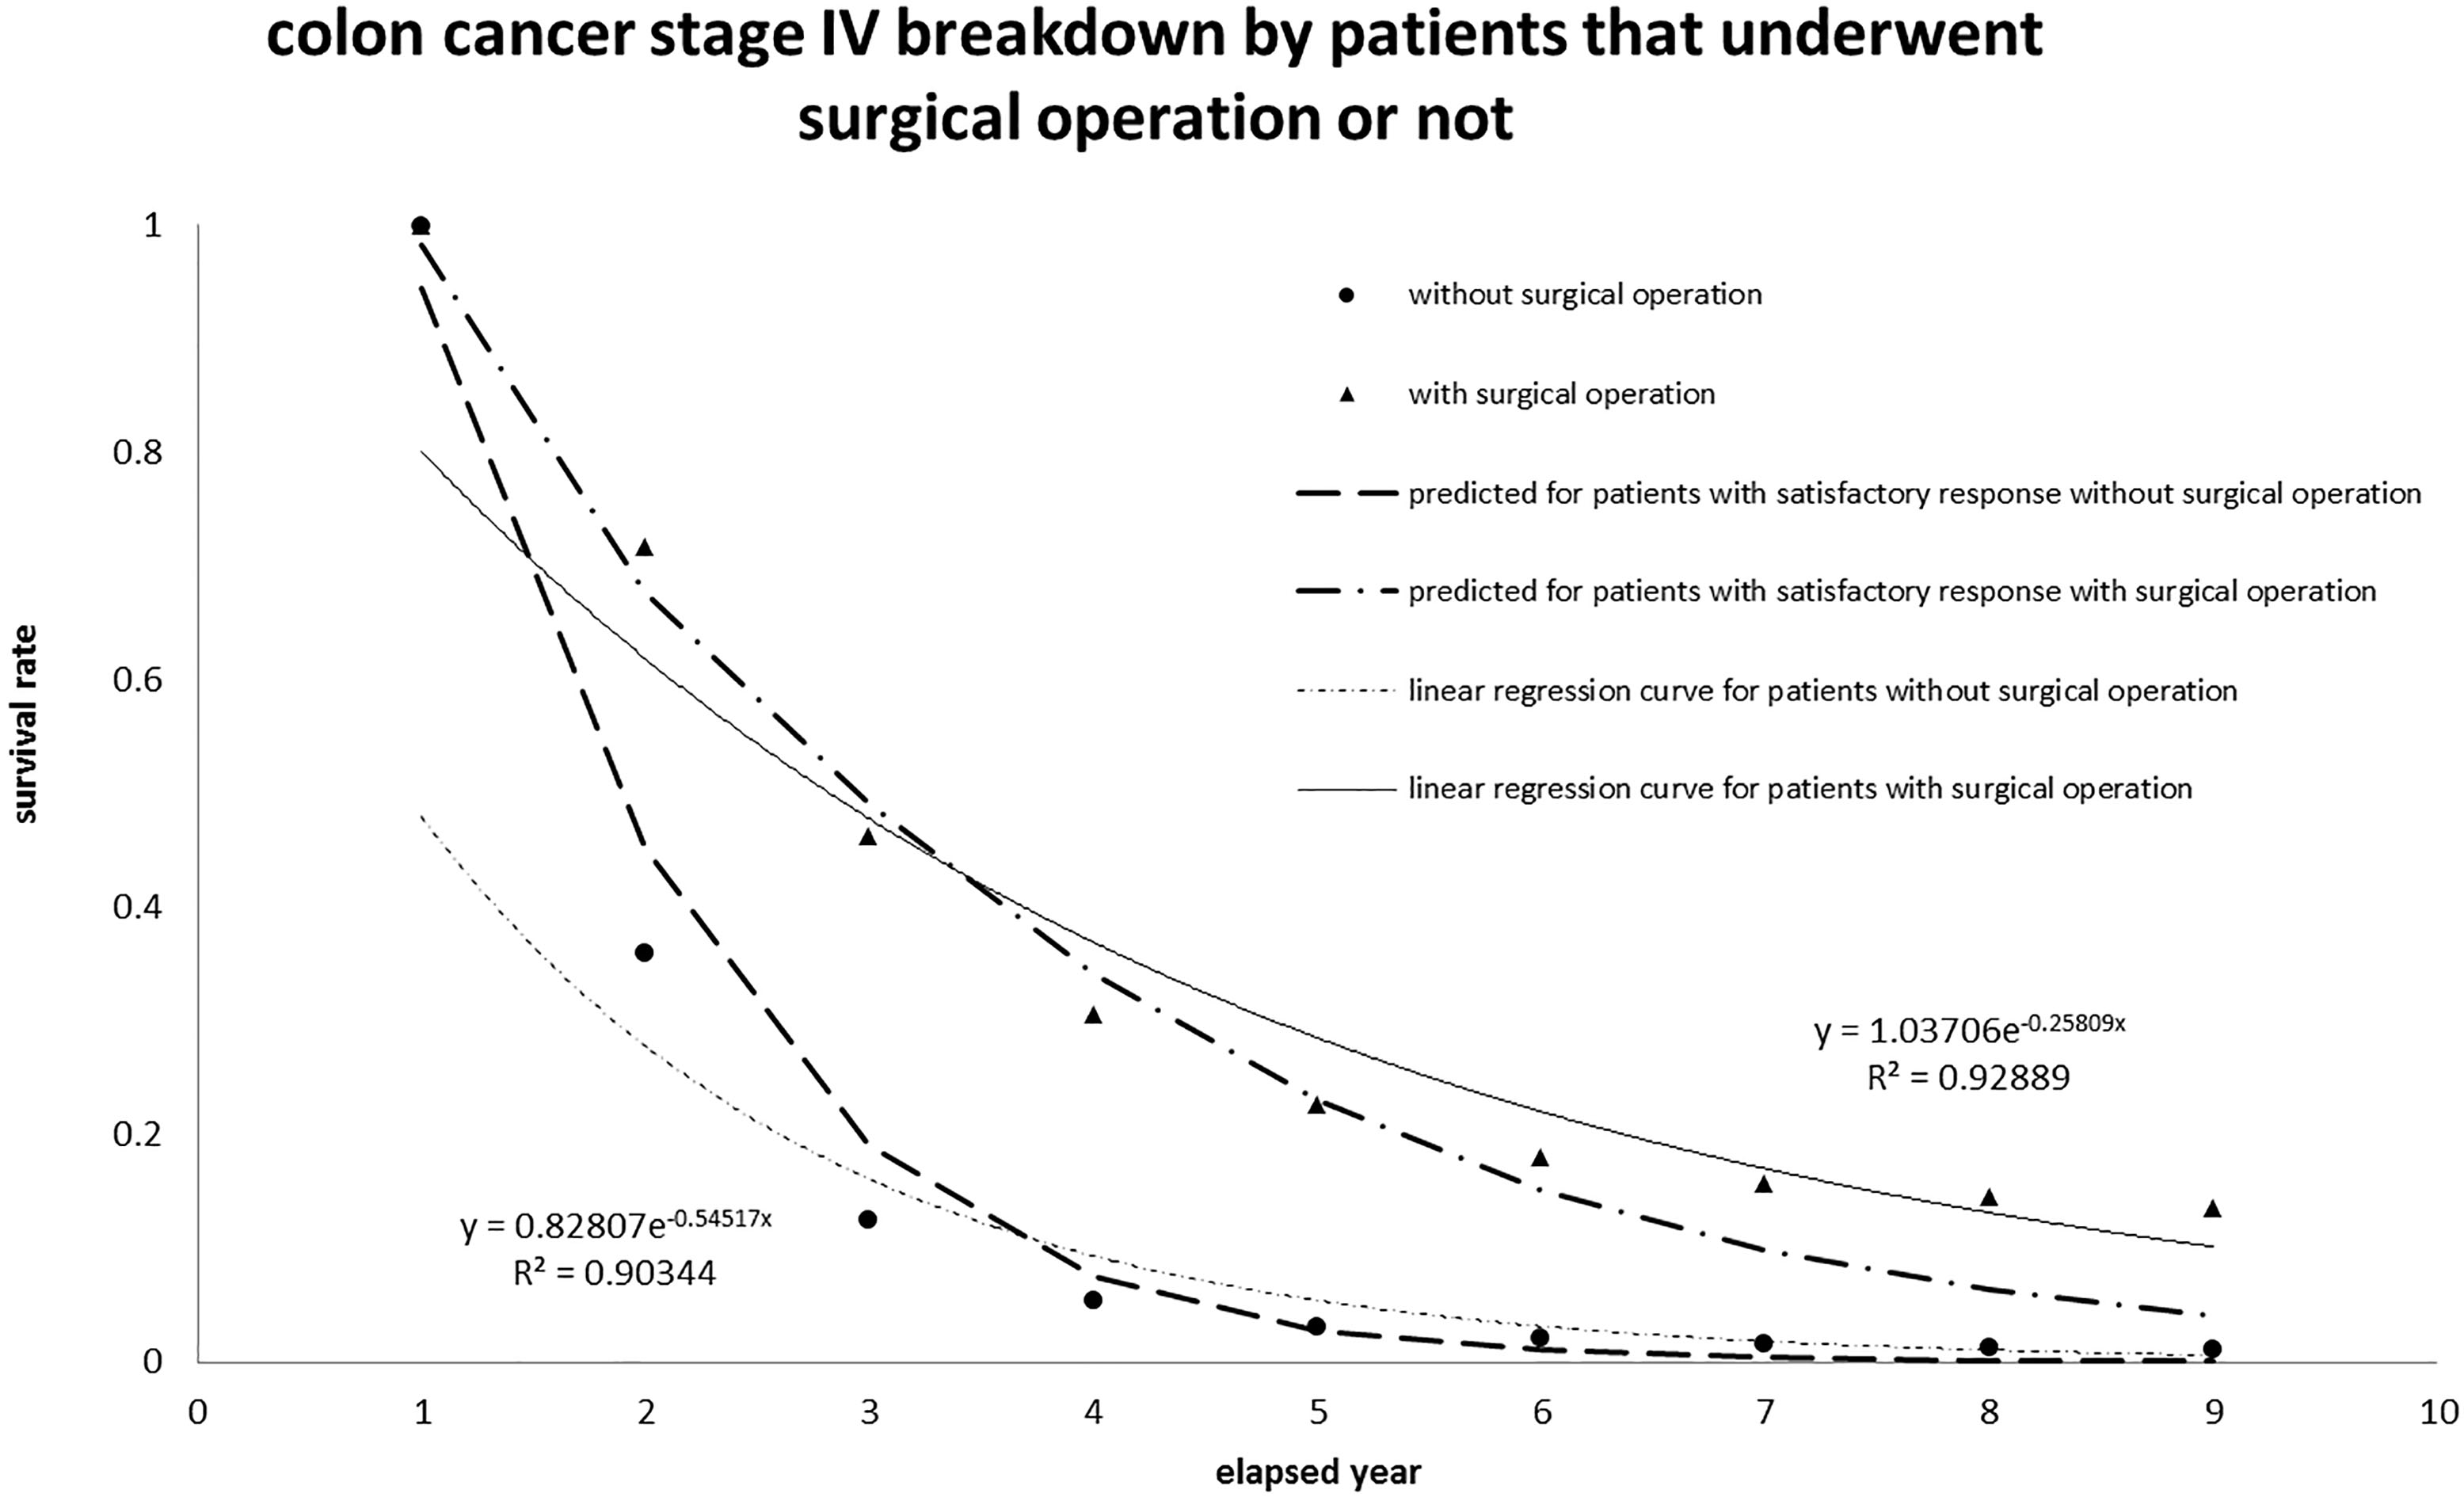
4.2Interpretation of the survival rate of colon and rectum cancer patients at stage IV
The survival rate for colon and rectum cancer patients at stage IV registered in Taiwan in the last decade was also analyzed and plotted in Fig. 5, according to the same algorithm. The data were collected from 2007 to 2015 with the screening code C18-C20 in the same ICD-O-3 data bank. The colon and rectum cancer patients were sorted into two classes: those undergone surgical operation or not; then the collected data versus annual period correspond to {13672, 10011, 7110, 5570, 4930, 4629, 5630, 4494, 4478} and {7725, 2999, 1521, 1148, 1052, 1017, 1003, 997, 995}. The total number taken into account was 21487 (21397
Table 5
Application of the proposed revised algorithm to data from [7, 16, 17] with estimation of lethal frequency, average life, and respective cancer progress scenario
| Source | Study subject | Definition | Specific description | Scenario | Lethal | Average |
|---|---|---|---|---|---|---|
| frequency | life [yr] | |||||
| [yr | ||||||
| [7] | Squamous cell cancer of breast | Overall survival rate | With radiotherapy (WRT) | I | 0.050 | 20.0 |
| cancer patient | Without RT (NRT) | I | 0.086 | 11.7 | ||
| [7] | Stage II Squamous cell cancer | Overall survival rate | WRT | I | 0.040 | 25 |
| of breast cancer patient | NRT | I | 0.120 | 8.3 | ||
| [16] | Occult breast cancer (OBC) | Overall survival rate | After axillary lymph node | I | 0.092 | 10.8 |
| dissection (ALND) | ||||||
| ALND | I | 0.046 | 21.7 | |||
| [17] | Renal disease dialysis patients | Overall survival rate | Male patients | I | 0.167 | 6.0 |
| Female patients | I | 0.067 | 15.0 | |||
| [17] | Renal disease dialysis patients | Overall survival rate | Male patients with liver | I | 0.300 | 3.3 |
| cancer | ||||||
| Female patients with liver | I | 0.400 | 2.5 | |||
| cancer |
Figure 5.
Application of the proposed algorithm to colon cancer patients at stage IV recorded in Taiwan. The interpretation fitted well and implied Scenario I (“patient has satisfactory response to therapy”).
4.3Re-evaluation of survival rate data from other sources
The same algorithm was also tested on survival rate data of other researchers’ listed in Table 5. Noteworthy is that the overall survival rate can be easily replaced by quantified lethal frequency or average life to represent its unique characteristics. In addition, none of these performances shows a satisfactory response to therapy, thus, the reported data fit Scenario I “patient expired because of disease progression”. As shown in Table 5 bottom row, the renal disease dialysis female patients with liver cancer had the shortest average life (2.5 year), whereas the renal disease dialysis female patients without cancer still had 15 years of average residual life. The advantage of revised algorithm is to provide a quantitative index, either lethal frequency or average life, in order to imply the whole survival rate curve under any specific circumstance if and only if the estimated exponential function can properly fit the original data. Therefore, the revised algorithm based on the Taylor series expansion provided the accurate prediction of (i) the survival rate of breast cancer patients, (ii) effectiveness verification of radiotherapy for colon and rectum cancer patients [7, 16], and (iii) re-evaluation of the disease progression for patients of both genders reported by other researchers [17].
5.Conclusion
A revised algorithm to predict the survival rate of breast cancer patients at various (0-IV) stages was proposed according to Taylor series expansion and population-based survey in Taiwan (2007–2015). The algorithm can improve the accuracy in predicting the survival rate by incorporating an additional term of patient’s recovery from therapy into the original survival rate regression. Four kinds of recovery for breast cancer patients undergone radiotherapy or not (WRT or NRT) were assigned, in compliance with the hit-Target model, which was earlier proposed for analyzing the cell death from the microscopic viewpoint. Accordingly, the expression of patient’s survival rate can be expressed by a simple exponential function or that multiplied by an additional term to represent the recovery mechanism. The patient’s recovery from the specific therapy could be assessed for different levels of shoulder effect on the survival rate prediction. A wide shoulder always implied a satisfactory response to the therapy and thus increased the survival rate. The survival rate could be quantitatively defined by the lethal frequency, which large values implied a low survival rate and short average life of the patient under study. The interpretation of lethal frequency was similar to the decay constant in the radionuclide decay process. The algorithm was also applied to interpret the survival rate of colon and rectum cancer patients at Stage IV and also exhibited a good agreement with actual collected data.
Acknowledgments
The authors would like to thank the Ministry of Science and Technology of the Republic of China for the financial support of this research (contract no. MOST 106-2221-E-166-002).
Conflict of interest
None to report.
References
[1] | Cancer Registry Annual Report, Health Promotion Administration, Ministry of Health and Welfare, The Executive Yuan, Taiwan 1995–2015. |
[2] | Peairs KS, Barone BB, Snyder CF, et al. Diabetes mellitus and breast cancer outcomes: A Systematic review and meta-analysis. Journal of Clinical Oncology. (2011) ; 29: (1): 40-46. |
[3] | Berry DA, Cronin KA, Plevritis SK, et al. Effect of screening and adjuvant therapy on mortality: Breast cancer. N Engl J Med. (2005) ; 353: : 1784-1792. |
[4] | Liu FC, Lin HT, Kuo CF, et al. Epidemiology and survival outcome of breast cancer in a nationwide study. Oncotarget. (2017) ; 8: (10): 16939-16950. |
[5] | Huang PI, Yen SH. Radiotherapy for breast cancer. J. Chinese Oncol. (2008) ; 24: (2): 121-126. |
[6] | Chuang WK, Cheng CT, Tsai YC, et al. Post-mastectomy radiotherapy in N1 breast cancer patients: a propensity score matching analysis using Taiwan cancer registry database. Therapeut Radiol Oncol. (2016) ; 23: (4): 249-257. |
[7] | Wu SG, Sun JY, Liu WM, et al. Effect of postoperative radiotherapy for squamous cell cancer of the breast in a surveillance epidemiology and end results of population-based study. Oncotarget. (2016) ; 7: (9): 10684-10693. |
[8] | Wang TH, Kittipayak S, Lin YT, et al. Quantification the in vitro radiosensitivity of Mung bean sprout elongation to 6MV X-ray: A revised target model study. Plos One. (2015) ; 10: (6): e0128384, DOI: 10.1371/journal.pone.0128384. |
[9] | Turner JE. Atoms, Radiation, and Radiation Protection, 2nd ed. John Wiley & Sons, Inc. (2000) . ISBN 978-3-527-40606-7. |
[10] | ICD-O-3, International Classification of Diseases for Oncology, Third Edition, World Health Organization International, (2000) . |
[11] | Cancer Staging Manual, American Joint Committee on Cancer, 8 |
[12] | SAS, Statistical Analysis System Institute, July, (2013) . https://www.sas.com/en_us/software/sas9.html. |
[13] | Rich JT, Neely JG, Paniello RC, et al. A practical guide to understanding Kaplan-Meier curves. Otolaryngol Head Neck Surg. (2010) ; 143: (3): 331-336. |
[14] | Kuo HN, Yi JE, Chen CH, et al. Taguchi dynamic analysis application to computer tomography number-mass density linear dependence optimization, Computer Assisted Surgery, (2017) . http://dx.doi.org/10.1080/24699322.2017.1378791. |
[15] | Yeh DM, Wang THA, Pan LK. Evaluating the quality characteristics of TLD-100T and TLD-100H exposed to diagnostic X-rays and 64 multislice CT using Taguchi’s quality loss function. Radiation Measurement. (2015) ; 80: : 17-22. |
[16] | Wu SG, Zhang WW, Sun JY, et al. Comparable survival between additional radiotherapy and local surgery in occult breast cancer after axillary lymph node dissection: a population-based analysis. J. of Cancer. (2017) ; 8: (18): 3849-3855. |
[17] | Chien CC, Han MM, Chiu YH, et al. Epidemiology of cancer in end-stage renal disease dialysis patients: a national cohort study in Taiwan. J. of Cancer. (2017) ; 8: (1): 9-18. |


