
A novel analytical method of TFMPP and mCPP in fluids of drug addicts using LLE-GC/NPD
Abstract
In recent years, drug-abuse problem is growing by leaps and bounds all over the world. The master minds spearheading its proliferation among the youth are difficult to identify, so drug-abuse case has become a hard nut to crack even with the help of best international experts in forensic science and criminology. Because most nations have tightened their controls on traditional drugs, the younger generation is now hooked onto new-type drugs: 1-(3- trifluoromethylphenyl) piperazine (TFMPP), 1-(3-chlorophenyl) piperazine (mCPP) and other new piperazine-drugs, acting as hallucinogens like ‘ecstasy’, are being consumed by vulnerable masses all over the world. However, only few research studies have focused on developing highly effective detection methods for TFMPP and mCPP in biological fluids; the number of detection methods for these new-type drugs is almost nil in China. Therefore, it is difficult to detect and prevent drug abuse cases related to piperazine drugs in China. There is an urgent need to develop some simple, fast, and reliable methods for detecting piperazine-drugs in vulnerable masses. Thus, the development of novel detection methods with high sensitivity and selectivity is a difficult task for the officials working in the department of forensic science in China. In this work, a new method was developed for the detection of piperazine derivatives: it was performed under the various specific conditions required for conducting chromatography and mass spectrometry analysis. With this novel method, TFMPP and mCPP was successfully detected with high accuracy in various biological samples. By comparing the purification effect of different solid-phase extraction columns for TFMPP and mCPP in biological fluids (urine and blood), we confirmed the validity of the novel method. In addition, this method has good linear relationship and a low detection line when GC/MS was performed for detecting TFMPP, mCPP in the biological fluids (urine and blood). It is a simple, reproducible method that is highly specific in the detection of piperazine-drugs. Thus, it is indeed a reliable method in forensic science.
1.Introduction
Although the global economy has grown by leaps and bounds in the past few decades, it has also led to some serious malaise among vulnerable masses, such as youth and children. Drug abuse issues have also increased tremendously all over the world in recent times, and these menacing issues can seriously diminish the social security of any country within a very short period. People who are addicted to drugs are not just unproductive but they are also usually involved in public-order crimes. In recent years, youngsters have got hooked onto new-type drugs, such as ‘party pill’, ‘Club drugs’, etc. [1]. In new-type drugs, the most common psychoactive drug substances are as follows: synthetic cannabinoid, phenylethylamine, synthetic kathy ketone, tryptamine, and piperazine. Our aforementioned pharmacological analysis is based on the official statistics in 2012 (Fig. 1). In particular, piperazine derivatives are representative substitutes of ‘ecstasy’ [2]. In recent years, the incidence of piperazine drug abuse has been reported in many countries such as New Zealand, America, and Japan; however, a new uniform framework of law has not been introduced till date to prevent the rampant use of new-type drugs, so youngsters get easily hooked onto these drugs and the menace seems to be uncontrollable these days [3]. Meanwhile, many research studies today are focusing their investigation on N phenyl piperazine in order to understand the pharmacological activity of this compound [4, 5, 6, 7, 8, 9, 10, 11]. Both TFMPP and mCPP are N-phenyl-piperazine derivatives; these compounds are drugs with mind-altering nature. Therefore, they are included in the class of illegal drugs.
![The new psychoactive drug is confirmed in 2012 [24].](https://content.iospress.com:443/media/thc/2019/27-S1/thc-27-S1-thc199008/thc-27-thc199008-g001.jpg)
To investigate and verify cases related to incessant consumption of new-type drugs and to detect addicts of new-type drugs, GC/MS is one of the most useful means of detection and so it is used extensively in the latest techniques of drug analysis. In forensic diagnosis, the blood and urine of drug addicts can be used to analyze and diagnose cases of new-type drug consumption [12]. The drug lasts for several hours in the human body; however, the half-lives of different drug abuse are also different [13, 14, 15, 16], so it is very difficult to detect them. During biological fluid testing, the following two steps are used to determine the content of drugs: i) purification of extractand ii) analysis of testing. Presently, one of the most difficult problems in forensic science is the inability to complete the detection of drug substance rapidly, because the drug substance has a complex composition and biological fluids are the most common interfering species during detection. The most common methods of pretreatment are protein precipitation, liquid-liquid extraction (LLE), and solid-phase extraction (SPE). On the other hand, the methods used in the detection of TFMPP and mCPP are as follows: HPLC/V, HPLC/FD, LC/MS, CZE/UV, etc. [17, 18, 19, 20, 21, 22, 23]. However, capillary zone electrophoresis has complex operations, and the related results do not have an appreciable accuracy. In this case, the results are not accurate enough to meet the standards of forensic science. This is because the sensitivity and reproducibility of UV detector is not good enough to detect TFMPP and mCPP in biological fluids. Therefore, our objective was to determine whether GC/MS was suitable for the detection of drugs in this study.
Gas chromatography-mass spectrometry (GC/MS) is the most commonly used technique in China. Moreover, GC/MS is an industry standard method used for detecting toxic substances in many biological fluids. The principle of gas chromatography is based on the distribution order of characteristic peaks of each component of a given solution; these components get separated according to their distinct adsorption capacity in the column. Thus, the analyte is successfully isolated from the sample and subjected to further investigation. Subsequently, the analyte is separated by protonation, and mass spectrometry provides information about the mass-charge ratio of the ions obtained by protonation. Thus, GC/MS exhibits high separation efficiency by effectively separating all the components of any given sample. Furthermore, owing to the large database of mass spectrometry, the integrated technique of GC/MS also ensures that the identification results are exceedingly high in most cases. All the aforementioned observations establish that GC/MS is a suitable technique for conducting qualitative and quantitative analysis of most drug poisons. With this integrated method, piperazine derivatives, such as trifluoromethylphenylpiperazine (TFMPP) and meta-chlorophenylpiperazine (mCPP), can be detected without derivatization [25]; the method’s results have precision that is usually greater than 20% provided the limit of detection is 5
In this paper, previous jobs were further confirmed and depended [27, 28]. Gas chromatography mass spectrometry (GC/MS), a popular method of every analytical chemistry laboratory, is investigated to determine whether it can be used as an instrument analysis method for the detection of TFMPP and mCPP. Moreover, researchers have also comprehensively studied all the possible methodologies of this method, and they have suggested instrumental improvements subsequently.
2.Results
2.1Validation of the method
2.1.1Calibration curves
The standard working solution TFMPP-mCPP mixed solution (from “4.4.2 Sample pretreatment”) was prepared and diluted with methanol to form solutions of the following concentrations: 100
Table 1
Standard Curve Equations of TFMPP and mCPP standard derived by GC/MS analysis
| Drug-matrix solution | Concentration range ( | Curve equation | R |
|---|---|---|---|
| TFMPP | 0.1–100 | y | 0.9990 |
| mCPP | 0.1–100 | y | 0.9997 |
2.1.2Limits of quantification and detection
Table 2 presents the limits of detections (LODs) and limits of quantifications (LOQs) for the TFMPP and mCPP standard solutions. Interestingly, same values were observed for both the substances.
Table 2
LOQs and LODs of TFMPP and mCPP by GC/MC
| LOQ (S/N | LOD (S/N | |
|---|---|---|
| TFMPP | 0.1 | 0.08 |
| mCPP | 0.1 | 0.08 |
2.1.3Precision evaluation
In this experiment, the quality control samples (QC) included only TFMPP and mCPP standard solutions with an intermediate concentration (10
Table 3
Precision study on 5 replicates
| Concentration | Mean value | ||
|---|---|---|---|
| ( | Intra-day | Inter-day | |
| TFMPP | 1 | 3.4 | 4.3 |
| 10 | 2.5 | 2.7 | |
| mCPP | 1 | 3.2 | 3.6 |
| 10 | 2.4 | 3.2 | |
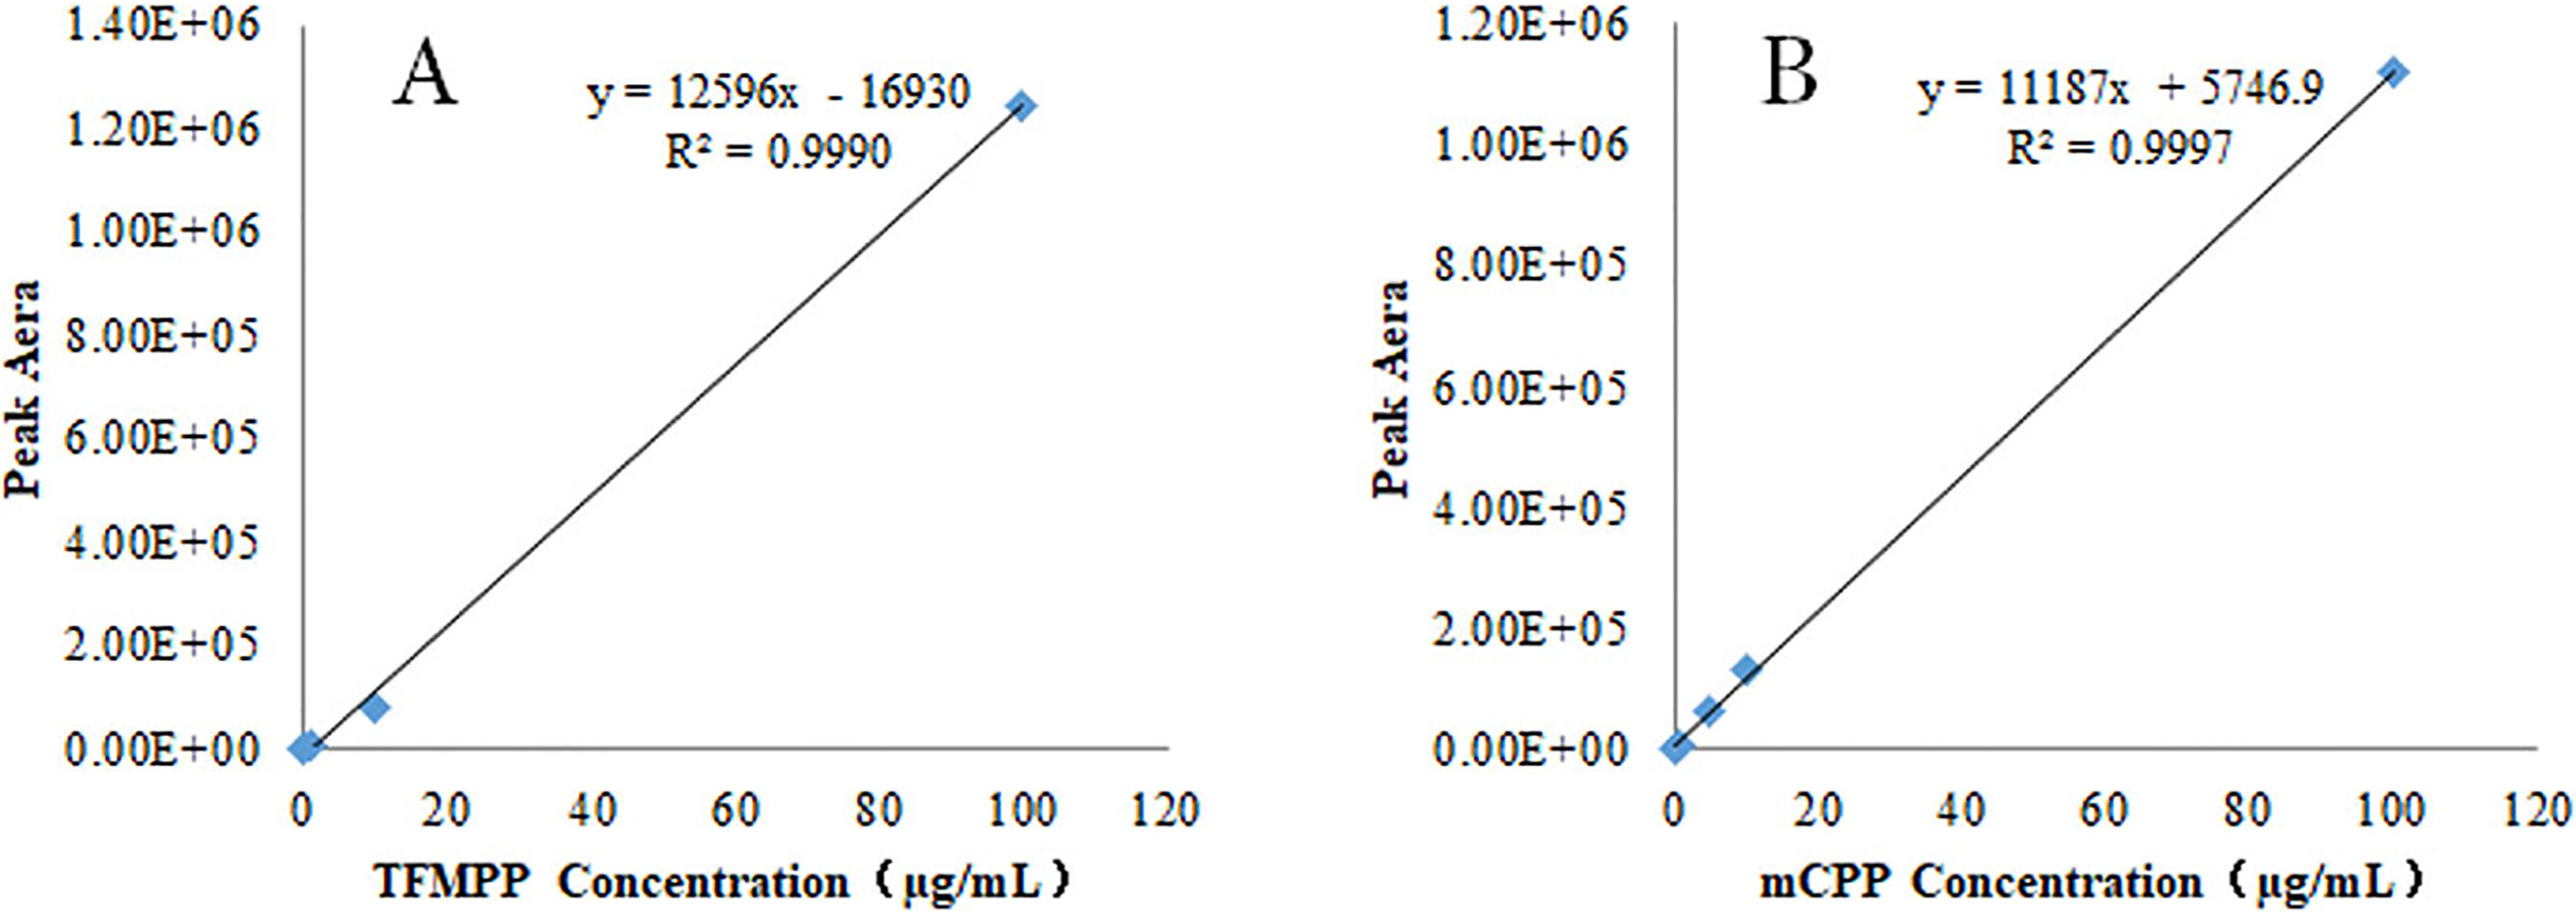
Figure 2.
Calibration curve for TFMPP (A) and mCPP (B) standard working solution.
2.2Detection of TFMPP and mCPP in urine: Calibration and validation
2.2.1Standard curve, limits of quantification, and detection
The standard curve was plotted after analyzing urine samples in parallel; these urine samples contained different concentrations of TFMPP and mCPP. Three replicate analyses of each urine sample were performed to determine the reproducibility of results. In this experimental analysis, 0.9 ml aliquot of five samples was taken from the blank urine. Then, mixed standard solutions of 0.1 mL were prepared using different concentrations of TFMPP-mCPP mixed solution (from “4.4.2 Sample pretreatment”); the various concentrations of TFMPP and mCPP were as follows: 1
Table 4
Standard Curve Equations and LOQs-LODs of TFMPP and mCPP in urine matrix derived by GC/MS analysis
|
|
|
|
|
|
| |||||||||
|---|---|---|---|---|---|---|---|---|---|---|---|---|---|---|
| TFMPP | 1–20 | y | 0.9984 | 1 | 0.3 | |||||||||
| mCPP | 1–20 | y | 0.9978 | 1 | 0.3 |
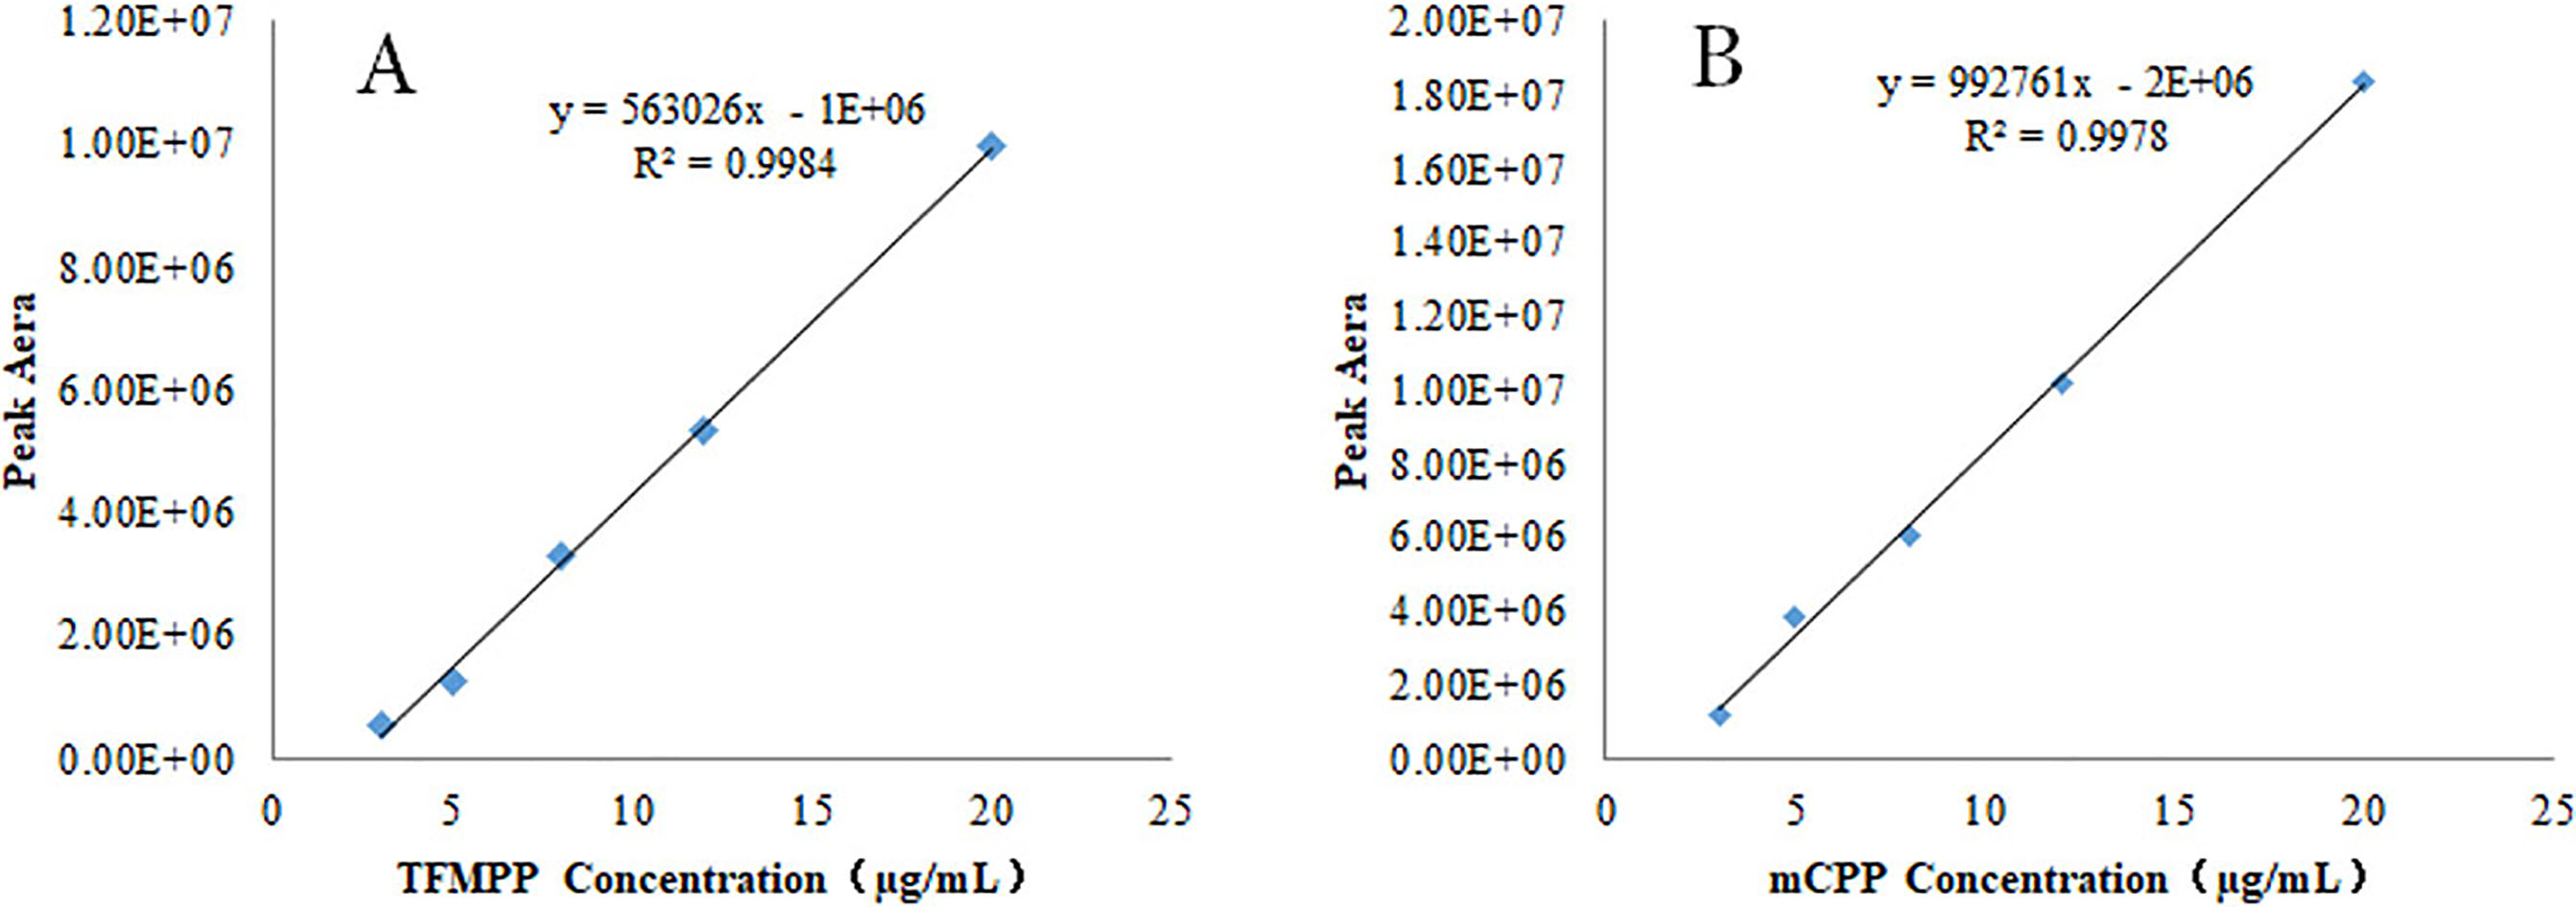
The results indicate that TFMPP and mCPP have good linearity in the concentration range considered for analysis. Table 4 presents the linear equation, LOQ, and LOD. The calibration curves are shown in Fig. 3, respectively.
Figure 3.
Calibration curve for TFMPP (A) and mCPP (B) in urine matrix.
2.2.2Recovery and precision studies
Two samples of urine containing 1
Table 5
The recovery and precision of TFMPP and mCPP by GC/MS analysis
| Compound | Concentration | Recovery | Mean value | |
|---|---|---|---|---|
| ( | (%) | Intra-day precision (%) | Inter-day precision (%) | |
| TFMPP | 1 | 99.7 | 5.9 | 4.4 |
| 10 | 100.5 | 3.6 | 3.7 | |
| mCPP | 1 | 99.7 | 5.3 | 6.4 |
| 10 | 98.7 | 7.0 | 6.8 | |
2.3Detection of TFMPP and mCPP in blood: Calibration and validation
2.3.1Standard curve, limits of quantification and detection
The standard curve was plotted after analyzing five blood samples in parallel; each sample contained a specific concentration of TFMPP-mCPP mixed solution (from “4.4.2 Sample pretreatment”), and the concentrations of all the samples were completely different. Three replicates of each sample were analyzed to ensure precision and accuracy of results. From each of the five samples of blank blood, 0.9 mL aliquot was collected. Then, 0.1 ml of mixed standard solution was taken to every samples respectively and different concentrations of TFMPP-mCPP mixed solution (from “4.4.2 Sample pretreatment”) were added to each of the five aliquots. Thus, the concentrations of sample solutions were as follows: 3
Table 6
Standard Curve Equations and LOQs-LODs of TFMPP and mCPP in blood matrix derived by GC/MS analysis
|
|
|
|
|
|
| |||||||||
|---|---|---|---|---|---|---|---|---|---|---|---|---|---|---|
| TFMPP | 0.1–20 | y | 0.9992 | 100 | 30 | |||||||||
| mCPP | 0.3–20 | y | 0.9998 | 300 | 100 |
2.3.2Recovery and precision studies
Two samples of blood having 1
Table 7
The recovery and precision of TFMPP and mCPP by GC/MS analysis
| Concentration | Recovery | Mean value | ||
|---|---|---|---|---|
| ( | (%) | Intra-day precision (%) | Inter-day precision (%) | |
| TFMPP | 1 | 88.3 | 4.5 | 7.7 |
| 10 | 82.8 | 4.4 | 11.6 | |
| mCPP | 1 | 91.5 | 5.3 | 5.8 |
| 10 | 89.9 | 7.1 | 5.9 | |
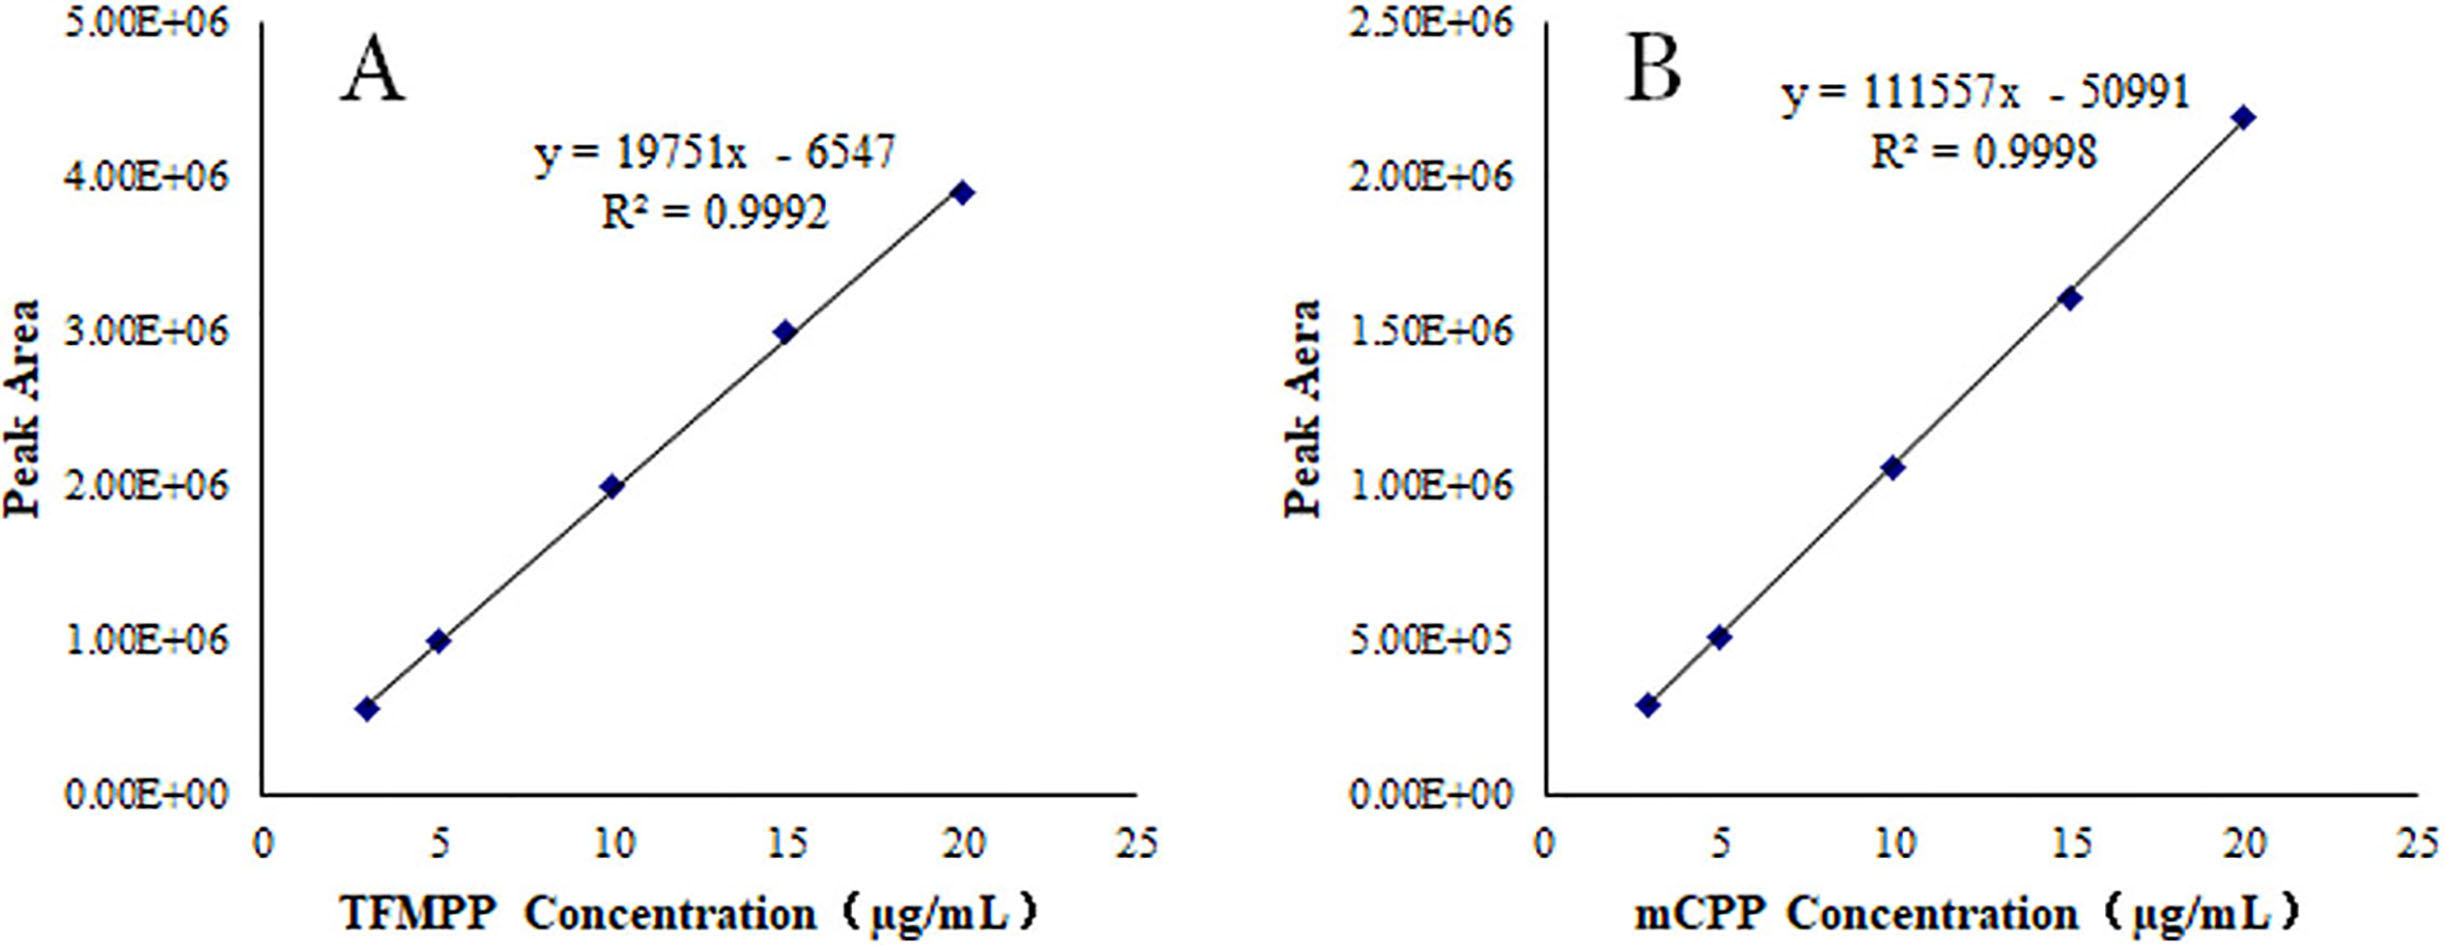
Figure 4.
Calibration curve of TFMPP (A) and mCPP (B) in blood matrix.
2.4Summary
From the result, this novel method shown good linearity, low LOQ and LOD, high recovery rate and good data reproducibility for detection TFMPP and mCPP. Tested actual (urine, blood) simple also shown same result, we thank this novel method has high application value in practice.
3.Discussion
3.1Selection of gas chromatographic columns
The first step is to select the stationary phase of chromatographic columns. Depending on the polarity of the sample, a chromatographic column is carefully selected such that the polarity of the stationary phase in the column is similar to that of the sample. With this approach, we make sure that the component to be tested (the analyte) attains its characteristic peak at the appropriate retention time, and its elution from the column is not hindered by other impurities that may otherwise act as interfering species during the elution. For example, during the analysis of non-polar samples, it is always advisable to choose only a non-polar stationary phase. Greater the similarity in the polarity of the stationary phase and the sample, greater would be the force of attraction from the fixed phase and slower would be the flow of the sample in the column. With this approach, the retention time of the sample would be surely longer. Secondly, the column length of the column must be chosen carefully: longer the chromatographic column, longer would be the sample flow time and retention time. However, an excessively long column will lead to lower column efficiency, and sample detection would be a time-consuming procedure. In addition, the column diameter and the thickness of liquid film would also affect the column efficiency.
The Agilent DB-5MS is a non-polar column; its stationary phase consists of 5% phenyl-arylene and 95% dimethylpolysiloxane. The aforementioned materials exhibit a very wide range of selectivity with a minimum number of columns. In addition, the stationary phase of this column is very efficient in the retention and separation of alkaloids, anesthetics, and halogenated hydrocarbons.
In this experimental study, TFMPP and mCPP were very weak polar compounds because they had only phenyl and halogen groups in their organic structure (The polarity of a compound is determined by the nature of the functional groups present in its organic structure.). Therefore, DB-5MS column was considered to be suitable for gas chromatography. The results were as follows: column length was 30 m; inner diameter was 0.25 mm; and film thickness was 0.25
3.2Extraction and detection of TFMPP and mCPP in urine samples
3.2.1Optimization of liquid-liquid extraction
3.2.1.1 Effect of different solvents on the extraction rate
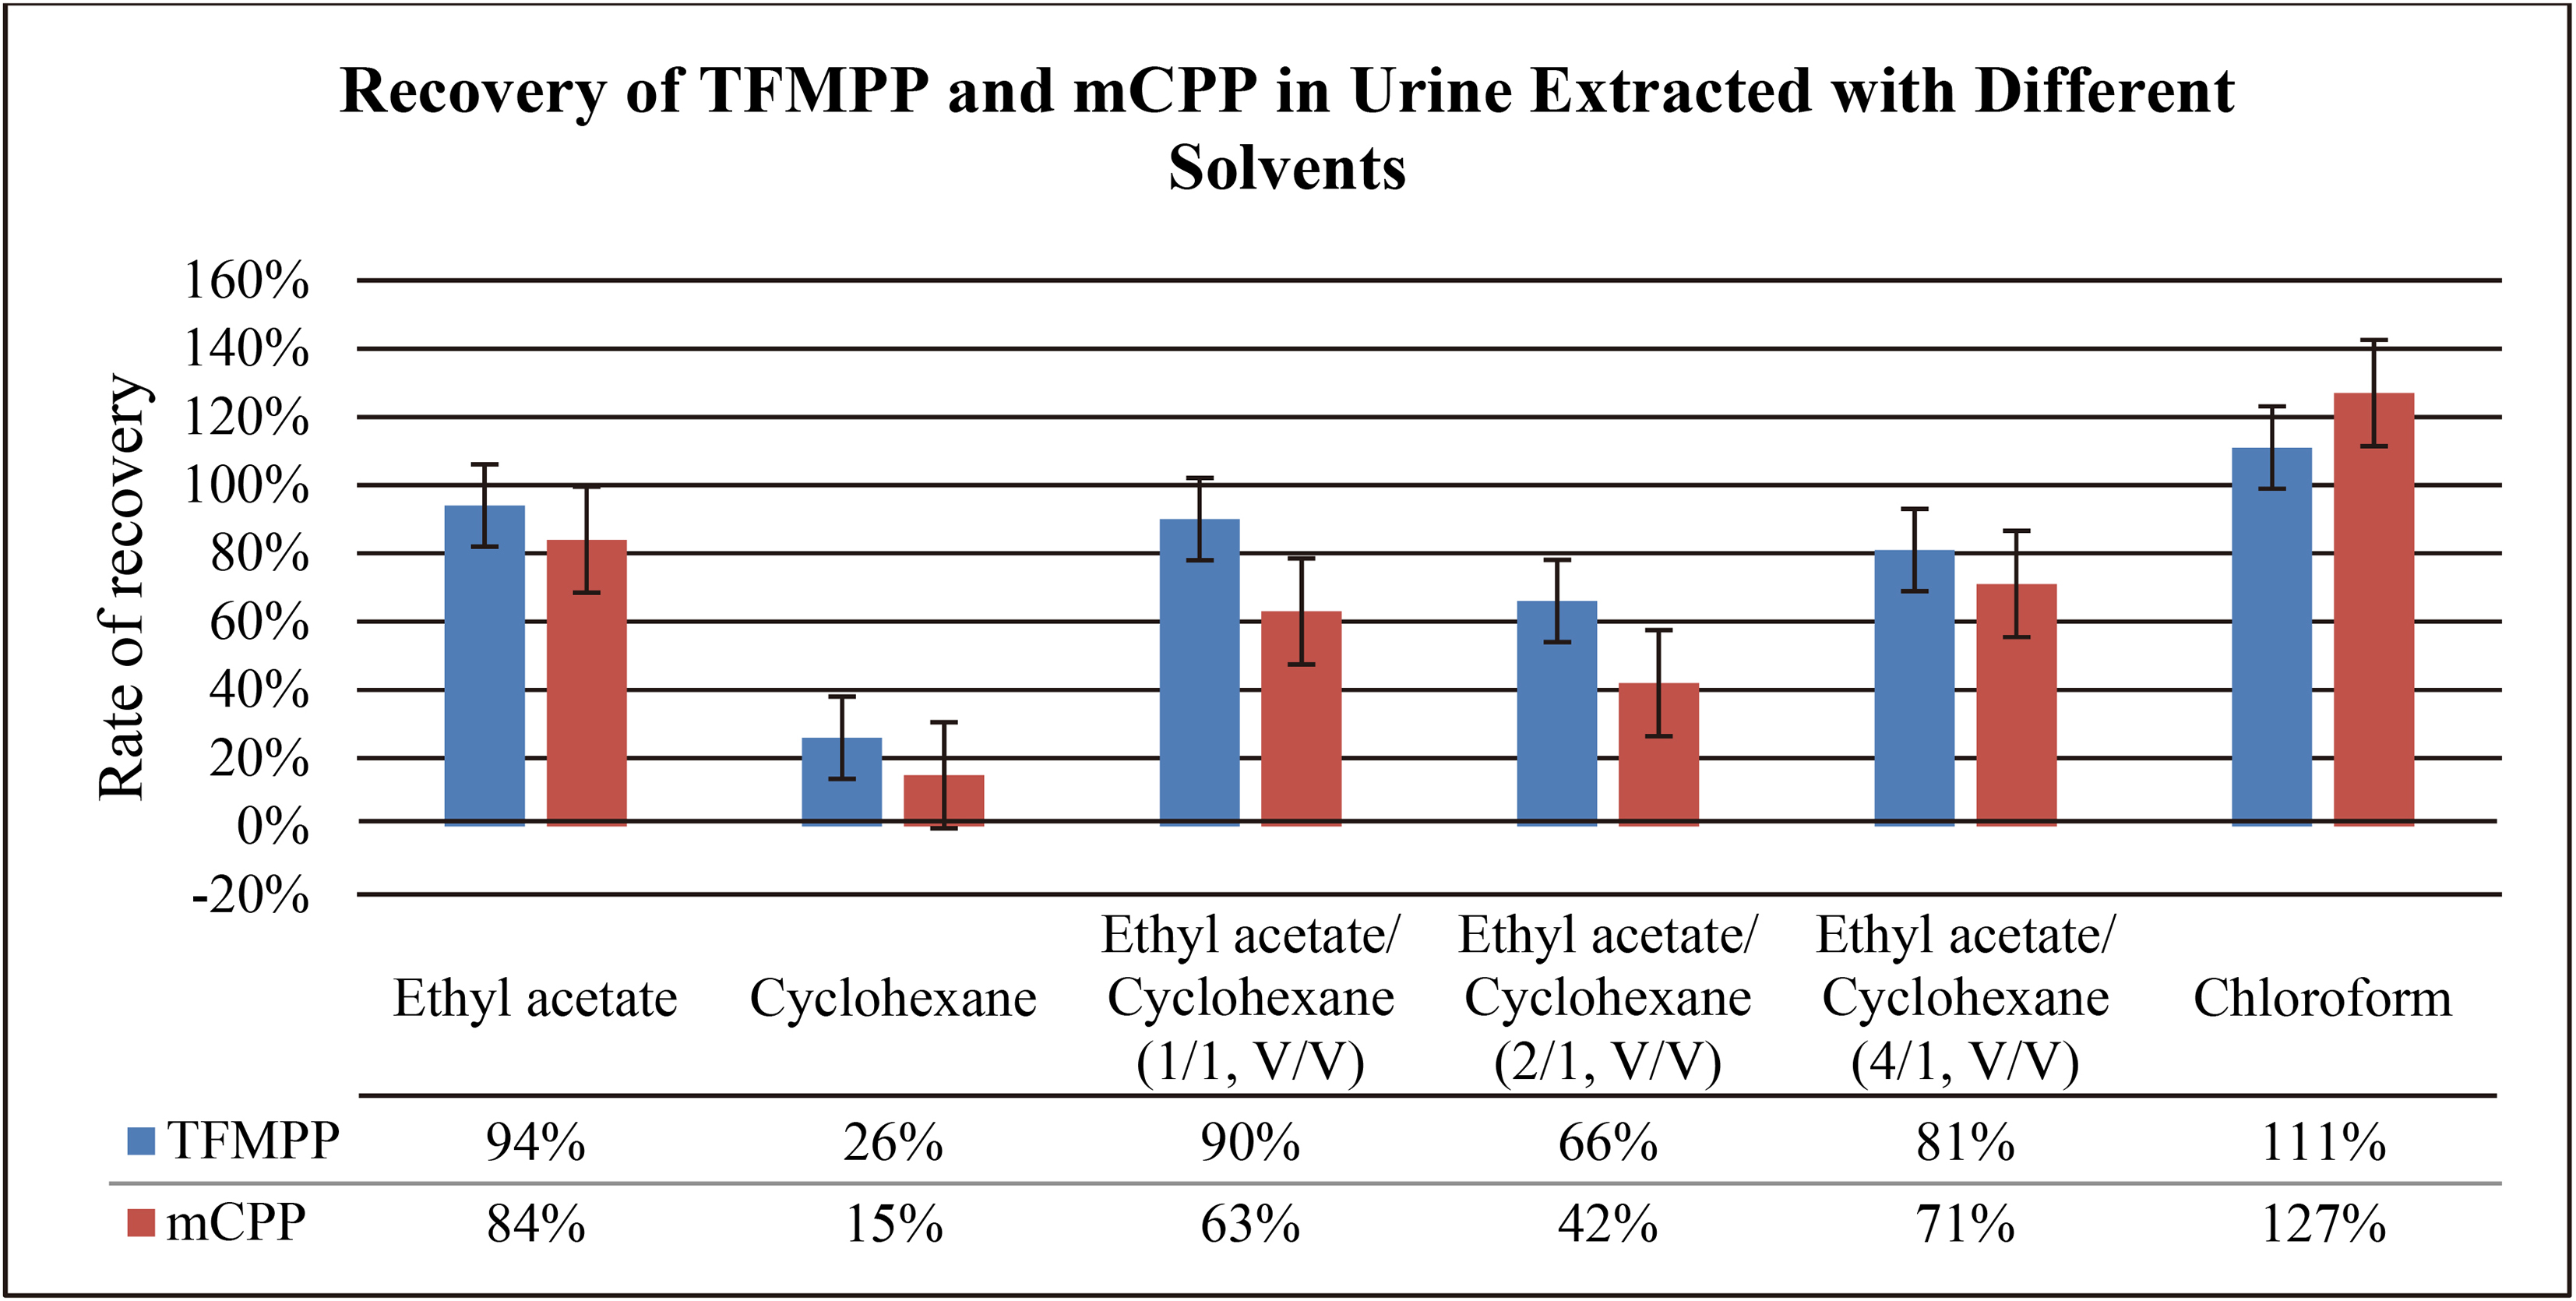
Both TFMPP and mCPP are soluble in many organic solvents, including acetone, ethanol, ether, benzene, cyclohexane, and chloroform. In this experiment, our aim was to investigate the effects of the following organic solvents: ethyl acetate, cyclohexane, ethyl acetate/cyclohexane (1/1, V/V), ethyl acetate/cyclohexane (2/1, V/V), ethyl acetate/cyclohexane (4/1, V/V), and chloroform. The experiment was carried out in accordance with the method “4.7 liquid-liquid extraction experiment”, and the results were presented in Table 8. Based on the results, it can be concluded that the extraction rate of cyclohexane is low, so its recovery from the solvent medium is low. In contrast, the extraction recovery rate of chloroform is high; however, its main drawback is the significant interference caused by impurities. The extraction recovery rate of ethyl acetate is high and the resolution of its peaks is clearly observed in the chromatogram; the characteristic peaks of ethyl acetate are also having a well-defined shape.
Table 8
Comparison of recovery rates of TFMPP and mCPP in urine by different extractants
|
In the blank urine chromatogram obtained with ethyl acetate, the impurities are very few in number. Therefore, ethyl acetate was selected as the extraction agent instead of other agents; the remaining agents, such as benzene and ether solvent, had more toxicity and poor parallelism.
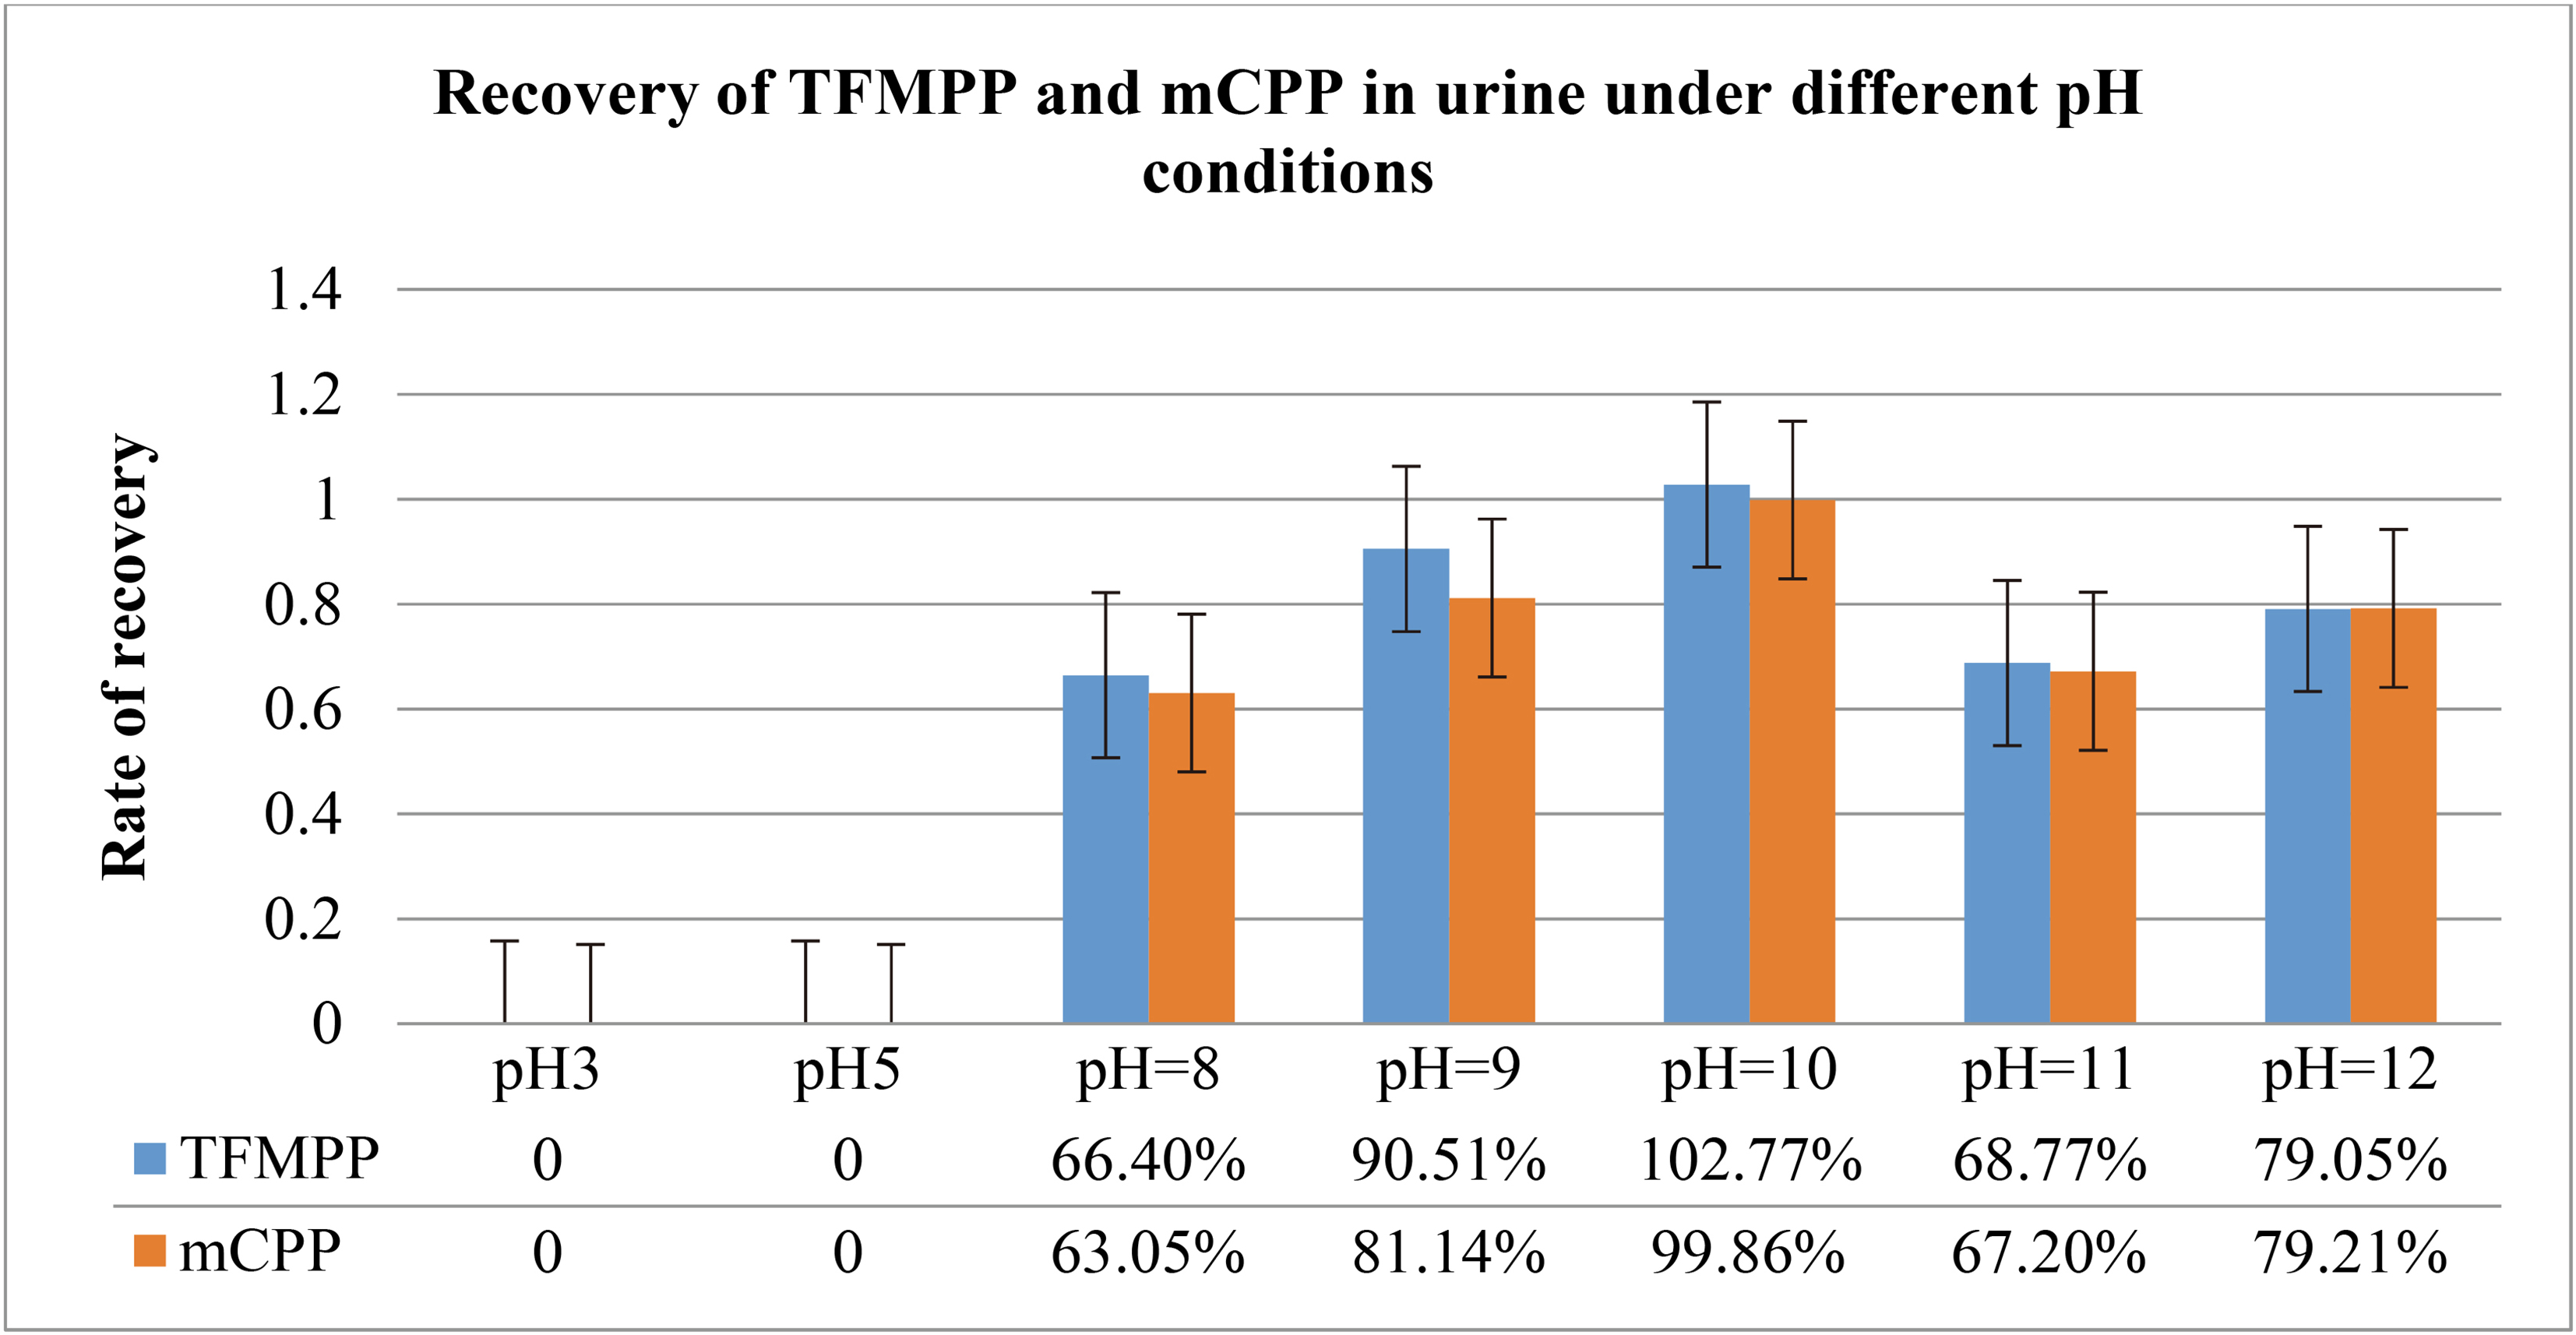
3.2.1.2 Effect of solution pH on the extraction rates
TFMPP and mCPP are both weakly basic in nature, property pH is very important for extraction efficiencies, so the extraction efficiencies were investigated at different pH values in this experiment, the experiment procedure was carried out in accordance with the method “4.7 liquid-liquid extraction experiment”. As shown in Table 9, TFMPP and mCPP at acid condition (pH
Table 9
A comparison of the recovery rates of TFMPP and mCPP in urine under different pH conditions
|
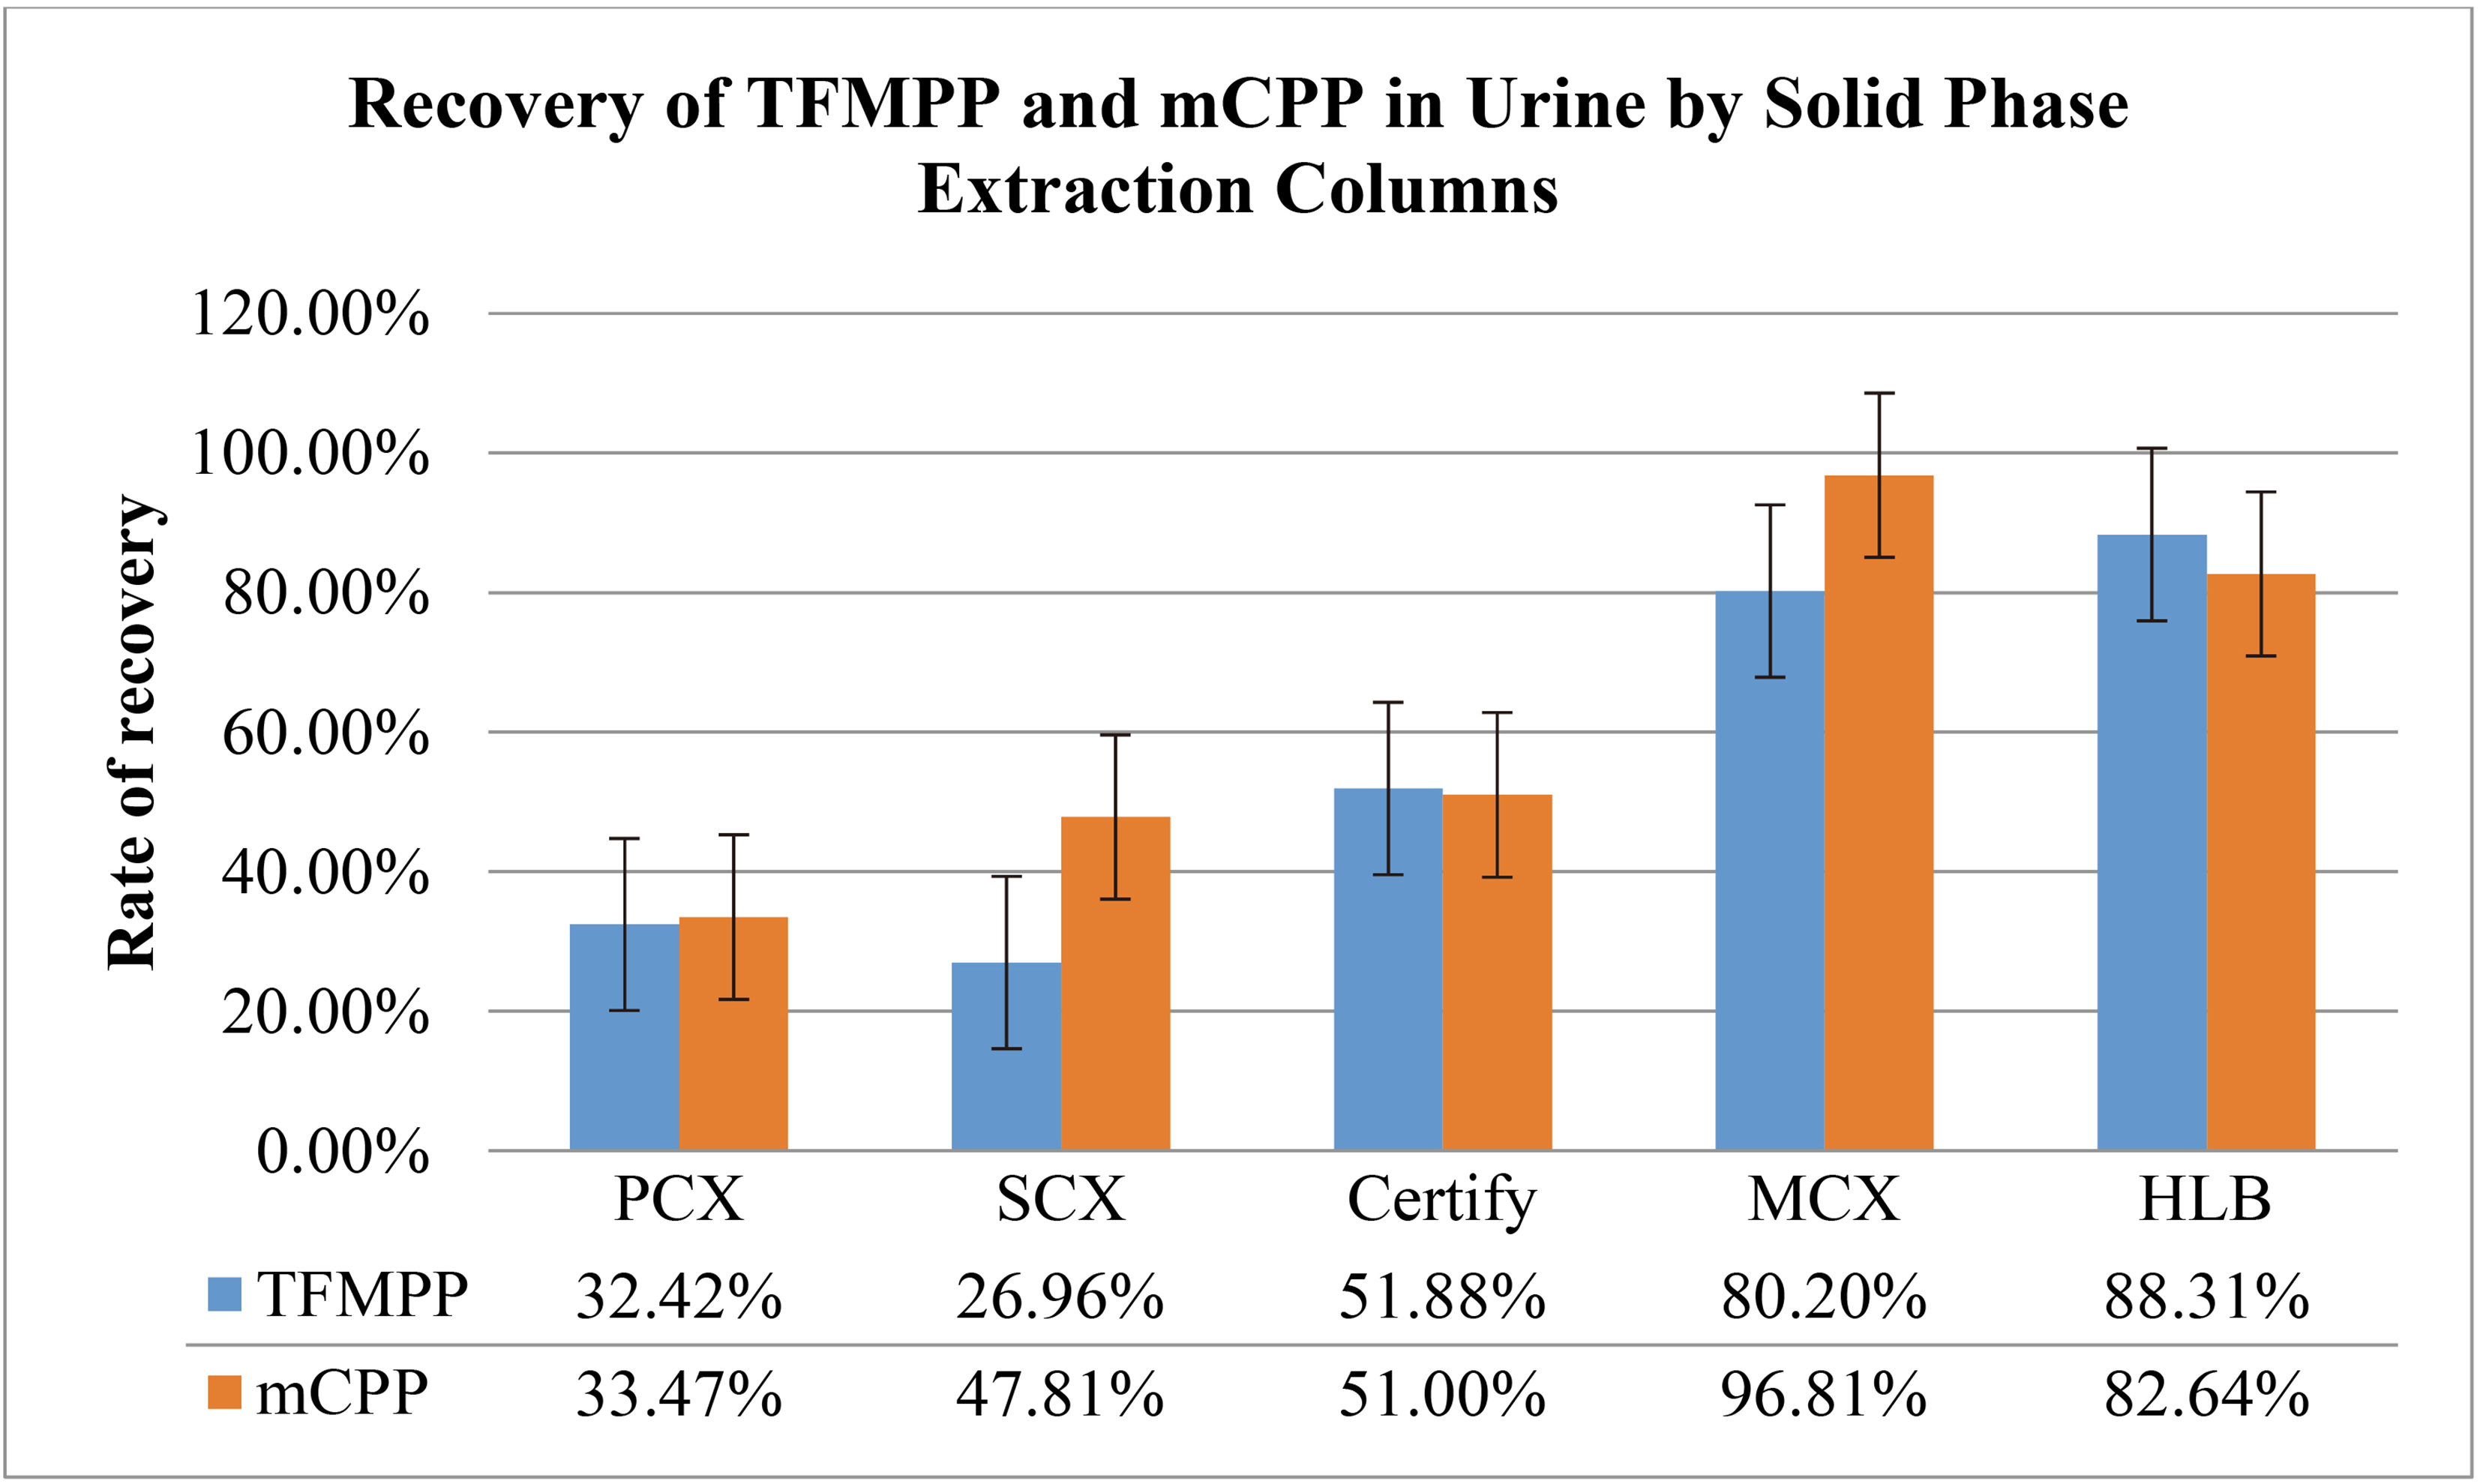
3.2.2Effects of solid phase extraction columns on the purification of TFMPP and mCPP
In this experiment, solid phase extraction columns, such as Oasis
In the aforementioned solid phase extraction columns, the extraction process was carried out according to the method “4.8 Solid Phase Extraction”. The procedure performed while testing samples in Oasis
Table 10
A comparison of recovery rates of TFMPP and mCPP in purified urine by different solid phase extraction columns
|
The results are presented in Table 10. The results indicate that in each solid phase extraction column, the eluent is always colorless and transparent. The extraction of TFMPP and mCPP in urine can be performed with maximum efficiency in Oasis
3.3Extraction and detection of TFMPP and mCPP in blood
3.3.1Optimization of liquid-liquid extraction
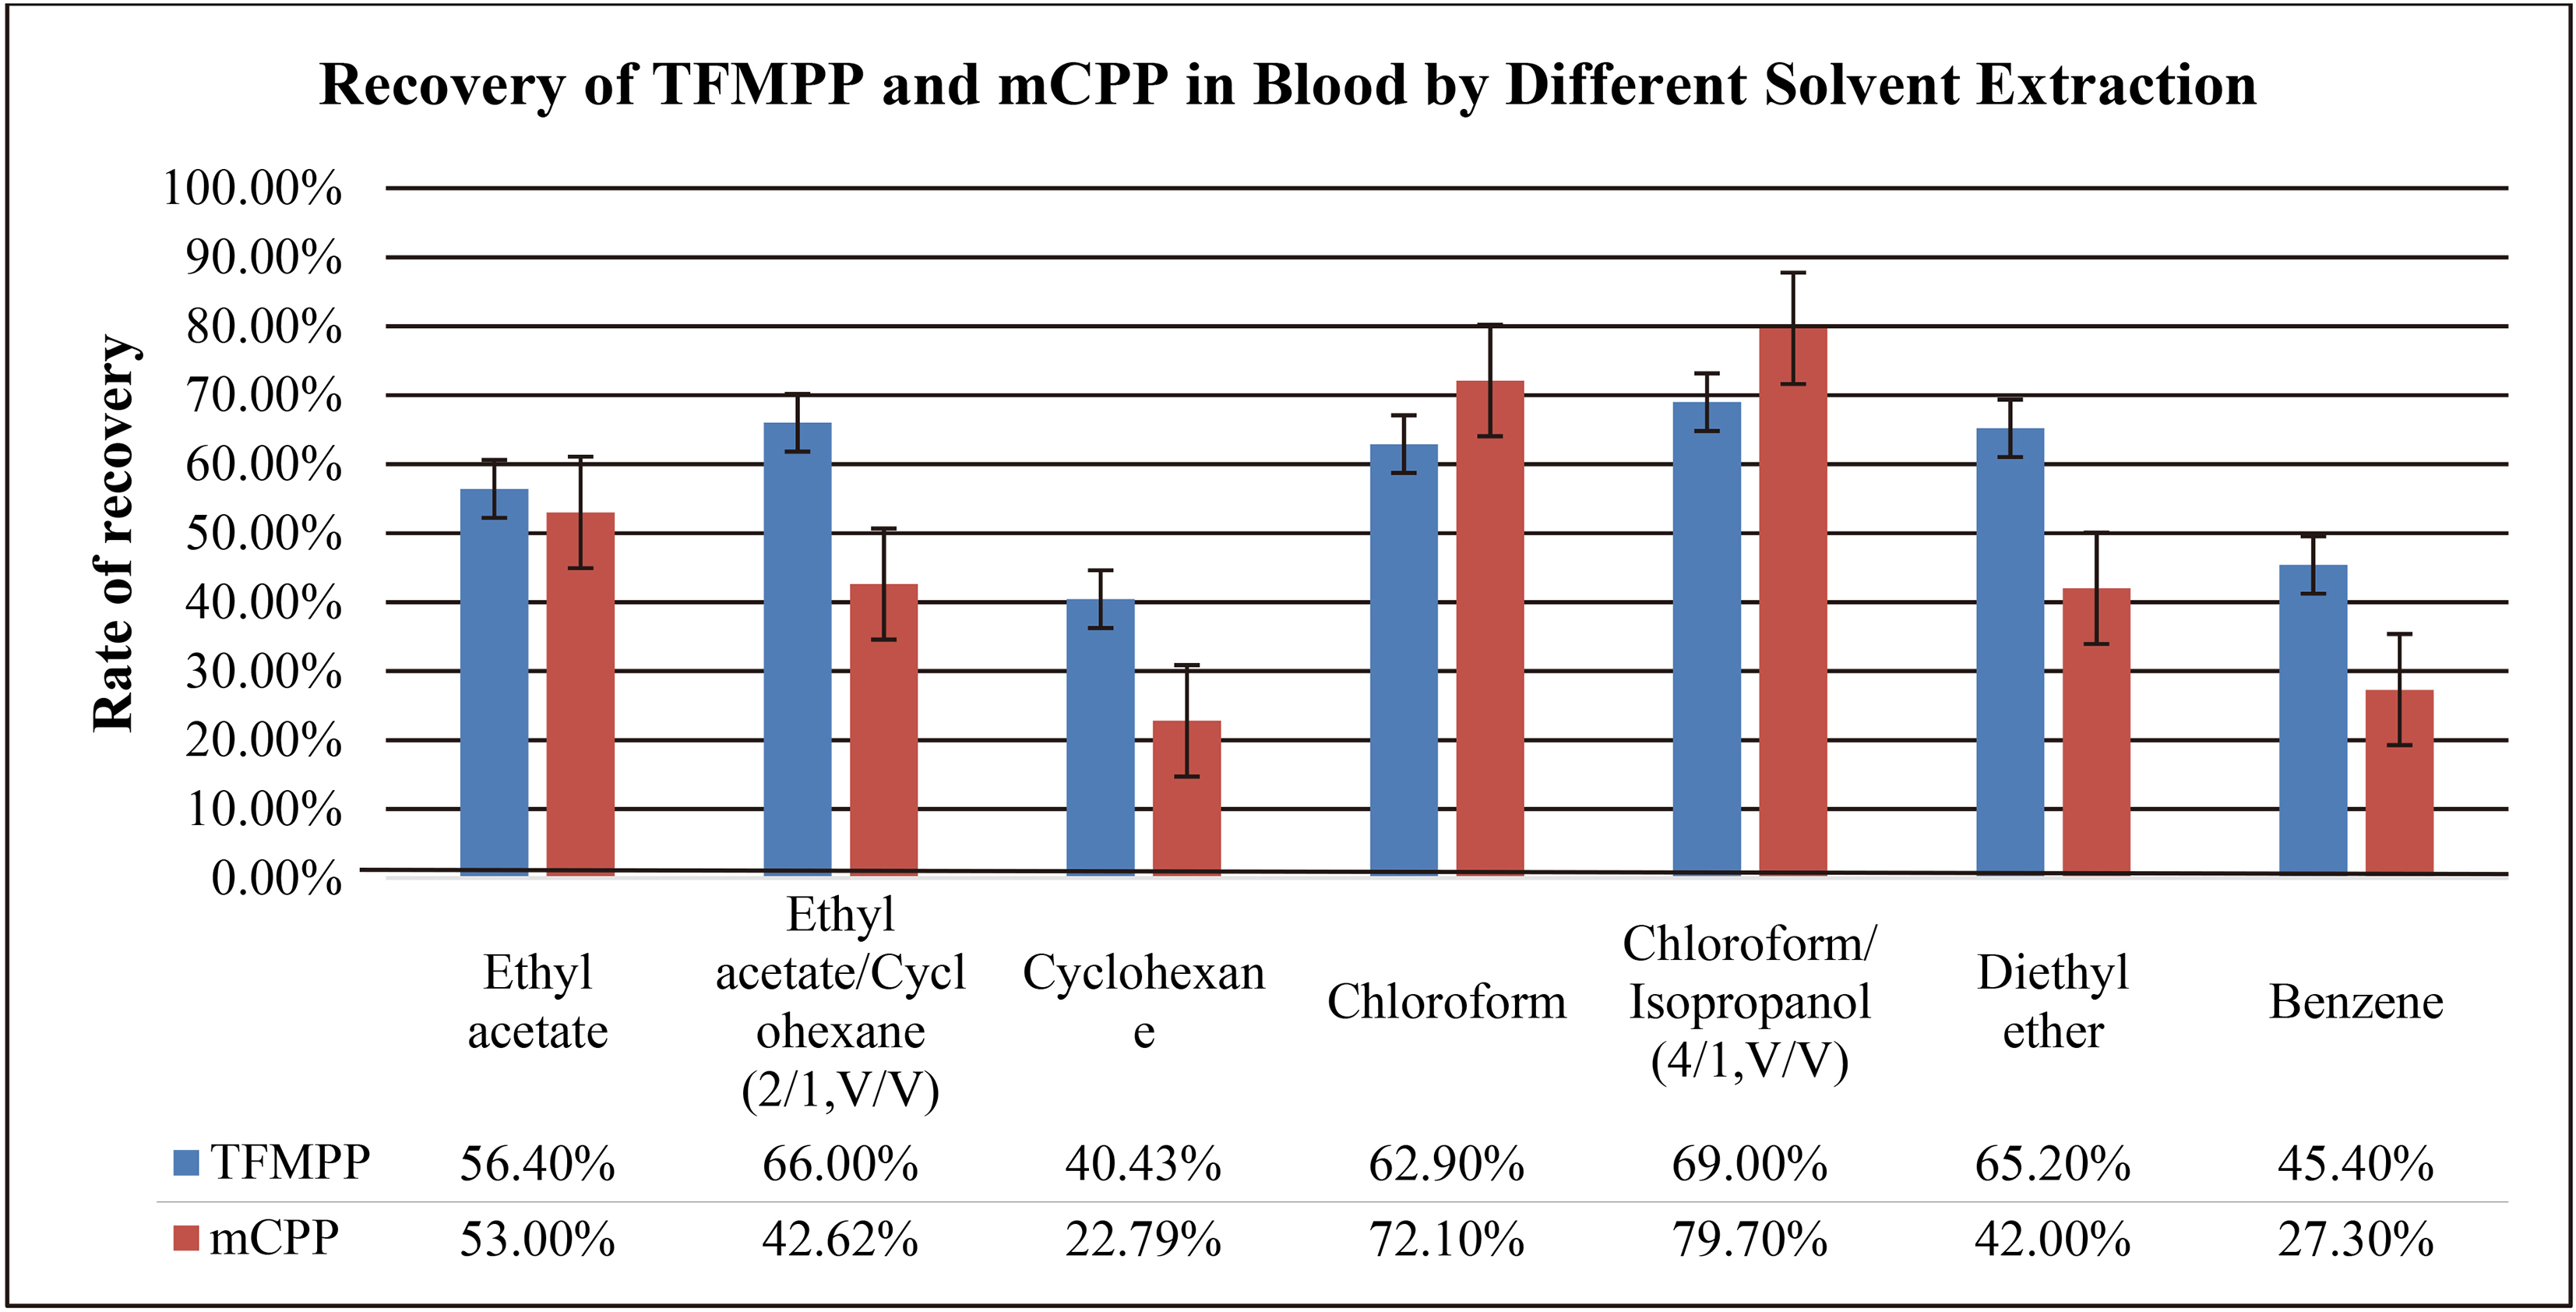
3.3.1.1 Effect of different solvents on the extraction rate
Both TFMPP and mCPP are soluble in acetone, ethanol, ether, benzene, cyclohexane, chloroform, and other organic solvents. To obtain better extraction results, we determined the effects of extraction with different solvents, such as the ethyl acetate, cyclohexane, ethyl acetate/cyclohexane (2/1, V/V), ethyl ether, benzene, chloroform and chloroform/isopropanol (4/1, V/V). This is because proteins and fats existed as impurities in blood samples. The experiment was carried out according to the method “4.7 Liquid-Liquid Extraction Experiment”. The results are presented in Table 11. It was observed that the extraction of the supernatant was yellow in color, because it contained a certain fat in significant amount. In addition, the chromatographic peaks also showed serious interference from impurities. The mixed solvent of chloroform/isopropanol (4/1, V/V) exhibits both the advantages of chloroform, that is, r alkaloids and isobutanol show high solubility in this solvent when it is used for protein precipitation. The recovery rate is the highest and the shape of the peak is also good. Therefore, the mixed solvent chloroform/Propanol (4/1, V/V) was selected as the extractant.
Table 11
Comparison of recovery rates of TFMPP and mCPP in blood by different solvent extraction
|
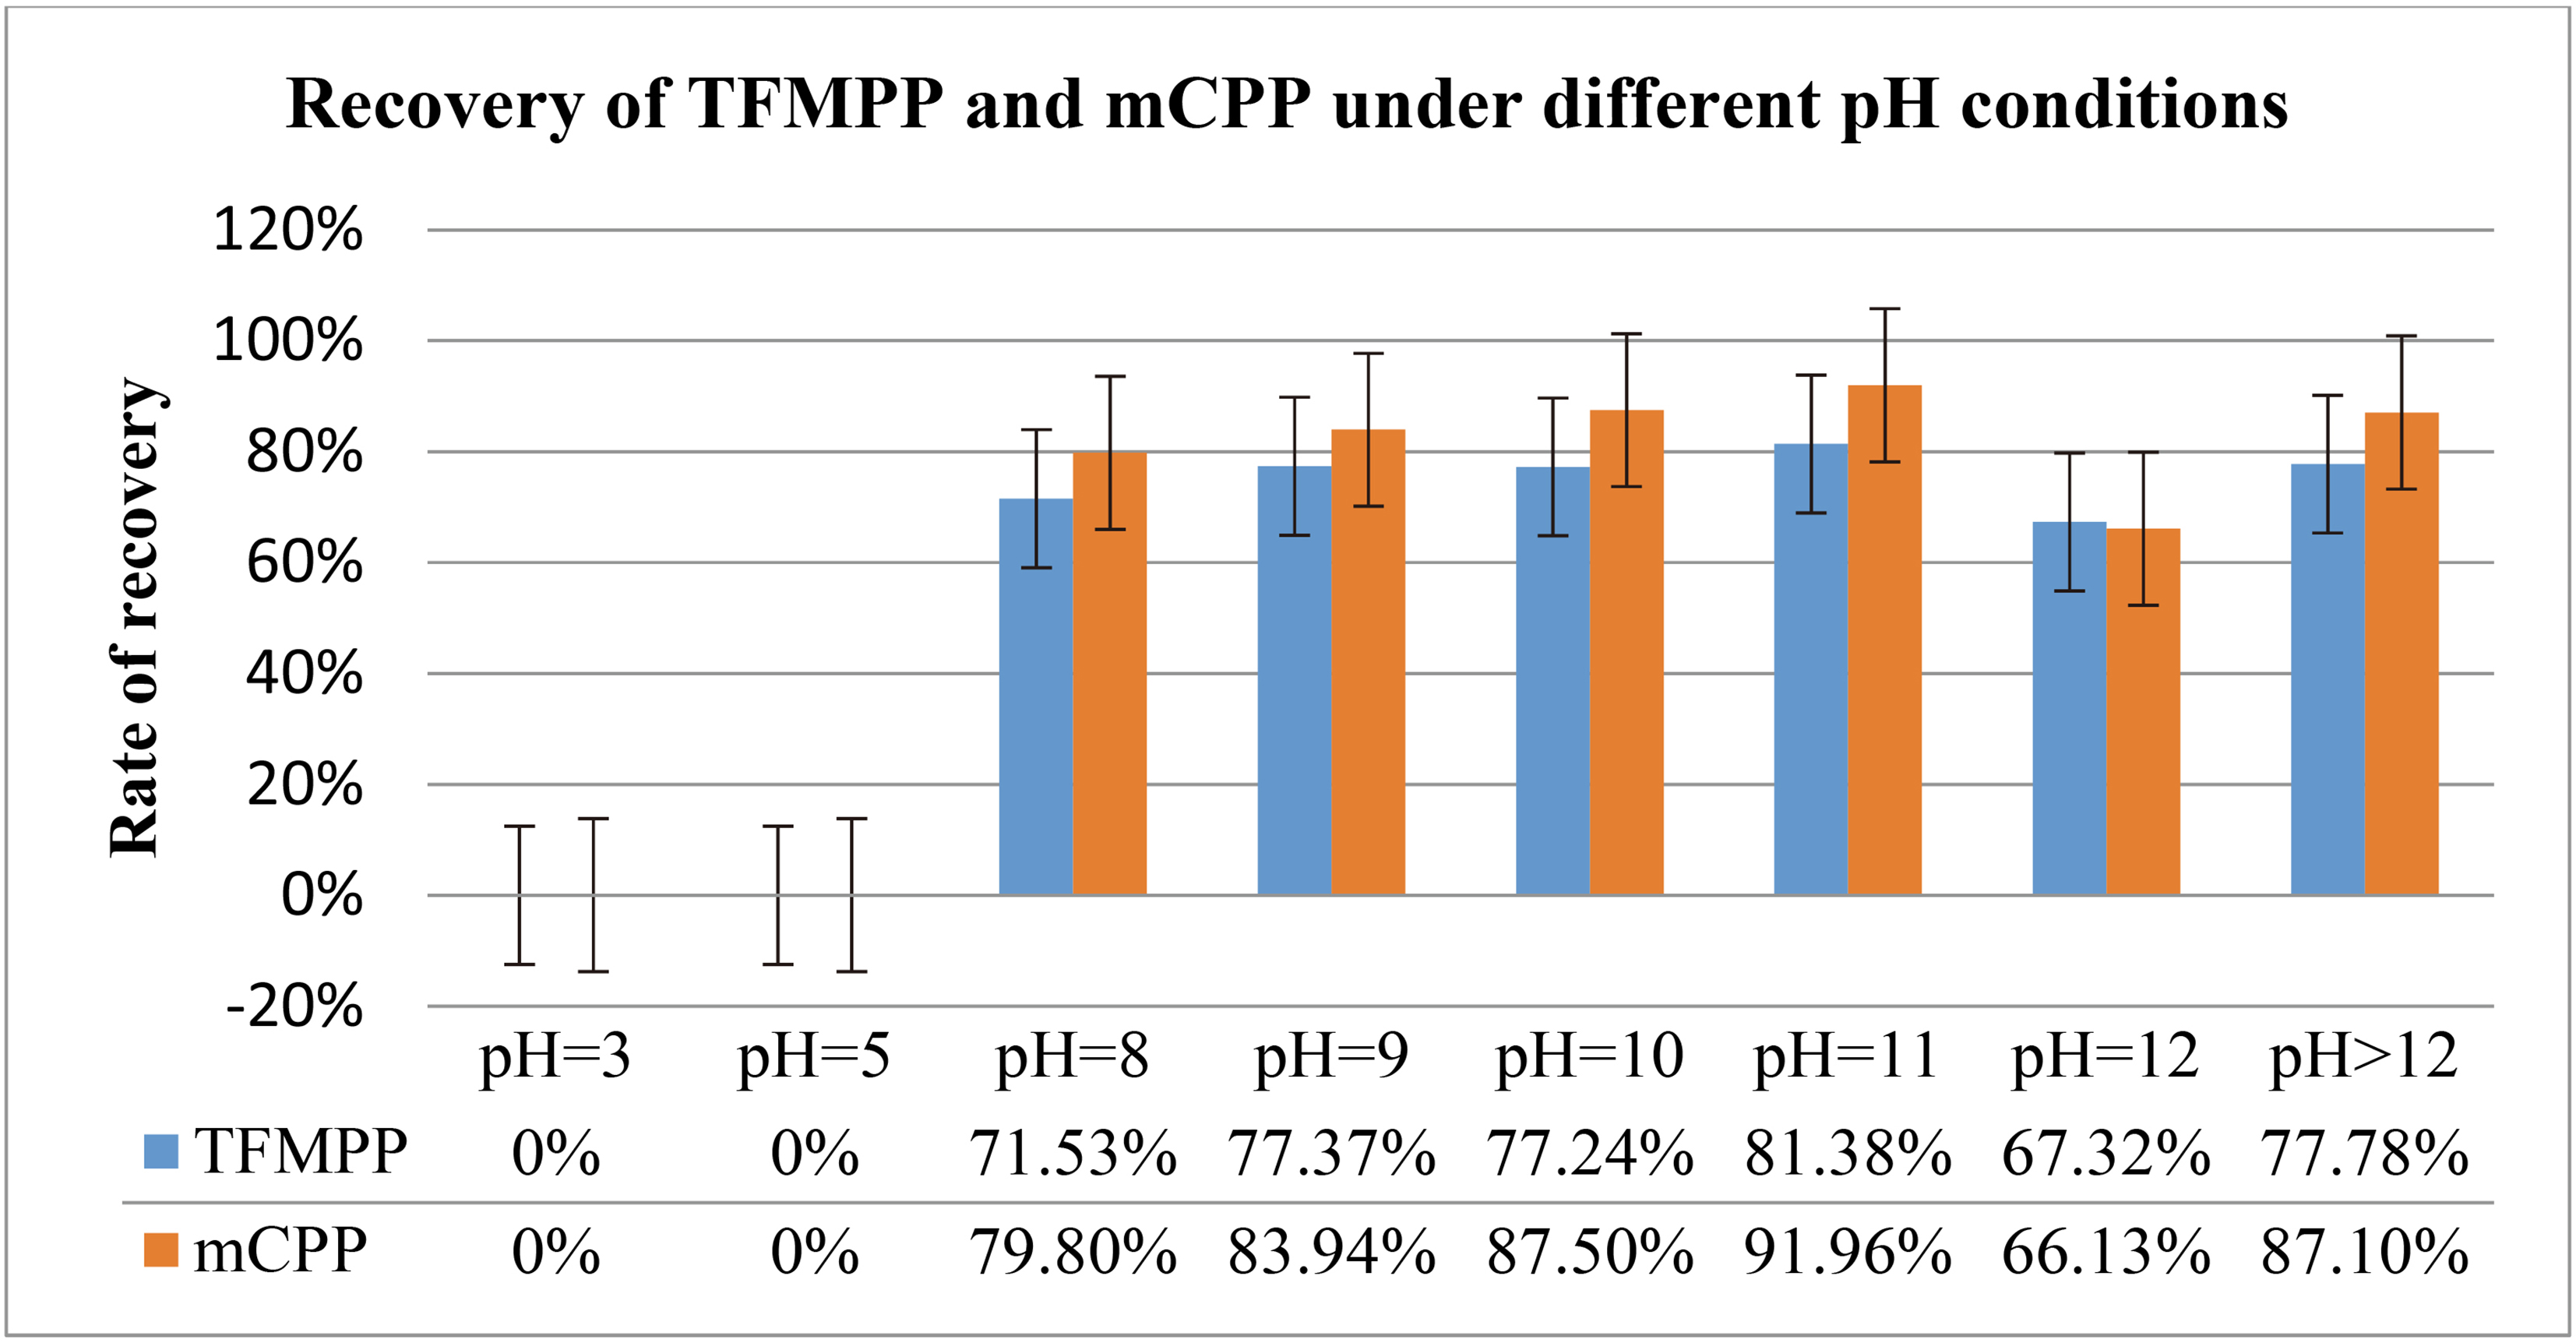
3.3.1.2 Effect of solution pH on the extraction rates
Both TFMPP and mCPP are weakly alkaline in nature. The extraction efficiencies were investigated at different pH in this work. The experiment was carried out in accordance with the method “4.7 liquid- liquid extraction experiment”, and the results are presented in Table 12. The results indicate that the two substances cannot be detected at pH 3.0 and 5.0. The best recovery rate was achieved at pH 11.0, so pH 11.0 was selected as the pH for the extraction process.
Table 12
Comparison of recovery rates of TFMPP and mCPP under different pH conditions
|
3.3.2Effects of solid phase extraction columns on the purification of TFMPP and mCPP
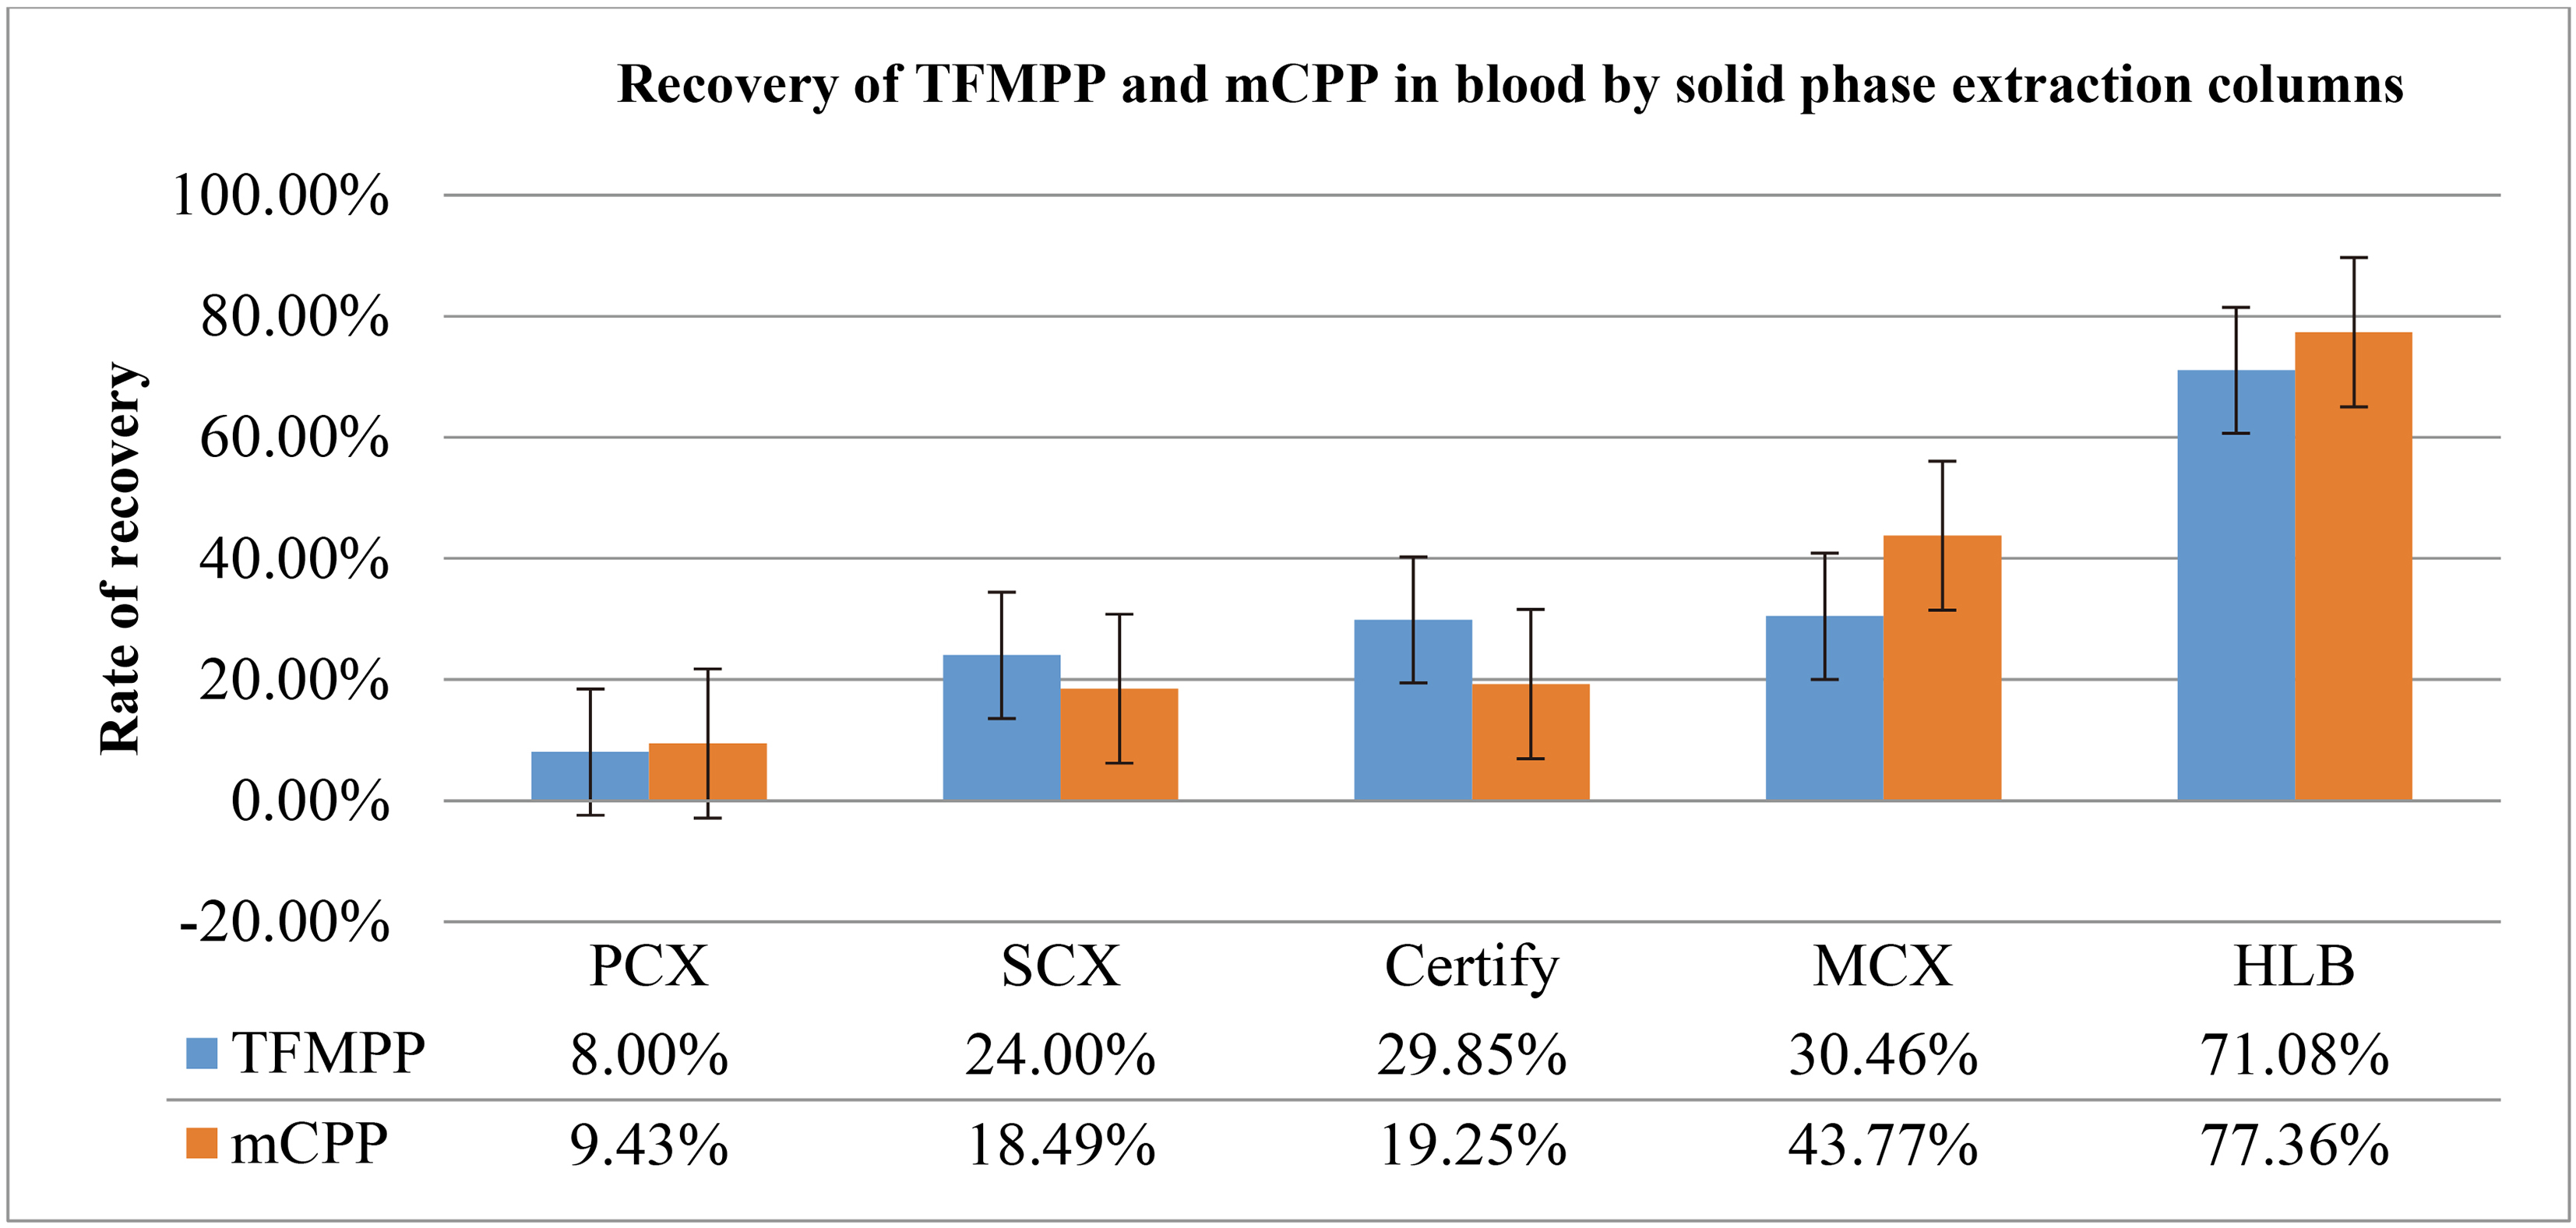
The purification effects of solid phase extraction columns, such as Oasis
Table 13
Comparison of recovery rates of TFMPP and mCPP in blood by solid phase extraction columns
|
According to the results presented in Table 13, PCX eluent was brown in color and it had a low recovery rate; Bond Elute certify and SCX eluents were clean but they also had low recovery rates; MCX eluent had a yellowish color, but it also had a low recovery rate and heavy tailed peak; HLB eluent was light brown in color and had the best chromatographic characteristics: the shapes of the characteristics peaks were good, the parallel results were nice, and the recovery rate was the highest among all the separated species. The results indicate that the purification effect brought about TFMPP and mCPP on the blood samples was excellent provided Oasis
4.Instruments and methods
4.1Experimental set up
The following instruments were used in the experiment: Shimadzu GC 2010 PLUS Gas Chromatography (Shimadzu, Kyoto, Japan); Thermo Scientific Biofuge Primo R High Speed Centrifuge (SORVALL, Inc., USA); EYELA high-speed oscillator (Tokyo physical and chemical equipment Co., Ltd, Japan); Millpore Simplicity Pure Water Preparation System (MILLIPORE, Corporation, France); Cole-Parmer Ultrasonic Oscillator (Cole-Parmer Instruments, Corporation USA).
4.2Materials
The following reagents were used in the experiment:1-(3-trifluoromethylphenyl) piperazine (TFMPP) (purity 99.0%), 1-(3-chlorobenzene) piperazine (mCPP) (purity 99.0%), highly pure water, methanol, ethyl acetate, trichloromethane (AR), acetone (AR), ether (AR), isopropyl alcohol (AR), cyclohexane (AR), and benzene (AR). Furthermore, the following solid phases were used in chromatographic process of separation: Oasis
To detect the traces of TFMPP and mCPP in biological samples, various standard stock solutions and working standards were prepared in the experiment. The following biological samples were tested in the experiment: blank urine samples (collected from healthy, non-smoking history volunteers) and blank whole blood samples (collected from Beijing Fuxing Hospital).
4.3Preparation of standard stock solution and standard working solution
In the experiment, 1.00 mg/mL TFMPP and 1.00 mg/mL mCPP stock solutions were carefully diluted with methanol to form standard working solution at following concentrations: 100
4.4Gas chromatography-mass spectrometry (GC/MS) measurements
4.4.1Calibration
The following conditions were applied while performing GC/MS measurements: GC-2010-PLUS/MS column, Solution Release 2010 workstation (Shimadzu, Kyoto, Japan) was used to analyze samples:
Chromatographic column: DB-5MS (30 m
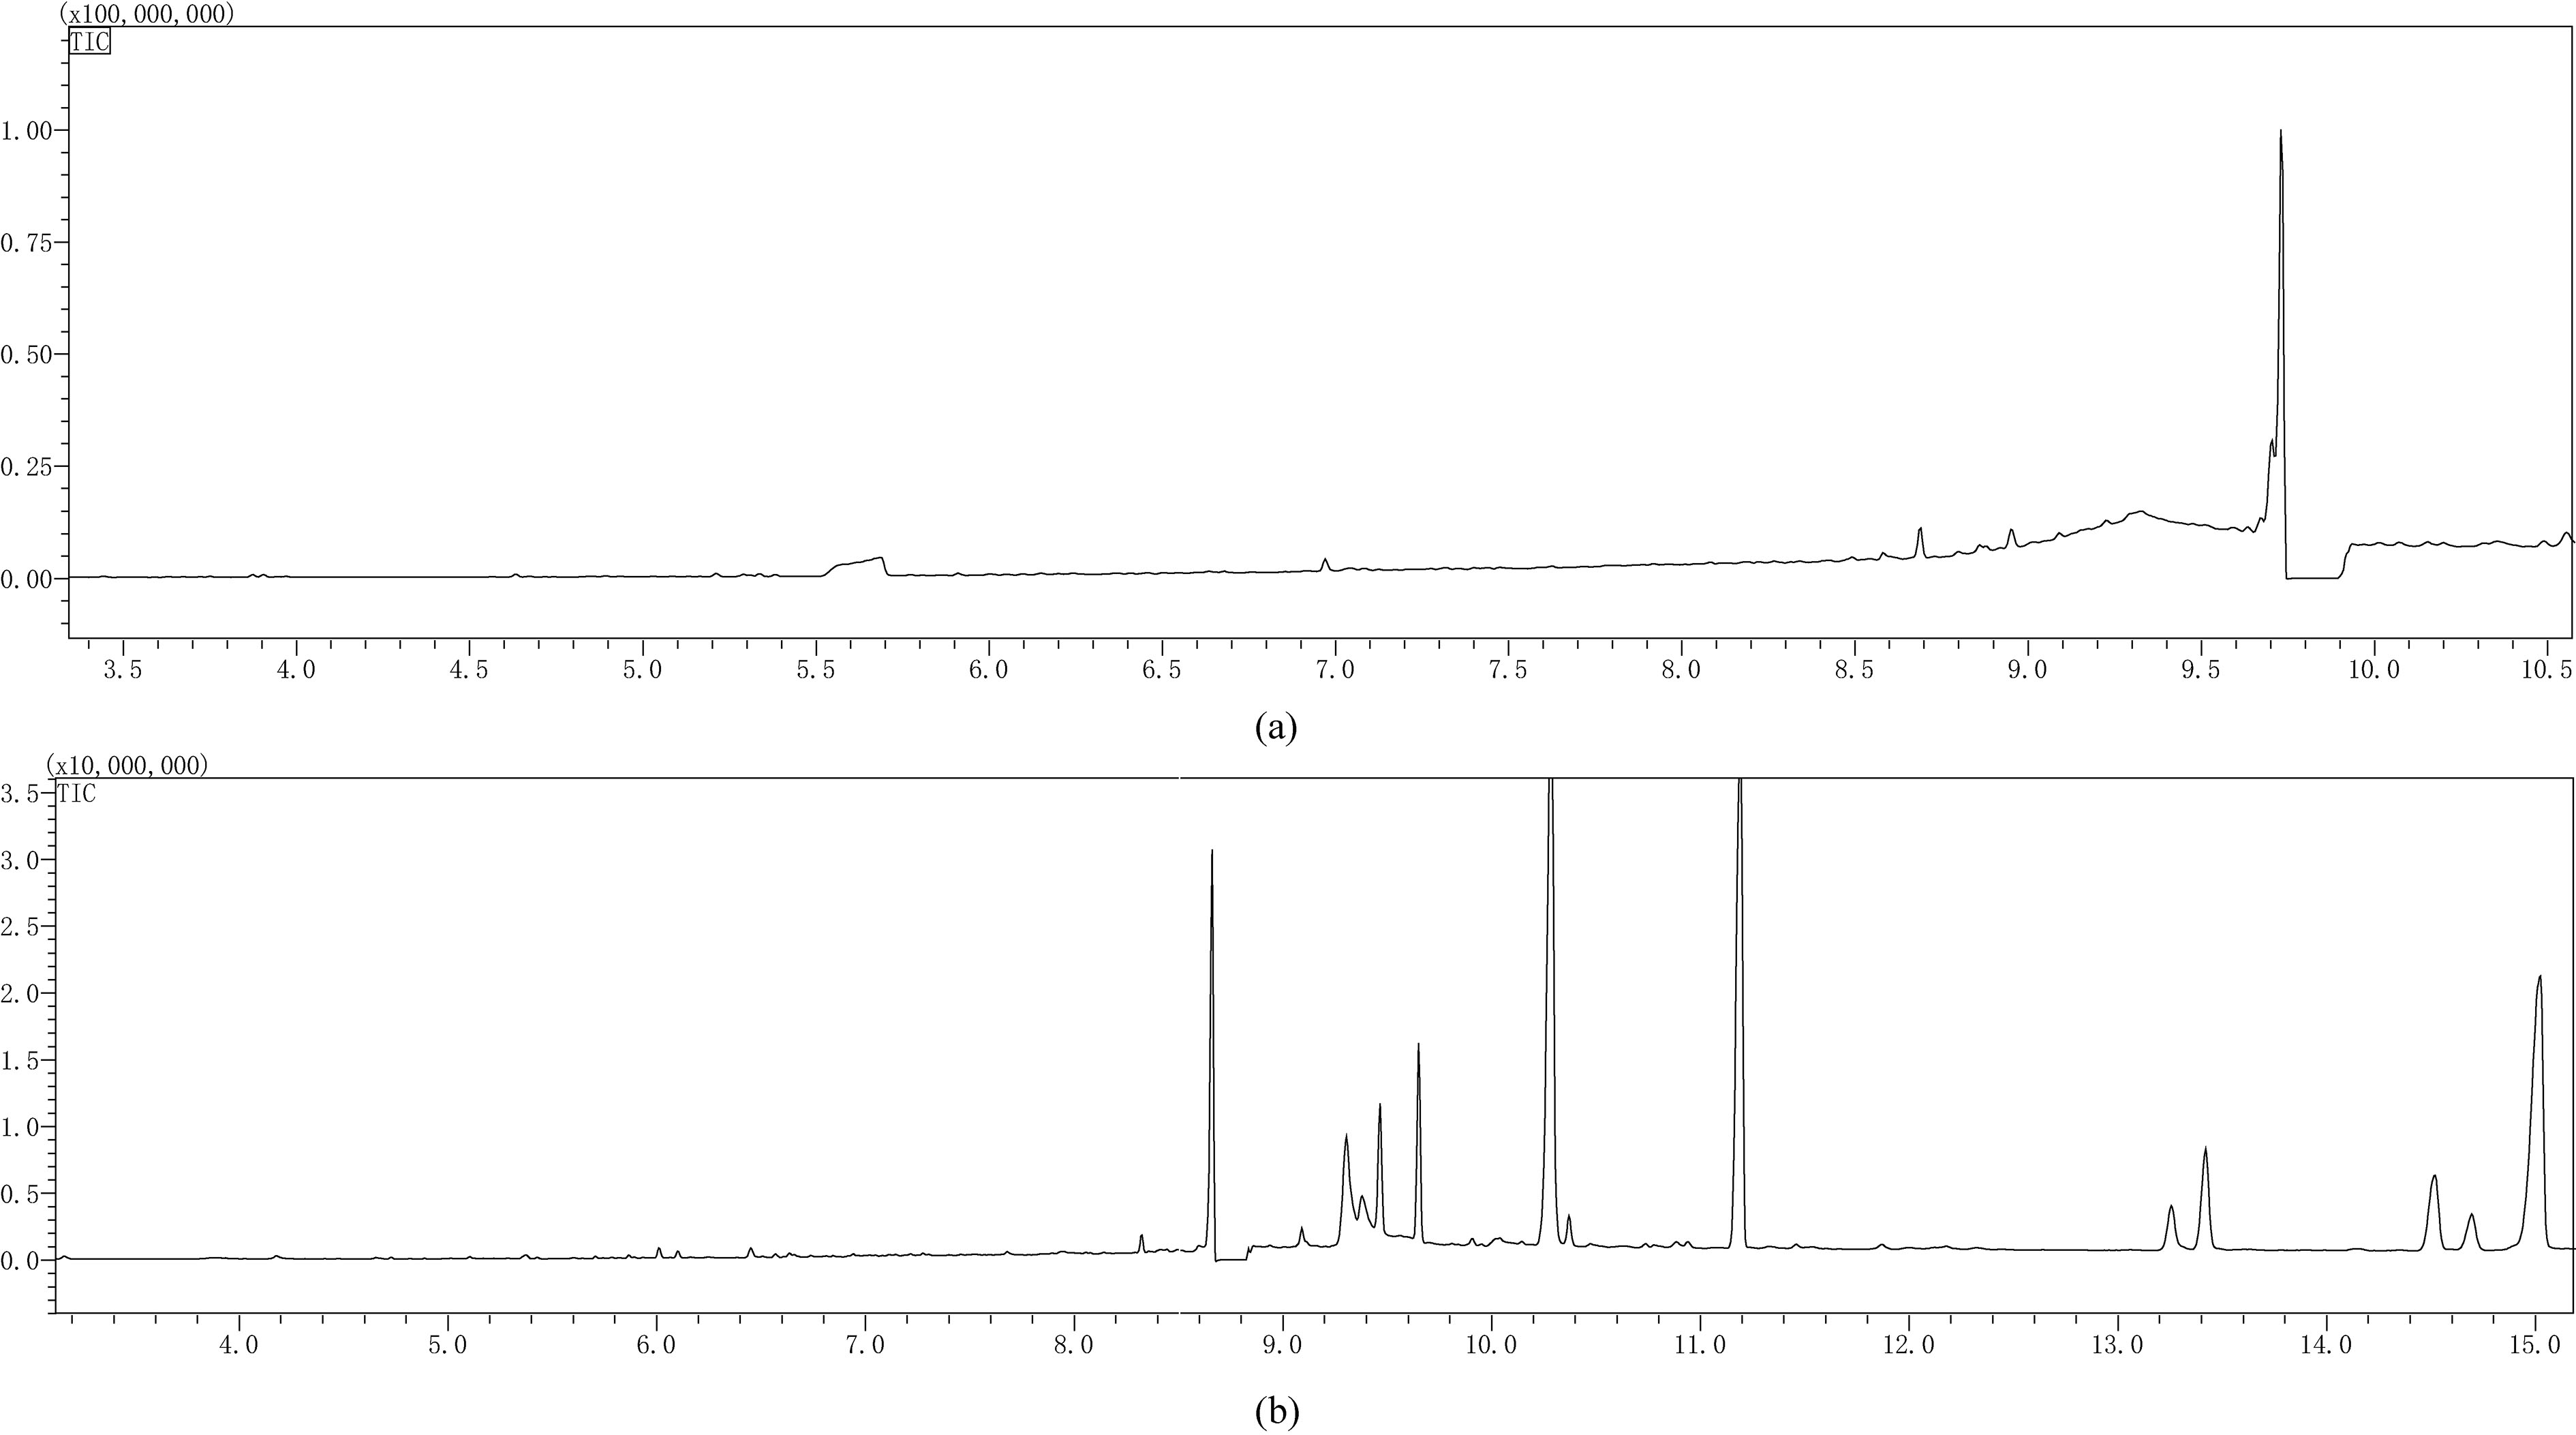
Figure 5.
Gas chromatogram of TFMPP and mCPP.
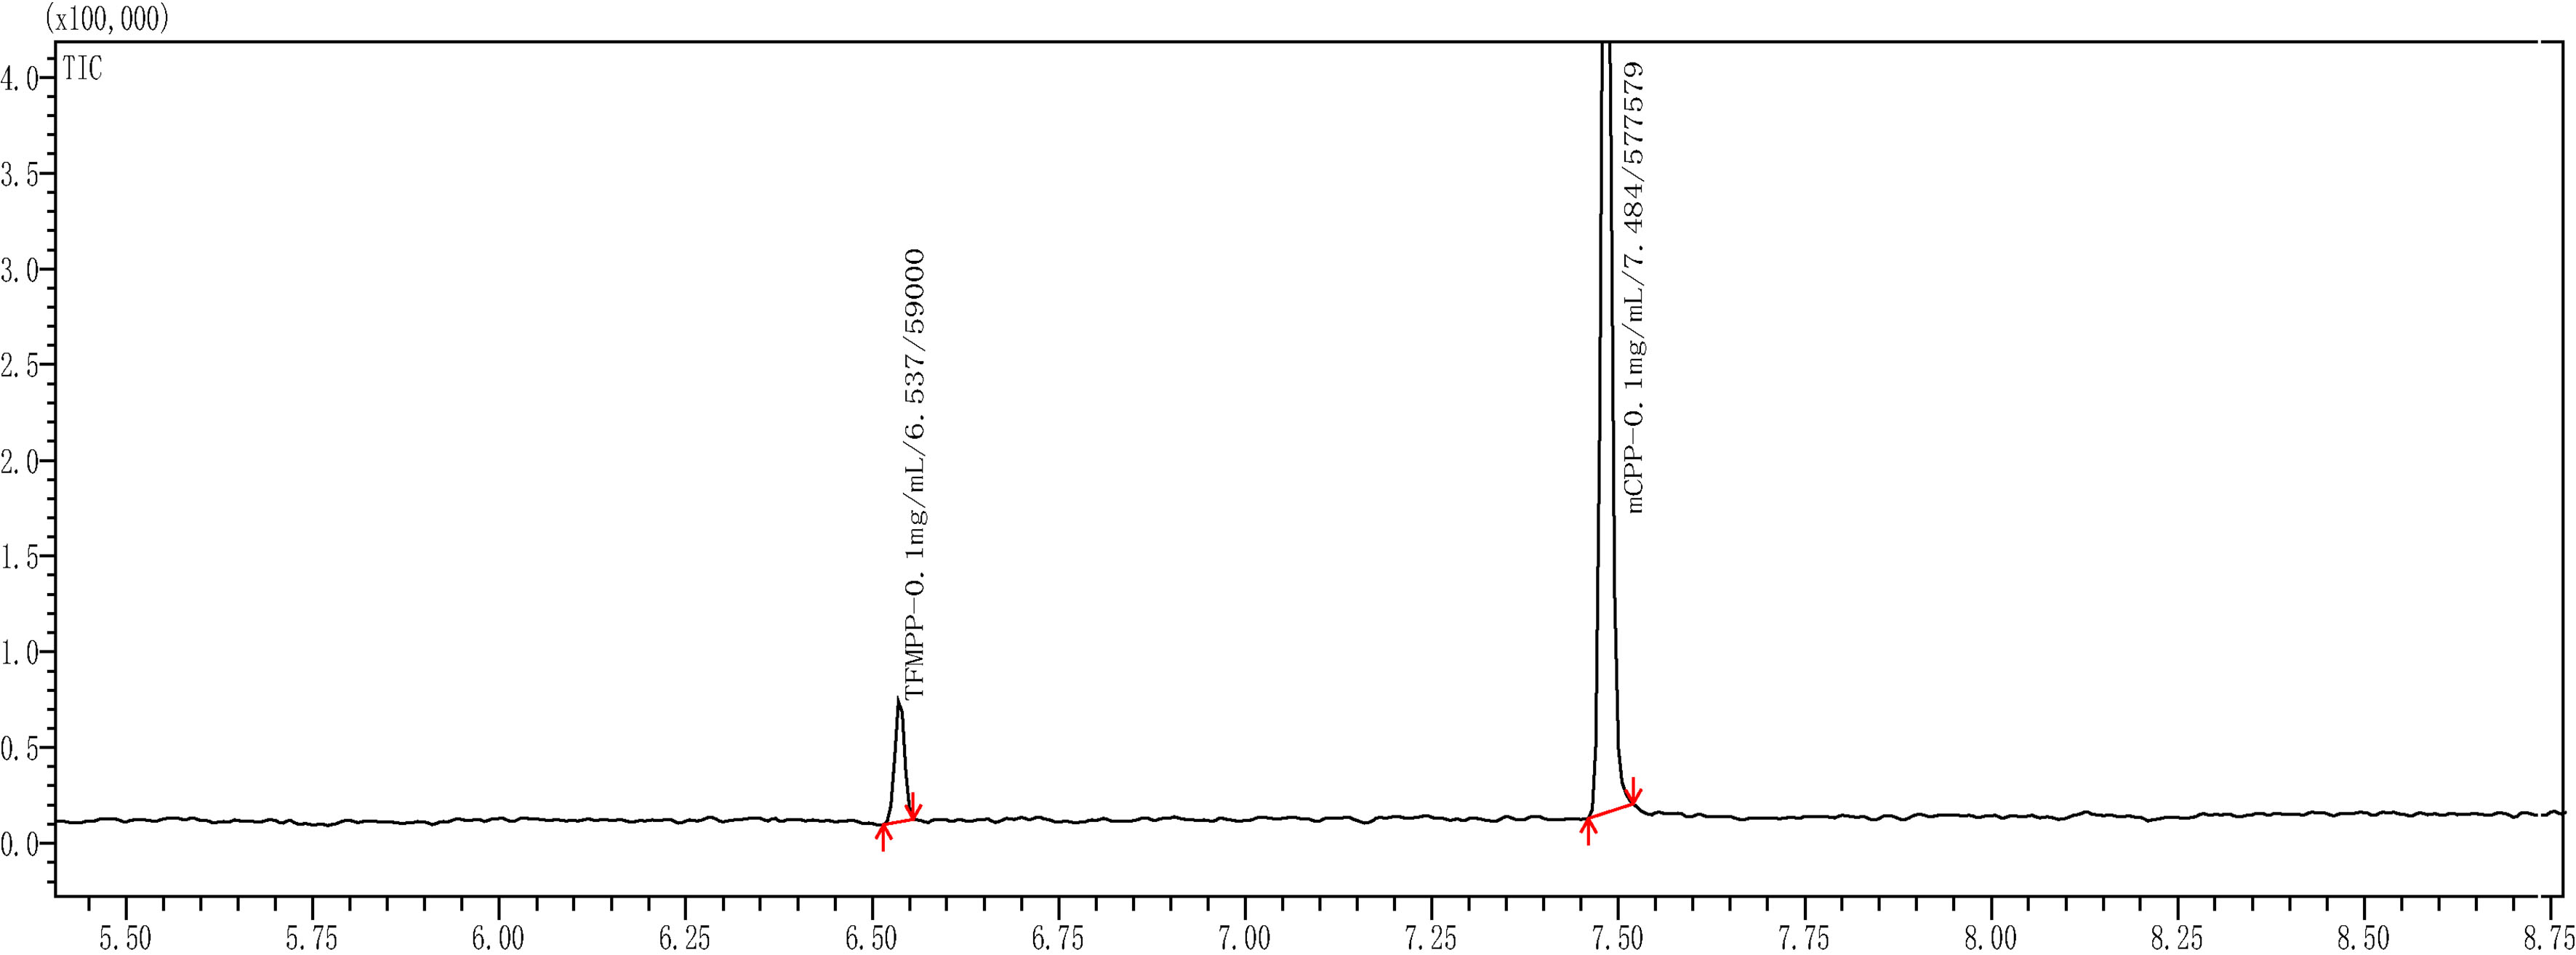
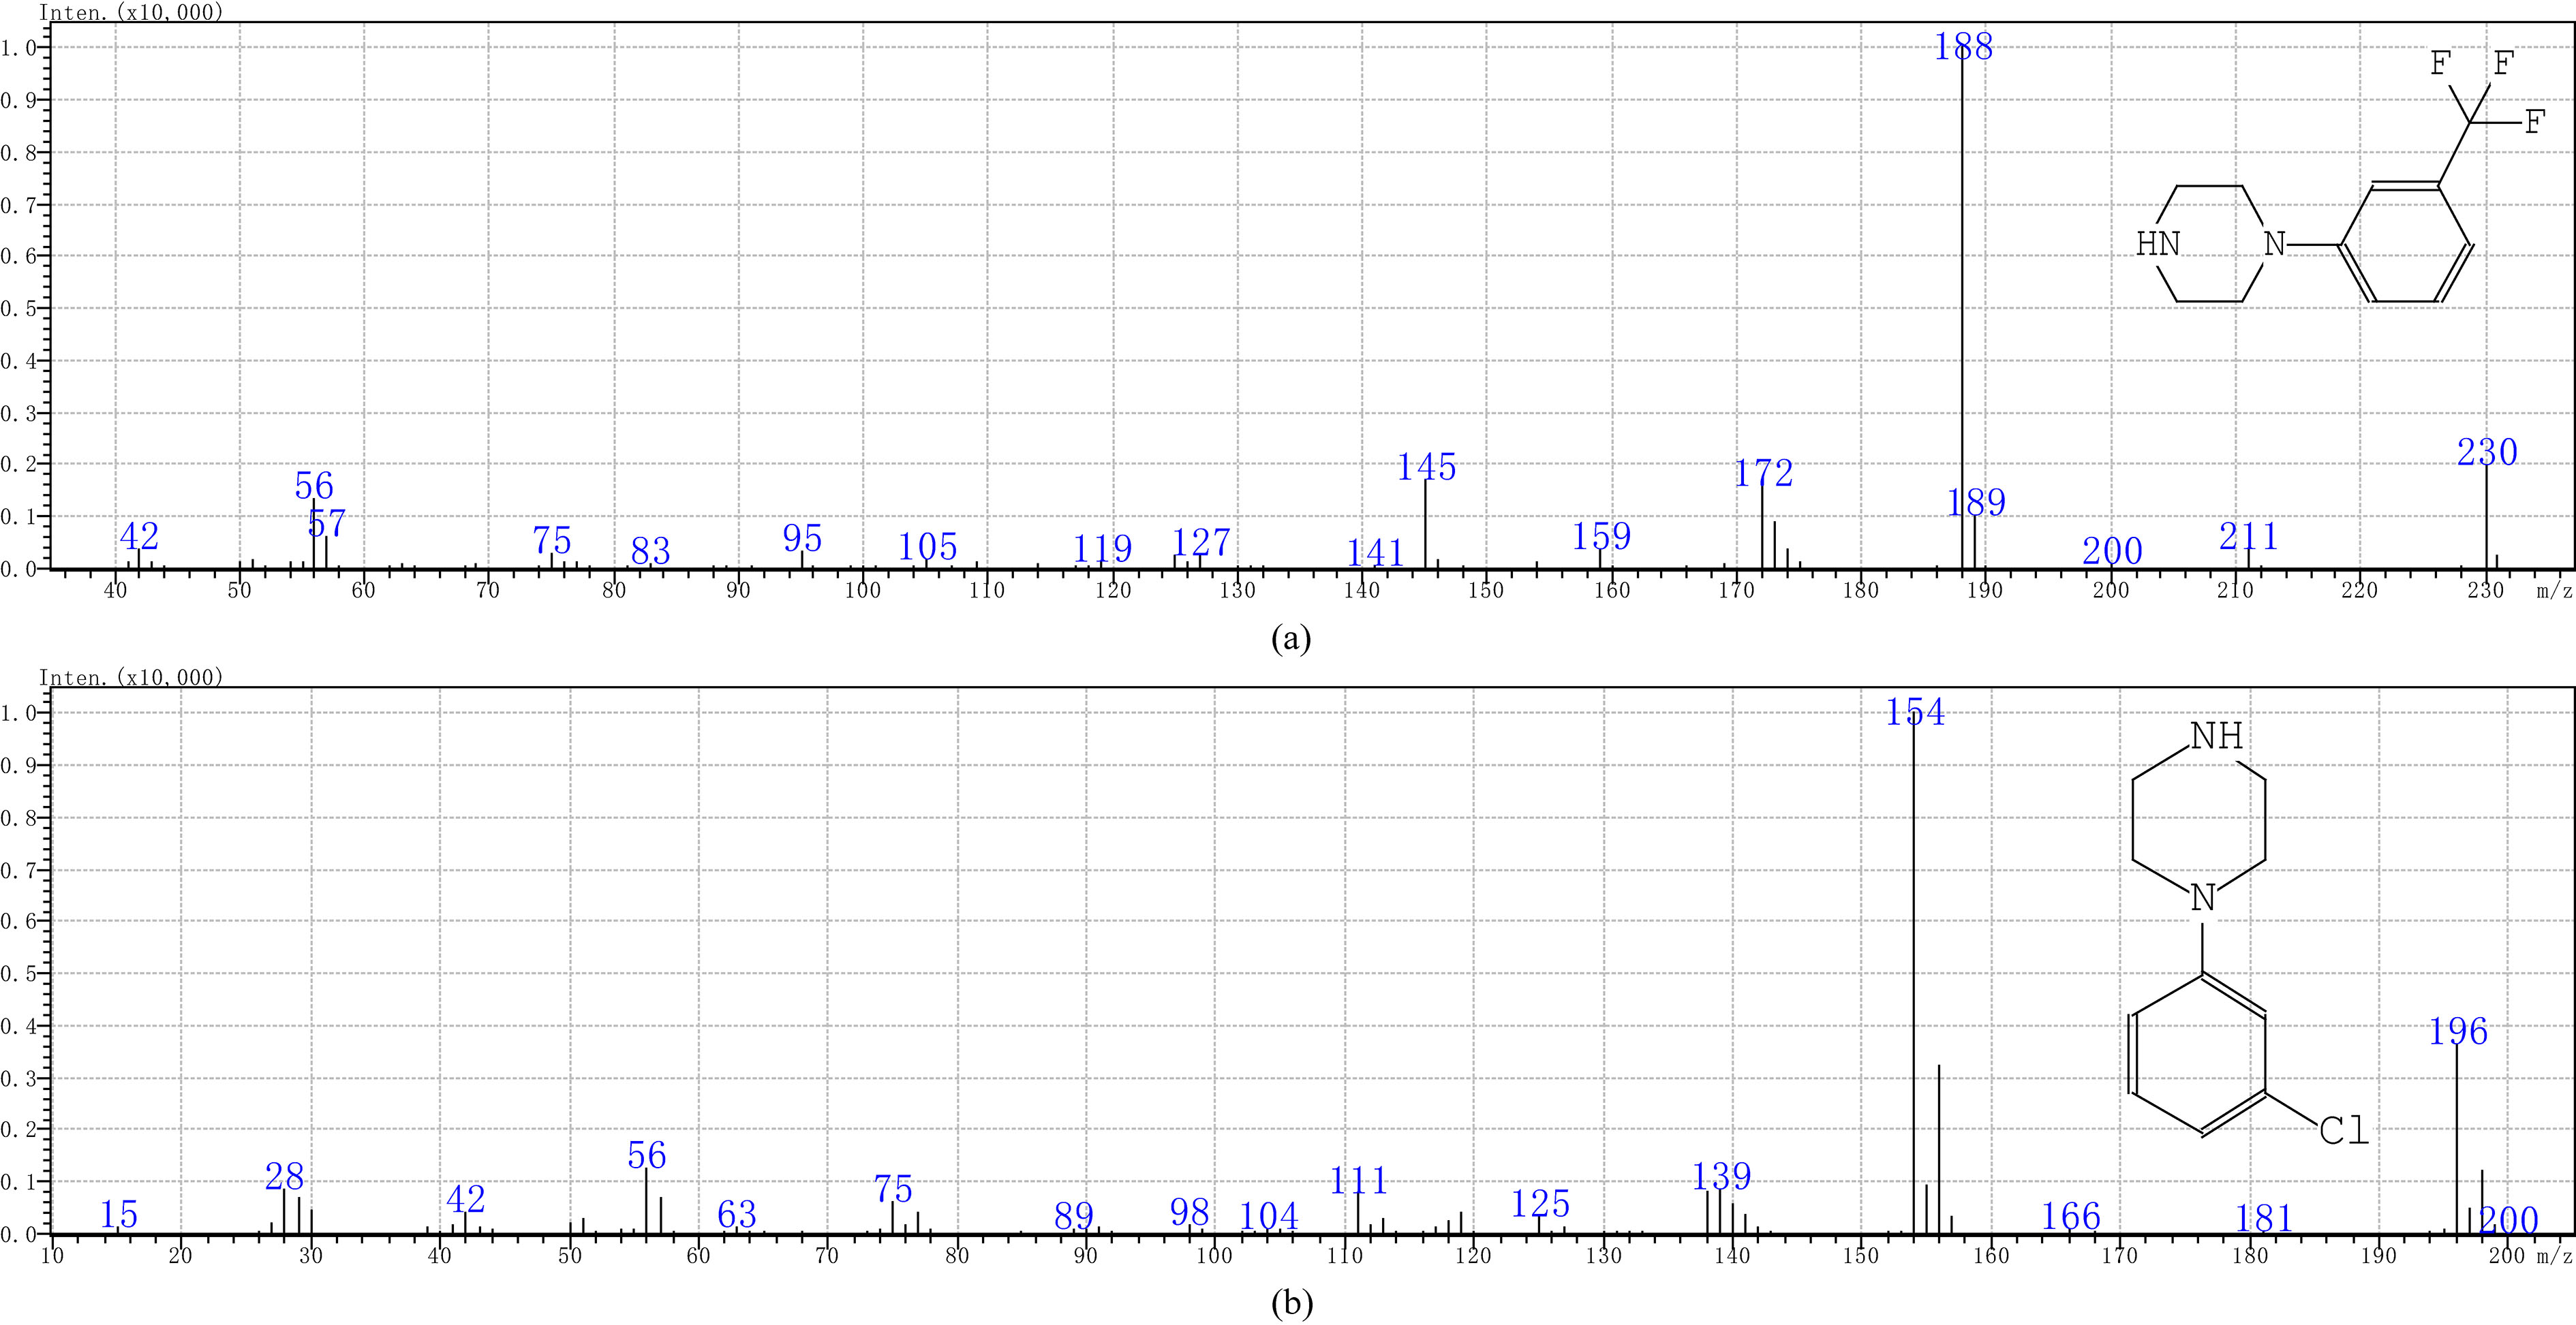
As shown in Fig. 5, the total ion current chromatogram of TFMPP and mCPP was analyzed by the chromatographic and mass spectrometric conditions mentioned in the above paragraph. The TFMPP and mCPP mass spectra are shown in Fig. 6. For the chromatographic peak that appeared at 6.537 min, the characteristic ion fragments m/z188, m/z230, m/z172 were in complete agreement with the characteristic peaks of TFMPP mass fragment obtained from the NIST library. For the chromatographic peak that appeared at 7.484 min, the characteristic ion fragment m/z154, m/z196, m/z56 were in complete agreement with the characteristic peaks of mCPP mass fragment obtained from the NIST library.
Figure 6.
Mass spectra of TFMPP(a) and mCPP(b) standards.
4.4.2Sample pretreatment
In this experiment, 0.1 mL of TFMPP-mCPP mixed solution of 10
4.5Liquid-liquid extraction methods
4.5.1Extraction and detection of TFMPP and mCPP in urine
The sample was subjected to pretreatment according to the method “4.4.2 Sample Pretreatment.” Then, the pH of 1 ml of the pretreated samples was adjusted to pH
Figure 7.
Liquid-liquid gas chromatogram of the urine-TFMPP/mCPP solution.
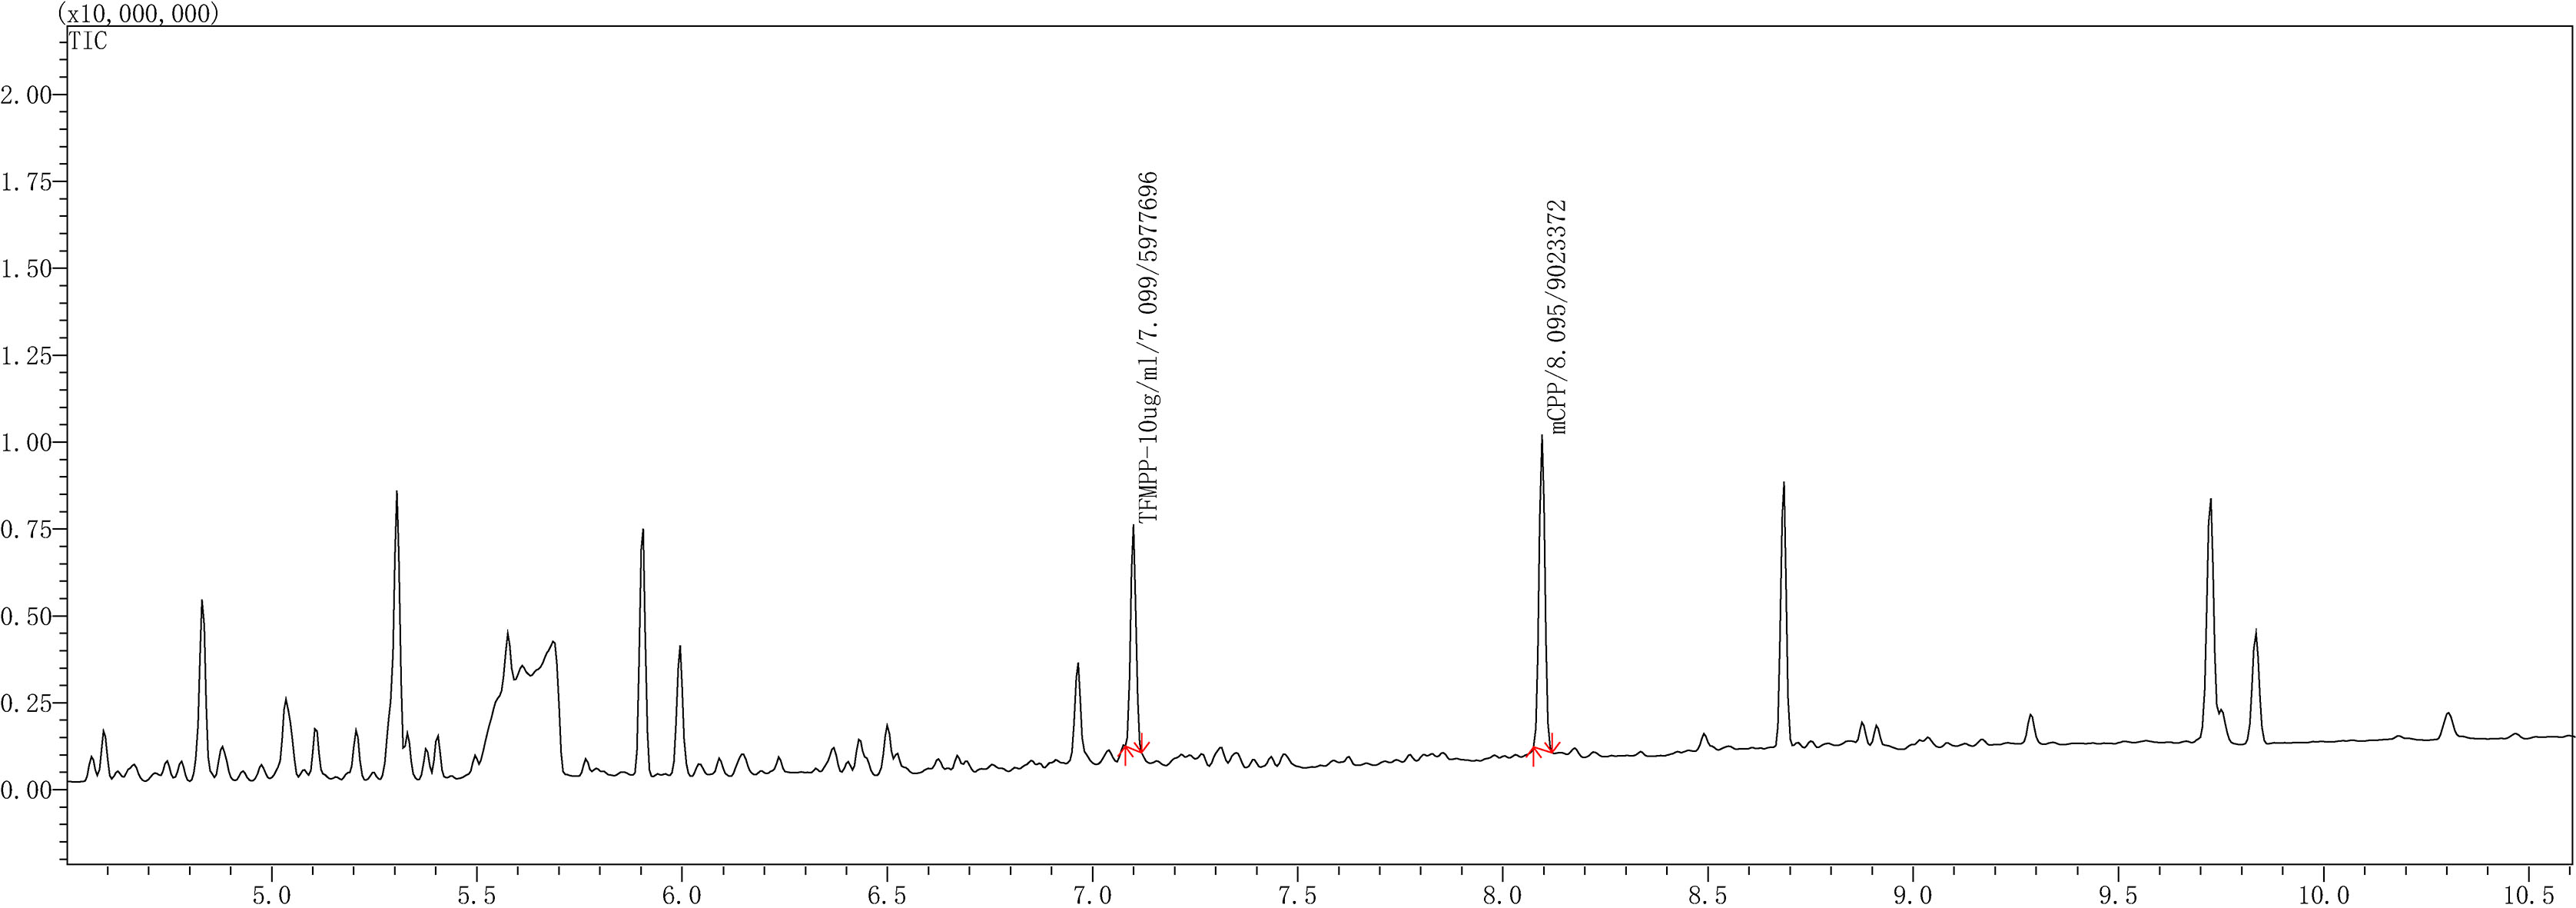
Figure 8.
Liquid-liquid gas chromatogram of the blood-TFMPP/mCPP solution.
4.5.2Extraction and detection of TFMPP and mCPP in blood
The sample was subjected to pretreatment according to the method “4.4.2 Sample Pretreatment.” Then, the pH of 1 mL of the pretreated sample was adjusted till its pH
Figure 9.
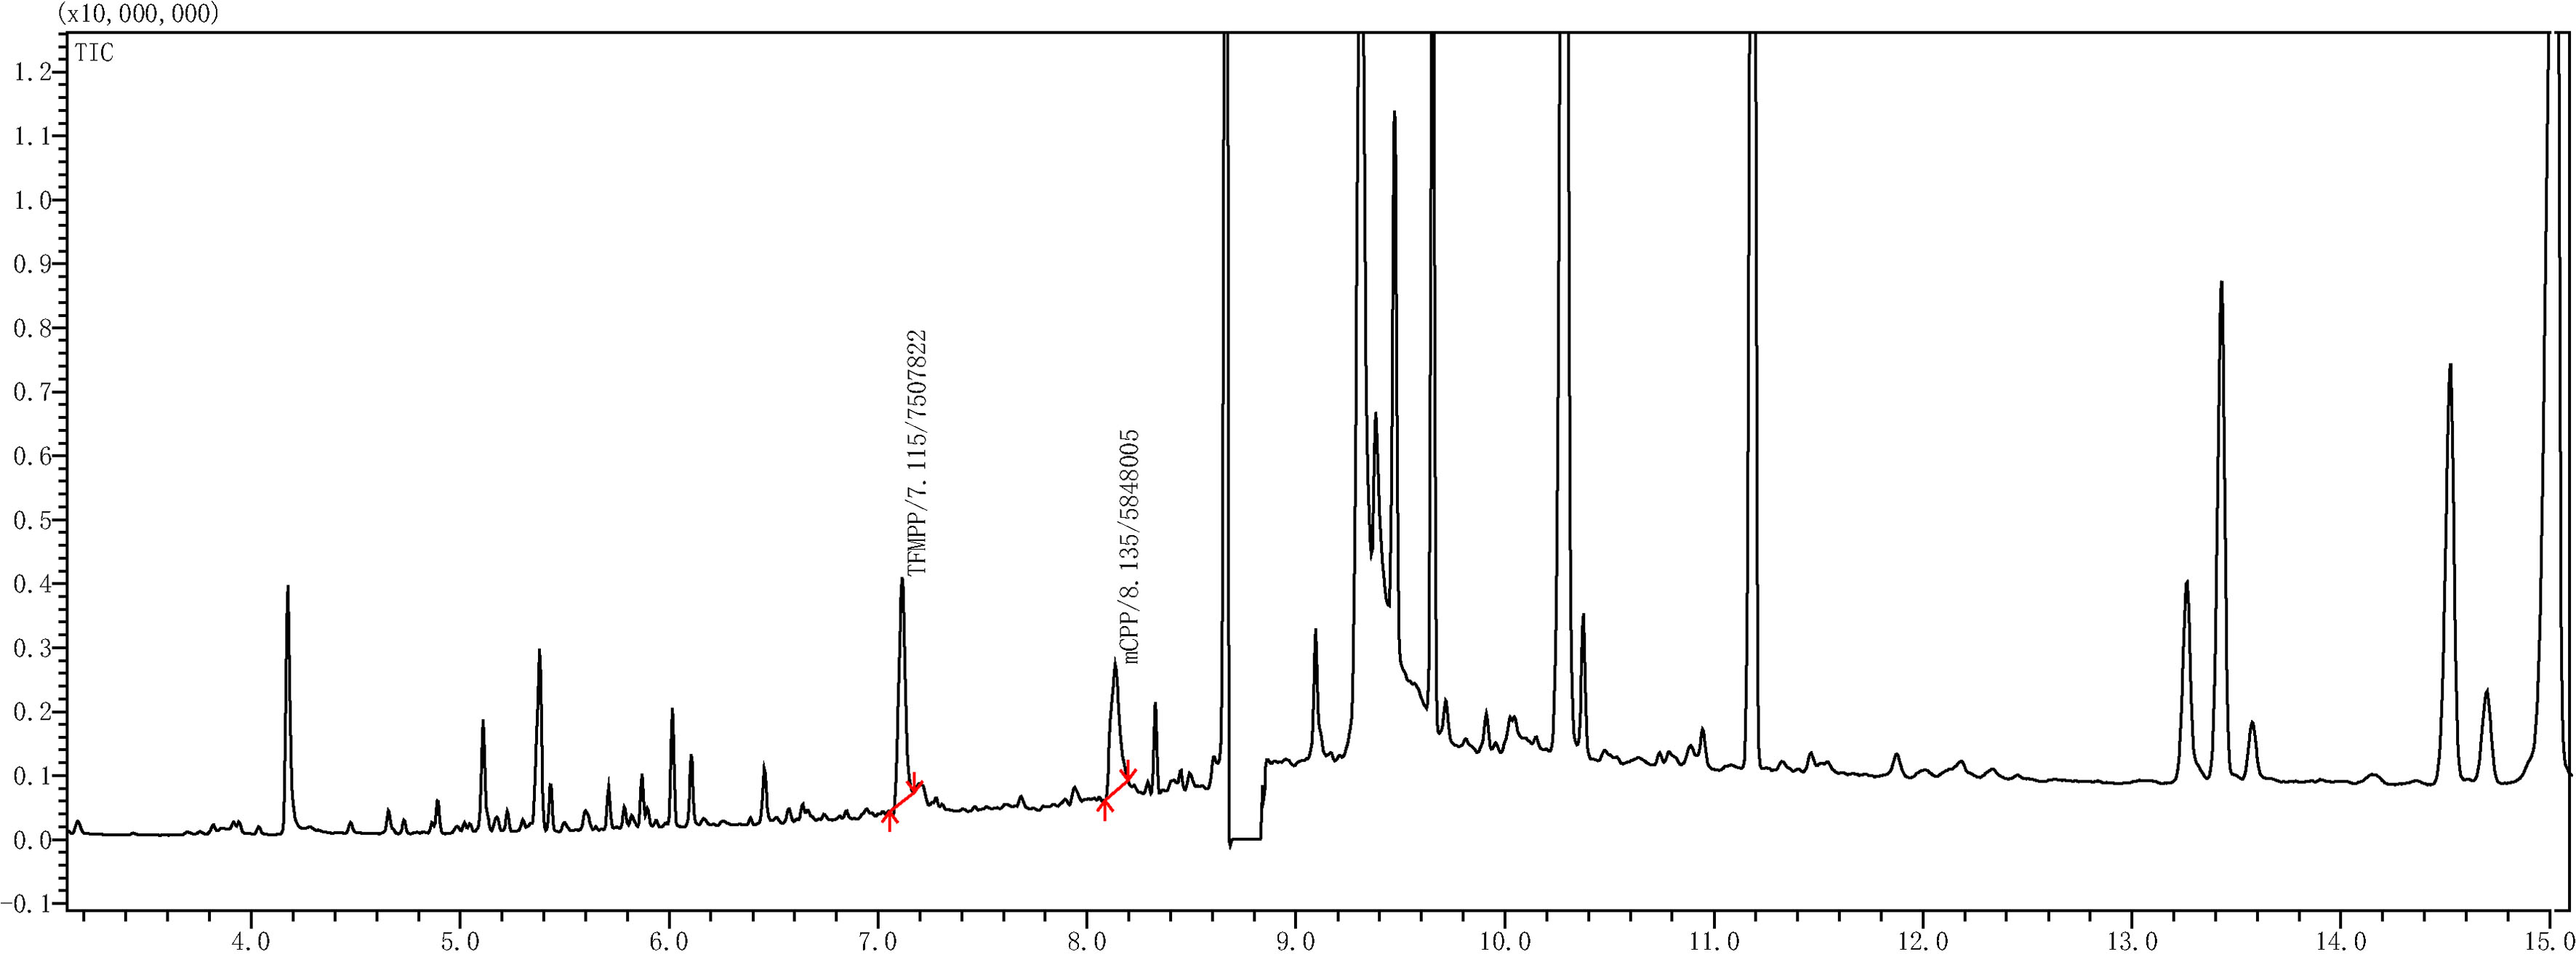
Gas chromatogram of blank urine (a) and blank blood (b).
4.6Solid phase extraction
In this extraction, the sample was pretreated according to the method “4.4.2 Sample Pretreatment.” Then, 1 ml of the pretreated sample was added to 4 mL phosphate buffer and its pH was adjusted to 6. Then, it was vortexed for 10 min, and finally centrifuged at a rate of 8000 r/min for 15 min. The solid phase extraction column Oasis
4.7Specificity experiment
In this experiment, 1 mL of each type of sample solution (blank urine, blood, and standard mixture of TFMPP-mCPP) has been analyzed according to the methods described in “4.5 liquid-liquid extraction method” and “4.4 gas chromatography and mass spectrometry (GC/MS) analysis”. With these methods, we easily obtained the chromatograms of the standard mixture of TFMPP-mCPP (Fig. 8), the blank urine (Fig. 9a), and the f blank blood (Fig. 9b). The results indicate that the impurities in blank urine or blank blood do not interfere with the GC/MS analysis of TFMPP-mCPP solution. The method established in this study has good specificity.
5.Conclusion
This paper is on the research of the prior treatment methods (liquid-liquid extraction, solid-phase extraction) and GC/MS detection for TFMPP and mCPP in biological fluids (urine and blood) at the blankness of the test and regulation at present. This method possesses the practical value for its advantages of simple operation, high recovery, high sensitivity, and low detection limit, while the instruments are already available in lab. It is simple, reproducible and specific for detecting the piperazine-drugs provides a reliable method in forensic science.
Acknowledgments
We are grateful to the Program for Young Innovative Research Team in China University of Political Science and Law (18CXTD09, 16CXTD05), The National Natural Science Foundation of China (81871523), the Opening Project Fund of Shanghai Key Laboratory of Criminal Scene Evidence (2011/23418101) and the Academician Foundation of the Ministry of Public Security of the People’s Republic of China (2011-23317015 and 2017YC0820802-1, 2017YFC0820802-5) for their financial support.
Conflict of interest
None to report.
References
[1] | Liu MB. The prediction of developing trend of new drug-related crimes [J], Journal of Public Security. (2007) ; 4: : 46-51. |
[2] | The United Nations office on drugs and crime. World Drug Report 2012 [R]. United Nations publication, New York, (2012) ; 4-5. |
[3] | The United Nations office on drugs and crime. World Drug Report 2013 [R]. United Nations publication, New York, (2013) ; 60-67. |
[4] | Gui YX, Sun SA, et al. Naphthalene in BWYJ, derivatives of rat blood pressure and hemodynamic effects of cat [J]. Chinese Clinical Pharmacology and Therapeutics. (2005) ; 8: : 852-857. |
[5] | Wang W, Xiao GM. The synthesis of 1-methyl-3-phenylpiperazine [J]. Fine Chemicals. (2004) ; 9: : 711-713. |
[6] | Tong GT, Lu KL. The synthesis of 1-(4-methoxyphenyl)-4-(4-aminophenyl) piperazine [J]. Fine Chemicals. (2003) ; 6: : 34-45. |
[7] | Wilkins C, Girling M, Sweetsur P, Huckle T, et al. Legal party pill use in New Zealand: Prevalence of use, availability, health harms and ‘gateway effects’ of benzylpiperazine (BZP) and triflourophenylmethylpiperazine (TFMPP) [C]. Centre for Social and Health Outcomes Research and Evaluation (SHORE). (2007) . |
[8] | Boess FG, Martin IL. Molecular biology of 5-HT receptors [J]. Neuropharmacology. (1994) ; 33: : 275-317. |
[9] | Samanin R, Mennini T, Ferraris A, et al. Chlorophenyl -piperazine: a central serotonin agonist causing powerful anorexia in rats [J]. Naunyn-Schmiedeberg’s Archives of Pharmacology. (1979) ; 308: : 159-163. |
[10] | Odagaki Y, Toyoshima R, Yamauchi T. Trazodone and its active metabolite m-chlorophenylpiperazine as partial agonists at 5-HT1A receptors assessed by [35S] GTP gamma S binding [J]. Journal of Psychopharmacology. (2005) ; 19: : 235-241. |
[11] | Rotzinger S, Fang J, Coutts RT, Baker GB. Human CYP2D6 and metabolism of m-chlorophenylpiperazine [J]. Biological Psychiatry. (1998) ; 11: : 1185-1191. |
[12] | Arbo MD, Bastos ML, Carmo HF. Piperazine compounds as drugs of abuse [J]. Drug Alcohol Depend. (2012) ; 122: : 174. |
[13] | Staack RF, Fritschi G, Maurer HH. New designer drug 1-(3-trifluoromethylphenyl) piperazine (TFMPP): gas chromatography/mass spectrometry and liquid chromatography/mass spectrometry studies on its phase I and II metabolism and on its toxicological detection in rat urine [J]. Journal of Mass Spectrom. (2003) ; 38: : 971-981. |
[14] | Maurer HH. Screening procedures for simultaneous detection of several drug classes used in the high throughput toxicological analysis and doping control [R]. Comb. Chem. High Throughput Screen. (2000) ; 3: : 461. |
[15] | Gijsman HJ, Cohen AF, van Gerven JMA. The application of the principles of clinical drug development to pharmacological challenge tests of the serotonergic system [J]. Journal of J Psychopharmacol. (2004) ; 18: : 7-13. |
[16] | Tancer M, Johanson CE. Reinforcing, subjective, and physiological effects of MDMA in humans: a comparison with d-amphetamine and mCPP [J]. Drug Alcohol Depend. (2003) ; 72: : 33-44. |
[17] | Ushtana A, Malcolm DT, Bruce RR, et al. Validation of an LC–MS Method for the Detection and Quantification of BZP and TFMPP and their Hydroxylated Metabolites in Human Plasma and its Application to the Pharmacokinetic Study of TFMPP in Humans[J]. Journal of Forensic Science. (2010) ; 55: : 1311-1318. |
[18] | Bishop SC, McCord BR, Gratz SR, et al. Simultaneous separation of different types of amphetamine and piperazine designer drugs by capillary electrophoresis with a chiral selector[J]. Journal of Forensic Science. (2005) ; 50: ; 1-10. |
[19] | Pichini S, Pujadas M, Marchei E, et al. Liquid chromatographyatmospheric pressure ionisation electrospray mass spectrometry determination of ‘hallucinogenic designer drugs’ in urine of consumers [J]. J Pharmacol Biomed Anal. (2008) ; 47: : 335. |
[20] | Dressler M. Extraction of trace amounts of organic compounds from water with porous orgnic polymers [J]. Journal of Chromatography. (1979) ; 165: : 167-206. |
[21] | Staack RF, Fritschi G, Maurer HH. Studies on the metabolism and toxicological detection of the new designer drug N-benzylpiperazine in urine using gas chromatography – mass spectrometry[J]. Journal of Chromatography B. (2002) ; 773: : 35-46. |
[22] | Camilla M, Manuel S, Mariaelena M, et al. Screening of methylenedioxy amphetamine and piperazine-derived designer drugs in urine by LC-MS/MS using neutral loss and precursor ion scan [J]. Journal of Mass Spectrom. (2013) ; 48: : 49-59. |
[23] | Wohlfarth A, Weinmann W. Bioanalysis of new designer drugs [J]. Bioanalysis. (2010) ; 2: : 965-979. |
[24] | World Drug Report 2013 [R]. United Nations publication, New York, (2013) ; 60-67. |
[25] | Cui JF, Li N, Cui KR, et al. Stimulants drugs and the separation of metabolite identification [J]. Chin J Pharm Anal. (1994) ; 14: : 3. |
[26] | Zhuo XY, Sun YJ. The rapid detection of ‘ecstasy’ [J]. Chinese Journal of Drug Abuse Prevention and Treatment. (2001) ; 4: : 39. |
[27] | Chang J, Hao HX, Li HX, Wang FL, Hou XP, Wang RH. The detection of m CPP and TFMPP in blood samples by gas chromatographic mass spectrum and gas chromatography with nitrogen phosphorus detection[J]. Forensic Science. (2015) ; 2: : 121-124. |
[28] | Frank TP, Simone S, Roland FS, et al. Screening for and validated quantification of amphetamines and of amphetamine and piperazine-derived designer drugs in human blood plasma by gas chromatography/mass spectrometry[J]. Journal of Mass Spectrom. (2003) ; 38: : 659-676. |


