
A novel method for automatic classification of Parkinson gait severity using front-view video analysis
Abstract
BACKGROUND:
Gait impairment is an essential symptom of Parkinson’s disease (PD).
OBJECTIVE:
This paper introduces a novel computer-vision framework for automatic classification of the severity of gait impairment using front-view motion analysis.
METHODS:
Four hundred and fifty-six videos were recorded from 19 PD patients using an RGB camera during clinical gait assessment. Gait performance in each video was rated by a neurologist using the unified Parkinson’s disease rating scale for gait examination (UPDRS-gait). The proposed algorithm detects and tracks the silhouette of the test subject in the video to generate a height signal. Gait features were extracted from the height signal. Feature analysis was performed using the Kruskal-Wallis rank test. A support vector machine was trained using the features to classify the severity levels according to UPDRS-gait in 10-fold cross-validation.
RESULTS:
Features significantly (
CONCLUSION:
Findings support the feasibility of this model for Parkinson’s gait assessment in the home environment.
1.Introduction
Parkinson’s disease (PD) deteriorates motor functions and develops gait symptoms over time. These symptoms include short-shuffling steps, postural instability, slow walking, etc. [1]. Parkinsonian gait is clinically examined using the unified Parkinson’s disease rating scale part-III item-29 (UPDRS-gait) [2]. This examination requires a patient to walk back and forth on a 10 meters gait platform. A doctor rates the walk on a scale of ‘0’ and ‘4’ using UPDRS-gait. ‘0’ represents a healthy walk ‘1’ represents a slow walk with shuffling steps ‘2’ represents a walk with shortshuffling steps and festination. ‘3’ represents a severe gait disturbance that requires assistance for walking ‘4’ indicates total disability to walk even with assistance.
Some limitations of examining PD include the consumption of extensive time and resources of healthcare systems [3], the physical ability of patients to visit clinics for regular assessment, and subjective evaluation of symptoms by a doctor that is prone to human error. A solution is to employ vision-based telemonitoring tools to enable continuous monitoring of patients in their home environment.
Figure 1.
At-home gait assessment based on front-view video analysis.
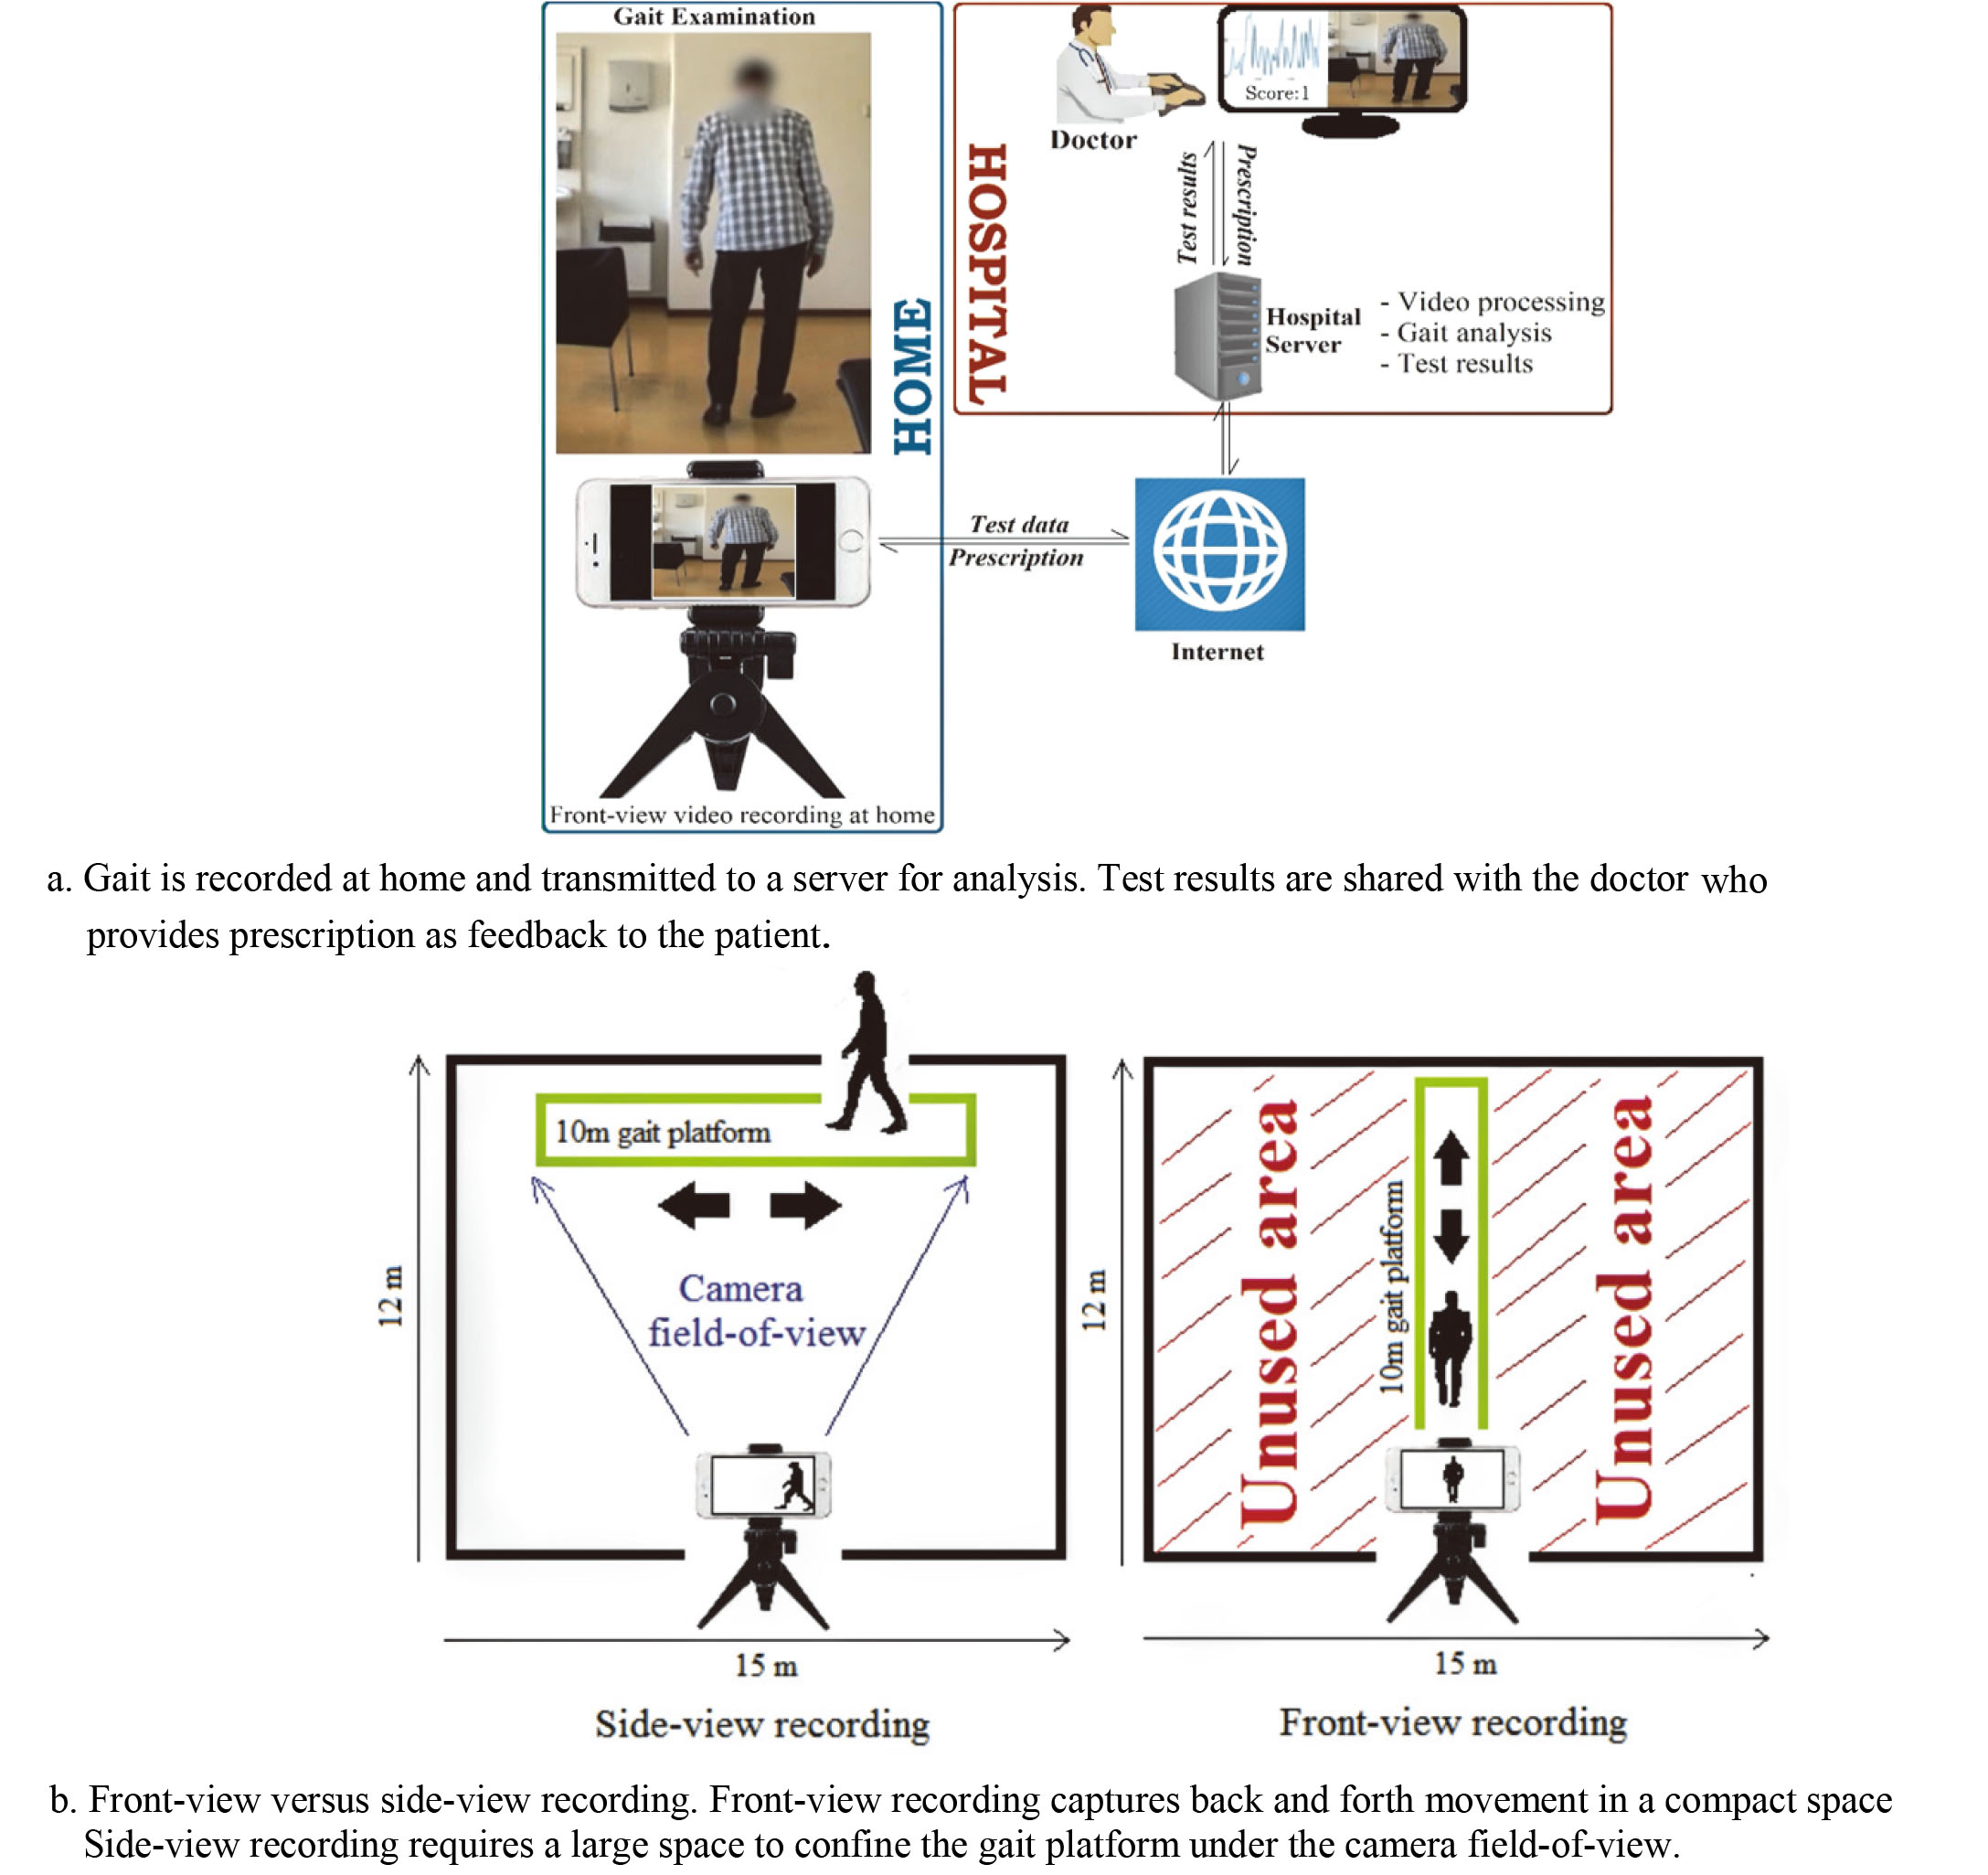
State of the art vision-based methods of gait analysis used Kinect sensors [4]. However, Kinect sensors are not commonplace as compared to the RGB cameras in smartphones, laptops, and tablets. Importantly, these devices allow transmitting recordings of gait to a server where videos can be processed, and results presented to a caregiver. Subsequently, the prescription can be transmitted back to the patient’s device (Fig. 1a). This feedback mechanism of computerized gait assessment improves interactivity between patients and caregivers that allows timely treatment of patients at home not possible through conventional manual ways of treating Parkinson’s disease.
A recent study [5] used an RGB camera to record side-view of test subjects to obtain visual separation of legs for estimating steplength. The study reported a strong correlation between fall and steplength. Similarly, another study [6] used an RGB camera and side-view for estimating the silhouette of a walking person and suggested that gait analysis can be performed without a lab, or physical attachment of sensors or markers to the patients.
However, a disadvantage of side-view assessment is that a large room is needed for recording (Fig. 1b). Alternatively, recording from front confines the back and forth movement of the subject within the camera field-of-view, which allows recording gait in compact spaces such as corridors. This is important because studies suggest that freezing and falling is less likely to occur in corridor walks since corridors provide visual cues to the patients that assist them in planning their movement [7].
We propose a machine learning model for estimating Parkinsonian gait symptoms using front-view video analysis. The method follows the UPDRS protocols and allows using a compact space. The algorithm uses the varying height of the subject in a sequence of video frames to extract features representing gait symptoms. A support vector machine (SVM) was trained using these features to score the severity of gait impairment based on the UPDRS-gait.
2.Method
2.1Data acquisition
Data were acquired between 2002 and 2003 at five clinics in Sweden in a study entitled ‘Duodopa Infusion: Randomized Efficacy and Quality-of-life Trial’ [8]. In the study, gait examinations of 24 patients (19 males and 5 females) were videotaped. The patients were aged between 50 and 75 and had a mean total-UPDRS score of 50.45 on a scale between ‘0’ (healthy) and ‘108’ (total disability).
Gait examination was conducted in a 10 meters long corridor. Patients were seated on one end of the corridor and a camera is pivoted at the other end. Patients were asked to rise from the chair, walk straight to the camera, turn, and walk back to the chair. The gait was recorded, and the video was transmitted to a server accessed by a neurologist. The neurologist watched the video and rated the walking performance based on the UPDRS-gait.
Each patient was examined and videotaped 17 times throughout the day with a rest of half-an-hour before each examination. Videos of patients with a total disability to walk (rated ‘4’) and those who required assistance (rated ‘3’) were not used for the analysis due to the interference of nursing assistants in the videos. Also, some patients dropped out of the study. The videos were recorded at 25 frames per second and a resolution of 352
Since multiple videos were recorded of an individual, to avoid subjective bias in model development and to balance sample distribution, 456 videos with reasonable quality (no blur/shadows/highlights/occlusion) were randomly selected from the database such that classes ‘0’, ‘1’ and ‘2’ consisted of 152 samples each. The videos were used for method validation and analysis.
2.2Method description
The block diagram of the algorithm is shown (Fig. 2). In the first step, the test subject was identified in the video using a human detector based on the histogram-of-oriented gradients (HOG) [9]. HOG returns a bounding-box that confines the height and width of the subject in a video frame. In the second step, a height signal was produced by using the varying height of the boundingbox in a sequence of video frames. The signal was height-adjusted and normalized. Features were extracted from the height signal for training an SVM to score UPDRS-gait. The steps are described further.
Figure 2.
Block diagram of the gait algorithm.
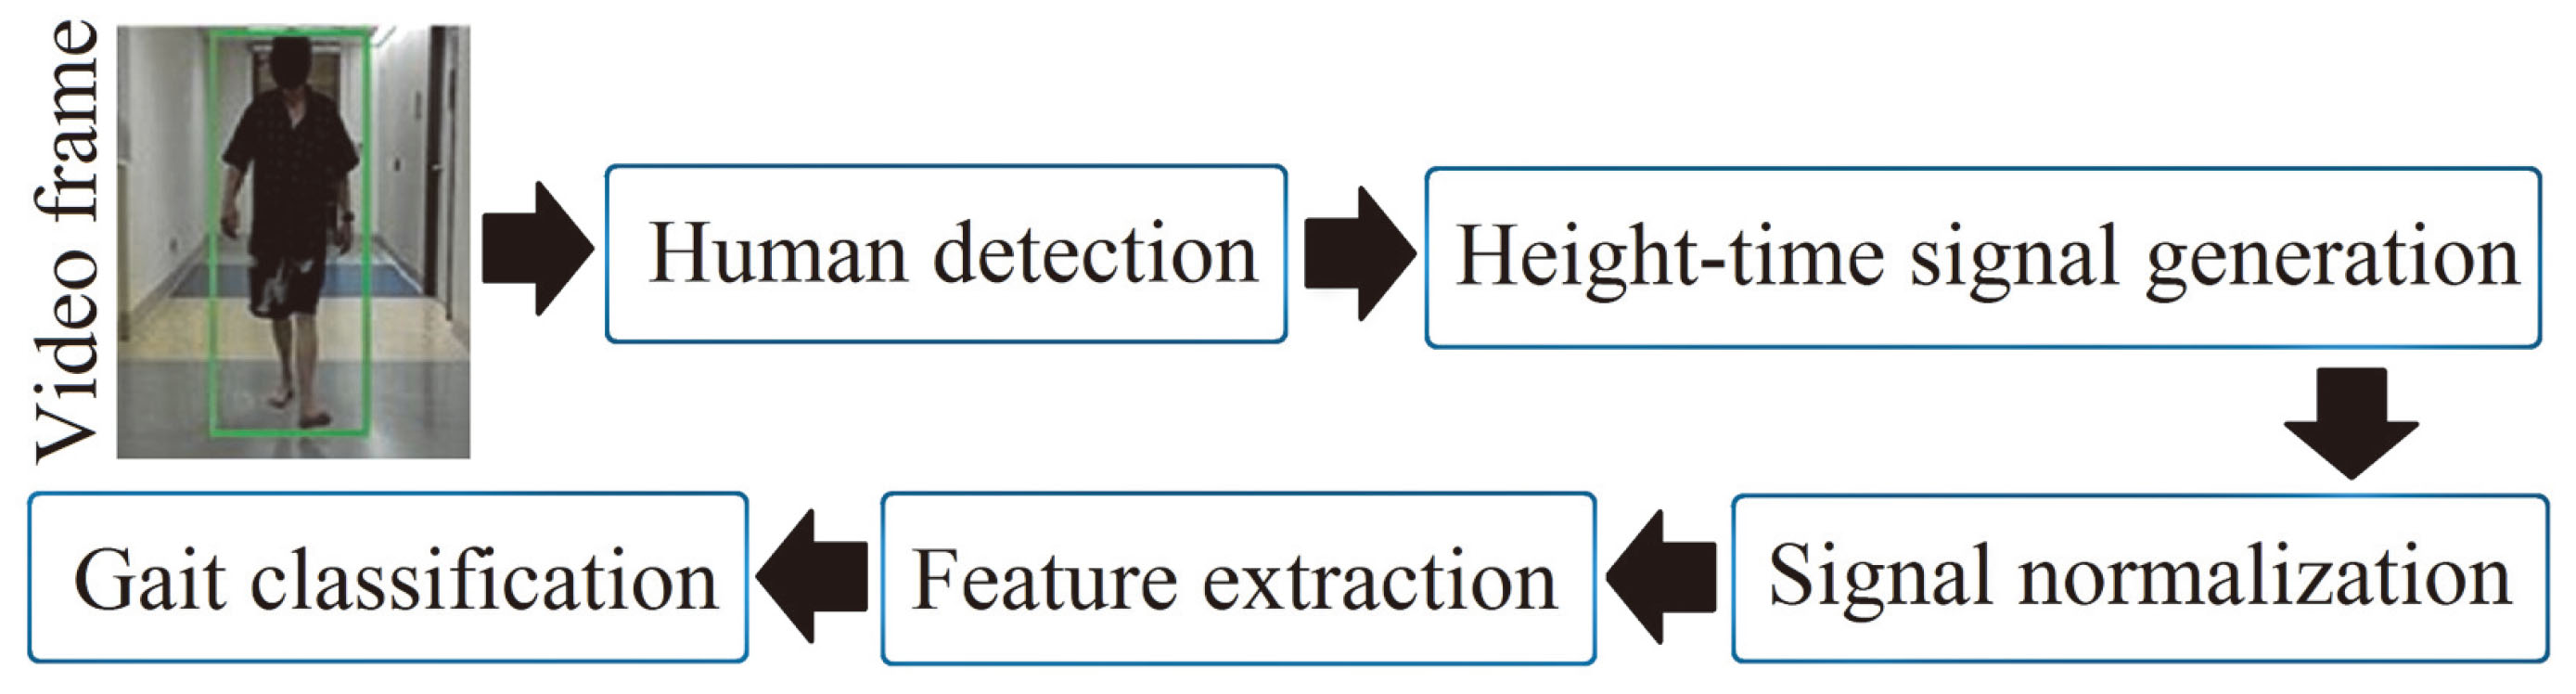
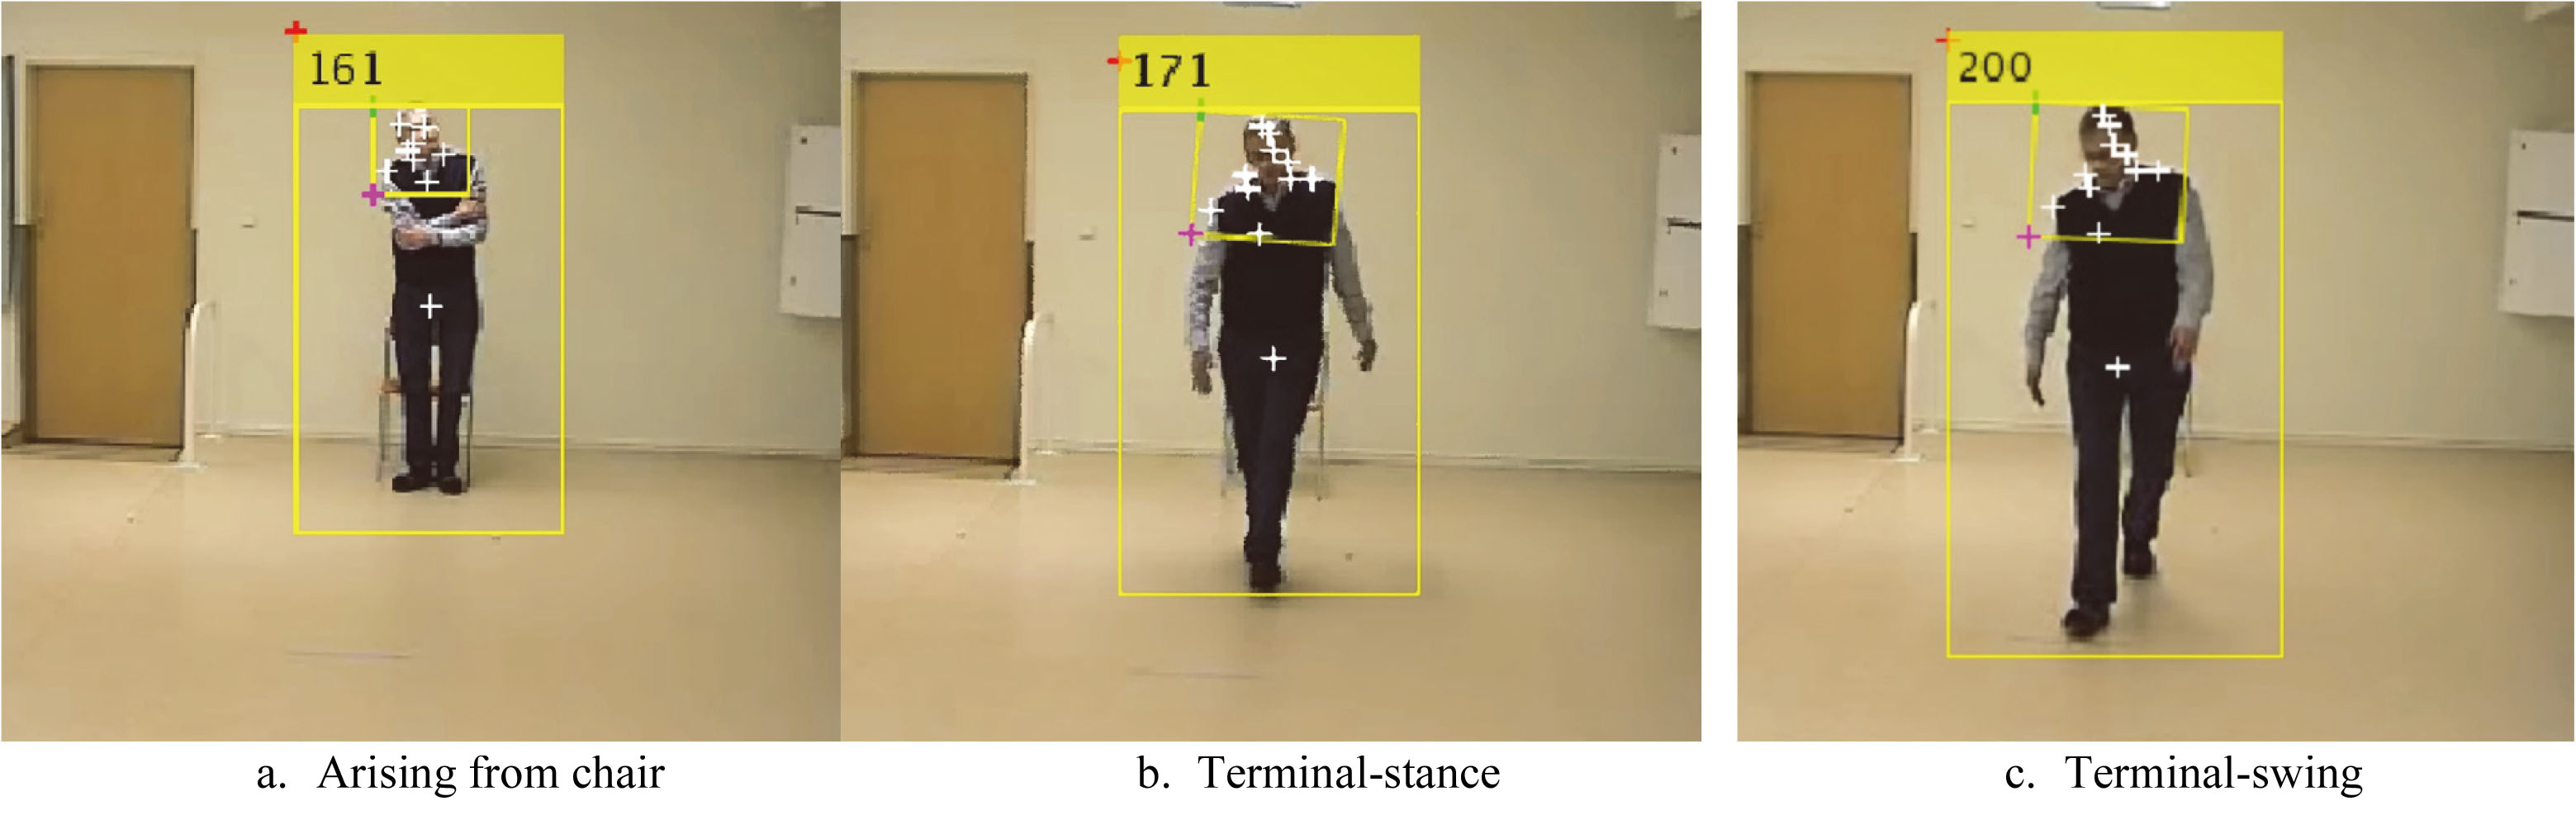
Figure 3.
Human detection in an image sequence.
2.2.1Human detection
Human detection using HOG [9] is based on the idea that the appearance of a local object in an image can be characterized by the distribution of gradients of pixel intensities. A significant intensity difference across pixels indicates an edge. The algorithm operates by dividing an image into connected regions called cells. A local 1-D histogram of pixel intensities in that cell is computed. The histogram is contrast-normalized using the Gaussian weight of pixel intensities across larger regions of the image referred to as blocks (Eq. (1)).
(1)
Where
2.2.2Height signal
The HOG algorithm returns a bounding-box with height
2.2.3Signal pre-processing
For accurate estimation of gait symptoms, the method must be robust to varying heights of people since gait attributes are affected by height. For instance, a tall person’s stride is generally longer than a short person’s stride. To account for the height variation,
(2)
The normalized signal
Figure 4.
The height signal
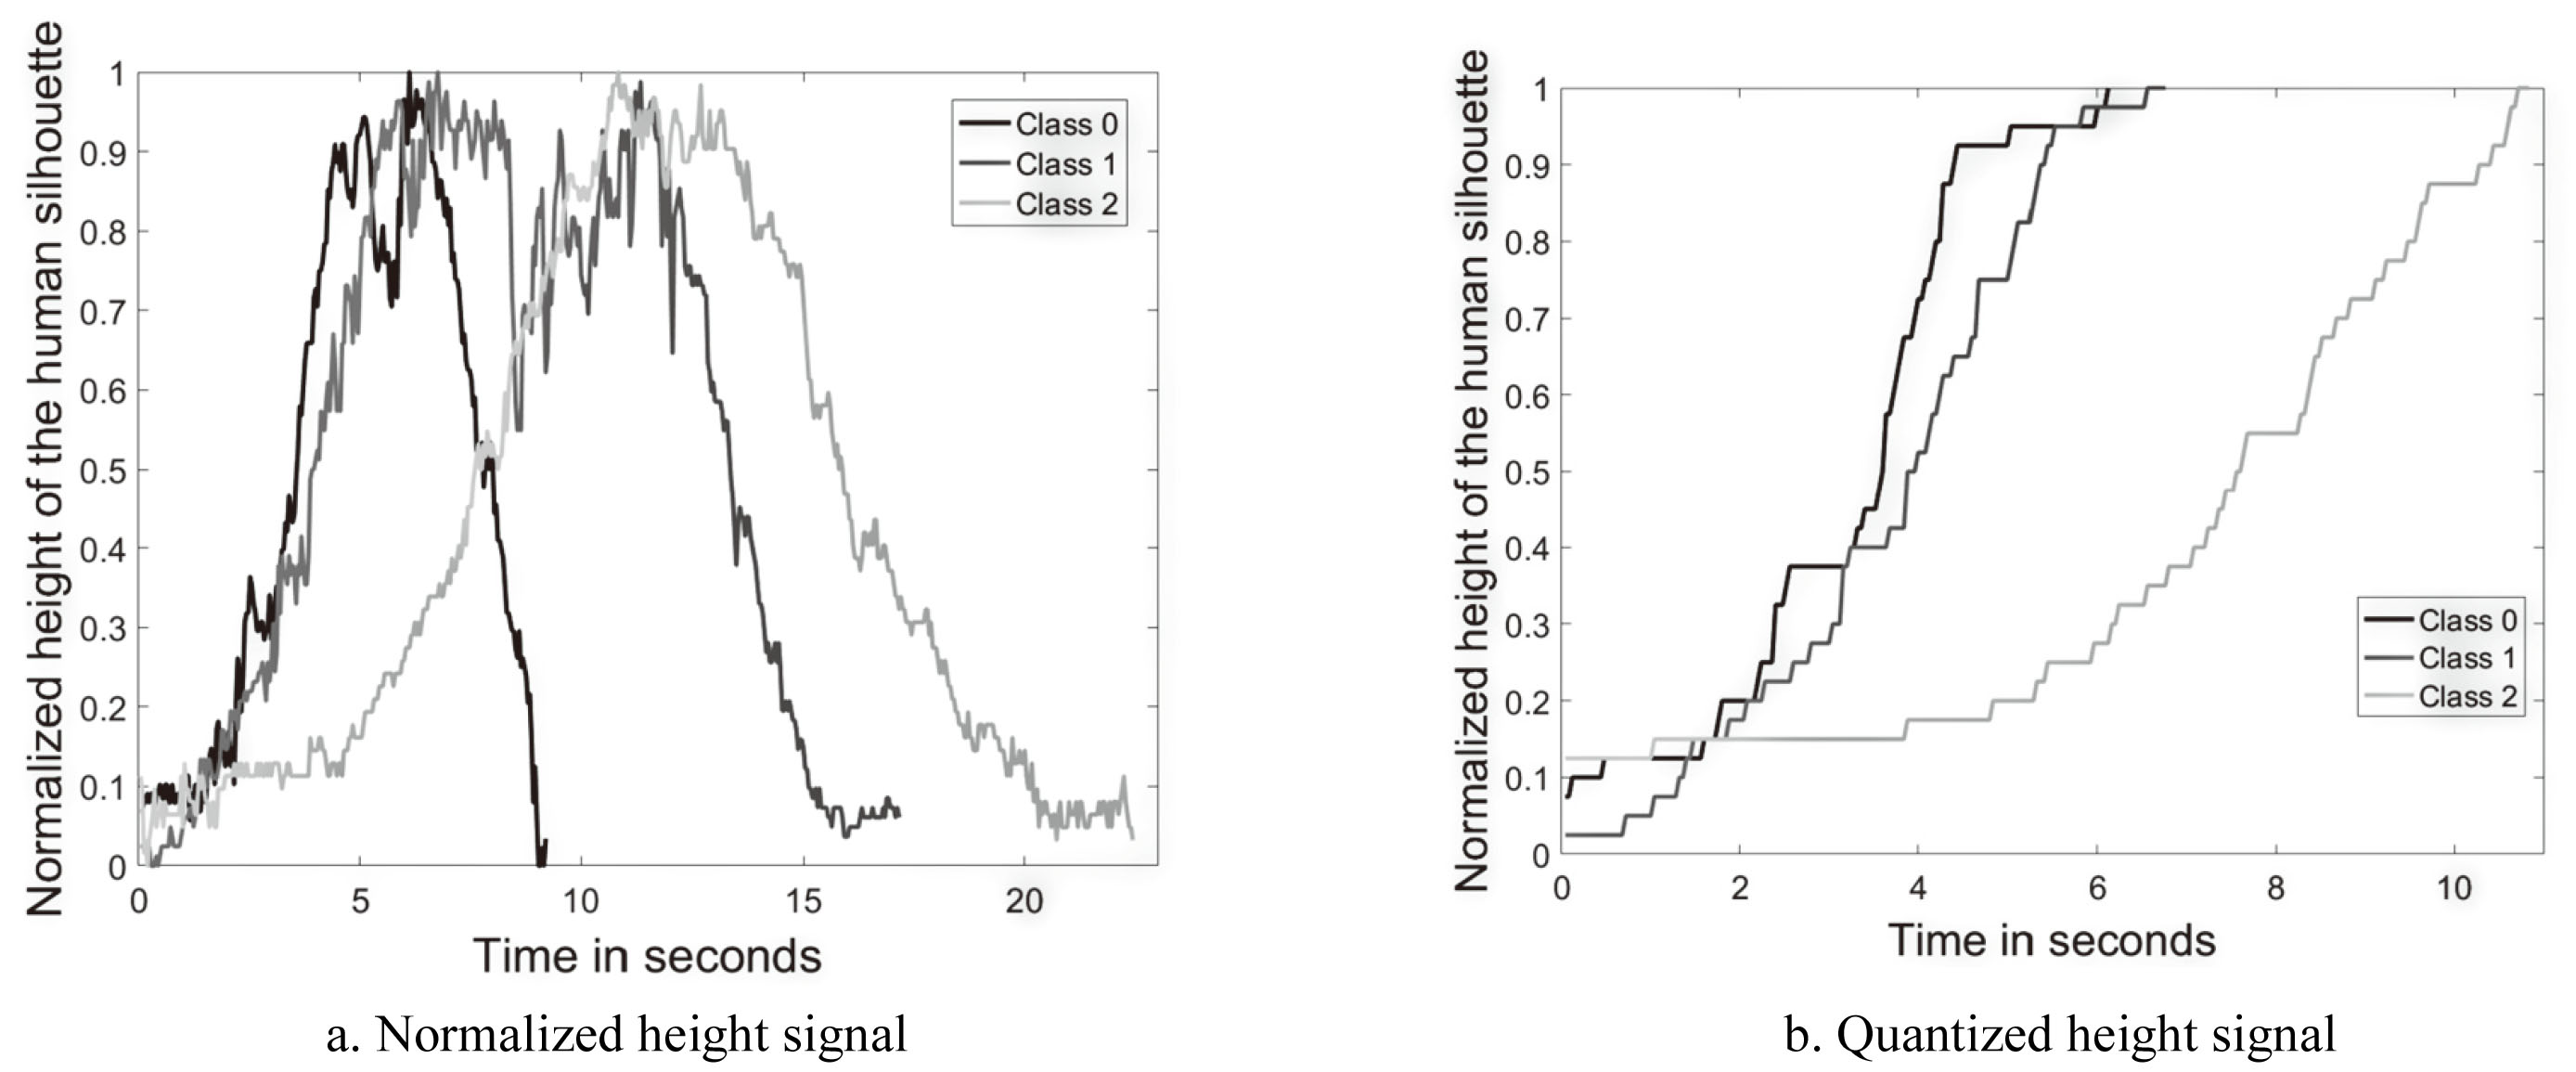
To remove signal aberrations,
2.2.4Feature extraction
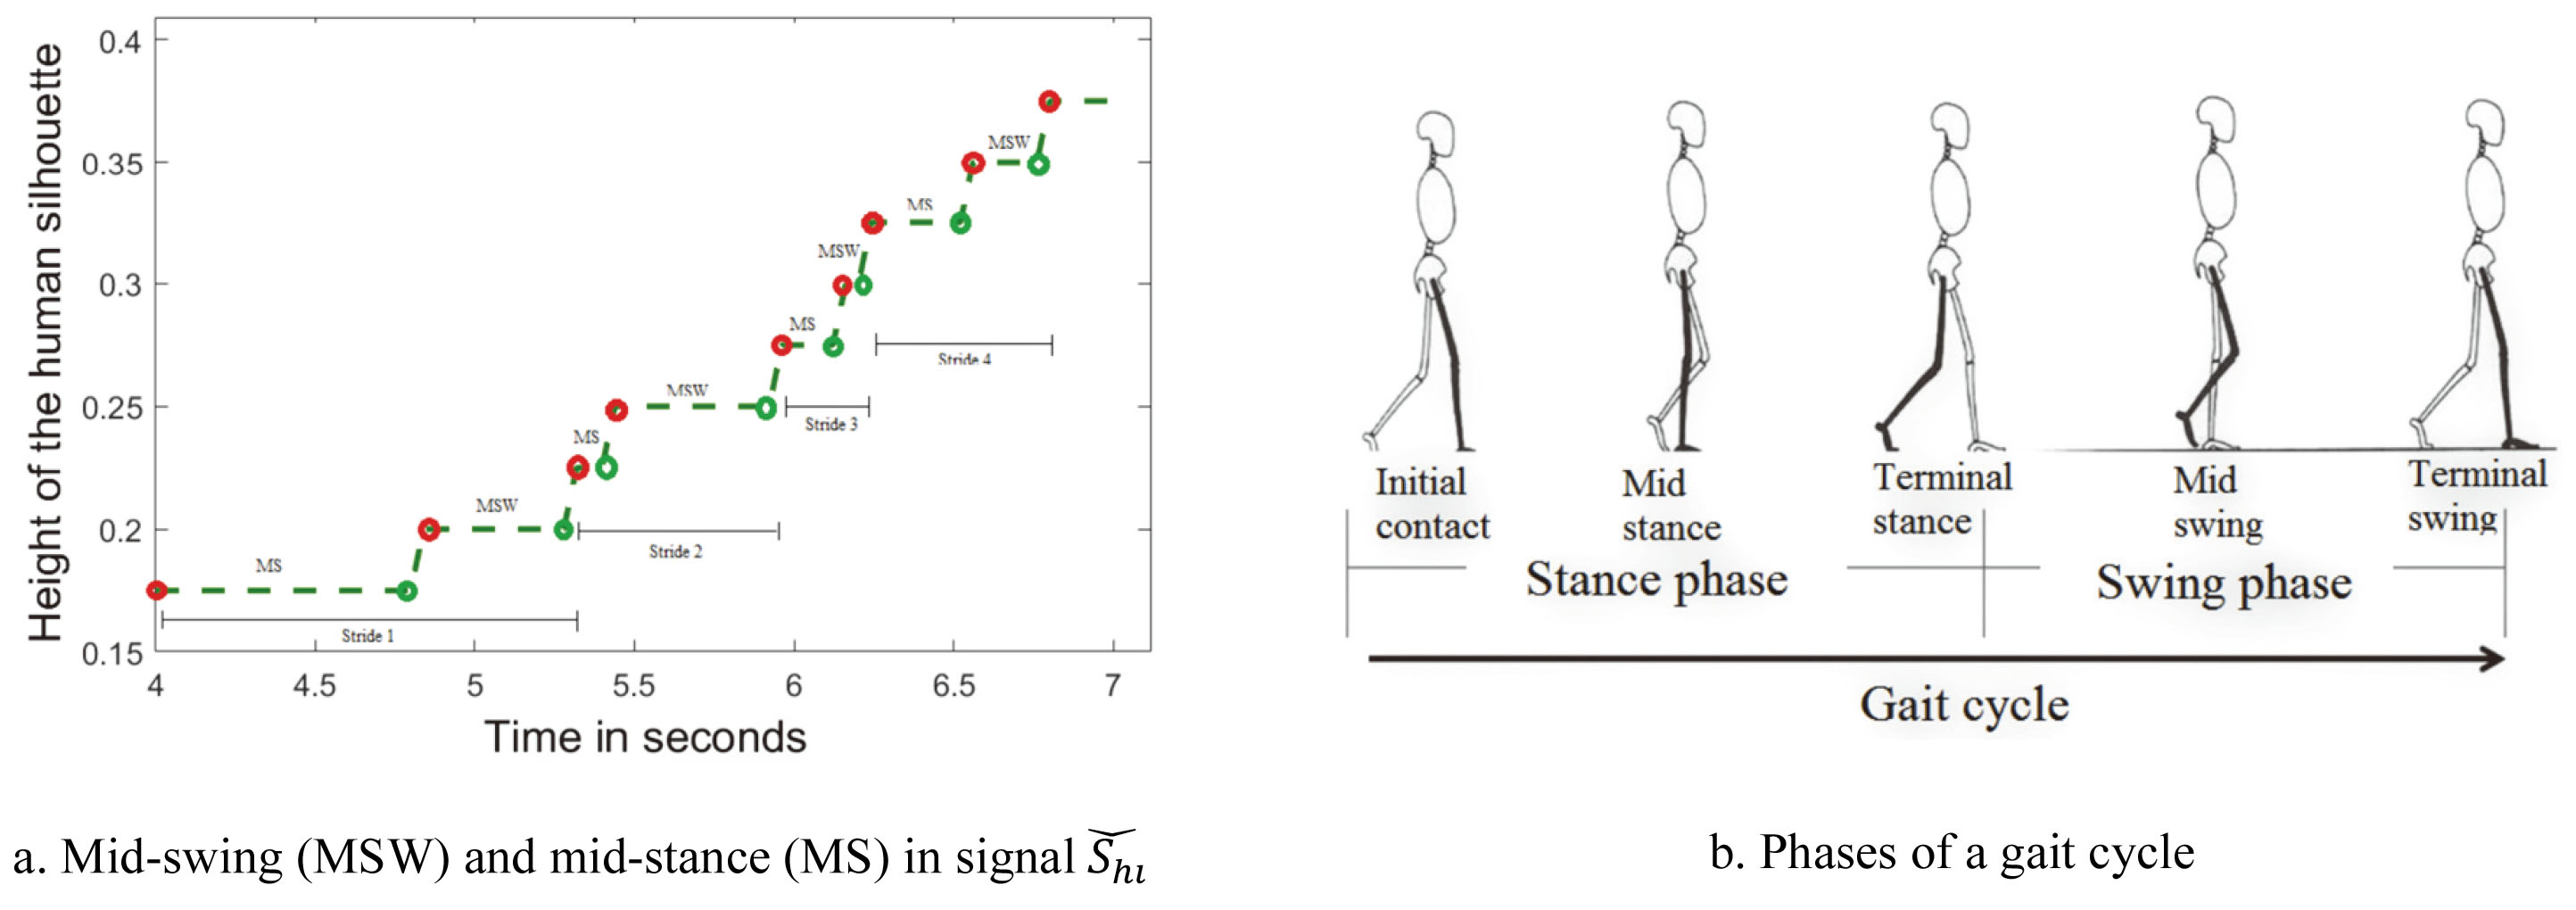
Stride has two phases, swing and stance. As discussed above,
(3)
Where
(4)
Where
(5)
Figure 5.
Representation of gait events in the quantized height signal.
To estimate short steps indicating level-1 impairment, average stride time
(6)
Detrended fluctuation analysis (DFA) and entropy
(7)
Where
(8)
Self-similarity
Entropy in
(9)
Spectral centroid variability in
(10)
Where
(11)
Slow walking was estimated by computing time
2.2.5Feature analysis
A non-parametric one-way analysis of variance of features across severity levels was performed using the Kruskal-Wallis test [15]. For each feature, the test ranked feature values from smallest to largest. Level mean-ranks were compared to test the null-hypothesis that independent samples belong to continuous distributions that are indistinguishable. Statistical significance (
2.2.6Classification
SVM was chosen for its ability to find optimal margins between class boundaries over a high-dimensional feature space [16]. SVM uses a kernel function for mapping features to a higher dimension by using images of the inner product between pairs of features, which is computationally inexpensive compared to computing actual feature coordinates in a high-dimensional space. We used a PUK kernel
(12)
Where
To avoid biased generalization, data were stratified using 10-fold cross-validation i.e., the models were trained and tested in 10 iterations. In each iteration, 90% of randomly selected samples were used for training and 10% were used for testing the model. Samples used for testing once are not repeated for testing in other iterations. Prediction accuracy was computed for each iteration and results are averaged over ten iterations. The overall performance was evaluated using confusion matrices and ROC curves. Results are given in Section 3.
3.Results
A comparison between feature mean-ranks of UPDRS-gait levels is shown (Fig. 6). Feature
Figure 6.
Feature analysis using the Kruskal-Wallis mean-rank test. Bars bordered with circles represent the UPDRS-gait severity level under which a symptom is examined.
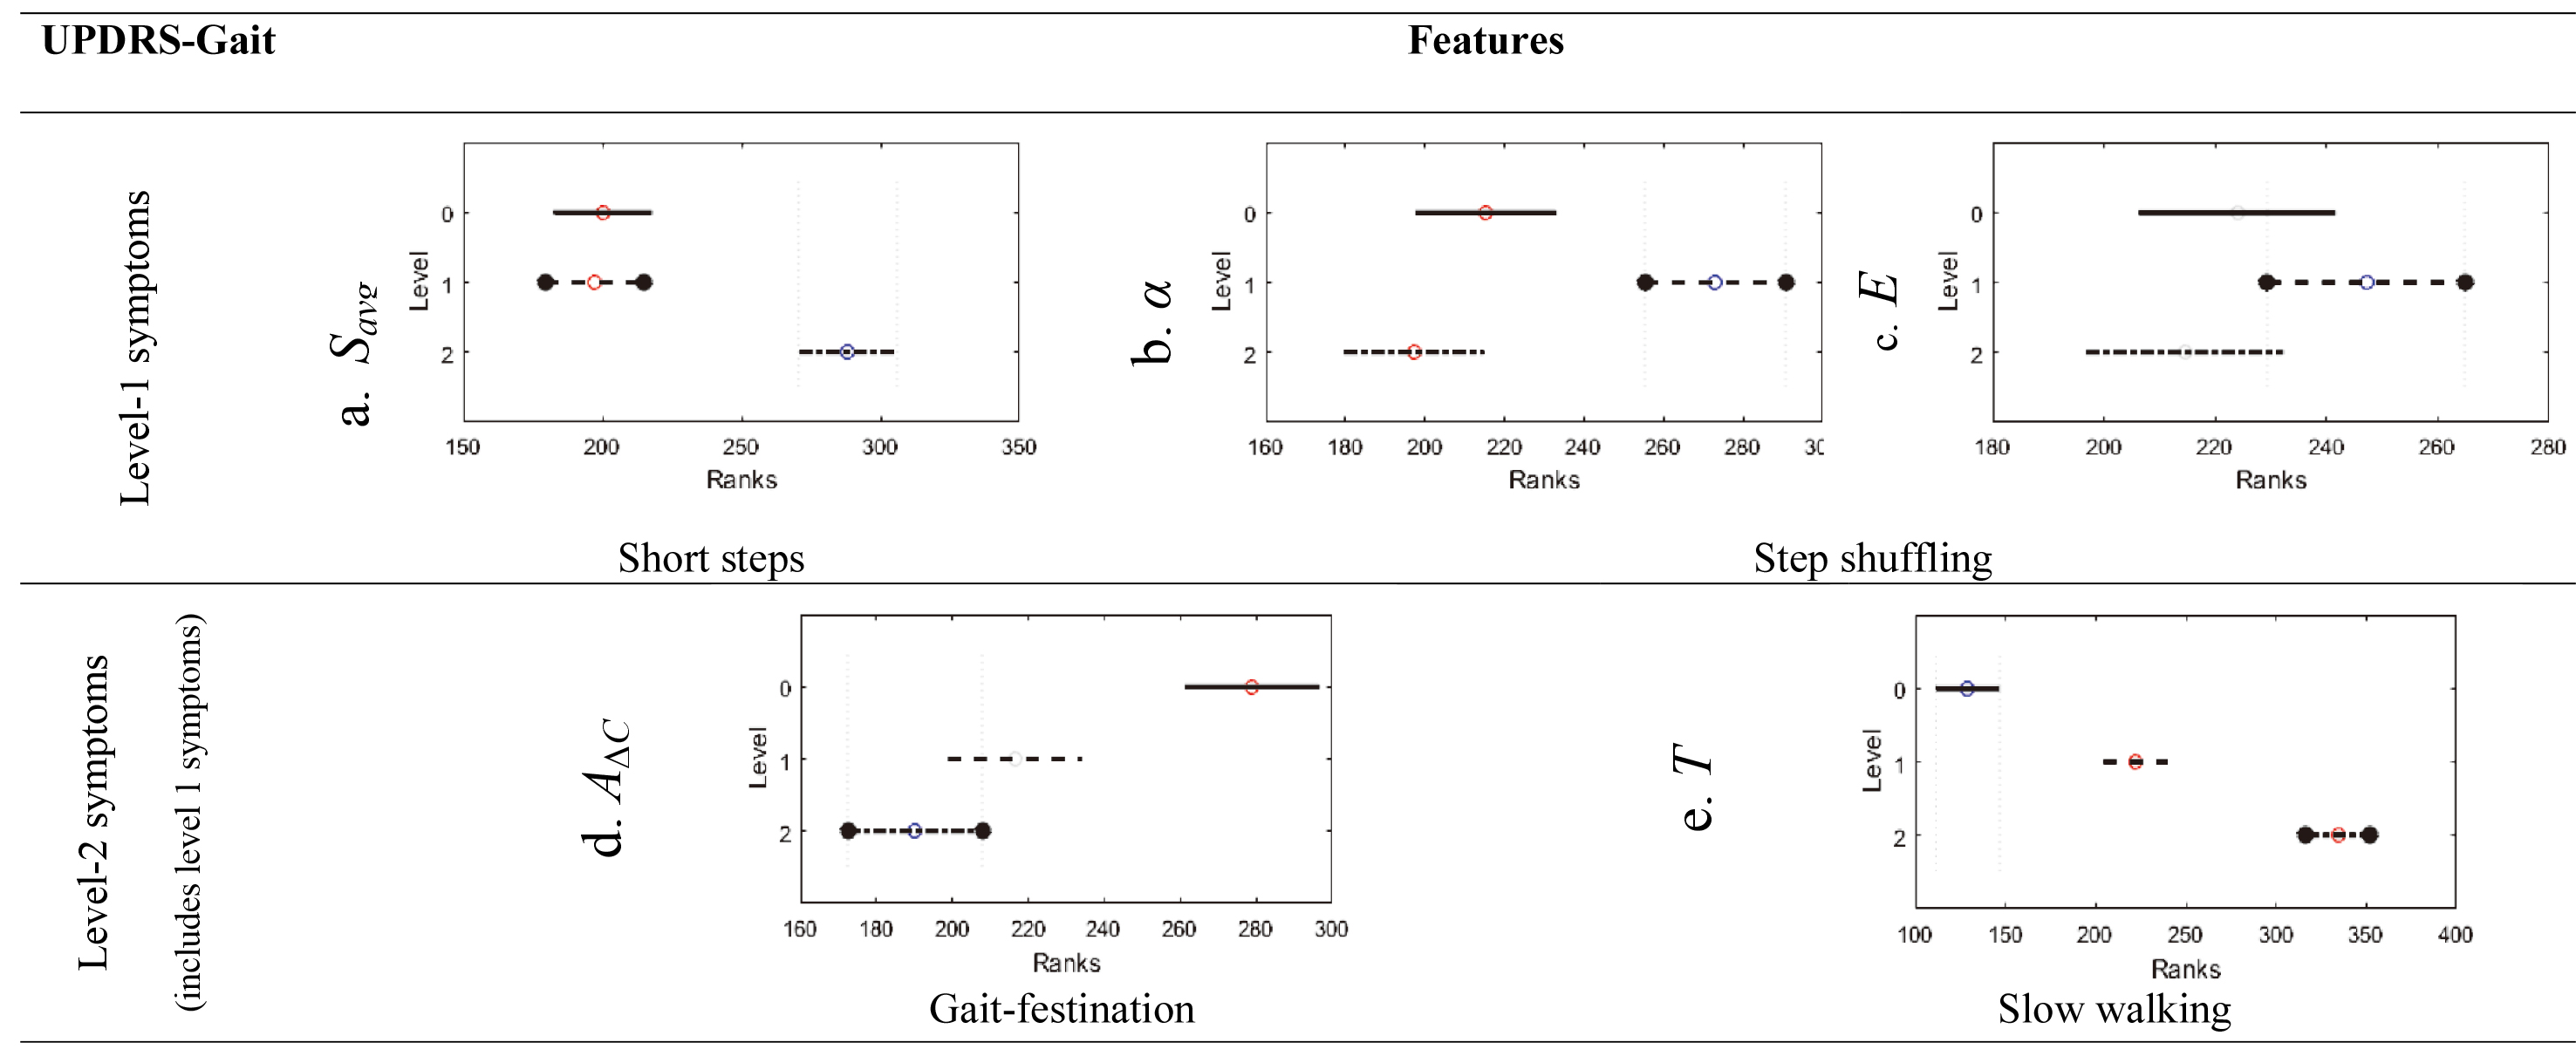
Features
Feature
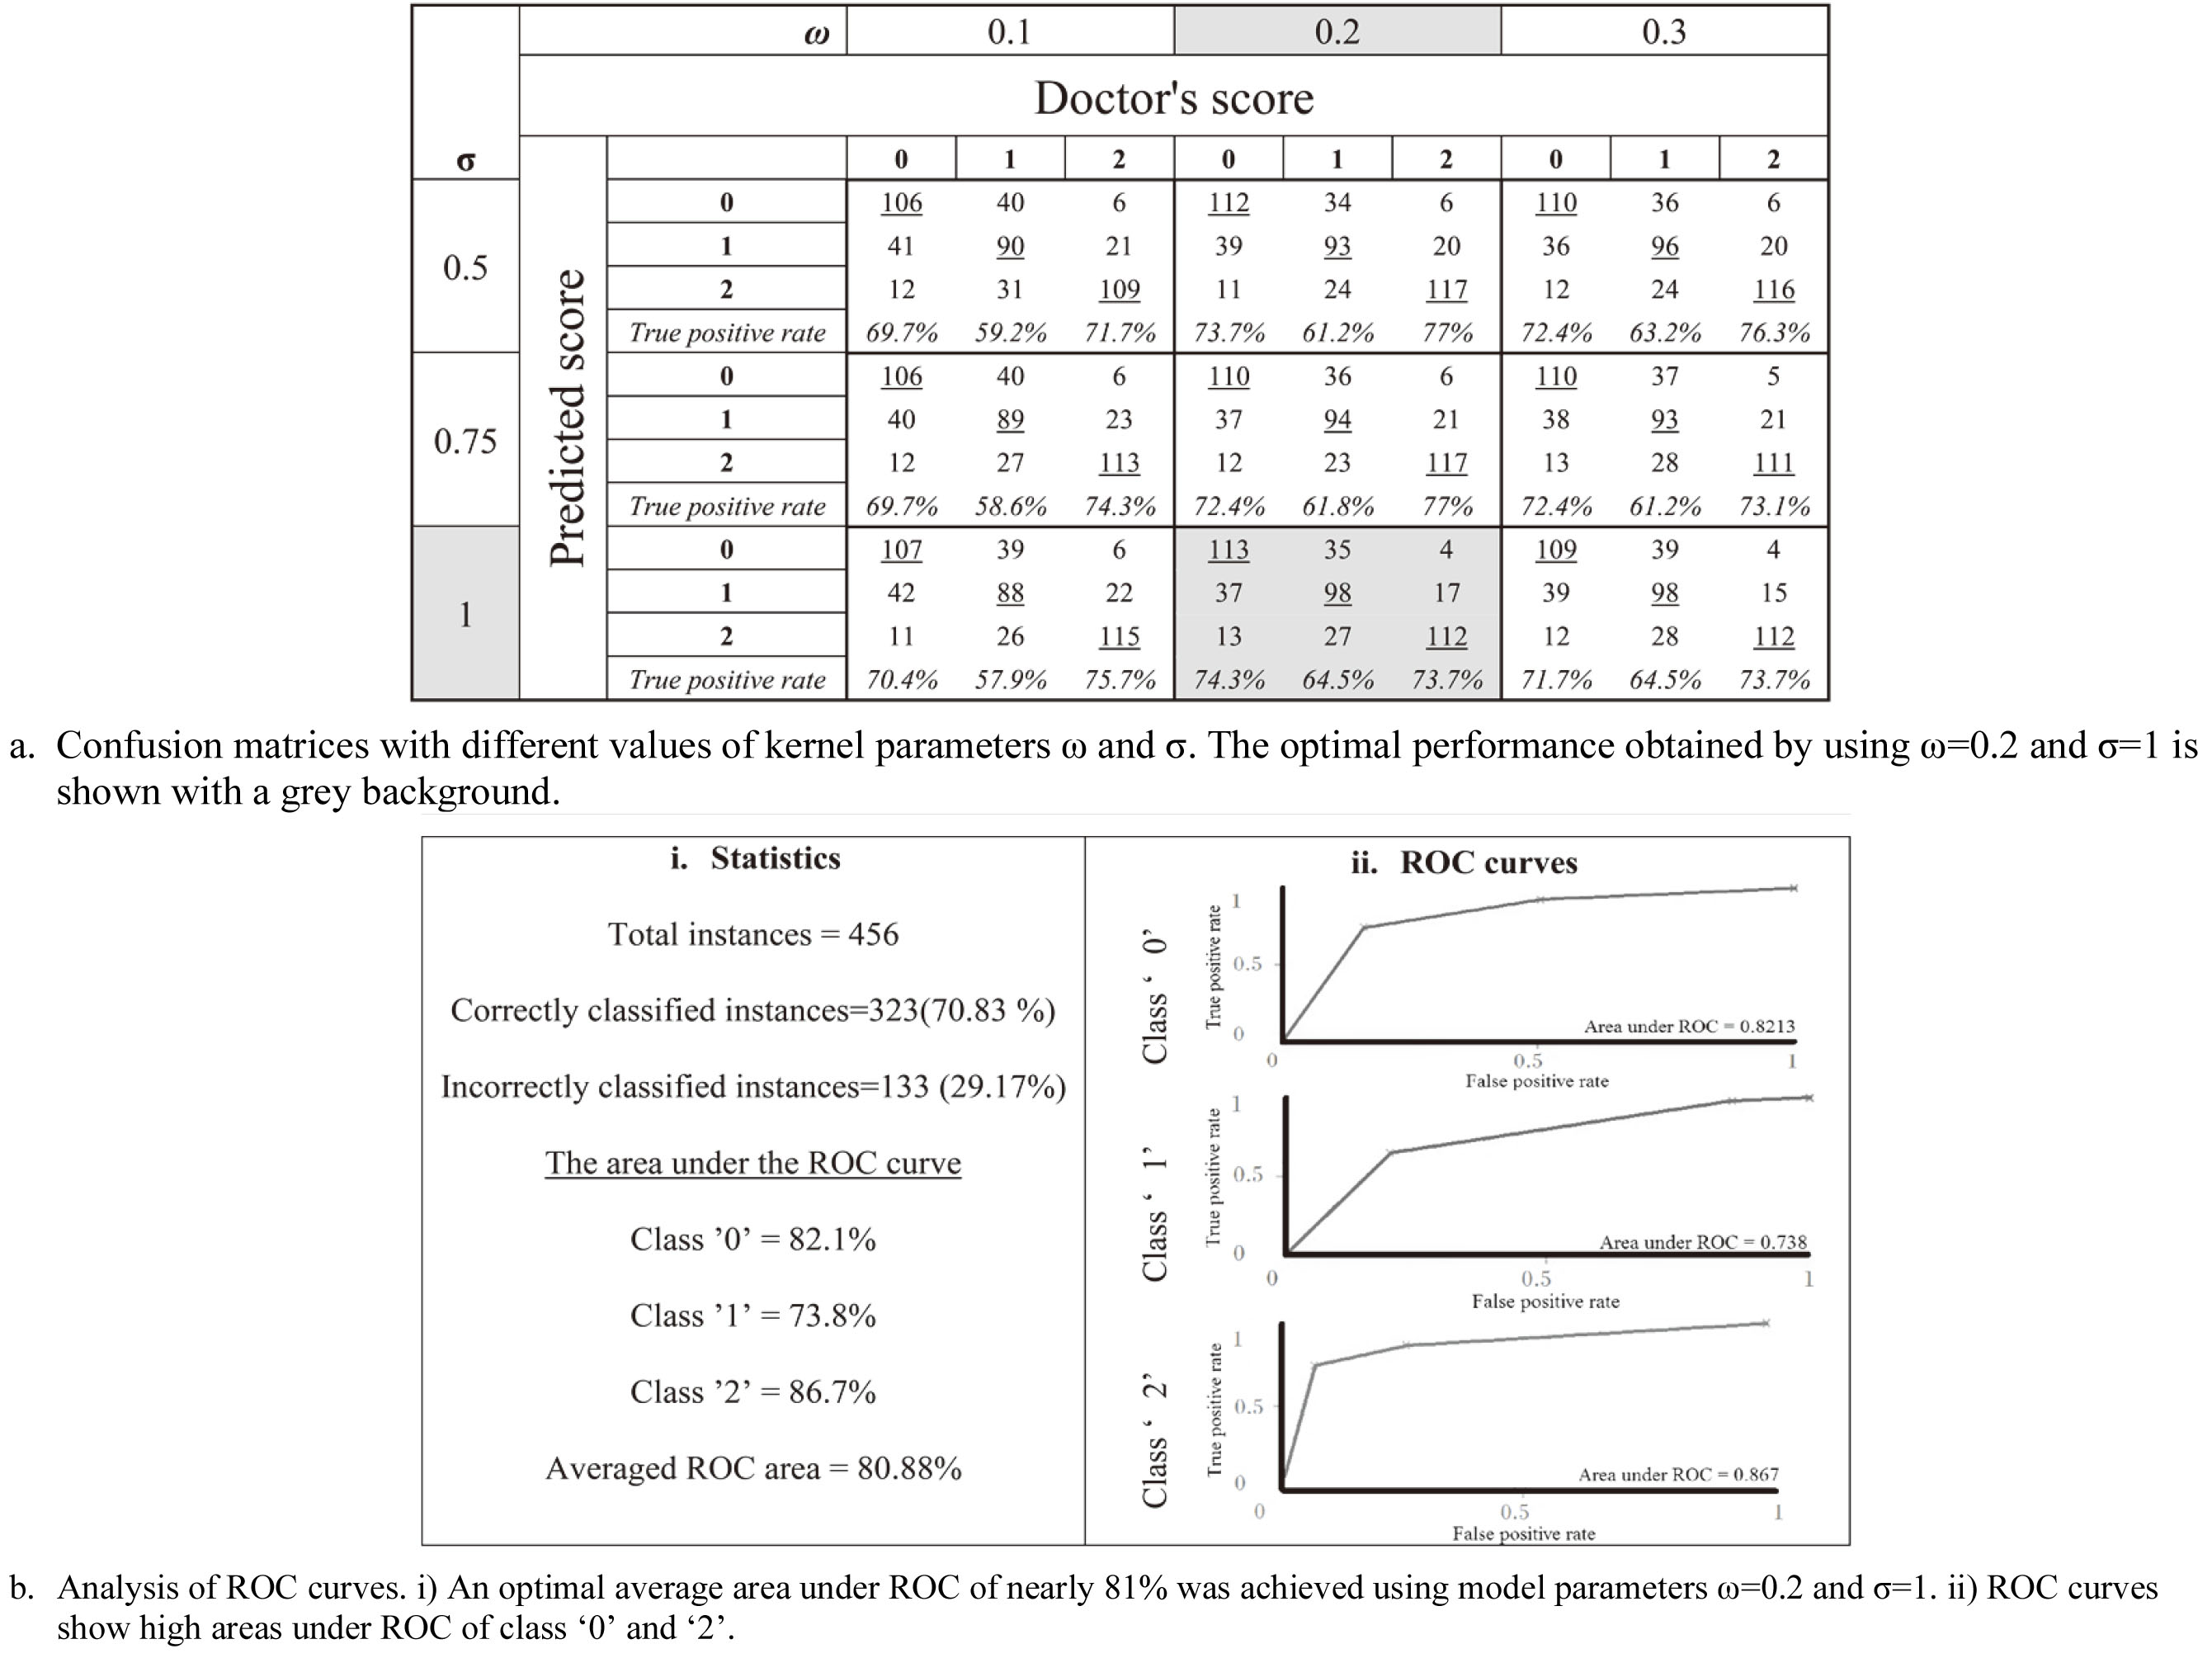
The SVM model trained using these features and tuned using model parameters (
Figure 7.
Classification performance of the SVM model.
4.Conclusions
We introduced a new method of Parkinson’s gait assessment using front-view video analysis. The method computes the varying height of the human silhouette in video frames and quantizes the height signal to estimate temporal gait features. Important features significantly (
Recent work based on Kinect sensors [18] supports that front-view analysis saves space for gait assessment compared to side-view that requires large space. However, Kinect sensors are not commonplace. By contrast, our methodology used an RGB-camera available in devices used in everyday life, facilitating gait assessment in narrow corridors at home with no specialised equipment. Moreover, the algorithm is a low-cost alternative to motion capture systems for PG assessment, such as [19], that requires advanced equipment and a controlled environment.
In conclusion, the proposed SVM model and features accurately characterized the severity of gait impairment according to UPDRS standards without requiring complicated lab settings and the need for physical attachment of body markers and sensors. The excellent accuracy obtained in the classification of UPDRS-gait severity levels and importantly, the significant ability of features to characterize the severity, suggest that the model can be used for clinical evaluation in non-laboratory settings, can support in tracking gait symptoms and help in treatment interventions.
Future work includes optimizing the framework by incorporating biomechanics such as leg joints, angles, hand movements, etc. made possible by recording videos at higher speed and resolution. The study could be expanded to examine gait problems in other neurological disorders such as Huntington’s disease, neuropathy, or rehabilitation after lower limb surgeries. Also, deep learning can be used for model development by recording a larger dataset of gait videos for training the classifier. We plan to integrate the proposed method to a test battery system [20] that allows telemonitoring of activities of daily living of patients to enable an overall PD assessment.
Conflict of interest
None to report.
References
[1] | Nieuwboer A. Freezing of gait: problem analysis and rehabilitation strategies. Parkinsonism & Related Disorders. (2006) Oct 1; 12: : S53–4. doi: 10.1016/j.parkreldis.2006.05.016. |
[2] | Fahn SR. Unified Parkinson’s disease rating scale. Recent Development in Parkinson’s Disease. (1987) ; 2: : 293–304. |
[3] | Afentou N, Jarl J, Gerdtham UG, Saha S. Economic evaluation of interventions in Parkinson’s disease: a systematic literature review. Movement Disorders Clinical Practice. (2019) Apr; 6: (4): 282–90. doi: 10.1002/mdc3.12755. |
[4] | Tan D, Pua YH, Balakrishnan S, Scully A, Bower KJ, Prakash KM, Tan EK, Chew JS, Poh E, Tan SB, Clark RA. Automated analysis of gait and modified timed up and go using the Microsoft Kinect in people with Parkinson’s disease: associations with physical outcome measures. Medical & Biological Engineering & Computing. (2019) Feb 13; 57: (2): 369–77. doi: 10.1007/s11517-018-1868-2. |
[5] | Stricker M, Hinde D, Rolland A, Salzman N, Watson A, Almonroeder TG. Quantifying step length using two-dimensional video in individuals with Parkinson’s disease. Physiotherapy Theory and Practice. (2019) Mar 21: 1–4. doi: 10.1080/09593985.2019.1594472. |
[6] | Verlekar TT, De Vroey H, Claeys K, Hallez H, Soares LD, Correia PL. Estimation and validation of temporal gait features using a markerless 2D video system. Computer Methods and Programs in Biomedicine. (2019) Jul 1; 175: : 45–51. doi: 10.1016/j.cmpb.2019.04.002. |
[7] | Nonnekes J, Snijders AH, Nutt JG, Deuschl G, Giladi N, Bloem BR. Freezing of gait: a practical approach to management. The Lancet Neurology. (2015) Jul 1; 14: (7): 768–78. doi: 10.1016/S1474-4422(15)00041-1. |
[8] | Nyholm D, Remahl AN, Dizdar N, Constantinescu R, Holmberg B, Jansson R, Aquilonius SM, Askmark H. Duodenal levodopa infusion monotherapy vs oral polypharmacy in advanced Parkinson disease. Neurology. (2005) Jan 25; 64: (2): 216–23. doi: 10.1212/01.WNL.0000149637.70961.4C. |
[9] | Dalal N, Triggs B. Histograms of oriented gradients for human detection. In 2005 IEEe Computer Society Conference on Computer Vision and Pattern Recognition (CVPR’05). IEEE. Vol. 1, (2005) Jun 20; pp. 886–893. doi: 10.1109/CVPR.2005.177. |
[10] | Papageorgiou C, Poggio T. A trainable system for object detection. International Journal of Computer Vision. (2000) Jun 1; 38: (1): 15–33. doi: 10.1023/A:1008162616689. |
[11] | Tafazzoli F, Safabakhsh R. Model-based human gait recognition using leg and arm movements. Engineering Applications of Artificial Intelligence. (2010) Dec 1; 23: (8): 1237–46. doi: 10.1016/j.engappai.2010.07.004. |
[12] | Turk MA, Pentland AP. Face recognition using eigenfaces. In Proceedings. 1991 IEEE Computer Society Conference on Computer Vision and Pattern Recognition. IEEE Computer Society. (1991) Jan 1; pp. 586–587. |
[13] | Lloyd S. Least squares quantization in PCM. IEEE Transactions on Information Theory. (1982) Mar; 28: (2): 129–37. doi: 10.1109/TIT.1982.1056489. |
[14] | Kantelhardt JW, Koscielny-Bunde E, Rego HH, Havlin S, Bunde A. Detecting long-range correlations with detrended fluctuation analysis. Physica A: Statistical Mechanics and its Applications. (2001) Jun 15; 295: (3–4): 441–54. doi: 10.1016/S0378-4371(01)00144-3. |
[15] | Breslow N. A generalized Kruskal-Wallis test for comparing K samples subject to unequal patterns of censorship. Biometrika. (1970) Dec 1; 57: (3): 579–94. doi: 10.1093/biomet/57.3.579. |
[16] | Schölkopf B, Platt JC, Shawe-Taylor J, Smola AJ, Williamson RC. Estimating the support of a high-dimensional distribution. Neural Computation. (2001) Jul 1; 13: (7): 1443–71. doi: 10.1162/089976601750264965. |
[17] | Üstün B, Melssen WJ, Buydens LM. Facilitating the application of support vector regression by using a universal Pearson VII function based kernel. Chemometrics and Intelligent Laboratory Systems. (2006) Mar 1; 81: (1): 29–40. doi: 10.1016/j.chemolab.2005.09.003. |
[18] | Sheshadri MG, Okade M. Kinect based Frontal Gait Recognition using skeleton and depth derived features. In 2020 National Conference on Communications (NCC). IEEE. (2020) Feb 21; pp. 1–5. doi: 10.1109/NCC48643.2020.9056001. |
[19] | Pistacchi M, Gioulis M, Sanson F, De Giovannini E, Filippi G, Rossetto F, Marsala SZ. Gait analysis and clinical correlations in early Parkinson’s disease. Functional Neurology. (2017) Jan; 32: (1): 28. doi: 10.11138/FNeur/2017.32.1.028. |
[20] | Westin J, Dougherty M, Nyholm D, Groth T. A home environment test battery for status assessment in patients with advanced Parkinson’s disease. Computer Methods and Programs in Biomedicine. (2010) Apr 1; 98: (1): 27–35. doi: 10.1016/j.cmpb.2009.08.001. |


