
Design of liver functional reserve monitor based on three-wavelength from red light to IR
Abstract
BACKGROUND:
The preoperative evaluation of liver functional reserve is very important to determine the excision of liver lobe for the patients with liver cancer. There already exist many effective evaluation methods, but these ones have many disadvantages such as large trauma, complicated process and so on.
OBJECTIVE:
Therefore, it is essential to develop a fast, accurate and simple detection method of liver functional reserve for the practical application in the clinical engineering field.
METHODS:
According to the principle of spectrophotometry, this paper proposes a detection method of liver functional reserve based on three-wavelength from red light to infrared light (IR), in which the artery pulse, the vein pulse and the move of tissue are taken into account.
RESULTS:
By using photoelectric sensor technology and excreting experiment of indocyanine green, a minimally invasive, fast and simple testing equipment is designed in this paper.
CONCLUSIONS:
The testing result shows this equipment can greatly reduce the interference from human body and ambient, realize continuous and real-time detection of arterial degree of blood oxygen saturation and liver functional reserve.
1.Introduction
The evaluation of liver functional reserve is an important technical assurance before performing liver resection operations, which is one of the core problems of hepatic surgery [1, 2]. By the proper evaluation of liver functional reserve, the surgeons can accurately master the cutting quantity of liver, and avoid the hepatic failure after operation [3]. The existing evaluation methods of liver reserve ability include Child-Pugh grading standard, excretion test of ICG (indocyanine green), CT volume computing method and so on. In this present paper, the ICG excretion test is adopted. The ICG is a kind of dark green dye [4, 5]. After injecting ICG into veins, the serum protein will bind with it, and then be taken selectively by the liver. In free state form, the protein binding with ICG will be secreted to the cholecyst, not taking part in the circulation of intestines and liver [6, 7, 8]. The ICG is excreted without passing through the kidney. By ICG clearance measurements, some related liver function analyzers, such as Nihon Kohden DDG-3300k, Pulsion Limon, have serviced the patients for years. The method they adopted is PDD (Pulse Dye Densitometry) whose principle is as follow: When there exist two different absorptiometic matters in blood, the concentration ratio of these two matters can be determined by the transmission of light pulse acquired through using two different wavelengths of near infrared light to irradiate the issues [9, 10]. Compared with the traditional spectrophotometric methods, the existing systems that adopted PDD do not need any venipunctures except for the intravenous injection of ICG, which is convenient and painless for patients [11]. Besides, the ICG clearance is the most sensitive and earliest indicator that can reflect the liver function, and the dynamic variation of liver function can be observed in real time [12]. However, due to the testing principle based on two-wavelength near-infrared light, the slight shake of tested part such as finger, nose, will lead to an inaccurate result. If the ICG testing result is very high (
Degree of blood oxygen saturation is an important indicator for judging whether the respiratory system and circulating system are in anaerobic status, and this parameter is very meaningful in the clinical medicine field [14, 15]. The blood oxygen monitor acquires the pulse signal by gathering the transmission light through the human tissue, and gives the pulse blood oxygen information in real time [8]. The pulse signal, whose period is not always equal, is a kind of quasi-periodic signal, which means the pulse waveform is not strictly equal [16]. So, it is meaningful for the daily monitor how to acquire and process the pulse signal accurately and effectively [17].
The principle of the detector designed in this paper is based on pulse dye density spectrophotometric method, which is improved on the pulse blood oxygen spectrophotometric method [18]. In our research, the microcomputer and photoelectric sensor technologies are combined. One end of the detector is formed with light source driving circuit and three light-emitting diodes (
(1)
Where,
It can be seen from the formulas above there are four parameters SaO
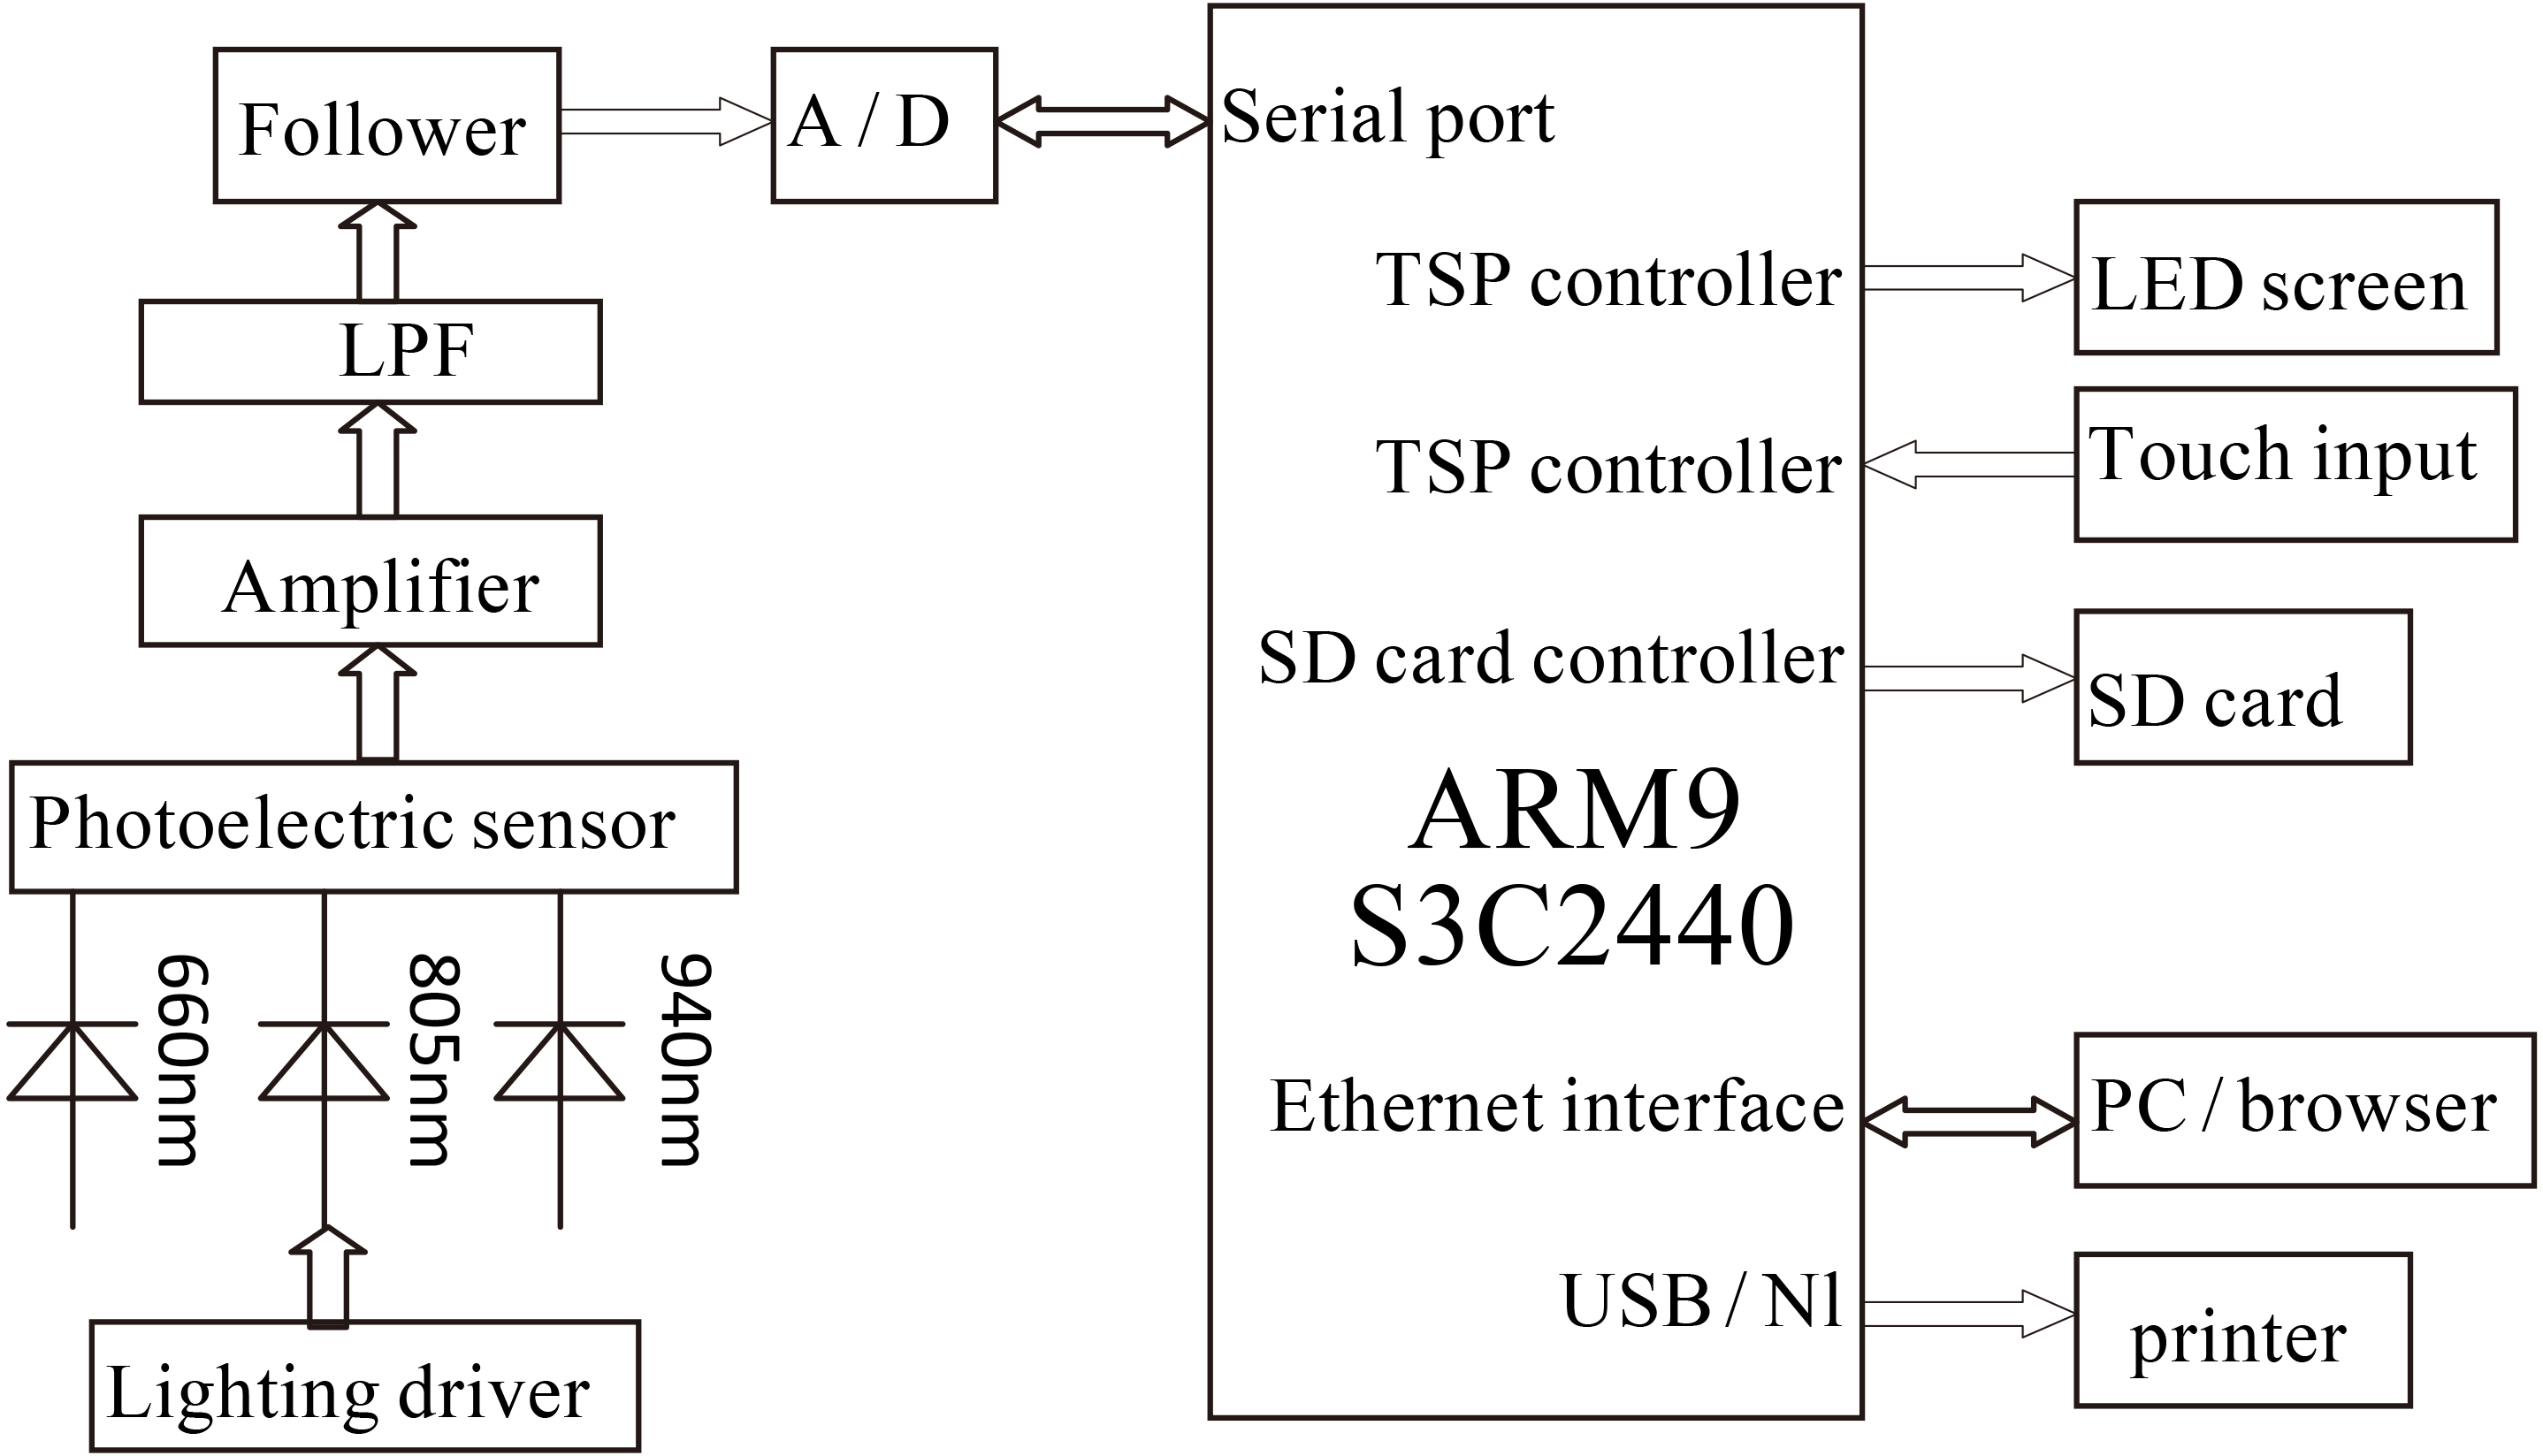
A finger-style pulse blood oxygen detection system is designed in this paper. The photoelectric sensor POT101 and ARM9 S3C2440 are used to acquire and process the signal. The whole functional diagram of the system is shown in Fig. 1.
Figure 1.
Functional diagram of acquisition and processing system for pulse blood oxygen signal and ICG concentration.
2.Design of hardware system
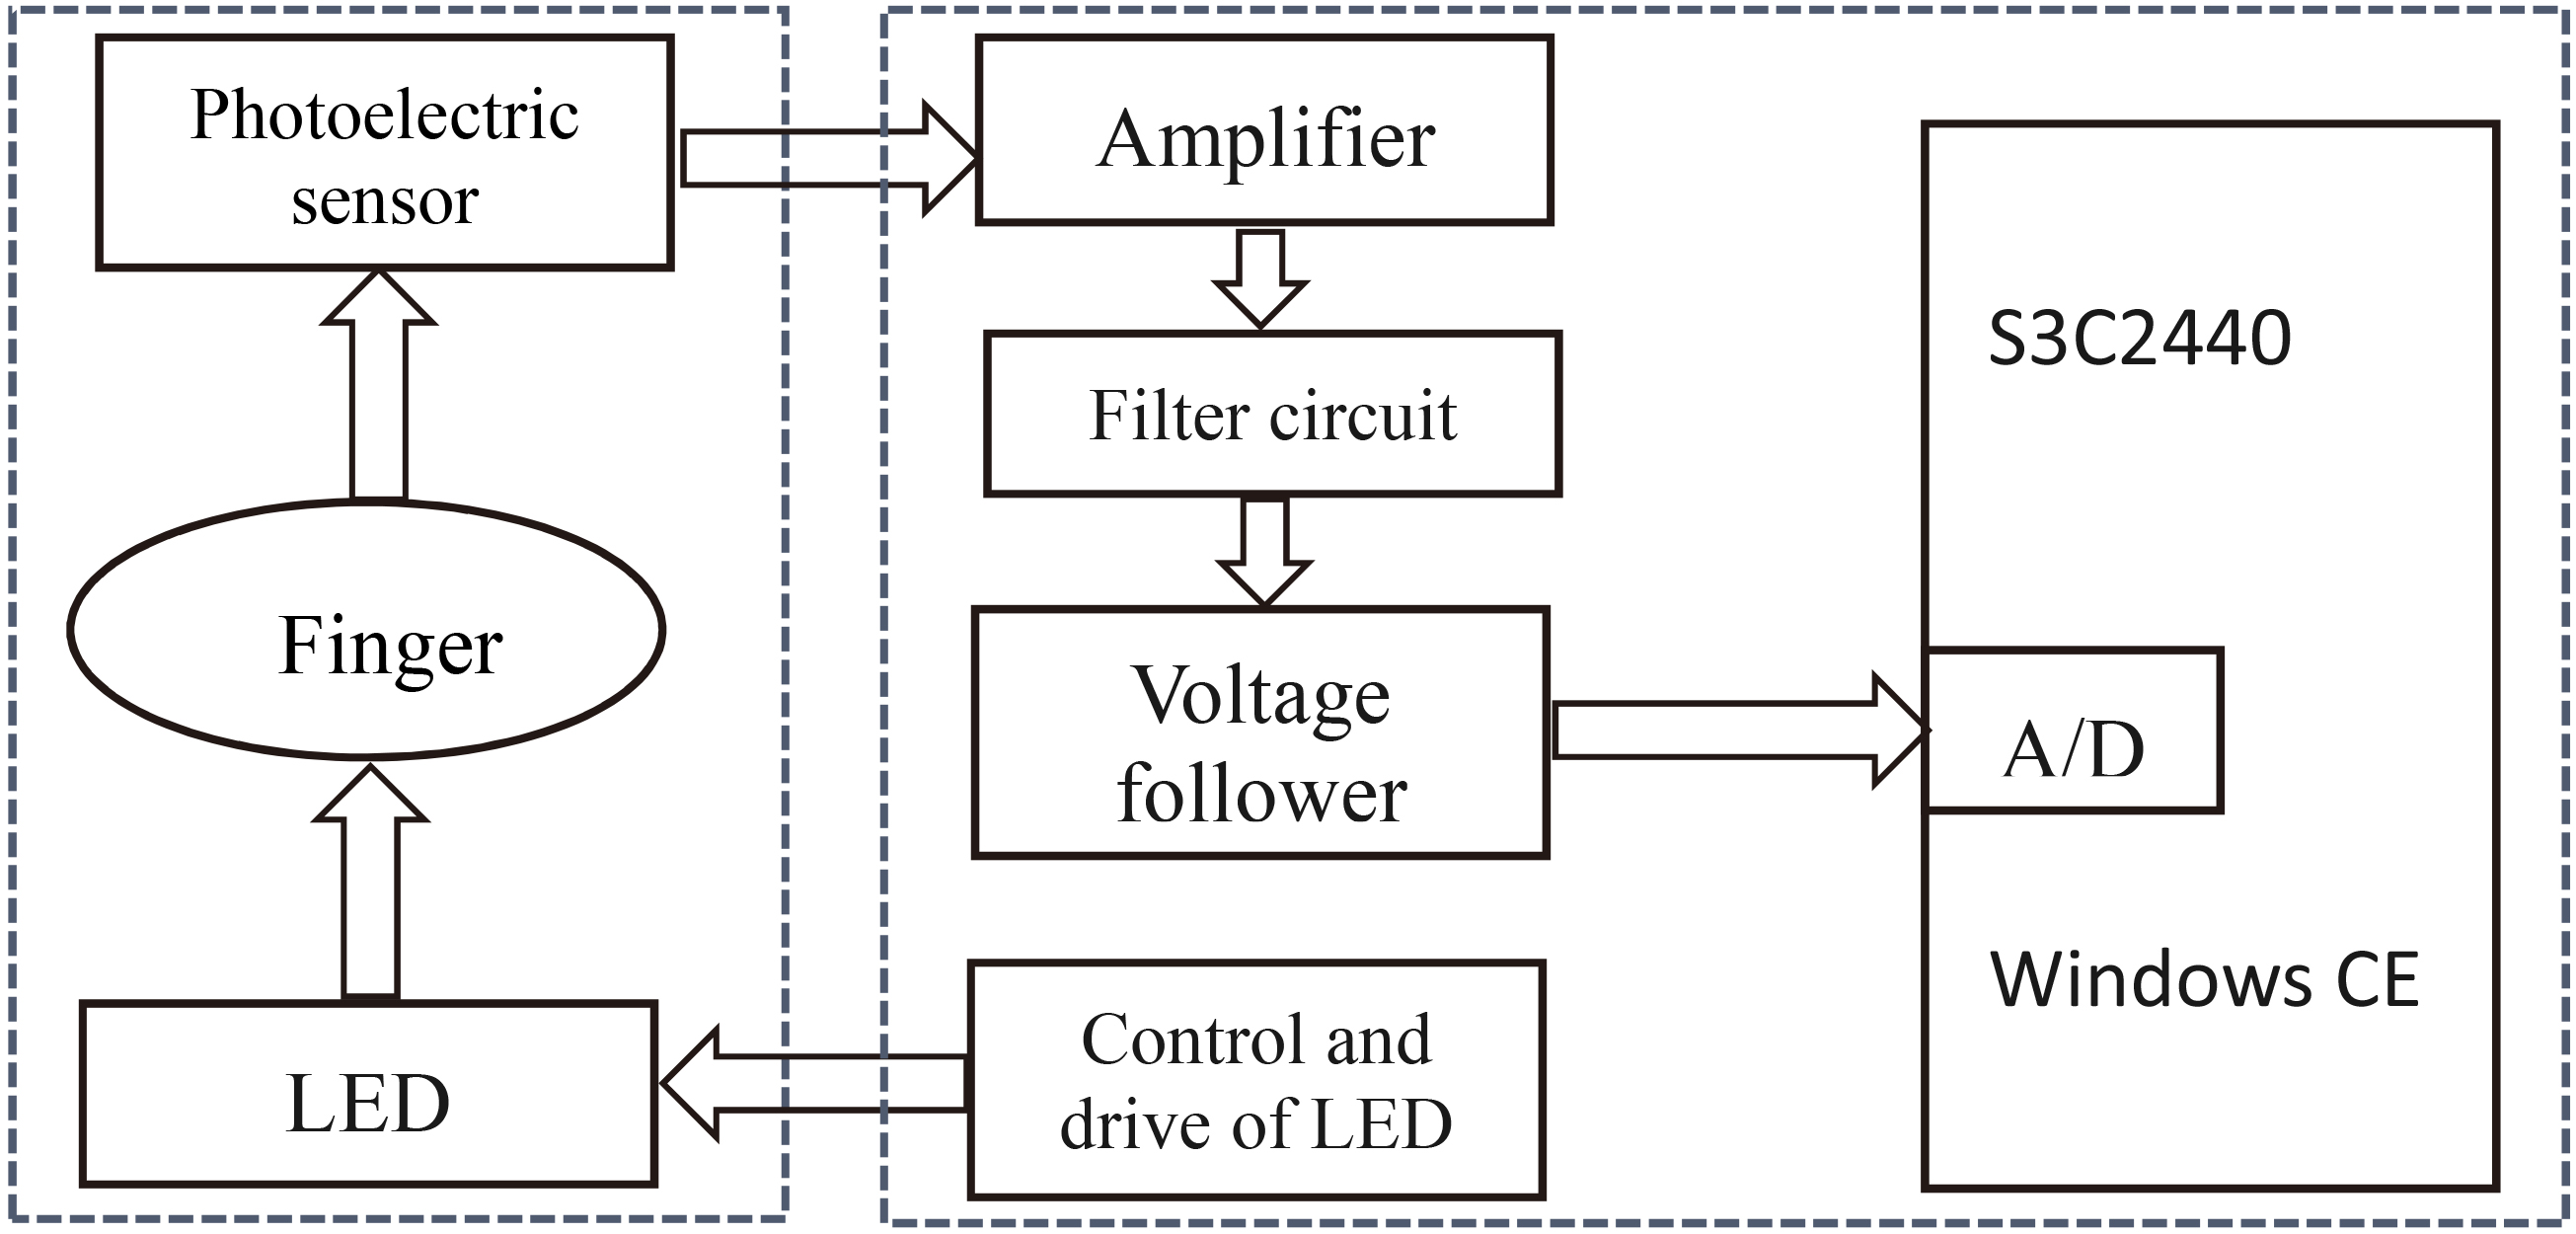
The hardware system is mainly composed of two modules, signal acquisition unit and mainframe circuit unit (Fig. 2). The signal acquisition unit is made of the LED and photoelectric sensor that distribute at the two sides of finger respectively. The mainframe circuit unit is made of S3C2440, LED sequential drive and control circuit, amplifier, filtering circuit and voltage follower.
Figure 2.
Structure diagram of hardware system.
2.1Signal acquisition unit
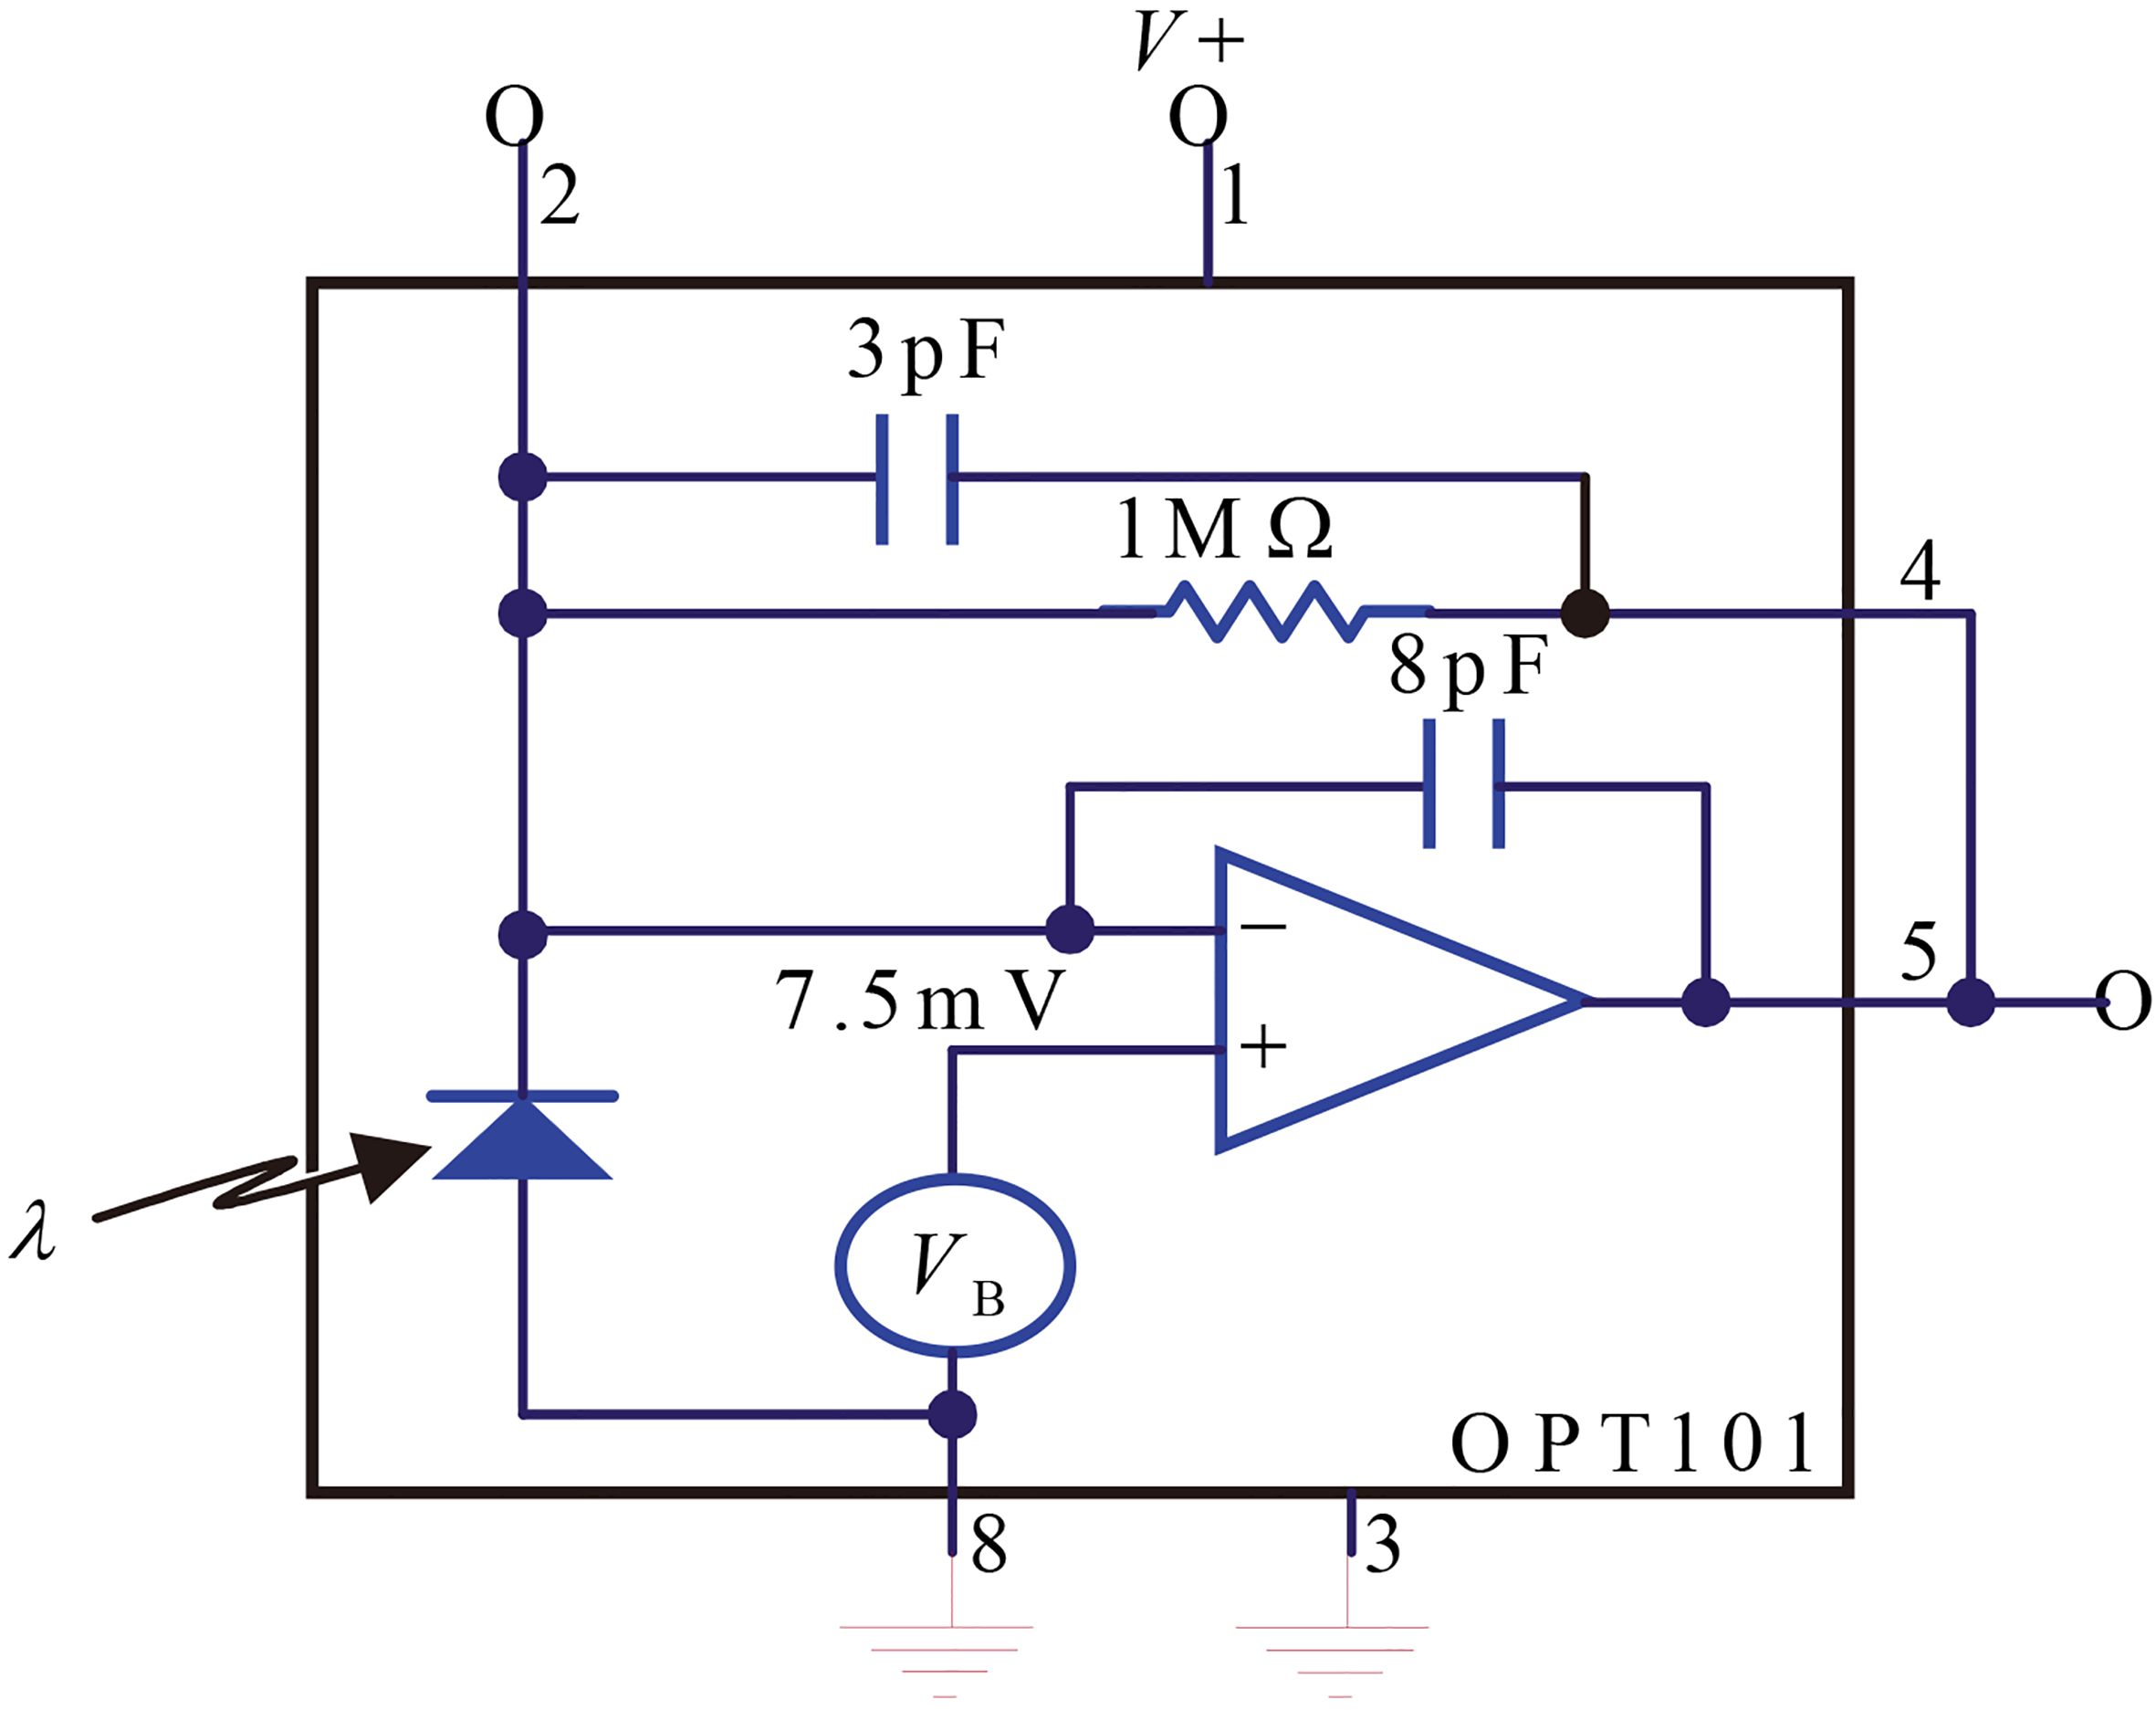
The choice of light sources is the chip L660/802/940-35B42 made by Epitex Company. In this chip, there are three light sources whose wavelengths are 660 nm, 805 nm and 940 nm respectively, which reduces the dimension of signal acquisition unit greatly, and ensures the accordance of reception scope of three-wavelength light sources with photoelectric sensors. The choice of photoelectric sensor is OPT101 made by BB Company (Fig. 3). This chip gets the photoelectric sensor and pre-amplifier integrated, and avoids the problems that usually happen in the separate design such as leakage current error, noise cross interference, gain peaking caused by the stray capacitances and so on. It is speedy for the chip to convert the optical signal to the electrical signal.
Figure 3.
Structure principle of OPT101.
2.2Mainframe circuit unit
The mainframe circuit unit includes microprocessor S3C2440, LED sequential drive and control circuit, amplifier, filtering and following circuit. In the LED sequential circuit, 555 timer and CD4017 are adopted. The output of 555 timer is a kind of clock control signal whose frequency is 300 Hz, and the duty ratio is 1/2. The CD4017 outputs six routes of independent pulse signals whose frequency is 50 Hz and the duty ratio is 1/6. Because the different state of patients and the other interference factors, there are many noises will be created in the course of signals acquisition using photoelectric sensor PPT101. Therefore, we design two circuits, one is the reverse amplifying circuit whose gain is adjustable, the other is the low-pass filtering circuit. The signals pass through the voltage follower, and then access the S3C2440 A/D conversion.
3.Design of software system
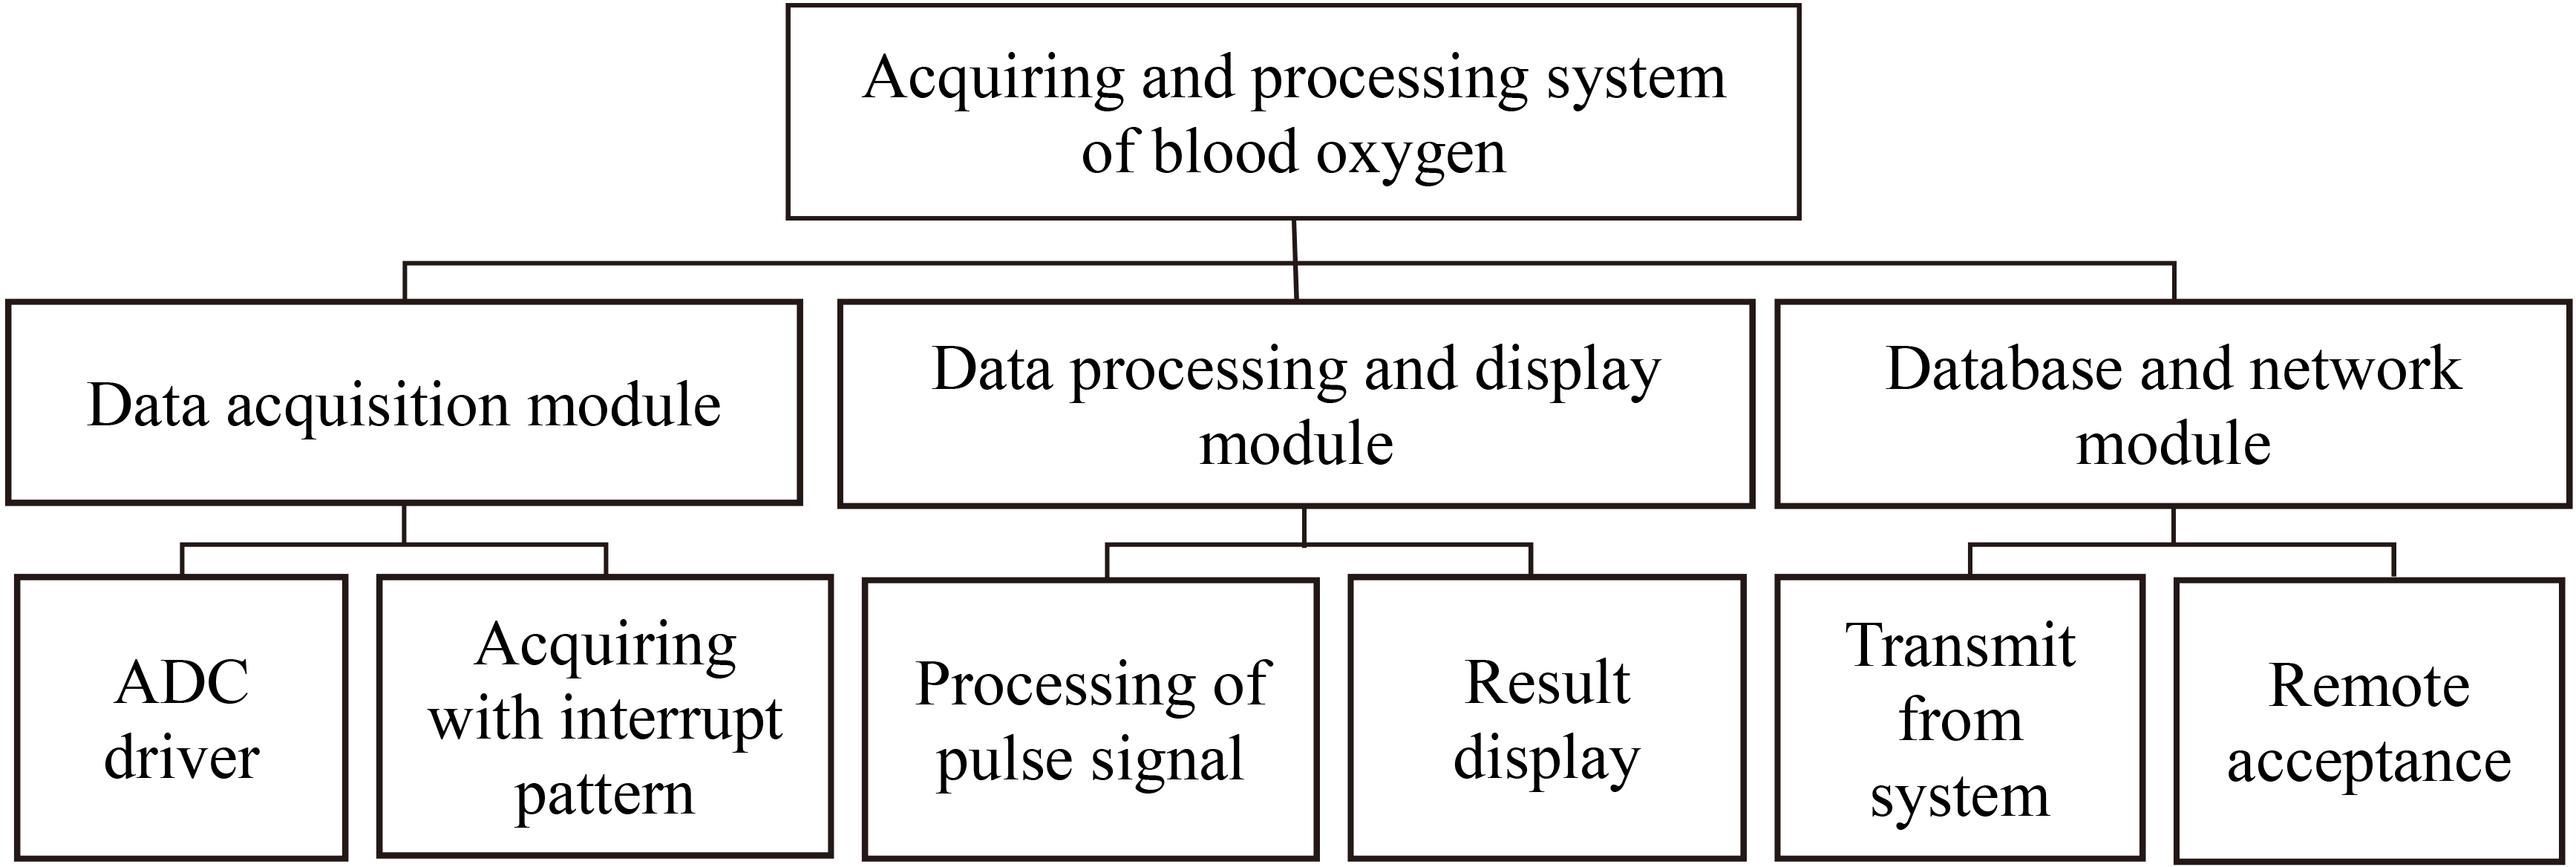
The software system designed with EVC runs under the environment Window CE5.0. The frame diagram of this system is shown in Fig. 4. It includes three modules: data acquisition module, data processing and display module, database and network module.
Figure 4.
Frame diagram of software system.
3.1Data acquisition module
In this system, the S3C2440 is adopted for the 10-bit A/D conversion, and the external pulse signal is brought in the ARM board by adopting the interrupt read module. When the external interruption is triggered with the high level, the corresponding ADC reading data channels are controlled by programs. The flow diagram of data acquisition is shown in Fig. 5.
Figure 5.
Flow diagram of data acquisition.
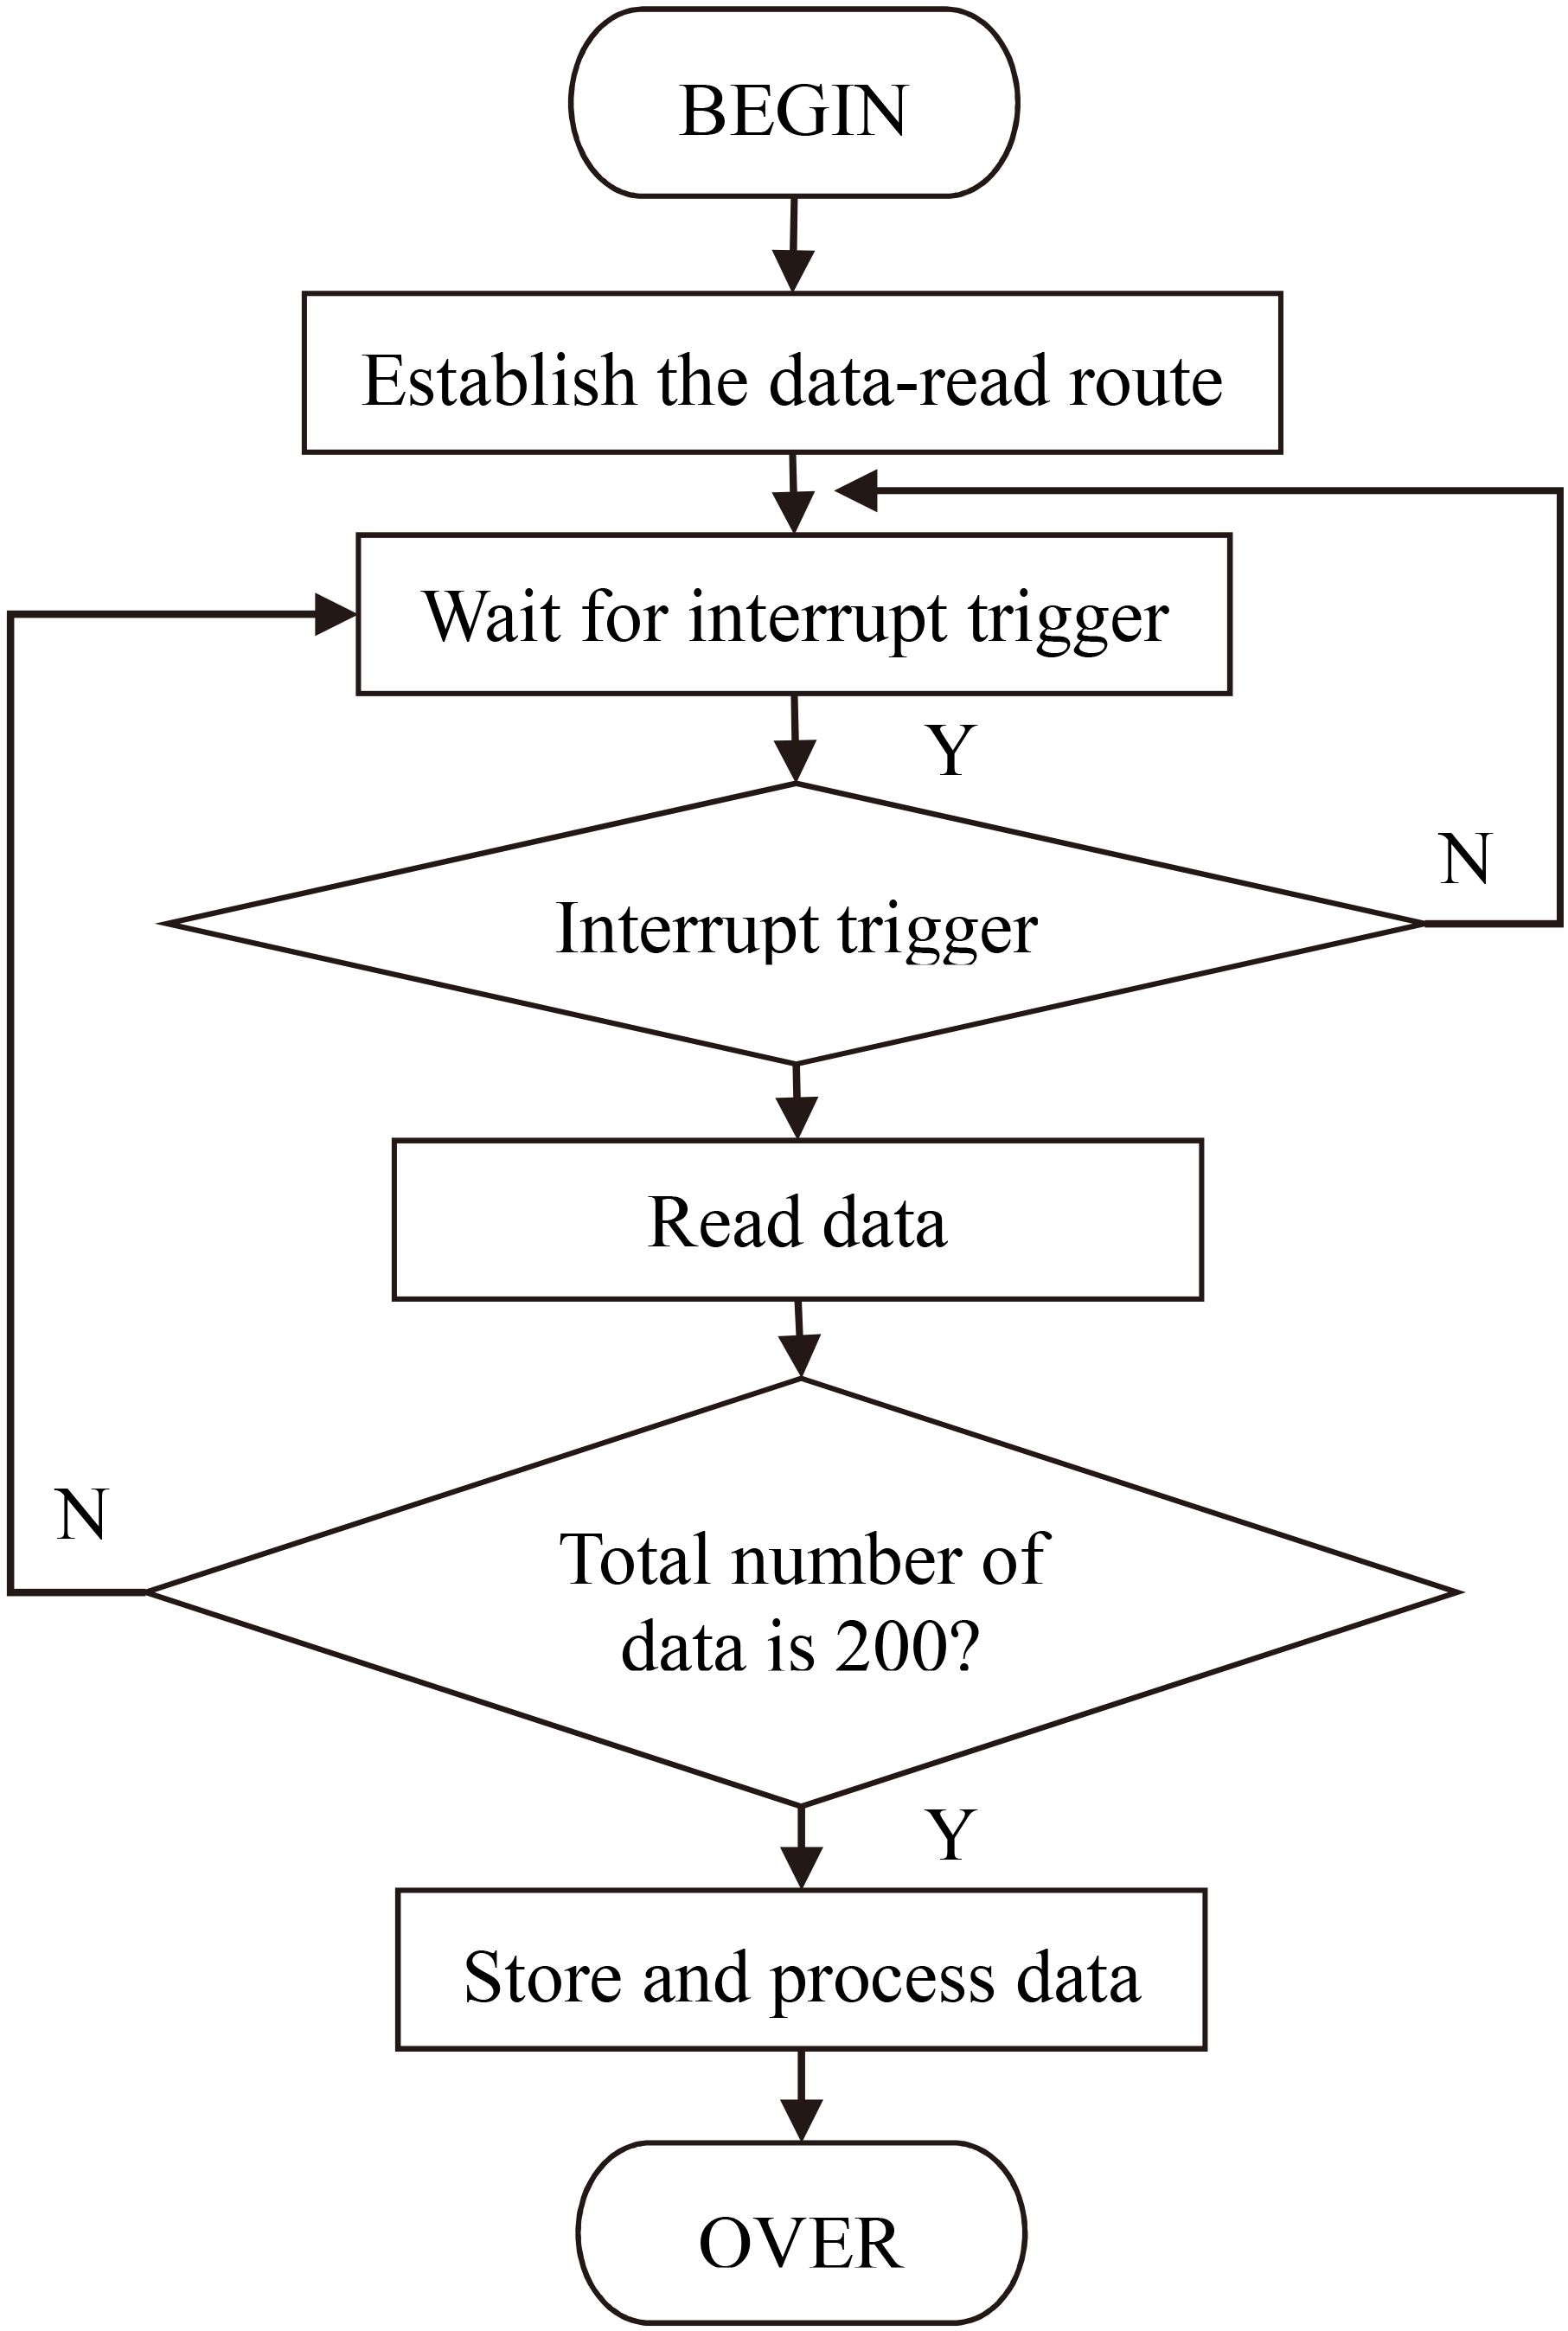
In the software design, the ADC drive program is adopted to sample. The work timing sequence of LED is controlled by interrupt service routine, and the data acquisition process is efficiently controlled in real time. The sampling frequency is set as 50 Hz (because of the time-share sample, the practical sampling frequency is 300 Hz), and the clock frequency is set as 300 Hz. The working time sequence of LED is shown in Fig. 6.
Figure 6.
Working time sequence of LED.
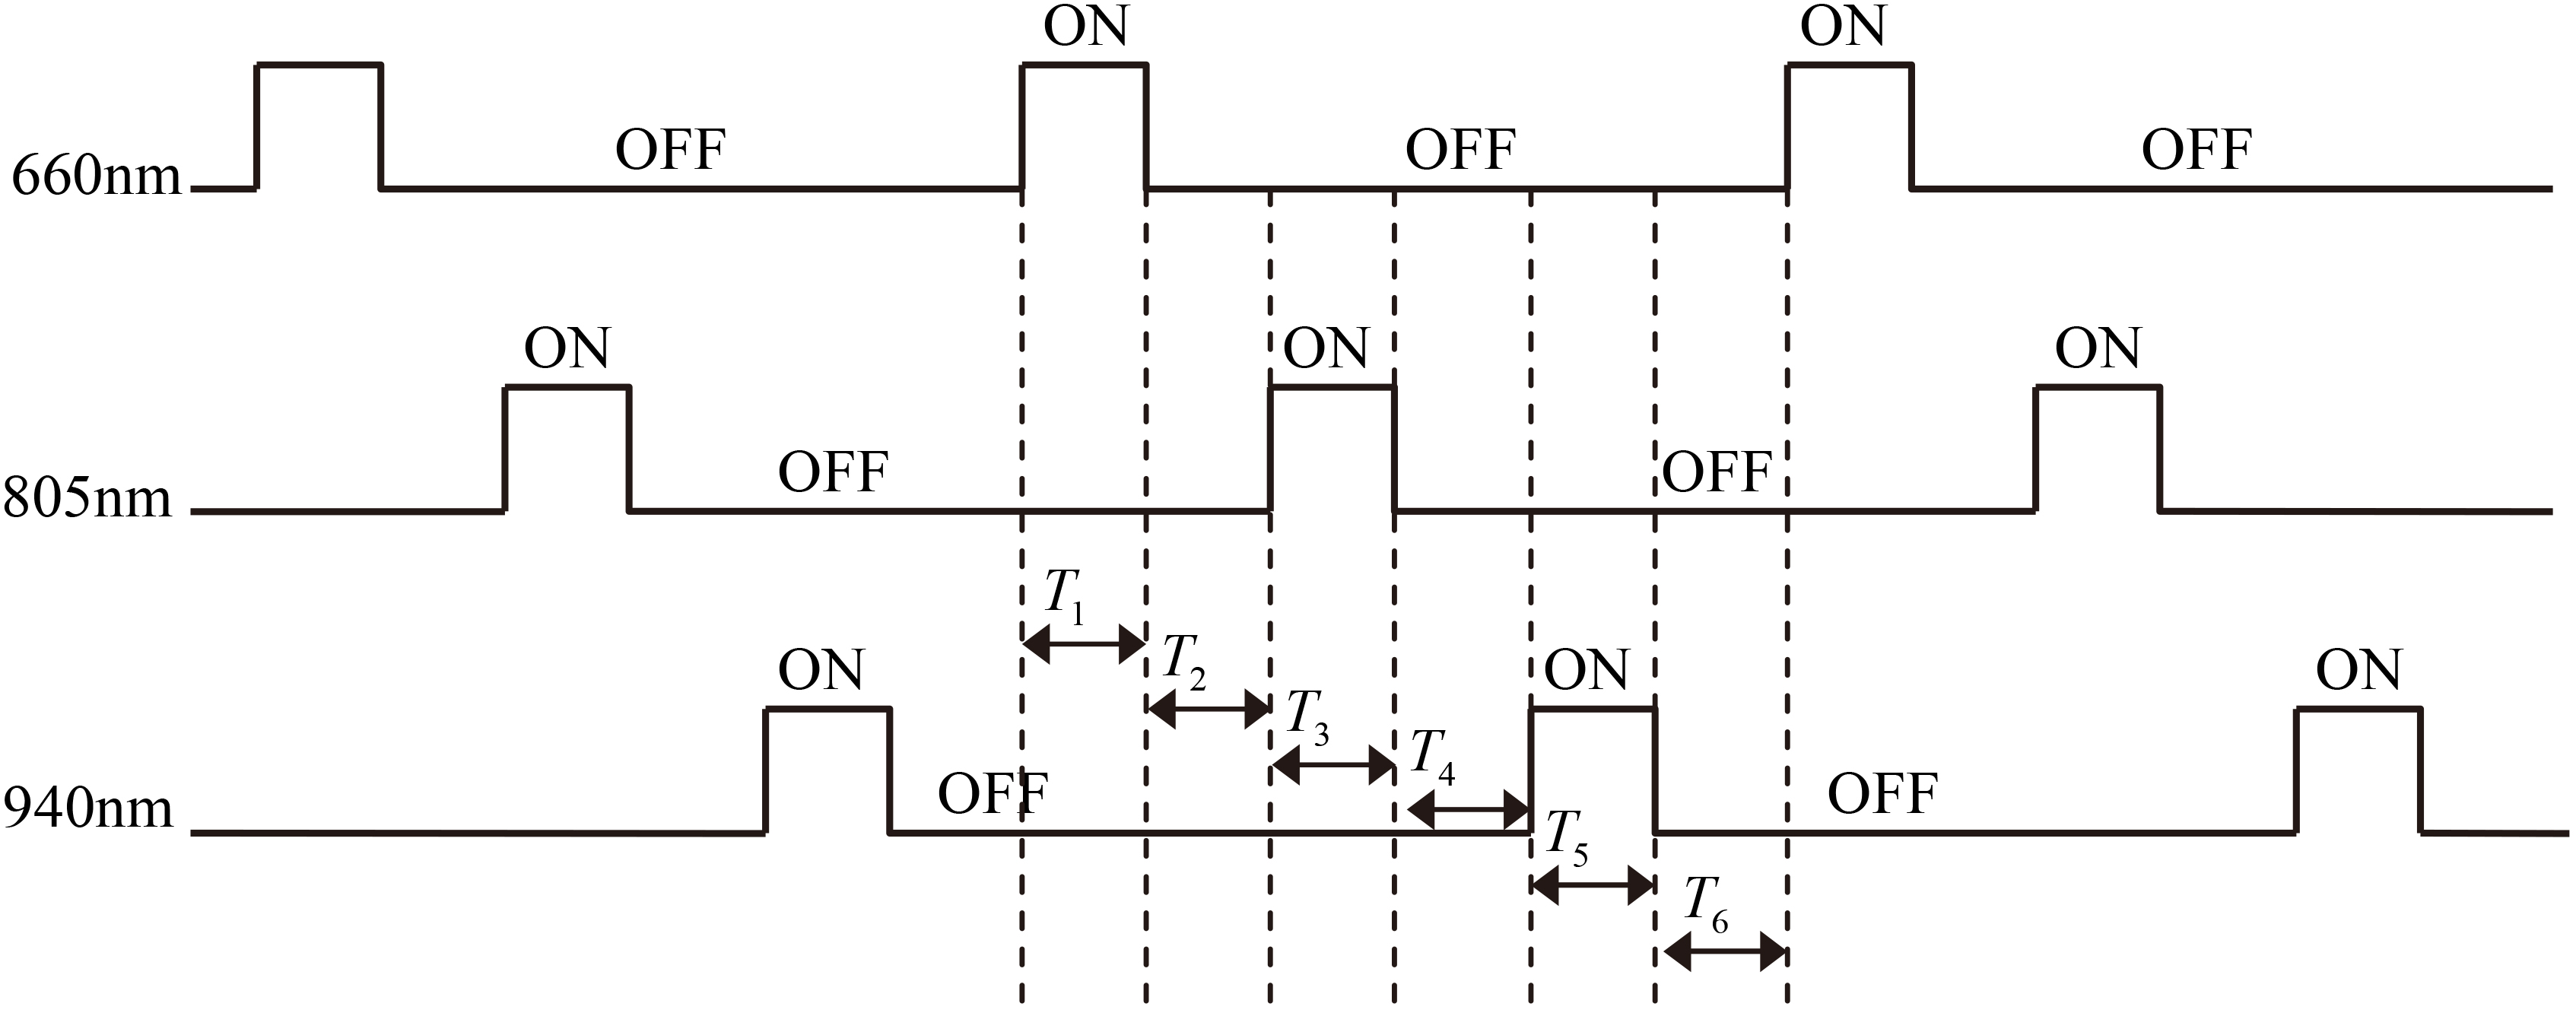
Figure 7.
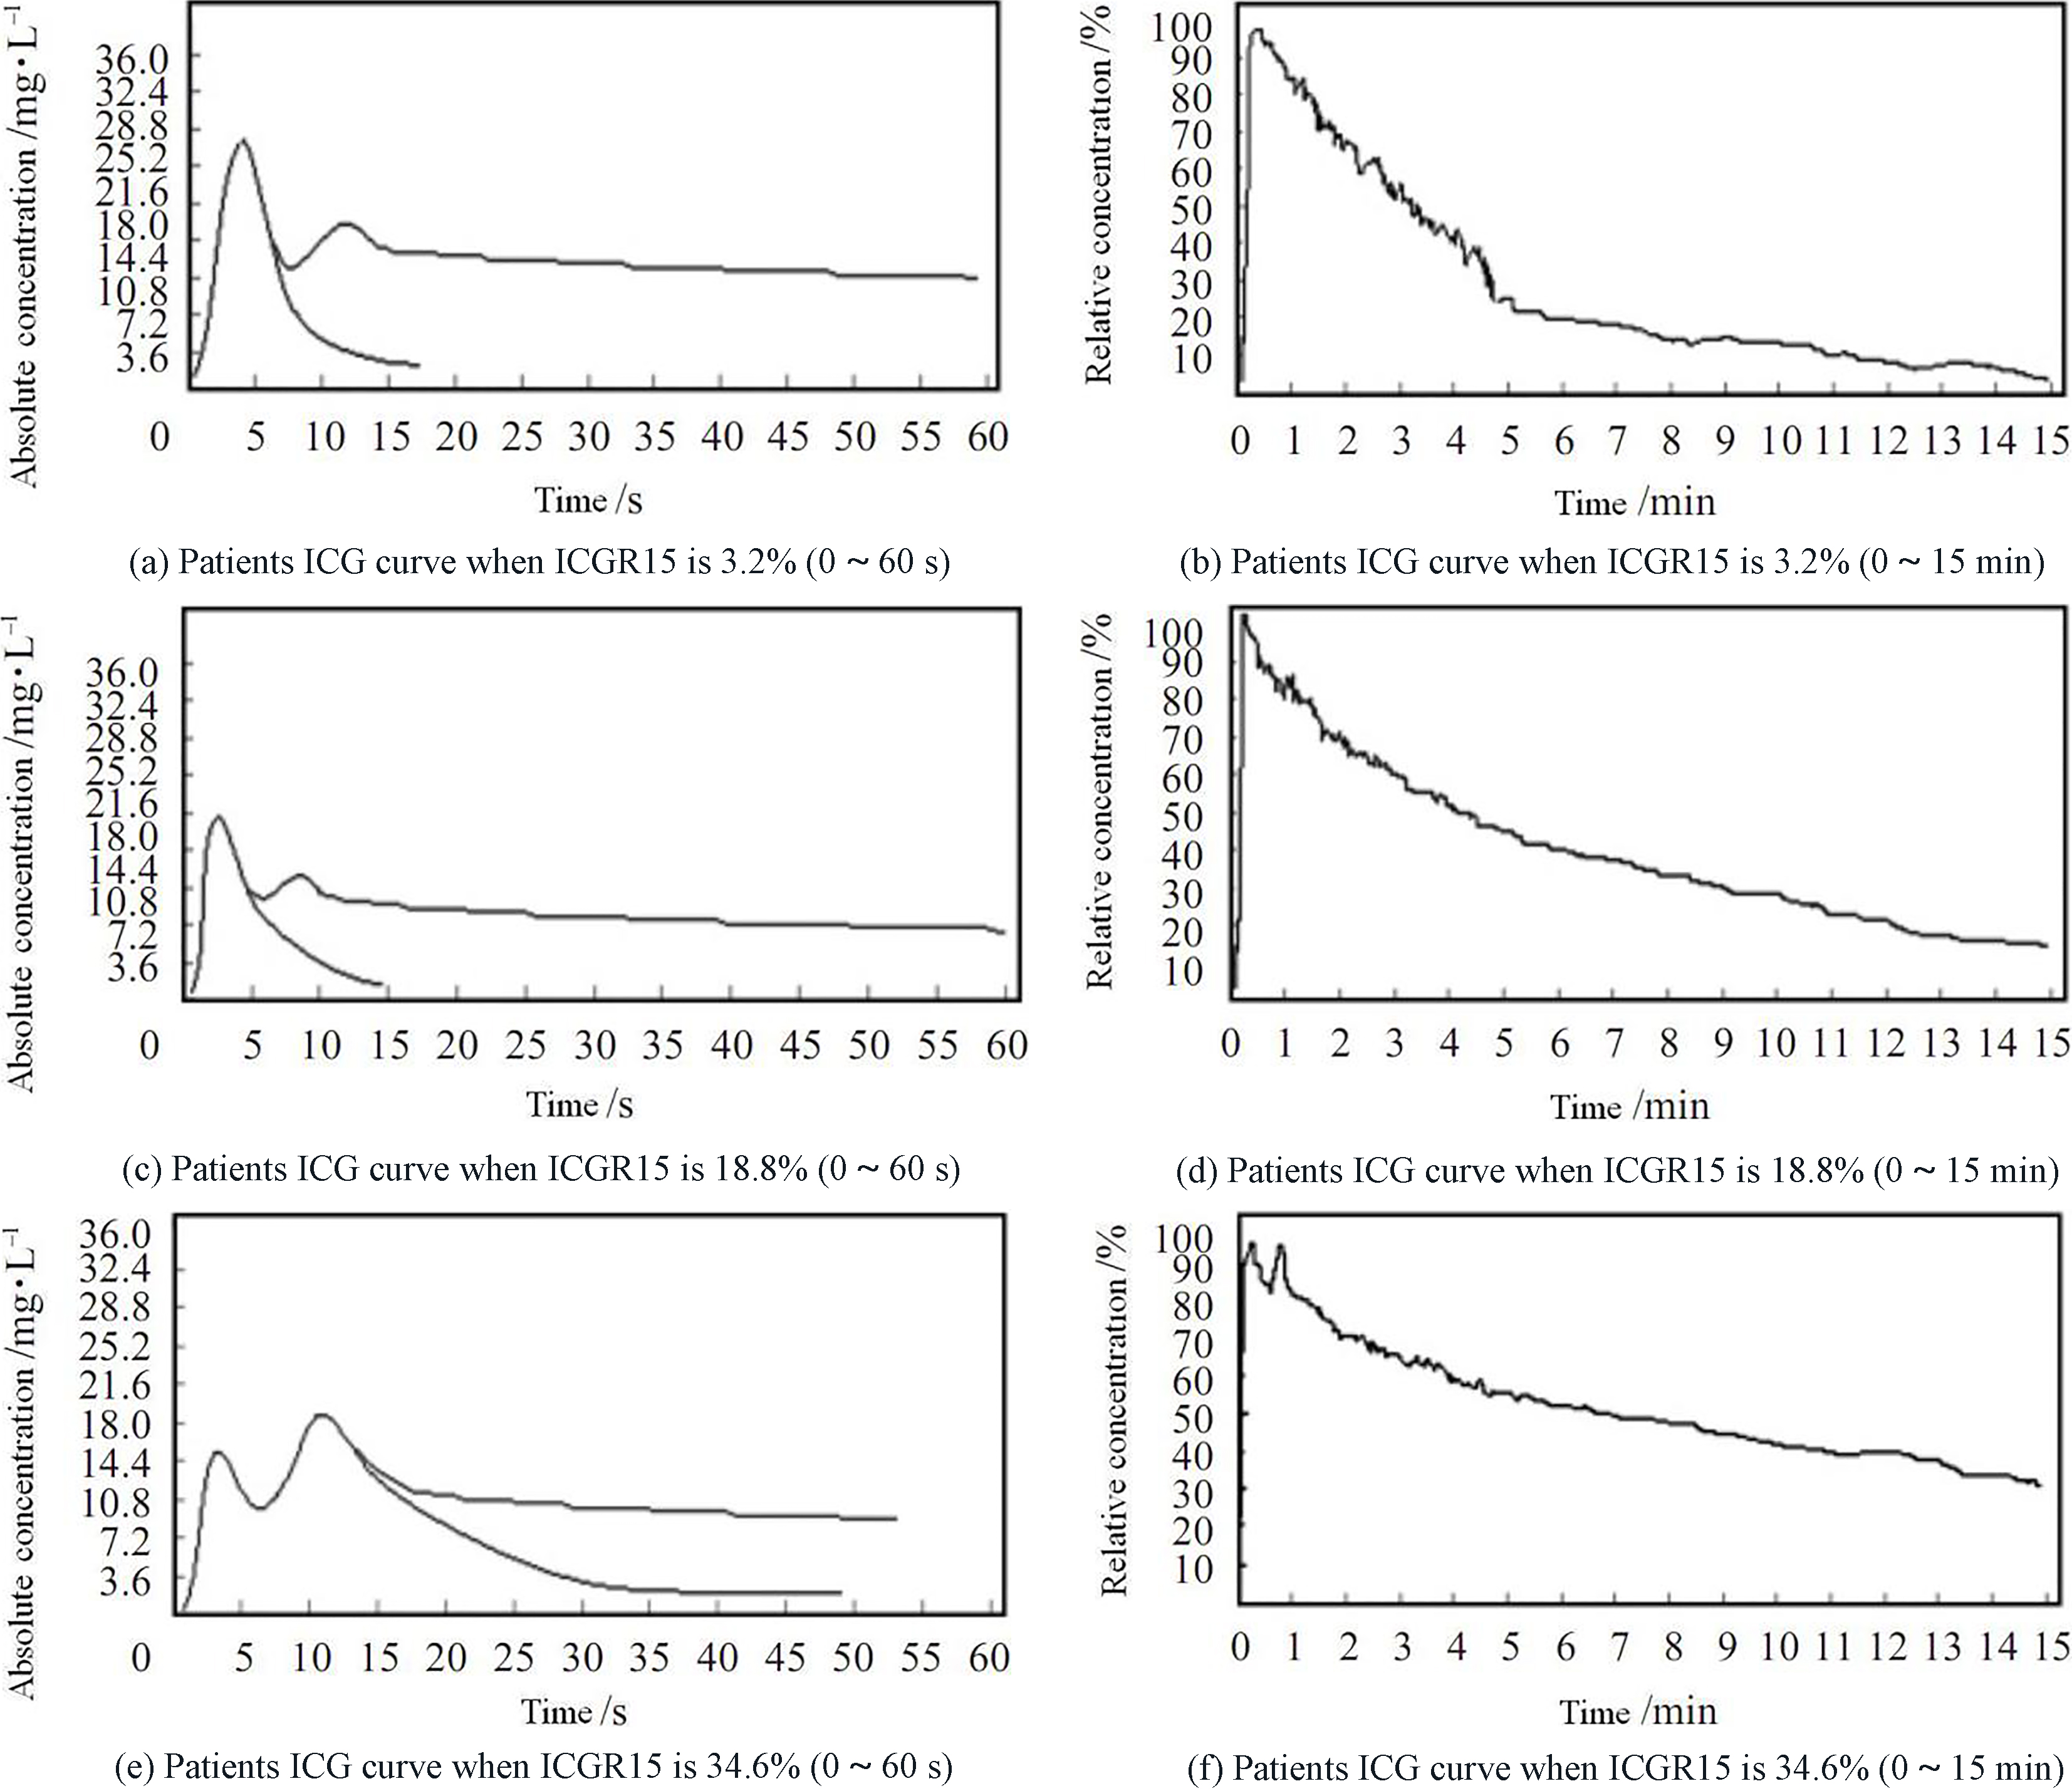
ICG curves of different suspected primary liver cancer patients.
Under the control of program, the three LEDs create light successively. The wavelengths are 660 nm, 805 nm and 940 nm, respectively. In Fig. 6, ON denotes the diode is in power-up state, OFF denotes cut-off state. Where, T
3.2Data processing and display module
After the processing of A/D conversion, there are still some undesired signals mixed in the data though the data have passed the low-pass filtering at the analog front end. So, to acquire better pulse information, the digital low-pass filter and moving average are used remove them. Also, in order to acquire the parameter of pulse blood oxygen, the threshold value method is adopted to extract the feature points and substitute them to the equation, and then show the result in the LED display screen. The pass parameter of the digital low-pass filter is as Eq. (2):
(2)
Specifically, the following two steps are adopted in our processing: First, in order to remove the noise of AC signal, and get relatively regular pulse fluctuant periodic signal, the data of sampling point need to be filtered. Because of the influence of interference signal in the processing of detection, the signal detected often contains some gross error, which greatly decreases the precision of detection result. In the case of not changing the number of sampling point, the gross error can be identified with first difference method, and then replace them some reasonable numbers. By this way, we can get relatively smooth signal curve. Secondly, the feature points selected include maximum value points, minimum value points and the ascending positions. In circulating the blood oxygen value and ICG concentration, the specific value between the AC component and DC component of signal curve is needed. By the dynamic threshold method, the feature points in the curve can be found. Substituting these points into the computational formulas, one can get SaO
The moving average, the mean value of points around a certain one, is set to replace the value of original point, by which means the smooth wave can be quickly achieved. Hence, the noise is removed and the signal to noise ratio is improved. The five-point mean method is used in this paper, and the data are replaced with the mean value of five points around, including the date point itself. This method is simple and effective, and it is very suitable for the real-time processing. Extracting the feature points with the threshold value method, the period of pulse and the max-min value of pulse information can be acquired. One can get and display the degree of blood oxygen saturation by substituting the values into the equation.
3.3Database and network module
Window CE doesn’t afford the specialized API function for the operation of SQLCE (the SQL under Windows CE). In this system, the ADO elements of ADOCE Windows CE afforded by the Microsoft Company can realize the operation of database SQLCE 2.0.
In the network module, a Web page, whose expanded-name is .asp, is designed, which is mainly used to visit the Database .sdf in SQLCE for inquiring the detecting data of patients in the database. Transplanting the Web page under the document folder “
4.Experimental results and analysis
In experiment, the ICG was injected into a vein of the patient in advance, and the ICG concentration curve and the retention rate ICGR of each patient were detected with the equipment we designed. According to the difference of ICGR15, The patients were divided to three groups: Group S1, ICGR15
Figure 7b, d and f are the ICG curves of three patients who were respectively diagnosed as liver function being normal, mild liver insufficiency and severe liver insufficiency. It can be seen in the ICG excretion experiments, if the one whose liver reserve ability is stronger, the residual quantity of ICG in veins is less, which means the value of ICGR15 is smaller. Figure 7a, c and e show if the liver reserve ability is stronger, in the excreting process of previous 1 minute, the first crest is often higher than the second one. These features are very valuable for the evaluation of liver reserve ability.
5.Conclusions
A three-wavelength liver functional reserve testing system is proposed in this paper. The results of clinical experiments show the signal of this system is stable and reliable, and can effectively assess the reserve ability of liver. With the improving of liver functional reserve detecting technology, the application prospect of portable liver functional reserve detecting equipment will be more and more extensive. The interference from human body and surroundings is reduced greatly by adopting digital filter and moving averages smoothing method to filter out the noise, and using the threshold value method to extract the feature points of pulse wave. The ICG clearance rate are affected at the blood flow volume of liver to a large extent, so any factor influencing the blood flow volume of liver will bring impact on the testing result. Besides, serum opacity and jaundice will lead to the colorimetric error. The patients with obstruction of biliary tract are not fit for the ICG clearance testing.
The pulse blood oxygen data contain much valuable information about the human body. In this paper, a liver functional reserve testing system is proposed based on three-wavelength from red light to NIR. Combined with the database and network, the remote control and management are realized. The OPT101 photoelectric sensor and S3C2440 are used in this system, which makes the equipment much faster and smaller. Besides the acquiring of the pulse blood oxygen data, this scheme can also store and manage the data through the AQLCE database. A friendly interactive interface is designed to display the related data, and the network transmission and sharing is realized by Web programming. The results of clinical experiments show this system, whose the signal is stable and reliable, can effectively evaluate the reserve ability of liver. The system presented in this paper is not only convenient to use, but also powerful in functions.
Acknowledgments
The corresponding author of this paper is Guilian Shi. This work was financially supported by Natural Science Fund of Hubei Province (No. 2016CFB399) and the National College Students’ Innovation and Entrepreneurship Training Project (No. 201710927034).
Conflict of interest
None to report.
References
[1] | Haruna M, Kumon K, Yahagi N. Blood Volume Measurement at the Bedside Using ICG Pulse Spectrophometry [J]. Anesthesiology, (1998) , 89: : 1322-1328. |
[2] | Messai E, Bouguerra A, Harmelin G, et al. A numerical model of blood oxygenation during veno-venous ECMO: analysis of the interplay between blood oxygenation and its delivery parameters [J]. Journal of Clinical Monitoring and Computing, (2016) , 30: (3): 327-332. |
[3] | Bartels K, Can RH, Anesth J. Advances in phatoplethysmography: beyond arterial oxygen saturation [J]. Canadian Journal of Anesthesia, (2015) , 62: (12): 1313-1328. |
[4] | Ellwein L, Samyn MM, Danduran M, et al. Toward translating near-infrared spectroscopy oxygen saturation data for the non-invasive prediction of spatial and temporal hemodynamics during exercise [J]. Biomechanics and Modeling in Mechanobiology, (2016) , 10: (4): 1-22. |
[5] | Uni-Stojanovic D, Vukovic P, Nezic D, Filipovic M, et al. Abnormal central venous oxygen saturation in cardiac surgery patients: a prospective, observational study [J]. Journal of Cardiothoracic Surgery, (2013) , 163: (8): 1749-1753. |
[6] | Takehiko I, Takuo A, Yasuhide I. Cardiac output and circulation blood volme analysis by pulse dye-densitometry [J]. Journal of Clinical Monitoring, (1997) , 13: (6): 81-89. |
[7] | Allaria B, Favaro M, Resta M. Monitoring techniques for blood volume in the anesthesia and intensive care setting [J]. Journal of Clinical Monitoring and Computing, (2002) , 17: (10): 235-239. |
[8] | Ercolani G, Grazi GL, Calliva R. The lidocaine (MEGX) test as an index of hepatic function: its clinical usefulness in liver surgery [J]. Surgery, (2000) , 127: : 464-471. |
[9] | Corporation NK. Pulse oximetry and pulse oximeter [P]. U. S. Patent, US20090318787A1. (2009) , 12-24. |
[10] | Aoyagi T. Pulse oximetry: its invention, theory, and future [J]. Journal of Anesthesia, (2003) , 17: (4): 259-266. |
[11] | Victoria G, Evgenia VT. Procuction of enzymes and antimicrobial compounds by halophilic Antarctic Nocardioides sp. grown on different carbon sources [J]. World Journal of Microbiology Biotechnology, (2012) , 28: : 2069-2076. |
[12] | Mckee S, Dougall EA, Mottram NJ. Analytic solution of a simple advection-diffusion model of an oxygen transfer device [J]. Journal of Mathematics in Industry, (2016) , 10: (6): 1180-1186. |
[13] | Lockwood GG, Fung NLS, Jones JG. Evaluation of a computer program for non-invasive determination of pulmonary shunt and ventilation-perfusion mismatch [J]. Journal of Clinical Monitoring and Computing, 28: (6): 581-590. |
[14] | Zhao N, Iramina K. Numerical simulation of effect of convection-diffusion on oxygen transport in microcirculation [J]. Applied Mathematics and Mechanics, (2015) , 36: (2): 179-200. |
[15] | Herold C, Censlmayer M, Ocker M. Inducibility of microsomal liver function may differentiate cirrhotic patients with maintained compared with severely compromised liver reserve [J]. J. Gastmenterol Hepatc., (2003) , 18: : 445-449. |
[16] | Perseghin G, Mazzaferro V, Sereni LP. Contribution of reduced insulin sensitivity and secretion to the pathogenesis of hepatogenous diabetes: effect of liver transplantation [J]. Hepatology, (2000) , 31: : 694-703. |
[17] | Takuo A, Masayoshi F, Naoki K. Multi-wavelength Pulse Oximetry: Theory for the Future [J]. Anesth Analg., (2007) , 105: : 53-58. |
[18] | Kochs E, Hoffman WE, Werner C. Cerebral blood flow velocity in relation to cerebral blood flow, cerebral metabolic rate for oxygen, and electroencephalogram analysis during isoflurane anesthesia in dogs [J]. Anesth Analg., (1993) , 76: : 1222-1226. |

