
Human emotion classification based on multiple physiological signals by wearable system
Abstract
BACKGROUND:
Human emotion classification is traditionally achieved using multi-channel electroencephalogram (EEG) signal, which requires costly equipment and complex classification algorithms.
OBJECTIVE:
The experiments can be implemented in the laboratory environment equipped with high-performance computers for the online analysis; this will hinder the usability in practical applications.
METHODS:
Considering that other physiological signals are also associated with emotional changes, this paper proposes to use a wearable, wireless system to acquire a single-channel electroencephalogram signal, respiration, electrocardiogram (ECG) signal, and body postures to explore the relationship between these signals and the human emotions.
RESULTS AND CONCLUSIONS:
Compared with traditional emotion classification method, the presented method was able to extract a small number of key features associated with human emotions from multiple physiological signals, where the algorithm complexity was greatly reduced when incorporated with the support vector machine classification. The proposed method can support an embedded on-line analysis and may enhance the usability of emotion classification.
1.Introduction
Human emotional monitoring has many applications; for example, it is essential to assess patients’ progress in rehabilitation, particularly important for those mental affected survivors from traumatic injury [1]. The research on human emotions has been among hot topics in recent years, though the science of human emotions has not yet fully understood. As a result, there are many definitions of emotion. Most commonly, the emotions can be categorized into negative and positive [2, 3]. Researchers may need more than 64 channel electroencephalogram (EEG) signal to analyze the emotions. This method requires costly EEG acquisition equipment as well as high performance workstations to implement the complex features extraction and classification algorithms [4, 5]. A large number of studies have shown that the machine learning is a feasible way to evaluate emotions. The support vector machine (SVM) and deep learning are currently well-known classification methods, and question is still yet existed – how to choose or select the effective features. EEG, a high dimension, nonlinear weak signal, is commonly used for emotion monitoring. Many emotion-related studies suggest that both time domain and frequency domain features may indicate human emotions. To evaluate the emotional state, past studies employed multi-channel EEG signals to extract sufficient features, particularly the feature revealing the differences among channels. By fusing with other features, such as the power spectral density (PSD), short-time power spectrum, and signal asymmetry, a very high dimension feature vector can be formed as the input parameter of the classifier [6, 7].
Due to the weak and high dimensionality characteristics of the EEG, preprocessing is needed before feature extraction and classification, where the electrooculogram (EOG) interference removal is one of the most critical preprocessing required [8]. Although there are many methods to deal with the interferences, those methods generally have high computational complexity [9, 10, 11]. Therefore, the EEG-based emotional classification method is difficult to be implemented experimentally, where the hardware requirements are extremely high, particularly in the real-time applications. Thereby, the experiment may only be implemented in the laboratory environment, which limits the subject’s activity area and results in a low usability [12].
The EEG analysis has been one of the most effective methods to classify emotions; on the other hand there are some easy-to-access physiological signals may also reveal emotional responses, such as respiration, electrocardiogram (ECG), and body posture [13, 14, 15, 16]. During human respiration process, the chest impedance will change periodically due to the air inhalation and exhalation. Clinical studies have shown that respiratory characteristics and emotions also have a certain relationship. For example, in a stable mood, the breathing signal is relatively stable, and in the excited time, the relative change in breathing is relatively dramatic. Similarly, ECG signals, which can be divided into P-QRS-T waves, can also indicate human emotions [17]. The ECG strength and stability of each component wave can reflect the body’s performance and emotional state. Skin conductance research is another hot topic in recent years, it can indicate the human emotion state to some extent, though the reliable and convenient detection method is a challenge [18, 19]. In some other studies, there was a certain relationship between the stability of the head posture and fatigue, but in the emotional research, the consideration of the head posture is very rare [20].
The development of emotional state detection and analysis devices, however, has limit for the suability because most of the researches are mainly conducting theoretical study. Till now, few researcher use wearable online system to analyze the emotions [21]. Based on the above, it is reasonable to combine emotion state-related signals to achieve better classification accuracy, while reducing the complexity of the algorithm and equipment costs.
According to the above reasons, this paper proposes a wearable, wireless body area sensor network to acquire those emotional state-related signals including one channel EEG. Moreover an efficient signal processing method to remove the interference and extract the useful features is presented. According to the analysis results, only key features were chosen as the input of the emotion classifier. Because of the use of easy-to-access physiological signals and the efficient algorithms, the data receiving, signal processing and emotion classification are all implemented in a wearable DSP chip [22]. Finally, this paper employed SVM to train several samples, and compared with the traditional method which only based on multi-channel EEG. The experiment results show that with the greatly reduction of the algorithm complexity, the presented method has a significant improvement of the classification accuracy. That means the human emotion classification can be widely used in many applications with the wearable system, such as psychiatric patients treatment, telemedicine and health care, and other commercial applications.
2.System design and experiment
2.1Data acquisition and analysis system
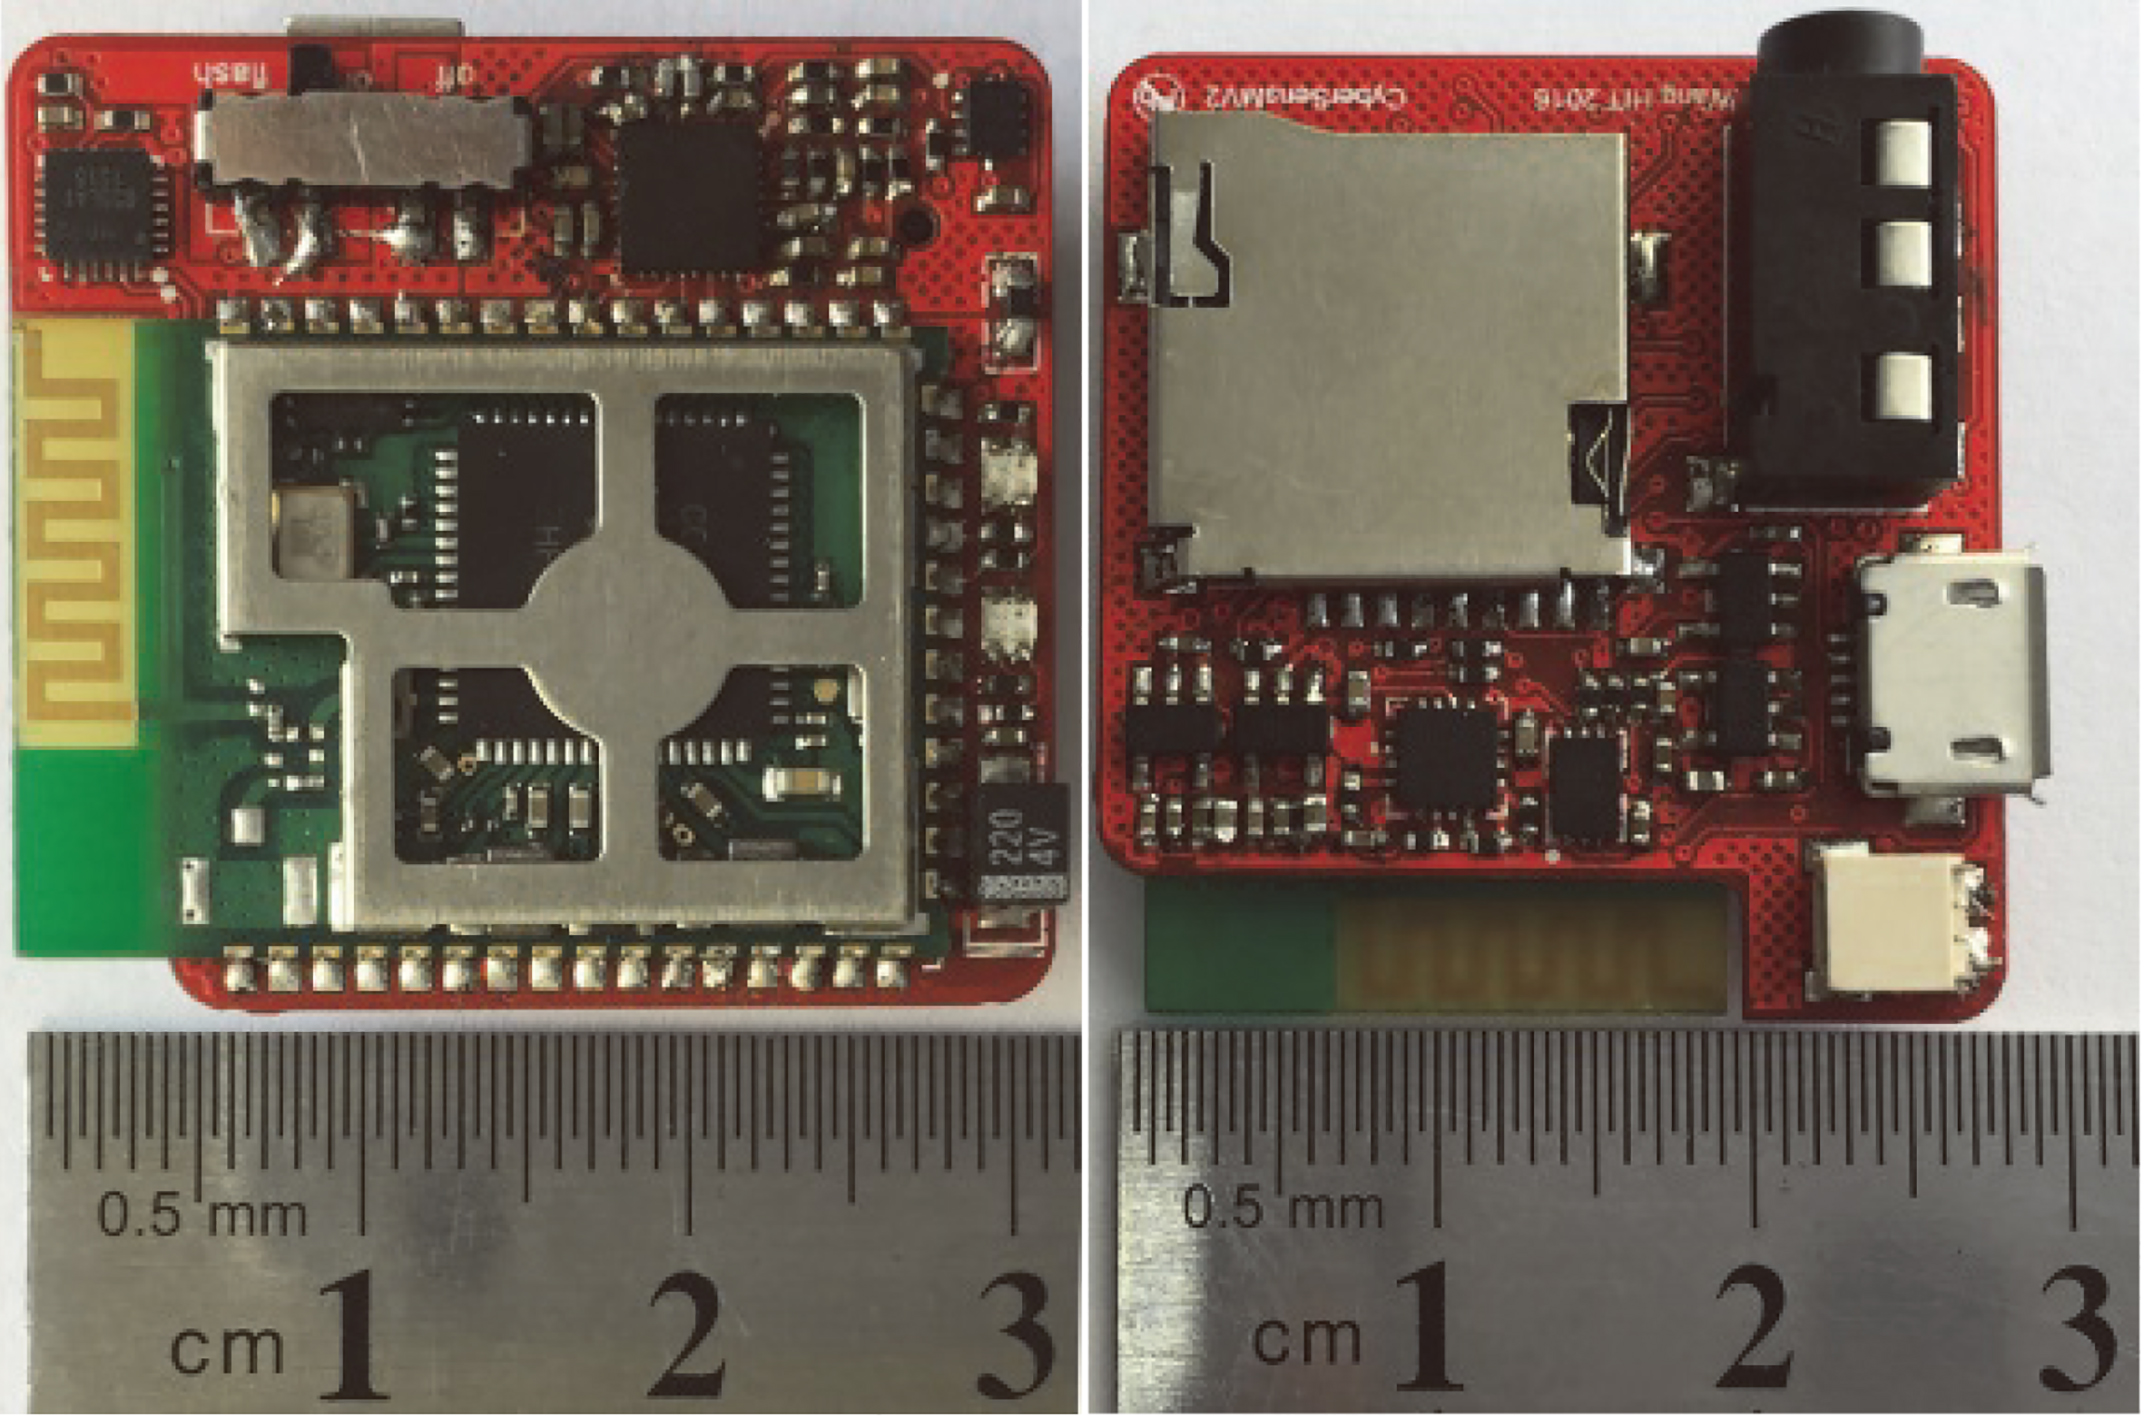
In order to illustrate the usability of the method presented in this paper, a custom-made experimental device was employed. The diagram of this system is represented in Fig. 1. The system uses multiple wearable sensors to acquire various physiological signals, and uploads the data via Wi-Fi under the control of main node. With the support from DSP core, the wearable main node performs the data processing and analysis in real time. The multi-function sensor node shown in Fig. 2 enables single-channel EEG and head posture acquisition, and/or ECG and respiratory impedance acquisition. With a tiny-size setup, it can be easily placed in clothing or hat. Two identical nodes use Wi-Fi to communicate with the DSP main node at the same time. This wearable structure greatly enhances the practicality of emotion classification.
Figure 1.
System diagram.
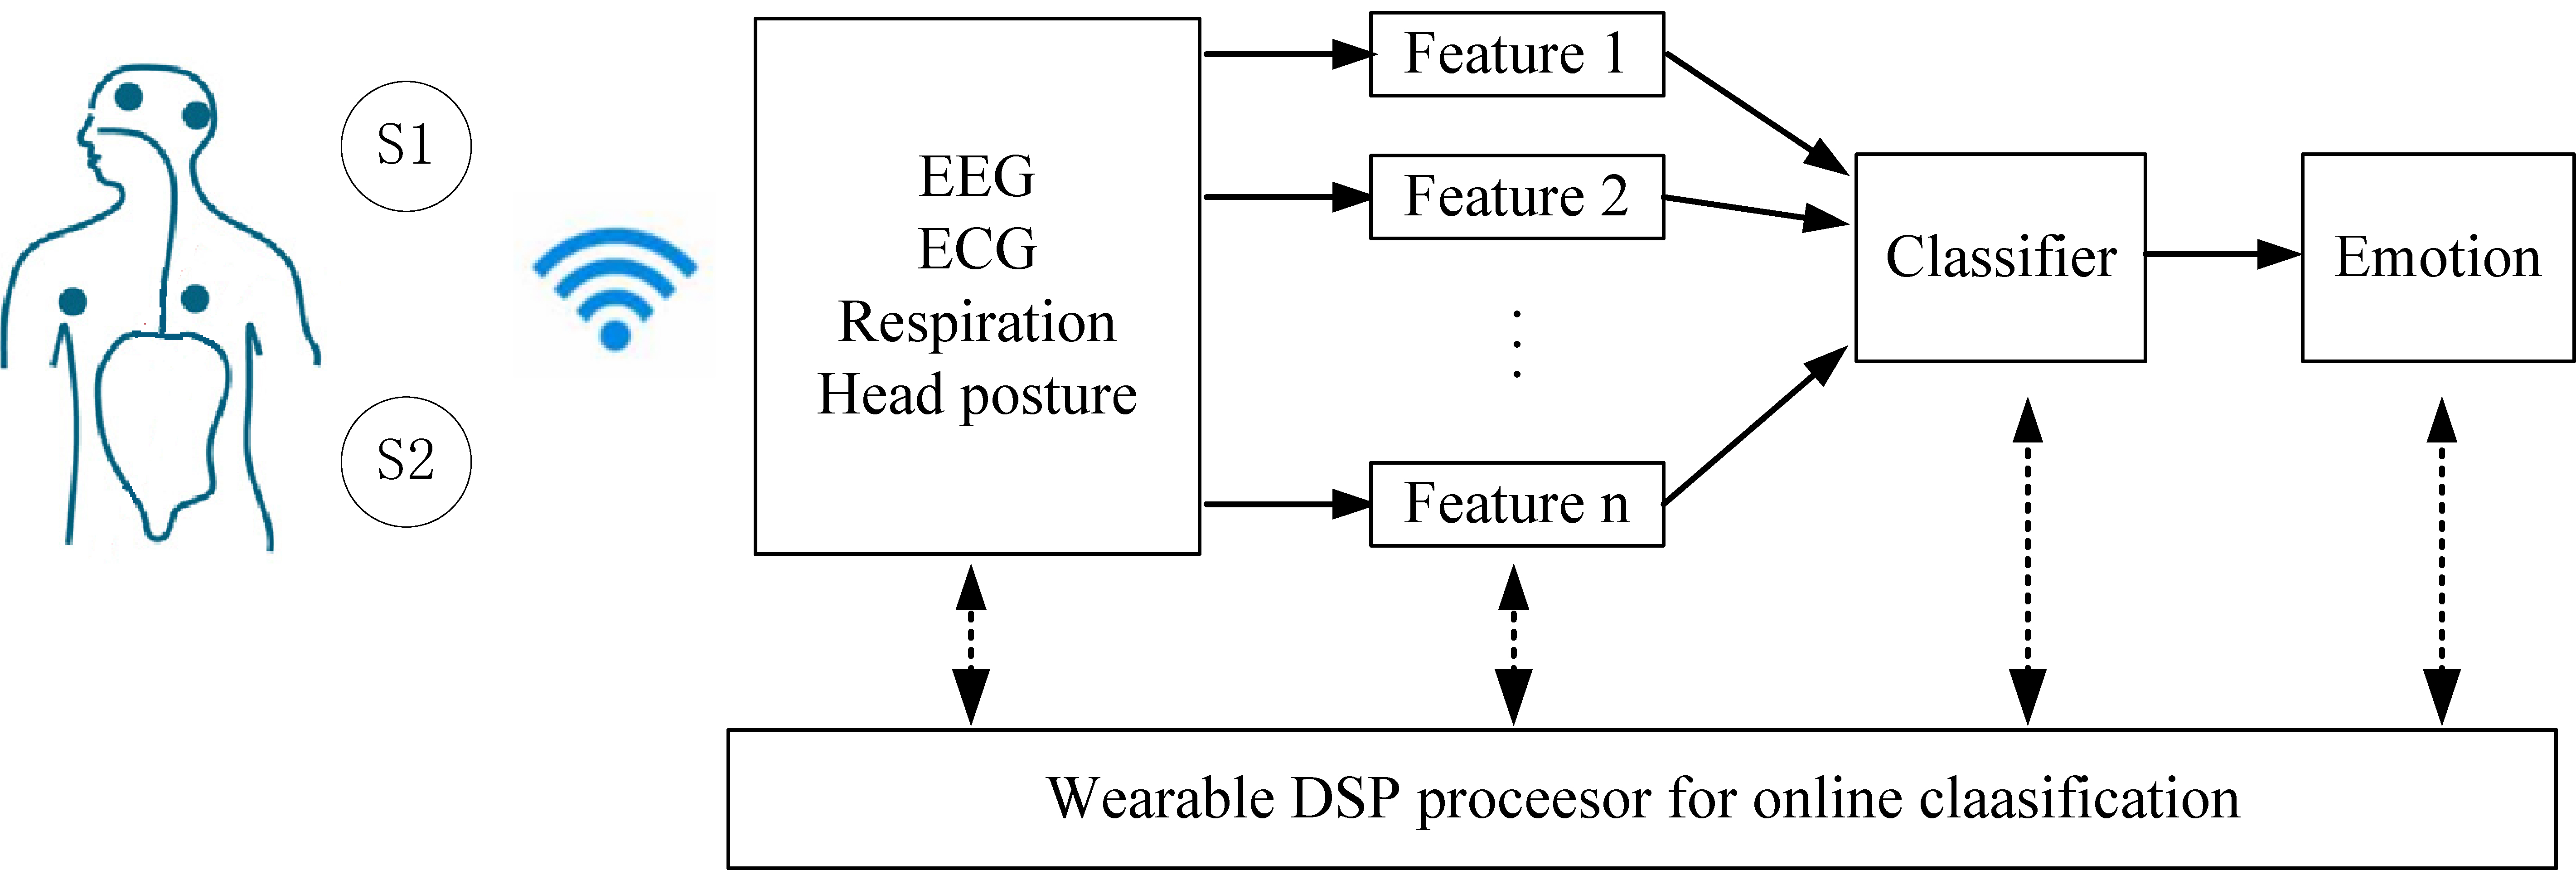
Figure 2.
Sensor node.
In this sensor node, a 24-bit high-precision ADC is used to detect the EEG, ECG and respiratory impedance (RESP) signals, where the EEG and ECG are input directly after the RC filter and the RESP is acquired by using modulation-demodulation method (
Table 1
Signal accuracy and sampling rate
| Signal | Accuracy | Rate (Hz) |
|---|---|---|
| EEG | 0.2 | 1000 |
| ECG | 4.3 | 500 |
| RESP | 5% | 500 |
| Head posture | 0.2Deg/0.004g | 100 |
Table 2
Selected film slice example
| Film slice | Emotion |
|---|---|
| Tangshan Earthquake | Negative |
| King of comedy | Positive |
| Guilin Scenery | Neutral |
| Lost in Thailand | Positive |
| Assembly | Negative |
| China from above | Neutral |
Figure 3.
System set up.
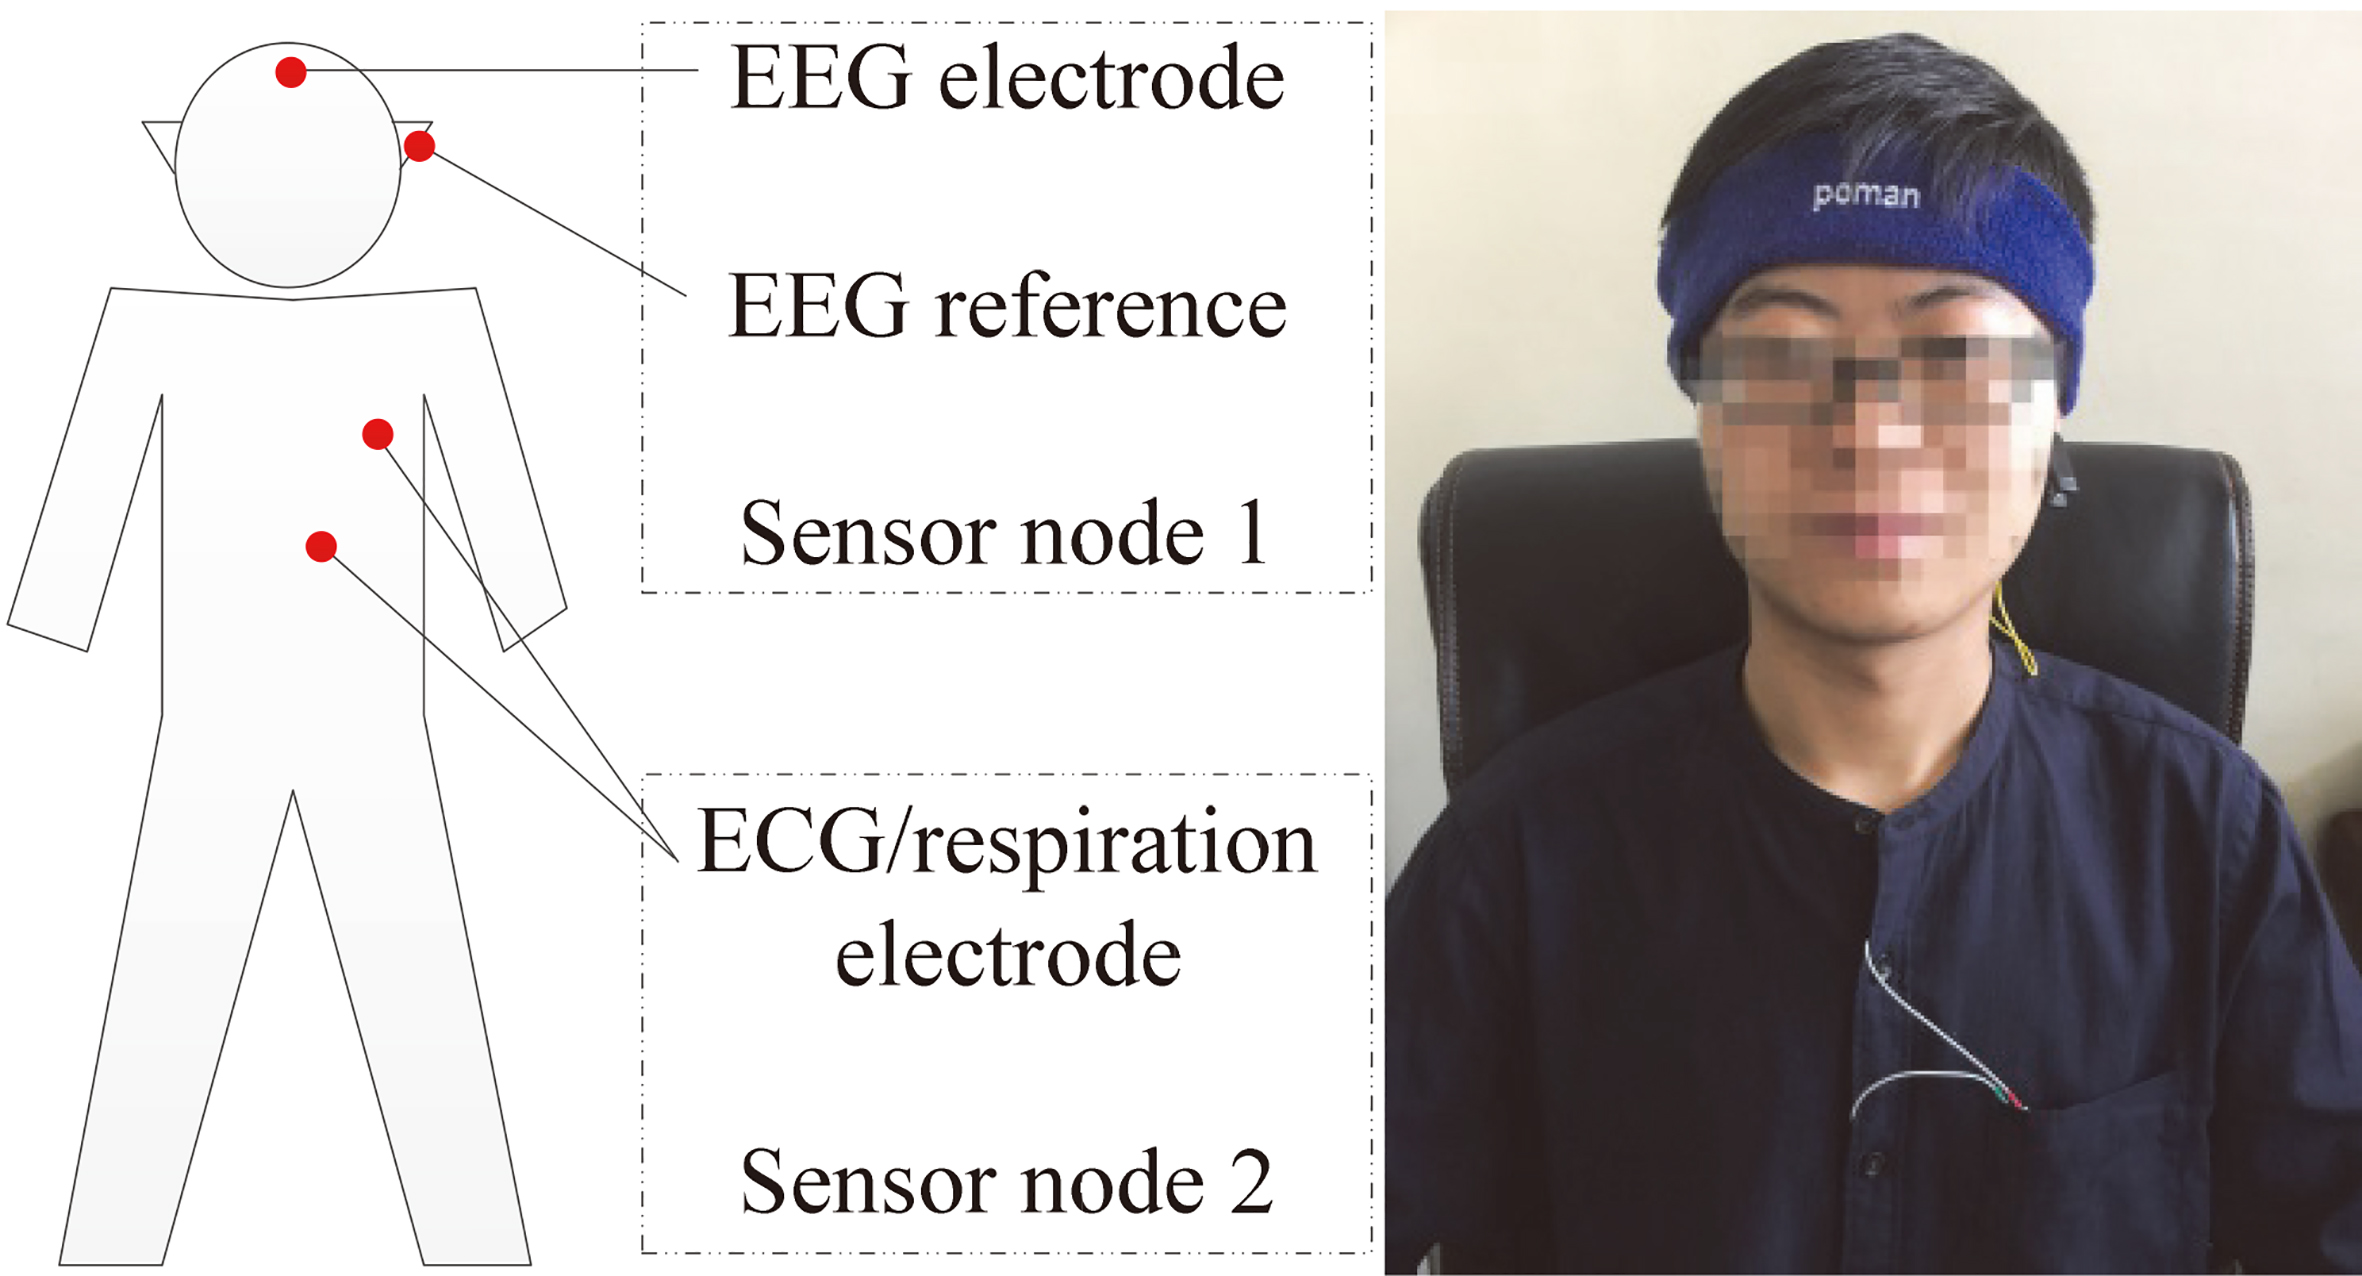
As shown in Fig. 3, a sensor node was placed in the headband to acquire the single channel EEG signal near the forehead by the medical electrodes, and the right earlobe was chosen as the reference to reduce the ECG interference. The sensor node was used to track the head posture at the same time. Another node was fixed in the chest pocket for ECG and respiratory impedance signal acquiring by a pair of common electrodes. On the other hand, in order to compare with the traditional multi-channel EEG based classification methods, 16-channel EEG signals were acquired by commercial EEG equipment (V-Amp, Germany) during the emotion experiment.
2.2Emotion experiment
The videos provided by Shanghai Jiaotong University SEED laboratory was used to stimulate the different emotions of each subject in this paper [25]. A number of classic native language film slices was chosen and divided into positive, neutral and negative samples. Active films mostly were comedies, disaster and war history movies were defined to negative, and neutral films are sceneries or landscape appreciations.
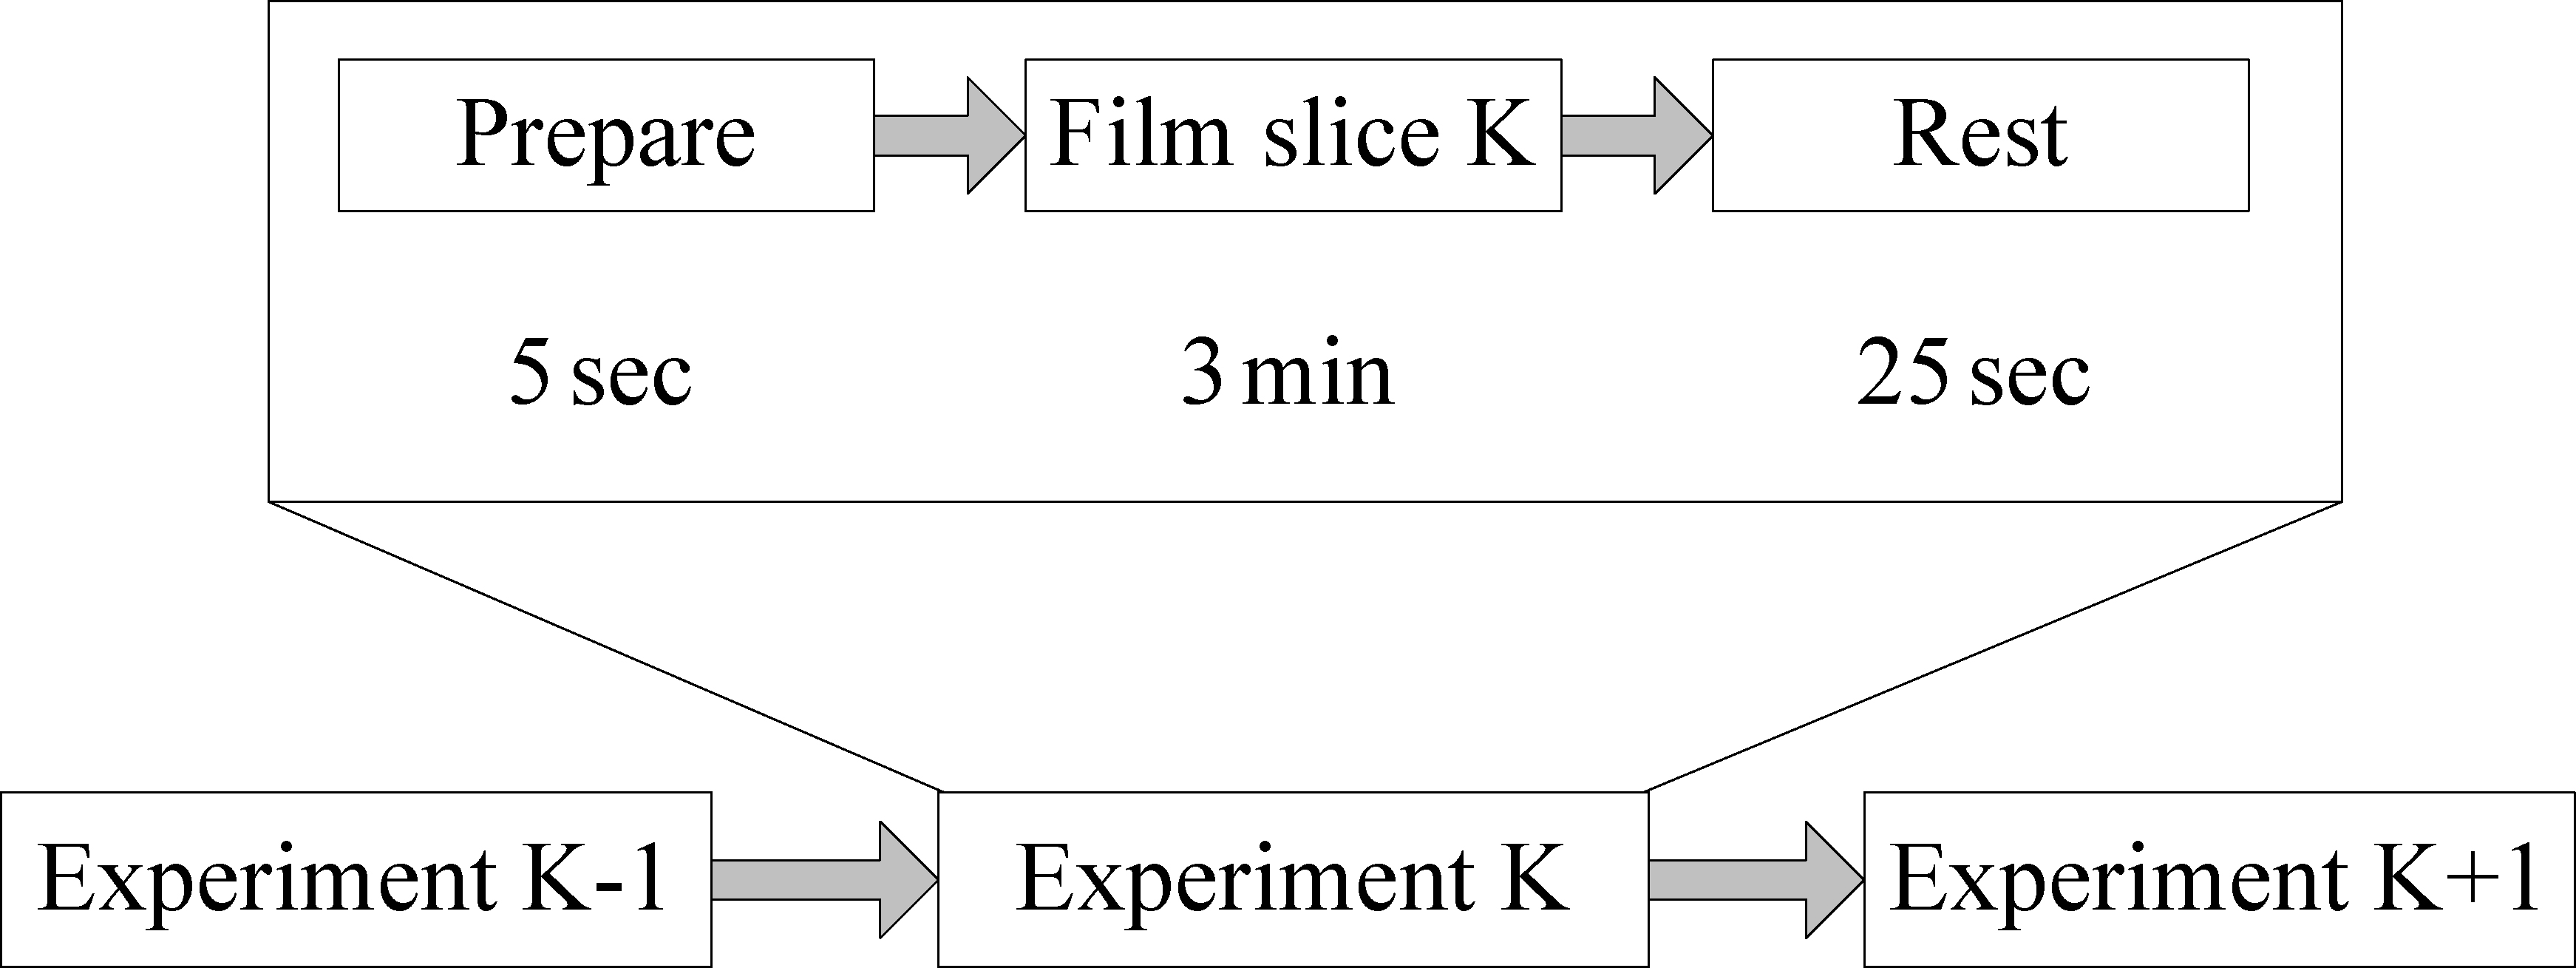
In each experiment, the subject remained sedentary and watched a 3-mimut length slice while collecting the above physiological signals. Six subjects were studied in this paper; each of them completed 36 different experiments, including 12 positive samples, 12 negative samples and 12 neutral samples. In order to improve the reliability of the data, the sample order was assigned randomly. Figure 4 shows the experiment process and Table 2 lists some slected film slices and their corresponding emotions.
Figure 4.
Experiment process.
3.Data analysis
3.1Data preprocessing
Data preprocessing is a prerequisite for physiological signal analysis. Usually, the first step is to remove baseline drift [26]. This step is essentially to keep the body at zero potential. Since the baseline drift is very slow, a median filter was employed for the removal in order to improve the efficiency. Furthermore, a 1
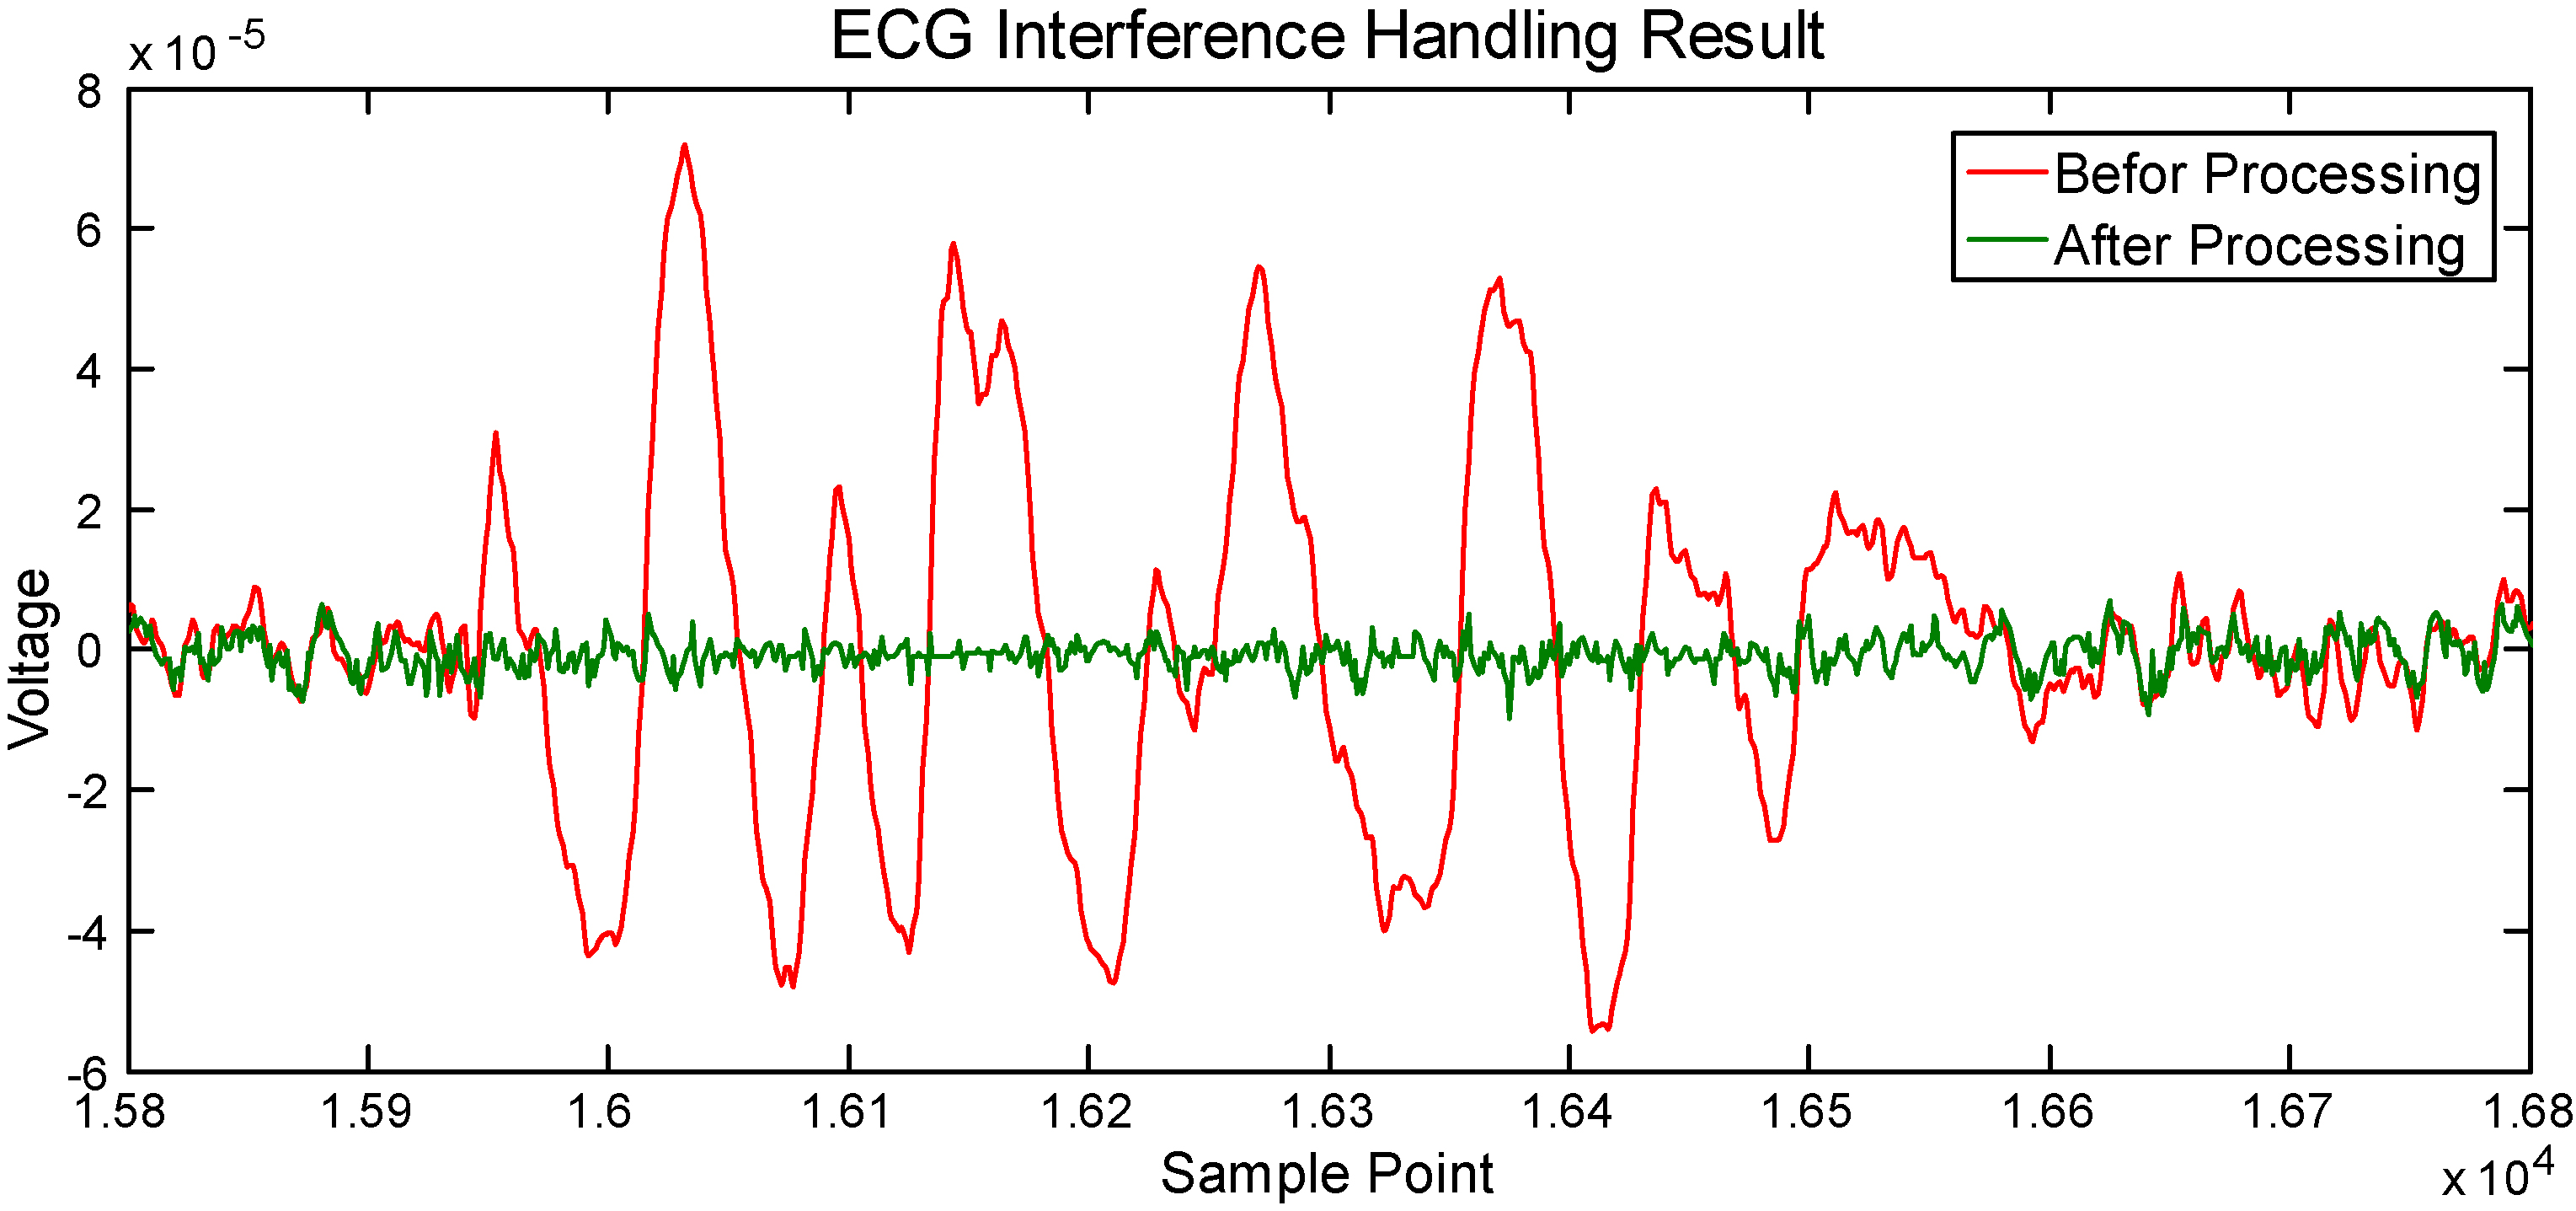
As described above, the EOG interference contaminated in EEG should be removed. In this paper, a method based on Hilbert-Huang Transform (HHT) was used to filter the EOG contamination, which has been proved effective in previous studies [27, 28].
1) According to the physical definition, to calculate a meaningful instantaneous frequency, the signal must be with zero average symmetry in any locality, namely Intrinsic Mode Function (IMF) [28]. Therefore, for the EEG signal
(1)
2) As the EEG signal is usually maintained at 3
(2)
where
3) ECG signal is large amplitude interference, so it can be distinguished by the standard deviation. We retain the required EEG signal and replace the large-deviation signal with the mean. This step can be expressed as follows:
(3)
(4)
where
4) The pure EEG signal without ECG interference is the linear recombination of these new components
Table 3
Selected film slice example
| Signal | Feature | Symbol |
|---|---|---|
| EEG | Percentage PSD |
|
| Standard deviation | Estd | |
| Average power | Epow | |
| Mean of the absolute value | Emean | |
| Blink frequency | Fb | |
| ECG | Heart rate | HR |
| Heart rate stability | HRstd | |
| Power | Hpow | |
| RESP | Respiratory rate | RR |
| Respiratory stability | RRstd | |
| Absolute mean of second order difference |
| |
| Percentage PSD |
| |
| Standard deviation of second order difference |
| |
| Head posture | Posture stability | Pstd |
Figure 5.
Experiment process.
3.2Feature extraction and discussing
Table 3 shows the easy-extracted and commonly used features of the detected physiological signals in this paper. Percentage power spectral density is an important frequency domain feature of physiological signals, for example, the EEG signal is divided to
(5)
This result was consistent with some previous research findings where
Figure 6.
HRstd average values in different emotions.
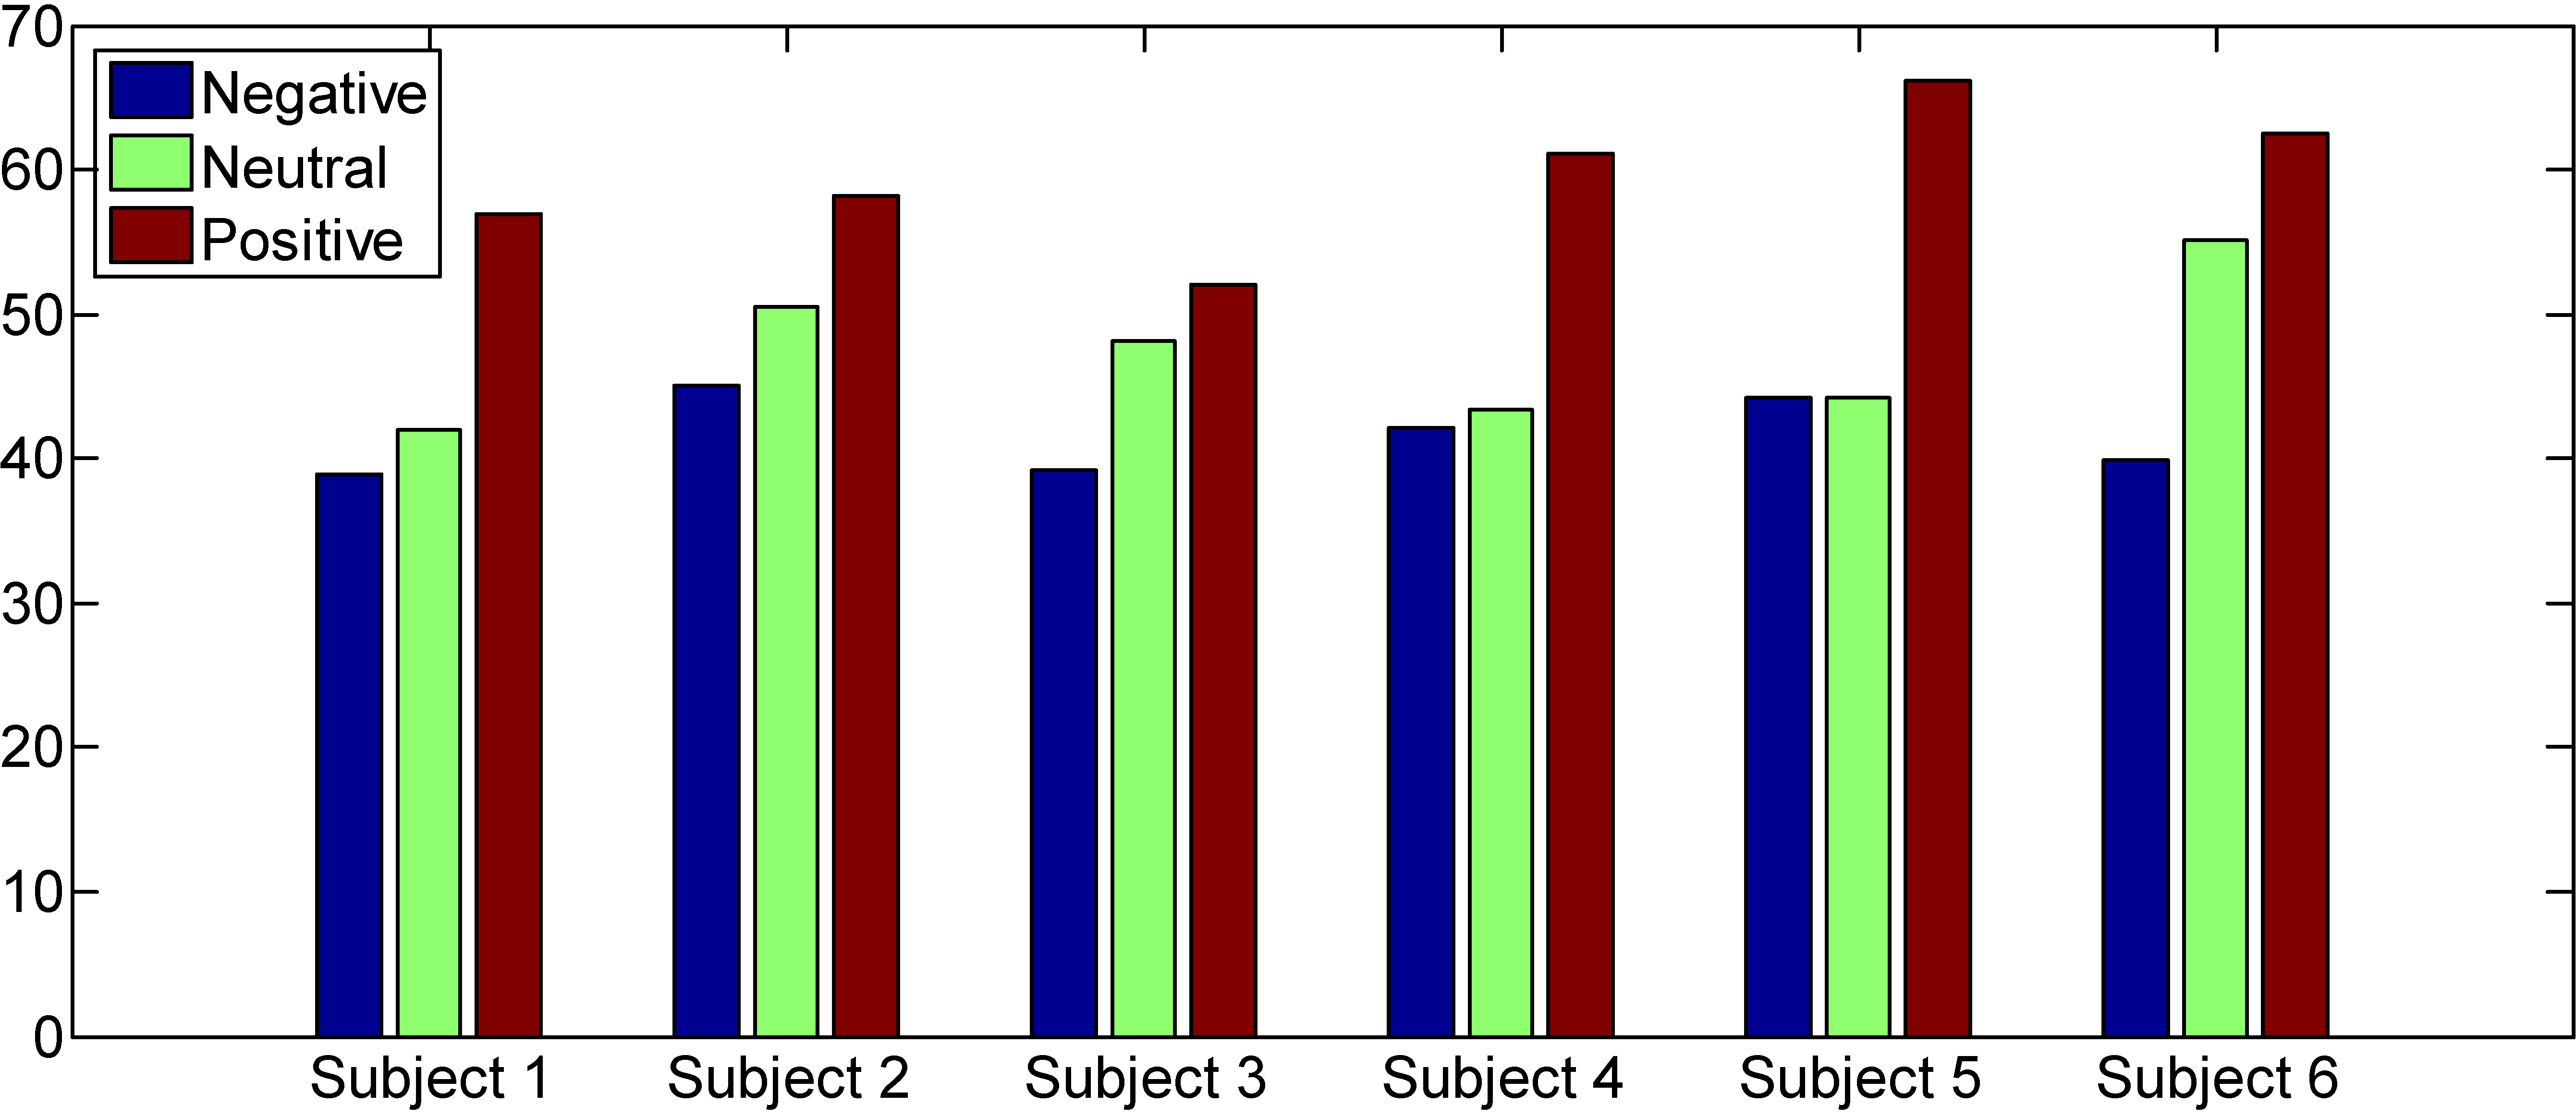
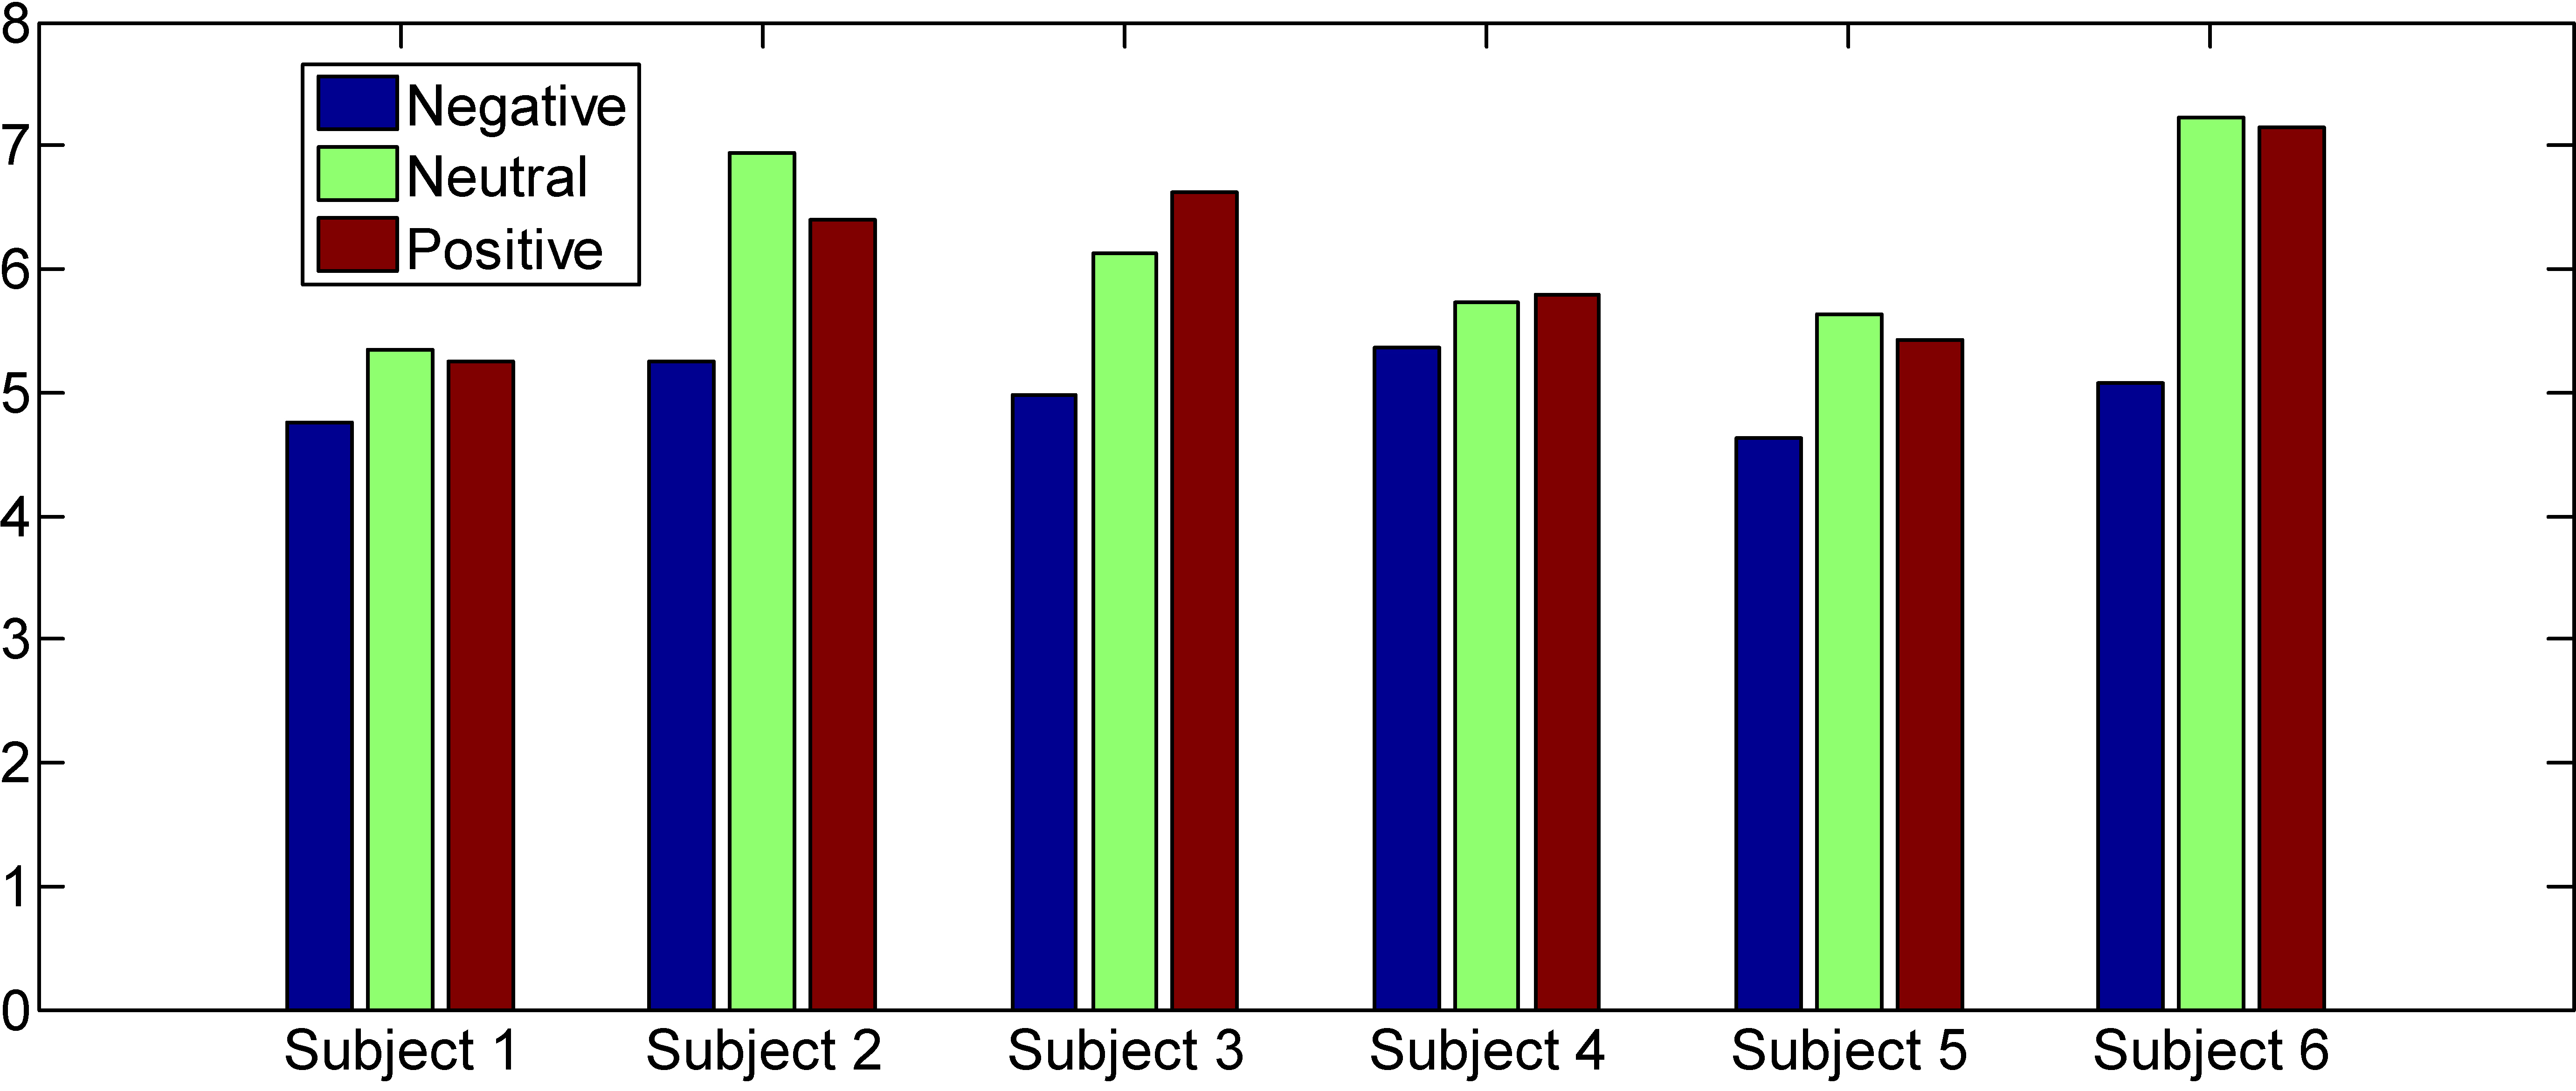
Figure 7.
RRstd average values in different emotions.
As mentioned above, ECG, RESP and head posture features can also reflect to emotional states. For example, the standard deviation of the time interval of ECG pulse peaks can be used as the heart rate stability as denoted in Eq. (6). Figure 6 shows the relationship between ECG feature (average value in 36 samples) and the emotional states from all subjects.
(6)
where
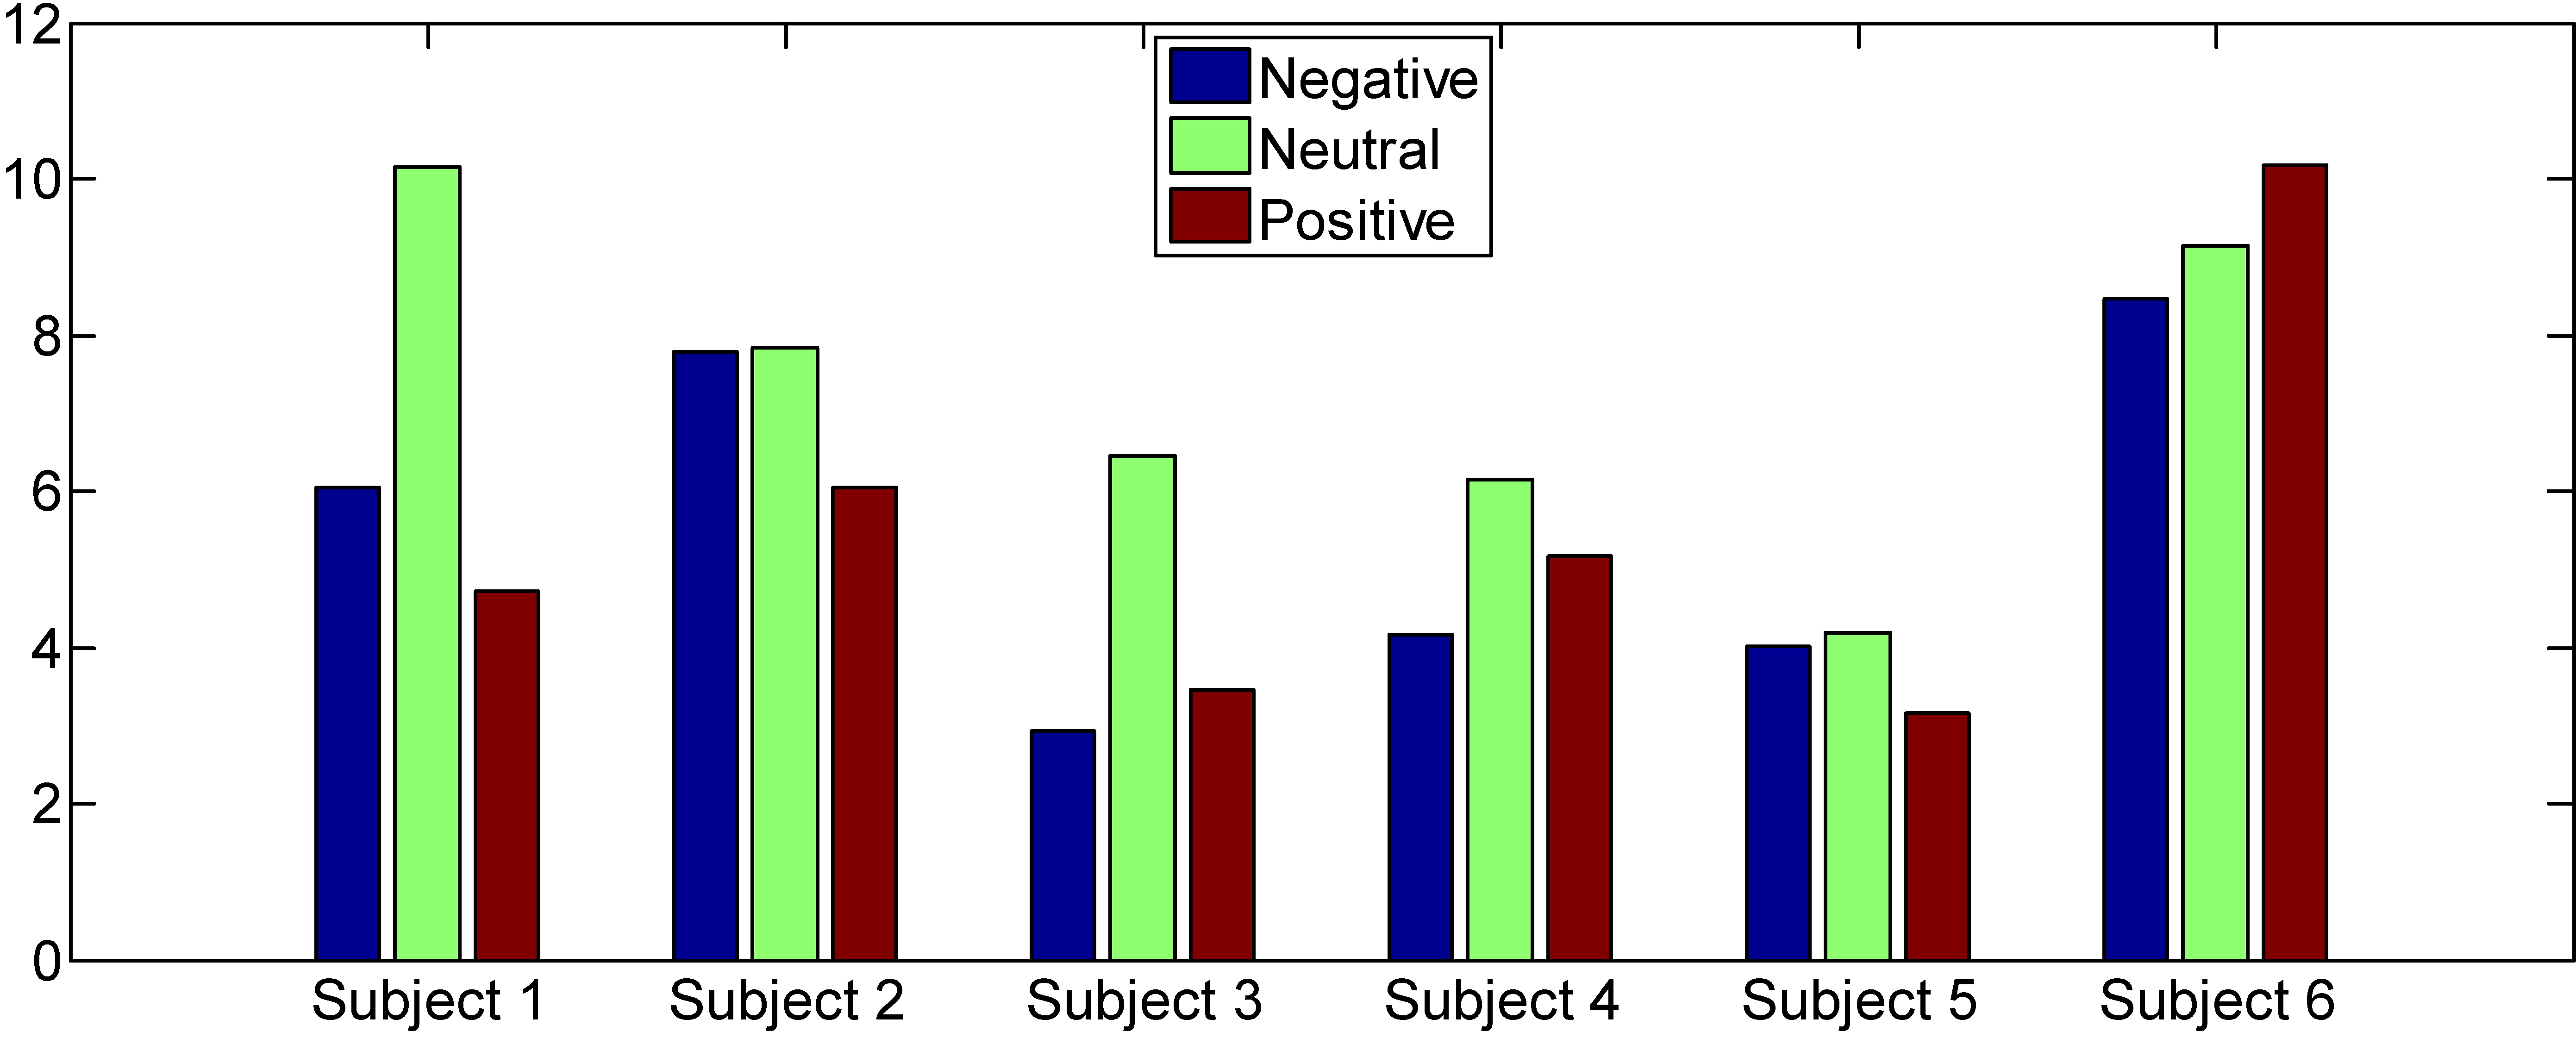
All six objects showed that the HRstd was higher in positive emotion state, while the negative emotion state was associated with a low HRstd (except for Subject 5). Also, the RESP and head posture features were related to emotional states according to the experiment result. Figures 7 and 8 show the RRstd and Pstd analysis results, where Pstd is the total time of the head significant movement in the experiment. The RRstd analysis result indicates that although it cannot distinguish between neutral and positive emotions, the values were consistently low in negative emotion state. Similarly, Pstd average values were usually high during the neutral emotion except Subject 6, which indicates that subjects were not easy to maintain attention in the neutral emotions.
3.3Feature selection
This study conducted a test to quantify the relationship between each feature and emotion. In each test,
Table 4
Classification accuacy of
| Another feature | Accuracy (%) |
|---|---|
| -( | 72.5 |
| Estd | 78.1 |
| Epow | 74.6 |
| Emean | 73.3 |
| Fb | 75.6 |
| HR | 69.0 |
| HRstd | 84.2 |
| Hpow | 70.4 |
| RR | 71.9 |
| RRstd | 75.5 |
|
| 85.2 |
|
| 72.7 |
|
| 86.0 |
| Pstd | 77.6 |
Figure 8.
Pstd average values in different emotions.
3.4Classification and discussion
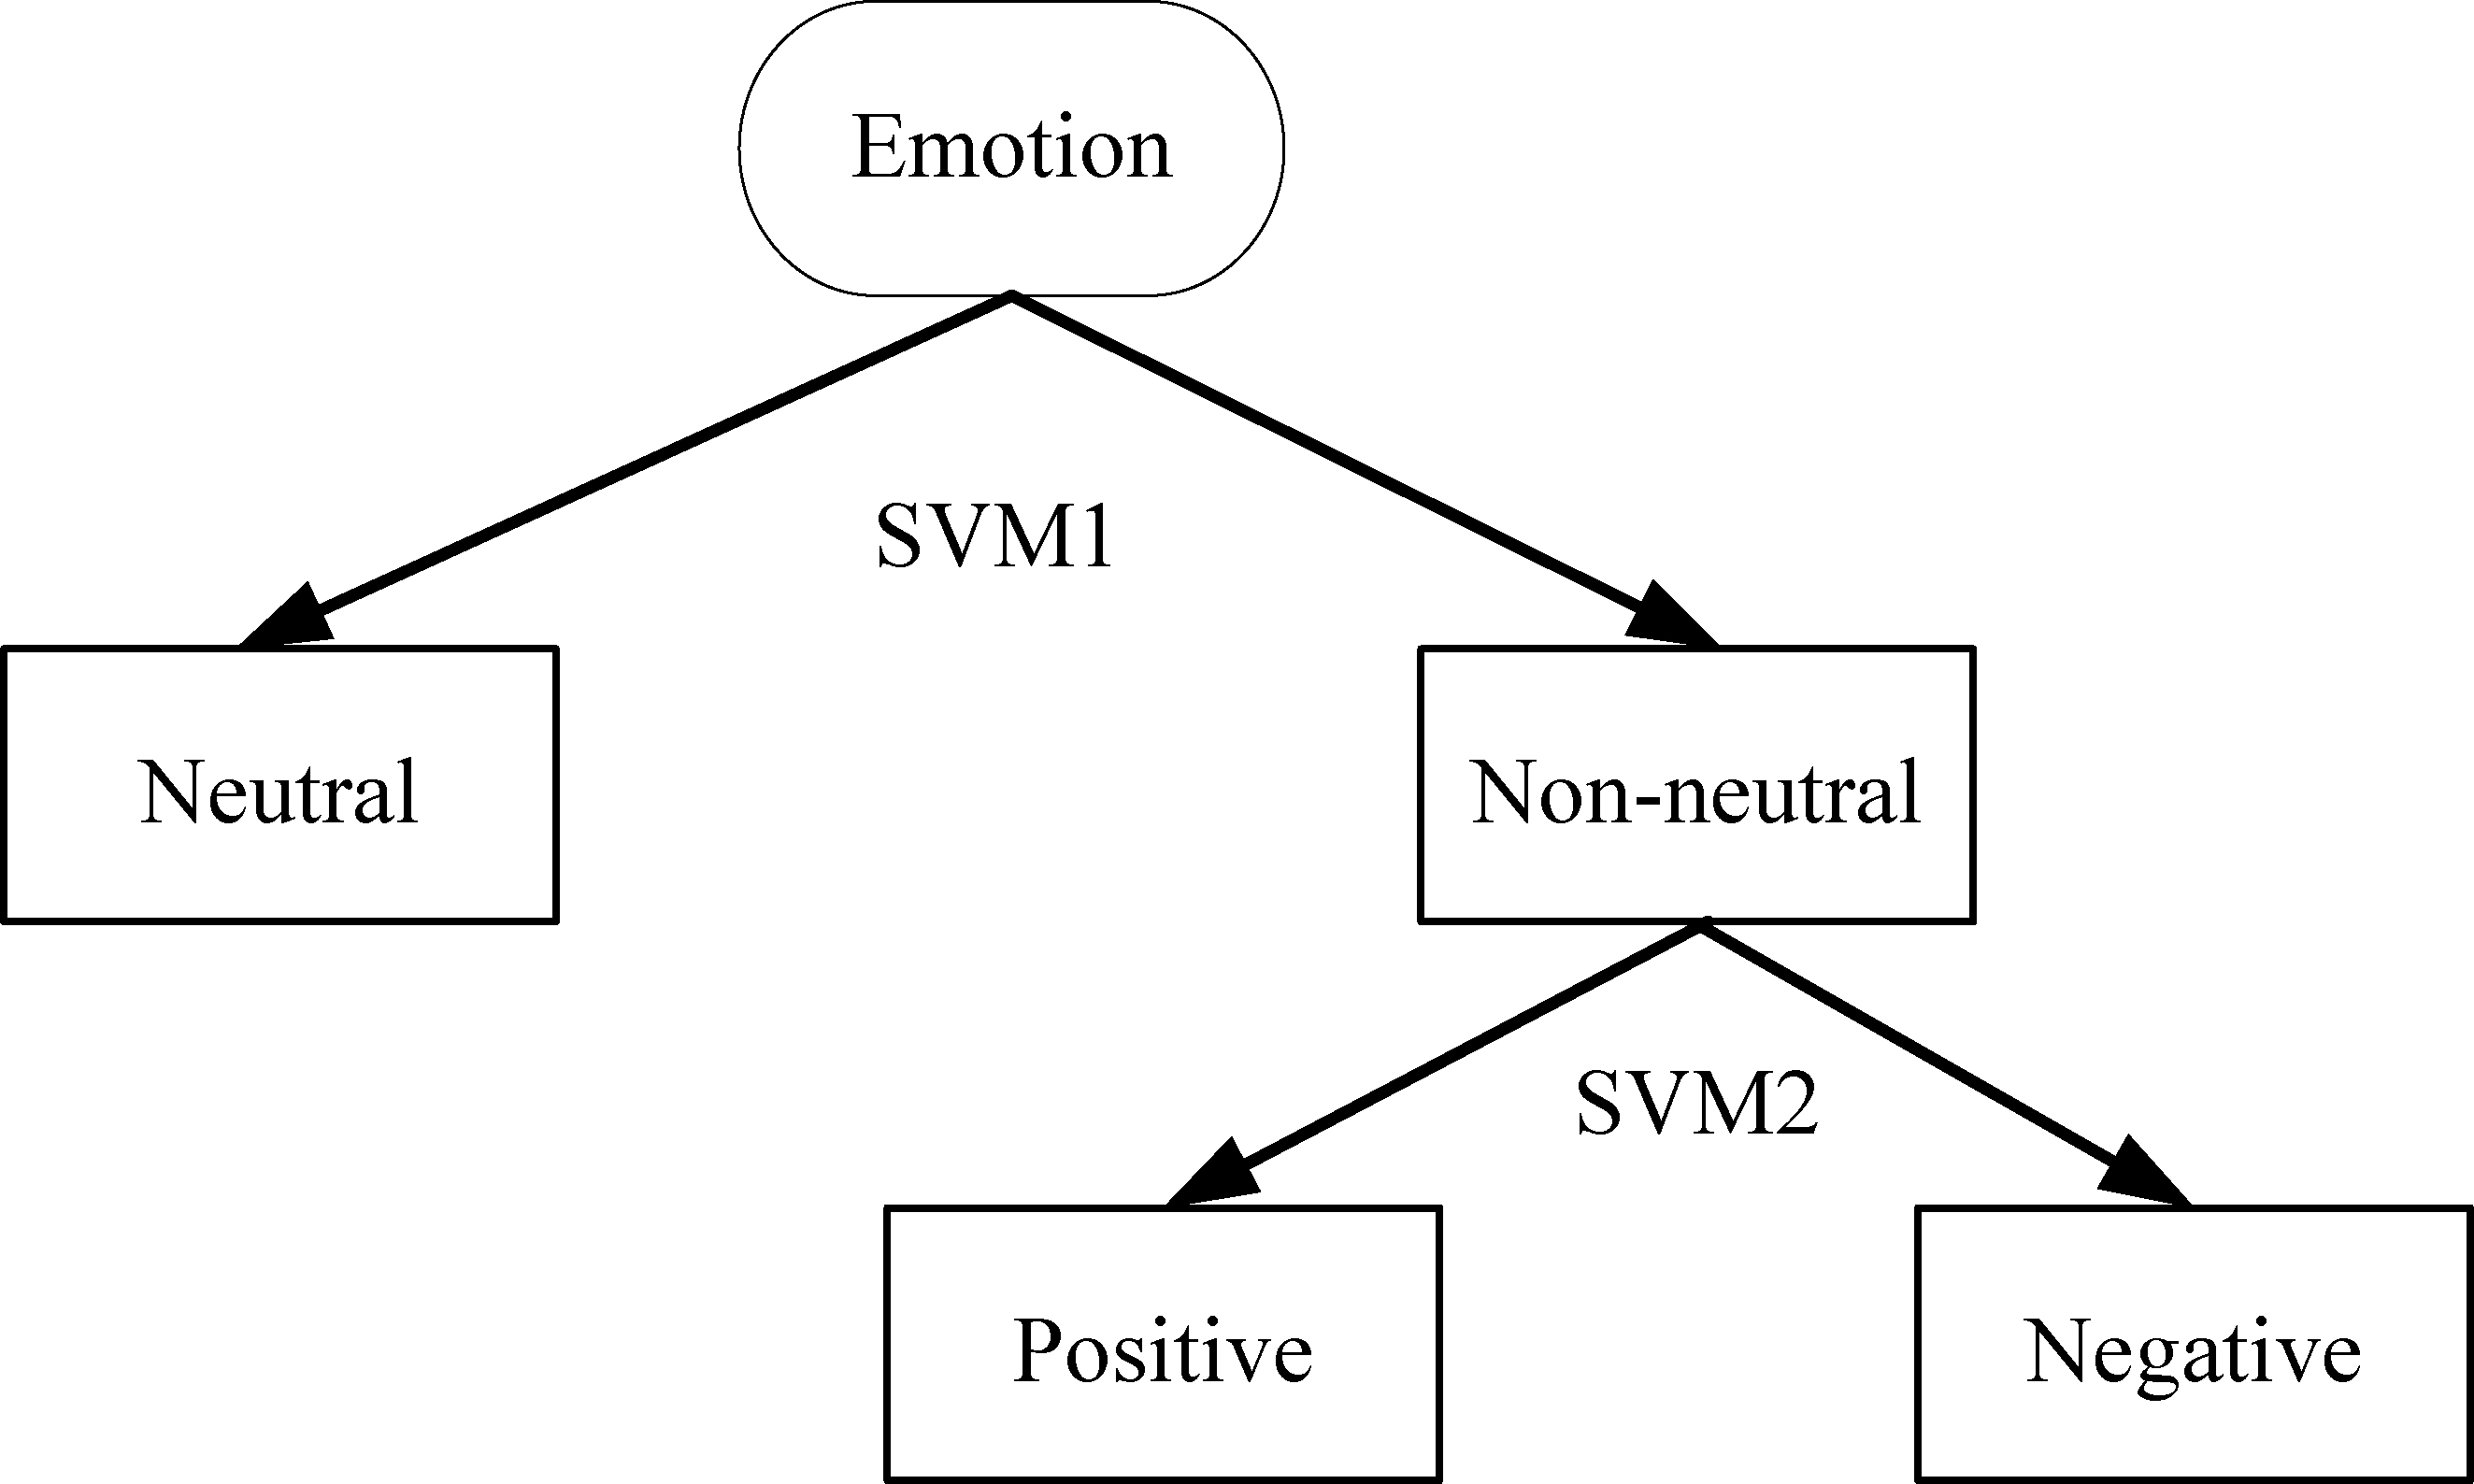
According to the above study, a total of 11 features were chosen for emotional classification in this paper. It can be noted from the analysis of Paragraph 3.2 that neutral and non-neutral emotions can be easily distinguished by the RESP and head posture features; thereby, two SVM was employed to classify emotions as shown in Fig. 9. The first one was used to distinguish between neutral and non-neutral emotions, and the second was used to distinguish non-neutral emotions into positive or negative [32]. For comparison, 16-channel EEG signal was collected during all experiments. A classical SVM classification method based on multi-channel differential entropy and PSD features was used, in which EOG interference in EEG was processed by a classical ICA algorithm. The accuracy of classification and the time consuming by the wearable DSP processor are compared in Table 5. All results show that compared with the classical emotion classification method, the presented method has a significant improvement of the classification accuracy and the time consuming has a great reduction.
Table 5
Classification accuracy and time consuming
| Subject | Proposed method | Classical method | ||
| Accuracy (%) | Time (second) | Accuracy (%) | Time (second) | |
| 1 | 92.5 | 17 | 89.3 | 339 |
| 2 | 85.7 | 18 | 78.3 | 342 |
| 3 | 90.5 | 18 | 87.4 | 349 |
| 4 | 90.2 | 19 | 85.5 | 378 |
| 5 | 85.3 | 18 | 83.2 | 351 |
| 6 | 84.2 | 18 | 83.7 | 343 |
Figure 9.
Classification scheme.
4.Conclusions and future work
For the purpose to reduce algorithm complexity and costly EEG equipment requirements, this paper presents an innovative method for emotional state classification based on multiple physiological signals, including EEG, ECG, respiration and head posture. Although this method requires the acquisition of multiple types of physiological signals, the total number of signals is greatly reduced and all selected features are easy to extract. In order to reduce hardware cost, an efficient EOG interference removal method was proposed in this paper, which makes it possible to realize all calculations on the wearable system in real time. By using the proposed method, the emotion classification becomes more practical, and users can wear this system to walk or work freely.
According to the validation tests, eleven easy-extracting features from single channel EEG, ECG, respiration impedance and head posture were proved to be related to emotions, which were selected for emotional classification. The experiment results show that compared with the traditional multi-channel EEG-based methods, the proposed method with SVM has a significantly reduction of cost while the classification accuracy has improved greatly.
This paper proves the validity and usability of the emotion classification method based on multi-physiological signals; but there is still a lot of work to be done. Firstly, this paper only discussed the relationship between a portion of features from physiological signals and emotion states briefly. A comprehensive feature selection method will help to enhance the effect of emotional classification. Secondly, the emotion states can be categorized into more types, for example, negative emotion can be fear, sad or anger, at least six primary emotions (happy, sad, anger, fear and disgust) can be identified in fact. Another problem is that the developed system is subject-dependent; the user needs to train the system before emotion classification. In the future, a small sample database will be integrated in this system, so that by using of migration learning, the system might have a better robustness, which is under investigation.
Acknowledgments
This work is sponsored by National Natural Science Foundation of China (Grant No. 61401117, 61301012 and 61201017), the National Science Foundation of USA (Grant No. CNS-1552163) and the Fundamental Research Funds for the Central Universities (Grant No. HIT.IBRSEM.2014082).
Conflict of interest
None to report.
References
[1] | Paul S, Simon D, Kniesche R, et al. Timing effects of antecedent- and response-focused emotion regulation strategies [J]. Biological Psychology, (2013) , 94: (1): 136-142. |
[2] | Li M, Lu BL. Emotion classification based on gamma-band EEG [C]. International Conference of the IEEE Engineering in Medicine & Biology Society. (2009) : 1323. |
[3] | Yang YH, Lin YC, Su YF, et al. Music Emotion Classification: A Regression Approach [C]. IEEE International Conference on Multimedia and Expo. (2007) : 208-211. |
[4] | Murugappan M, Ramachandran N, Sazali Y. Classification of human emotion from EEG using discrete wavelet transform [J]. Engineering, (2010) , 3: (4): 390-396. |
[5] | Rizon M. Discrete wavelet transform based classification of human emotions using Electroencephalogram signals [J]. American Journal of Applied Sciences, (2010) , 7: (7): 878-885. |
[6] | Nguyen T, Li M, Bass I, et al. Investigation of Combining SVM and Decision Tree for Emotion Classification [C]. IEEE International Symposium on Multimedia. (2005) : 5. |
[7] | Baveye Y, Dellandréa E, Chamaret C, et al. Deep learning vs. kernel methods: Performance for emotion prediction in videos [C]. International Conference on Affective Computing and Intelligent Interaction. (2015) : 77-83. |
[8] | Tang H, Zhao Y, He W, et al. An anti-interference EEG-EOG hybrid detection approach for motor image identification and eye track recognition [C]. Control Conference. (2015) : 4657-4662. |
[9] | Witte H, Glaser S, Rother M. New spectral detection and elimination test algorithms of ECG and EOG artefacts in neonatal EEG recordings [J]. Medical & Biological Engineering & Computing, (1987) , 25: (2): 127. |
[10] | Tong S, Bezerianos A, Paul J, et al. Removal of ECG interference from the EEG recordings in small animals using independent component analysis [J]. Journal of Neuroscience Methods, (2001) , 108: (1): 11-17. |
[11] | Devuyst S, Dutoit T, Ravet T, et al. Automatic Processing of EEG-EOG-EMG Artifacts in Sleep Stage Classification [J]. Ifmbe Proceedings, (2009) , 23: : 146-150. |
[12] | Wang Y, Liu X, Zhang Y, et al. Driving Fatigue Detection Based on EEG Signal [C]. International Conference on Instrumentation & Measurement. (2016) : 715-718. |
[13] | Sim H, Lee WH, Kim JY. A Study on Emotion Classification utilizing Bio-Signal (PPG, GSR, RESP) [C]. Art, Culture, Game, Graphics, Broadcasting and Digital Contents. (2015) : 73-77. |
[14] | Agrafioti F, Hatzinakos D, Anderson AK. ECG Pattern Analysis for Emotion Detection [J]. IEEE Transactions on Affective Computing, (2012) , 3: (1): 102-115. |
[15] | Dael N, Mortillaro M, Scherer KR. Emotion expression in body action and posture [J]. Emotion, (2012) , 12: (5): 1085. |
[16] | Cai J, Liu G, Hao M. The Research on Emotion Recognition from ECG Signal [C]. International Conference on Information Technology and Computer Science. (2009) : 497-500. |
[17] | Sharma PK. A Comparative Study on Machine Learning Algorithms in Emotion State Recognition Using ECG [C]. International Conference on Soft Computing for Problem Solving. (2014) : 1467-1476. |
[18] | Nakasone A, Prendinger H, Ishizuka M. Emotion recognition from electromyography and skin conductance [C]. International Workshop on Biosignal Interpretation. (2005) : 219-222. |
[19] | Snorrason Í, Smári J, Ólafsson RP. Emotion regulation in pathological skin picking: Findings from a non-treatment seeking sample [J]. Journal of Behavior Therapy & Experimental Psychiatry, (2010) , 41: (3): 238. |
[20] | Kuchel O, Cusson JR, Larochelle P, et al. Posture- and emotion-induced severe hypertensive paroxysms with baroreceptor dysfunction [J]. Journal of Hypertension, (1987) , 5: (3): 277-83. |
[21] | Guo HW, Huang YS, Chien JC, et al. Short-term analysis of heart rate variability for emotion recognition via a wearable ECG device [C]. International Conference on Intelligent Informatics and Biomedical Sciences. (2015) : 262-265. |
[22] | Wang Y, Zheng Y, Bai O, et al. A multifunctional wireless body area sensors network with real time embedded data analysis [C]. IEEE Biomedical Circuits and Systems Conference. (2016) : 508-511. |
[23] | Liu J, Xie F, Zhou Y, et al. A wearable health monitoring system with multi-parameters [C]. International Conference on Biomedical Engineering and Informatics. (2014) : 332-336. |
[24] | Liu C, Xu J, Cheng H, et al. Attitude Detection and Data Fusion Based on Sensor of MPU9250 [J]. Journal of Henan University of Science & Technology, (2015) . |
[25] | Zheng WL, Lu BL. Investigating Critical Frequency Bands and Channels for EEG-Based Emotion Recognition with Deep Neural Networks [J]. IEEE Transactions on Autonomous Mental Development, (2015) , 7: (3): 162-175. |
[26] | Lo PC, Leu JS. Adaptive Baseline Correction of Meditation EEG [J]. American Journal of EEG Technology, (2001) (2): 142-155. |
[27] | Wang L. Study and implementation of three-lead weak EEG signal extraction method based on STM32 [D]. Harbin Institute of Technology, (2014) . |
[28] | Lai CP, Ruan Q, Narayanan RM. Hilbert-Huang Transform (HHT) Analysis of Human Activities Using Through-Wall Noise Radar [C]. International Symposium on Signals, Systems and Electronics. (2007) : 115-118. |
[29] | Klimesch W. EEG alpha and theta oscillations reflect cognitive and memory performance: a review and analysis [J]. Brain Research Brain Research Reviews, (1999) , 29: (2-3): 169. |
[30] | Duan RN, Zhu JY, Lu BL. Differential entropy feature for EEG-based emotion classification [C]. International IEEE/EMBS Conference on Neural Engineering. (2013) : 81-84. |
[31] | Hosseini SA, Naghibisistani MB. Emotion recognition method using entropy analysis of EEG signals [J]. International Journal of Image Graphics & Signal Processing, (2011) , 3: (5): 30-36. |
[32] | Iacoviello D, Petracca A, Spezialetti M, et al. A real-time classification algorithm for EEG-based BCI driven by self-induced emotions [J]. Computer Methods & Programs in Biomedicine, (2015) , 122: (3): 293-303. |


