
The non-contact biometric identified bio signal measurement sensor and algorithms
Abstract
In these days, wearable devices have been developed for effectively measuring biological data. However, these devices have tissue allege and noise problem. To solve these problems, biometric measurement based on a non-contact method, such as face image sequencing is developed. This makes it possible to measure biometric data without any operation and side effects. However, it is impossible for a remote center to identify the person whose data are measured by the novel methods. In this paper, we propose the novel non-contact heart rate and blood pressure imaging system, Deep Health Eye. This system has authentication process at the same time as measuring bio signals, through non-contact method. In the future, this system can be convenient home bio signal monitoring system by combined with smart mirror.
1.Introduction
In a patient monitoring system, it is essential to continuously and intensively monitor the state of the patient. Bedside monitor is currently used as major medical equipment. A patient monitoring system has the effect of reducing the manpower, associated with monitoring the patients. And medical doctor can manage a patient through rapid understanding of patient’s medical condition. The basic function of the patient monitors is to collect and to process the bio-signal of the patient from the various sensors attached to the patient [1, 2].
However, it is not suitable for the health management of discharged patients or a person who have never been to the hospital. The current medical system focuses on prevention, rather than treatment, of disease. So an accurate biometric data measurement of the patients and the rapid care based on those biometric data are needed in order to prevent diseases. By apply the changes in the medical system, the medical devices have been more miniaturized and simplified. And more wearable or body-implantable devices have been developed for accurate measurement of a patient’s Bio signals. These devices have the advantage of measuring patient’s data easily without visiting the hospital, and of measuring the data for nearly 24 hours. However, the wearable or body-implantable devices also have things that need to be improved.
Recent researches are being focused for develop a method of measuring a bio-signal without any operation to making the patients to feel comfortable rather than attaching to the body or implanting inside the body. For example, there are many smartphone applications which are measuring the heart rate or oxygen saturation by camera. Using a video camera in measuring patient’s bio signal does not need any special operation. With this, the patients can be monitored in real time, and medical doctor is able to react immediately to an acute condition of the patient. For this reason, various researches and devices focused to improve accuracy of measuring bio signals. However, not only the bio signals but also patients’ past history is important to diagnosis. Conventional systems do not have an identity recognition process or require additional operation. So, these systems are difficult to find patients’ past history, due to lack of identification process. In this paper, we propose authentication process at the same time as measuring bio signals, through non-contact method.
In the earlier studies, they mentioned that heart rate and respiratory rate can be measured by only cameras and proper lighting, and the face is the best part to extract a Photoplethysmography (PPG) signal [3]. In addition, if it were to be measured by the RGB camera, the green channel is more suitable than the other red or blue for measuring the heart rate and respiratory rate. The reason for this is that the light absorption wavelength of hemoglobin and oxyhemoglobin causing color factor in blood is 520
In other studies, they defined the face area with a webcam using facial recognition system and then were enabled to measure the heart rate and respiratory rate even in situations with a large number of people [4, 5]. In this study, three independent factors from the RGB channels of the camera was extracted by using a Blind Source Separation (BSS), and the Independent component Analysis (ICA) algorithm was used in this process. In this study PPG was extracted from one of three independent factors extracted.
In addition, another recent study has proved that using a COG (cyan, orange and green) channel is more suitable than using RGB channels for measuring biometric data [6]. This is because each channel is Cyan (470
In spite of several recent studies in progress, there are a number of problems existing in measuring biometric data. The most frequently occurring problem is that the measured value can be changed sensitively according to the lighting conditions and the movement of measurement target. In particular, in the case of rotation, a difficulty occurs in continuous measurement since the coordinate that measures the color can change significantly. Therefore, it is necessary to develop a system that is able to offset the illuminance variation and can perform continuous measurement regardless of the movement of the measurement target.
In this paper, we developed a monitoring system that is implemented to improve the bio signal measurement methods using conventional medical devices. This system is able to identify the user during collect and process the bio signals of the user. This system was intended to overcome the limitations in the preceding studies.
2.Methods
The proposed system is based on biometric data measurement using a camera. First, it recognizes the face of the patient by using a camera and compares the face of the patient with a database, and then is subjected to a process of confirming the identity of the user. Then system measure bio signals of the person whose identity is verified with facial recognition. System measure heart rate by tracking the face of the target person, and extracting the color of the same coordinate and observe color change of the pixel continuously. With this system, the identity and the bio signals of the person in the image can be measured by using only the image sequences. In this system we used the Matlab2013a to analyze bio signal. The system is proceeding in the following order below.
2.1Face position detection using PCA (principal component analysis)
Form Eigen face (common information of the facial types) using PCA, then specify the part that has the similar form to the input image as a person’s face, and track it. PCA is a secondary statistical method using the statistical nature to the mean and variance. For input data, PCA finds a set of orthogonal normalized axes, which points in each direction of the maximum normalized covariance with respect to the input data. This has the advantage of reducing the dimensions of the material efficiently by finding the most important axes of input data. However, PCA is difficult to show the most basic features in the video because it only utilizes secondary statistics.
Given data
The method for representing data by PCA is as follows.
The feature vector space obtained by applying PCA results in the recognition rate falls because it includes the features such as changes in illumination of the image and in facial expression. Considering this, it only takes the approximate location of the face through the PCA and extracts the feature points in that location. We intend to improve the recognition rate by recognizing the face using the comparison of the feature points.
2.2The feature point extraction in the detected face position
Since a face recognition method usually uses the entire pixel information, a localized area of a face image can be affected by small lights, position, and any change in facial expression, resulting in affecting the recognition algorithm. This makes a face recognition method easily influenced by lighting, posture, and facial expression changes. On the other hand, since the model-based face recognition method can be configured in consideration of model, lighting, posture, facial expression change, it can reduce the influence of these factors at the time of recognition. Gabor feature vector (Coefficients obtained by the convolution of Gabor Wavelet Kernel about the face image feature points), a feature vector used when configuring the model, have been widely selected for facial recognition because it is somewhat robust for lighting, posture, facial expression changes [7]. EBGM (Elastic Bunch graph matching) is the leading face recognition method using Gabor feature vectors [8, 9]. Face recognition method based on EBGM performs the face recognition by finding feature points from the face, and by using Gabor coefficients obtained from these feature points.
Image-based face recognition techniques have the disadvantage of not being able to respond to a changing environment because it uses the entire image information. EBGM, the feature vector-based technique, which uses local-information, was developed in order to supplement this disadvantage. EBGM is done by obtaining the Gabor coefficients from the feature points, facial geometric information of the eyes, nose, mouth, and then by verifying the person who has the highest similarity when comparing the similarities between Gabor coefficients.
EBGM extracts only the local frequency characteristics of the image through Gabor wavelet function. It is then divided it into a real part and an imaginary part using the Gabor wavelet filter, and discretize each of them, and then create a Gabor wavelet mask. After that, coefficients are obtained by rising integral with the pixel values of the feature points from the face area image.
Gabor jets are the coefficients obtained from each feature point, and “Bunch” is a bunch of Gabor jets. The Bunch graph is the collection of a bunch of facial feature points. The model bunch graph is made by creating specific training image of
A model bunch graph is used to obtain the feature points of the face. Feature point extraction used in RBGM is influenced largely by the number and type of models bunch graph. Therefore, the model bunch graph is needed to be created in consideration of a variety of gender, age, lighting, posture, and facial expressions.
2.3Verification of the identity of the face detected by comparing the feature points
The point matching method is the most widely used comparison method in the area of computer vision and pattern recognition. The 2 types of point matching are divided into rigid matching and non-rigid matching, depending on the strain of the target object extracted from the image sequence. Non-rigid matching is much more complicated, compared with rigid matching. In the case of non-rigid matching, it is difficult to compare because the relationship between each feature points has the severe degree of variation, depending on the strain of the target object. Facial features correspond to very severe non-rigid matching because the variation is severe depending on facial expressions and the angle. The effective non rigid matching algorithm is needed in order to solve them.
In this paper, for effective verification of identity, we performed the point matching using the Topology Preserving Relaxation Labeling (TPRL) algorithm, the modified version of Robust Point Matching-preserving Local Neighborhood Structure (RPM-LNS) algorithm, in comparison of feature points.
2.4Topology preserving relaxation labeling (TPRL)
In the method of RPM-LNS, the compatibility coefficient value was a binary value of zero or one, depending on whether a point and its neighboring point have corresponding points [10]. In TPRL, the correlation between point pairs is measured by the proposed compatibility function, which quantifies the amount of similarity and spatial smoothness between the point pairs in n-discrete values. This contextual information combined with a relaxation labeling process is used to search for a correspondence. Then the transformation is calculated by the thin plate spline (TPS) model [11]. These two processes are iterated until the optimal correspondence and transformation are found. The proposed relaxation labeling, with a new compatibility coefficient, preserves a topology of point set.
2.5Measurement of HRV
PPG measurement with a camera extracts a PPG signal
The video image
(1)
The intensity of illumination
The HRV measurement method using a camera in the detected face area is basically the same as the PPG measuring principle. PPG measurement is a method for estimating the heart rate by measuring a blood flow in the blood vessel by using the optical properties of biological tissues. The flow of blood between the diastolic and systolic heart gets slow when the blood flows into the peripheral vascular, causing the transparency changes in the blood vessels. PPG is basically sensing the transparency change in the blood vessel.
This form can be clearly measured in peripheral tissues in areas such as the face, fingers or earlobe, and the general PPG measurement is performed using a finger. If the same principle is applied to the face, the blood flow in the facial skin will also be changed depending on the heartbeat, and this can be measured and analyzed through the camera, and then the heartrate can be estimated.
Divided the blood flow evenly into the area of interest (ROIs) in the intensity of the extracted signal
In addition, if the intensity of illumination
(2)
In the formula above,
In order to estimate the exact heart rate condition, it is necessary to remove the various noises and only find a physiologically valid signal. Blind Source Separation (BSS) technique is one of the techniques performed in these operations. BSS is the method which separates and finds the valid signals on the assumption that the measured signals cannot be found instinctively and the valid signals mix as they are measured. Although there are several methods in performing BSS, in this paper, the blind source will be extracted using Independent Component Analysis (ICA).
2.6Part where the heart rate is measured
In the face, the area in which the capillaries are dense is the forehead and cheeks. Because of this, the body temperature of a person is usually measured in the forehead or cheeks. Similar to measuring the body temperature, when measuring PPG in the face, it is appropriate to measure the area which has a big change in hemoglobin concentration in accordance with the heart rate due to the dense capillaries. Thus, this system uses forehead and cheeks for measuring sites as candidate parts. But the cheeks were ultimately chosen as a measurement part because the forehead can be covered with hair depending on the person.
When the feature points of the face are extracted, the following placeholders are used:
(3)
2.7Blood pressure measurement
The cuff-based blood pressure measurement method is the most commonly used non-invasive method of measuring blood pressure. However, the disadvantage to this method is that the continuous blood pressure data for the blood pressure requires an interval of 1–2 minutes between the measurements in order to reduce the error. Because of this, this method can’t be used to measure the change in the blood pressure in a short period of time, resulting in not being able to do an immediate response to blood pressure changes. In order to resolve this problem, a method of measuring blood pressure have been developed to measure the blood pressure by using a time difference between the pulse rate on the fingertips and the heart [12].
In this paper, like the conventional method, the blood pressure was measured by using the pulse time difference between the heart and fingertips, and the pulse time difference between the heart and face.
For improved convenience, we developed a novel blood pressure measuring method without ECG patch. However without ECG patch, we can’t calculate pulse transit time. So in this method, we estimate ECG peak time for calculated pulse transit time.
(4)
In the formula above,
2.8S p O 2
Generally, the oxygen saturation rate
(5)
In the system, we made the light wavelengths of 765 nm and 880 nm to emit light alternately in a half sampling rate of the camera by positioning 6
(6)
3.Results
We verified the difference between the actual heart rate and the measured data value taken by a camera, which was obtained by comparing the HRV value measured by using the value change of Green channel data in a specific face with the value obtained with
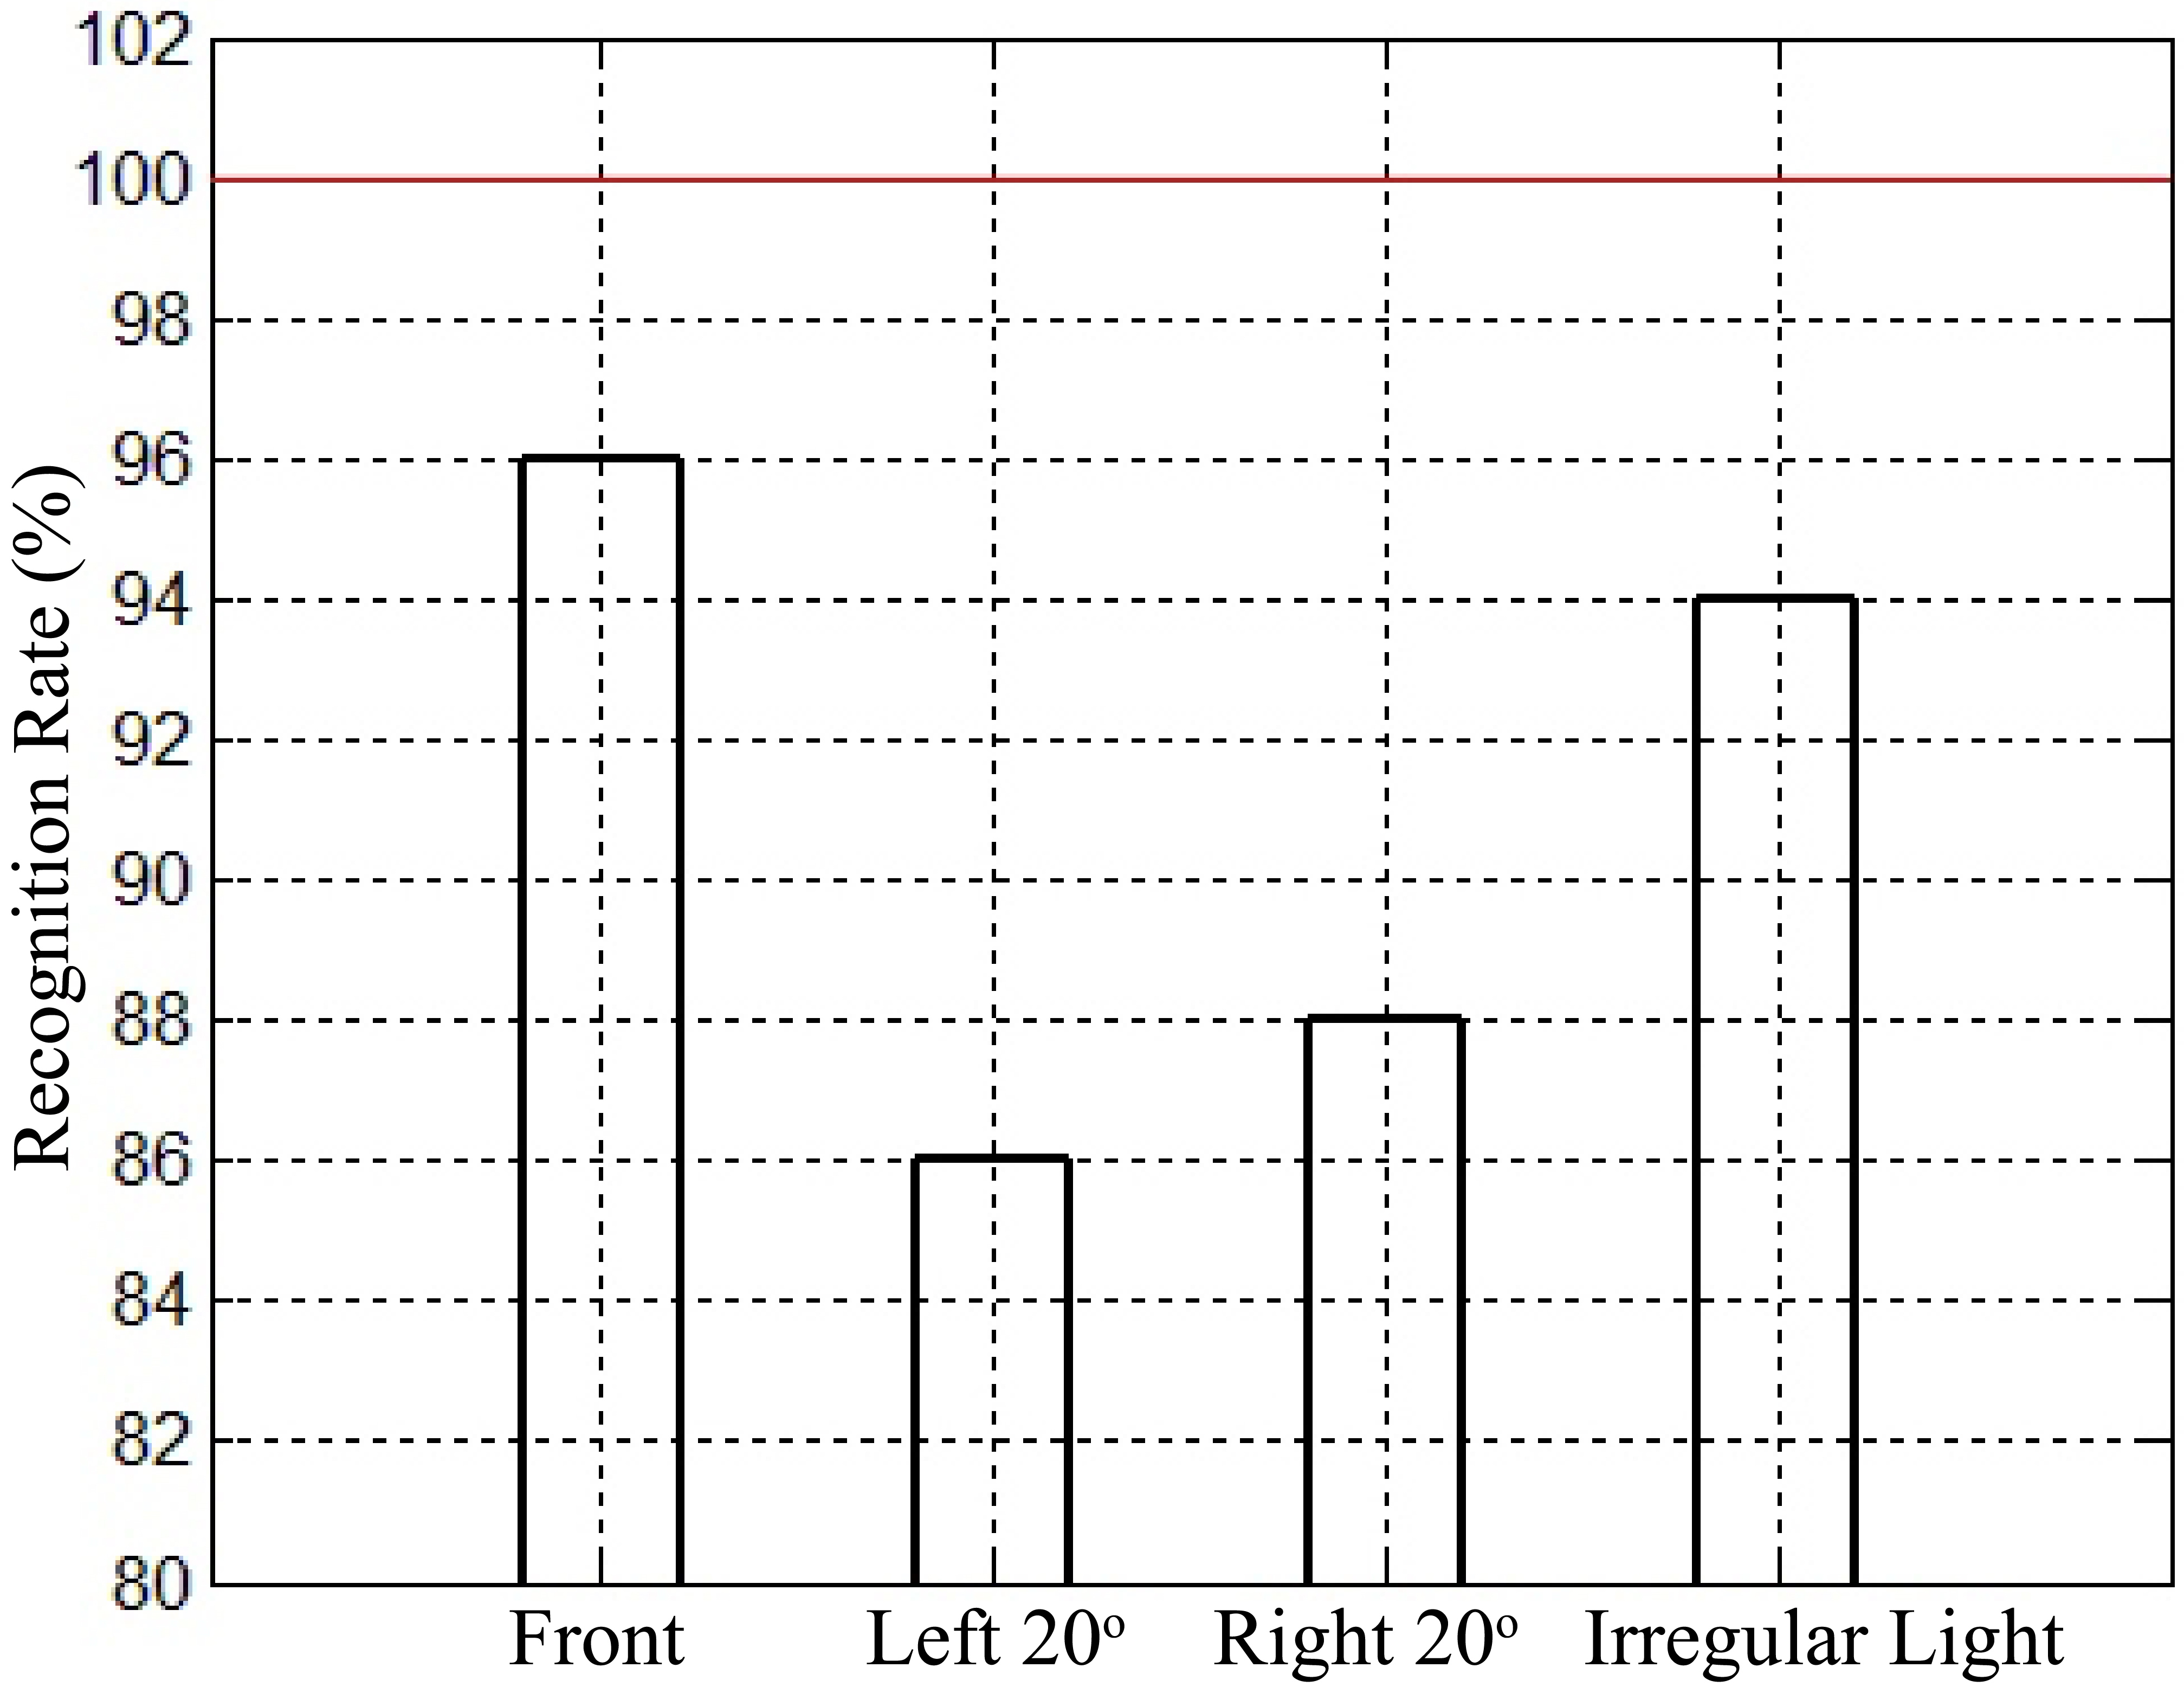
In the face recognition experiment, we conducted the face recognition on the front side, right and left side of the face, and under irregular lighting. This experiment was conducted on only 50 people. Recognition rate of this system exhibited 96.0% when trying to recognize the front side of face, exhibited 86.0% from the sides of the face. In addition, the recognition rate under the irregular lighting exhibited 94.0%.
The experiment of measuring the heart rate was performed in bright light and dark light and the 1st to 5th experiments were done in bright fluorescent lights, while the 6th to 10th experiments were conducted in dark incandescent lighting. We have processed the measurement of the heart rate by the photographed image under bright fluorescent light (the exact value of ambient light is measured after) at the peak value of 30–35 seconds basis, and this showed the differences that the value of the heart rate was the same or one less, when measured by each channel of RGB. The G-channel filtered the same in comparison to the other channel, but showed a uniform shape. In the case of data measured under incandescent light, since the measured data is processed by measuring the change in the complexion way, filtering was done in a low light, but relatively irregular pattern was observed compared to bright fluorescent light. The experiment was conducted 10 times in total and the accuracy of the average heart rate showed 99.1%.
We have conducted an experiment on the error rate of each algorithm to prove the effectiveness of the algorithms used for the comparison of feature points. In these experimental methods, we did a comparison by calculating a distance error for each feature point occurring when matching feature points of the database and feature points of the image sequences.
As a comparison target, we chose Iterated Closet Point (ICP) algorithm, the Thin Plate Spline Robust Point Matching (TPS-RPM) algorithm and the Shape Context (SC) Method, which are commonly used in point matching.
Table 1
The minimum, maximum and mean error values of each algorithm
| Error | TPRL | TPS-RPM | ICP | SC |
|---|---|---|---|---|
| Mean Error | 4.771 | 4.854 | 4.872 | 6.844 |
| Min Error | 3.002 | 2.190 | 2.169 | 3.825 |
| Max Error | 7.510 | 9.185 | 8.873 | 1.355 |
Figure 1.
Diagram of Deep Health Eye.
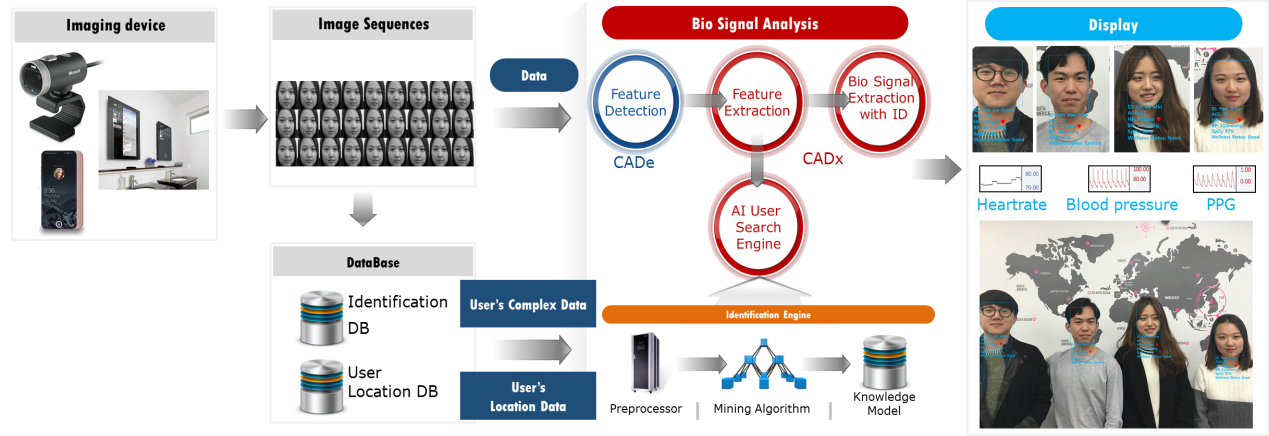
Figure 2.
Comparison of the feature points (Left: Database, Right: Image sequence).
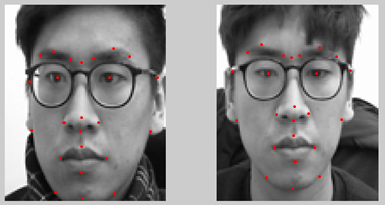
In order to minimize the strain, this experiment was conducted by adjusting the image sequence in a similar state with the database, and then by comparing the extracted feature points in a state of looking towards the front. Each algorithm was compared based on the same feature points and the mean error value is as follow Table 1.
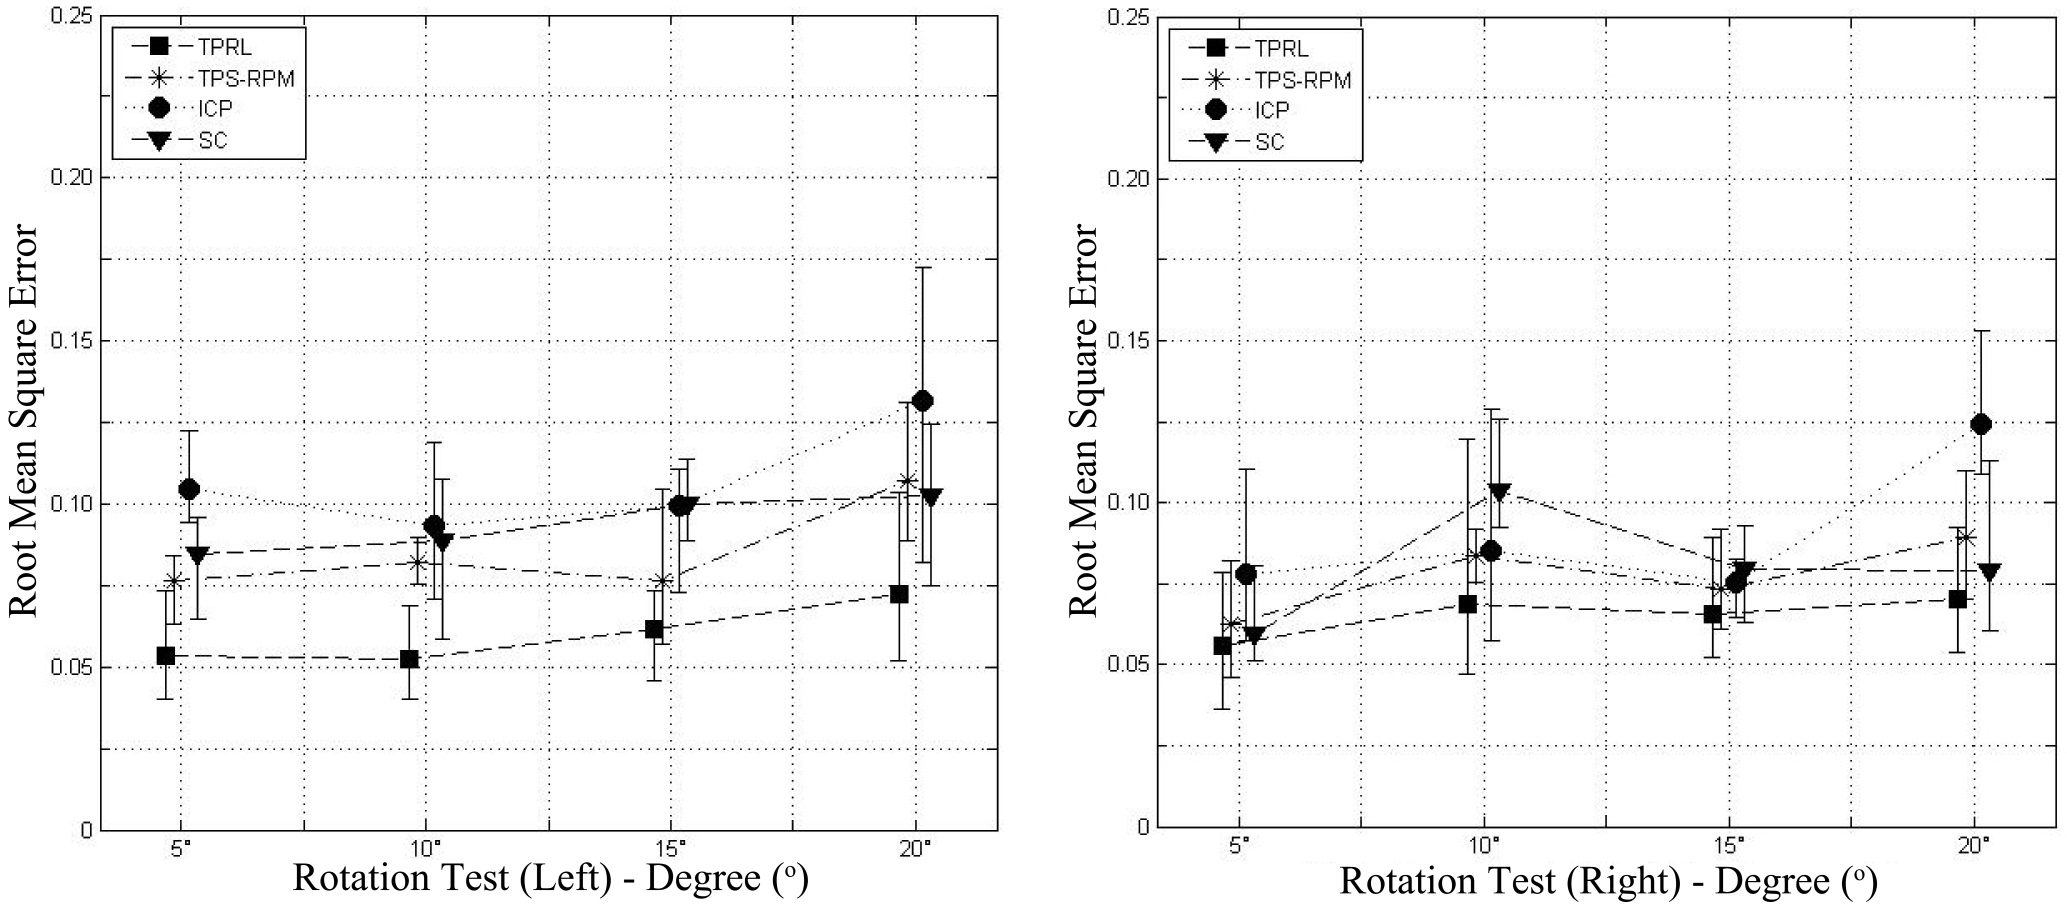
In addition, an experiment was conducted on the error rate of rotation or in noisy situations or in an occlusion of the target object. In a strain due to the rotation, we conducted the experiment about the error value under duress by modifying the change value from 5
Table 2
The error values of the rotation test
| Rotation | TPRL | TPS-RPM | ICP | SC |
|---|---|---|---|---|
| Right 5 | 5.557 | 6.261 | 7.772 | 5.919 |
| Right 10 | 6.876 | 8.340 | 8.517 | 1.034 |
| Right 15 | 6.563 | 7.339 | 7.547 | 7.937 |
| Right 20 | 7.028 | 8.906 | 1.240 | 7.880 |
| Left 5 | 5.365 | 7.647 | 1.044 | 8.162 |
| Left 10 | 5.234 | 8.208 | 9.327 | 8.872 |
| Left 15 | 6.157 | 7.620 | 9.949 | 1.001 |
| Left 20 | 7.256 | 1.073 | 1.317 | 1.026 |
Table 3
The error values of the noise test
| Noise | TPRL | TPS-RPM | ICP | SC |
|---|---|---|---|---|
| 0% | 4.774 | 7.831 | 1.002 | 9.183 |
| 10% | 5.037 | 7.778 | 1.072 | 8.852 |
| 20% | 5.060 | 7.864 | 1.042 | 9.045 |
| 30% | 5.137 | 7.901 | 9.476 | 8.730 |
Table 4
The error values of the occlusion test
| Occlusion | TPRL | TPS-RPM | ICP | SC |
|---|---|---|---|---|
| 0% | 5.200 | 6.666 | 7.100 | 7.323 |
| 10% | 6.713 | 7.732 | 6.889 | 1.056 |
| 20% | 6.867 | 7.906 | 7.093 | 1.459 |
| 30% | 7.998 | 1.423 | 8.490 | 1.601 |
Figure 3.
PPG estimation on face.
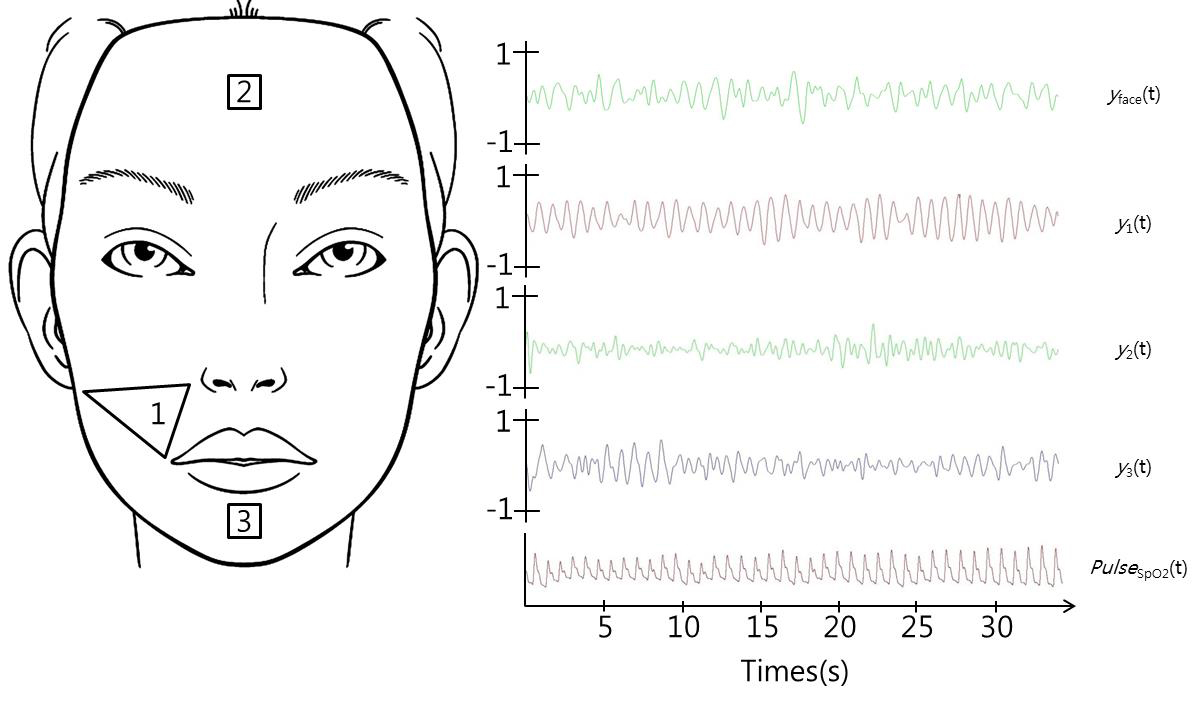
Figure 4.
Pulse transit time.
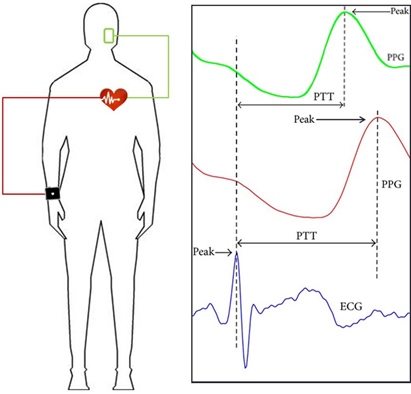
Figure 5.
Light source system for measuring
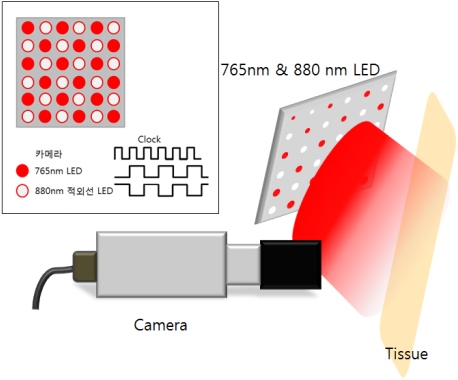
Figure 6.
Identity recognition rate.
In the rotation transformation experiment, the results were as below on the left and right respectively (Table 2). Four algorithms achieve similar matching performance until rotation. However, as the rotation degree increases, we see that TPRL shows robustness, compared to other algorithms. The increased mean RMS error from 5
Figure 7.
HR measurement comformility rate.
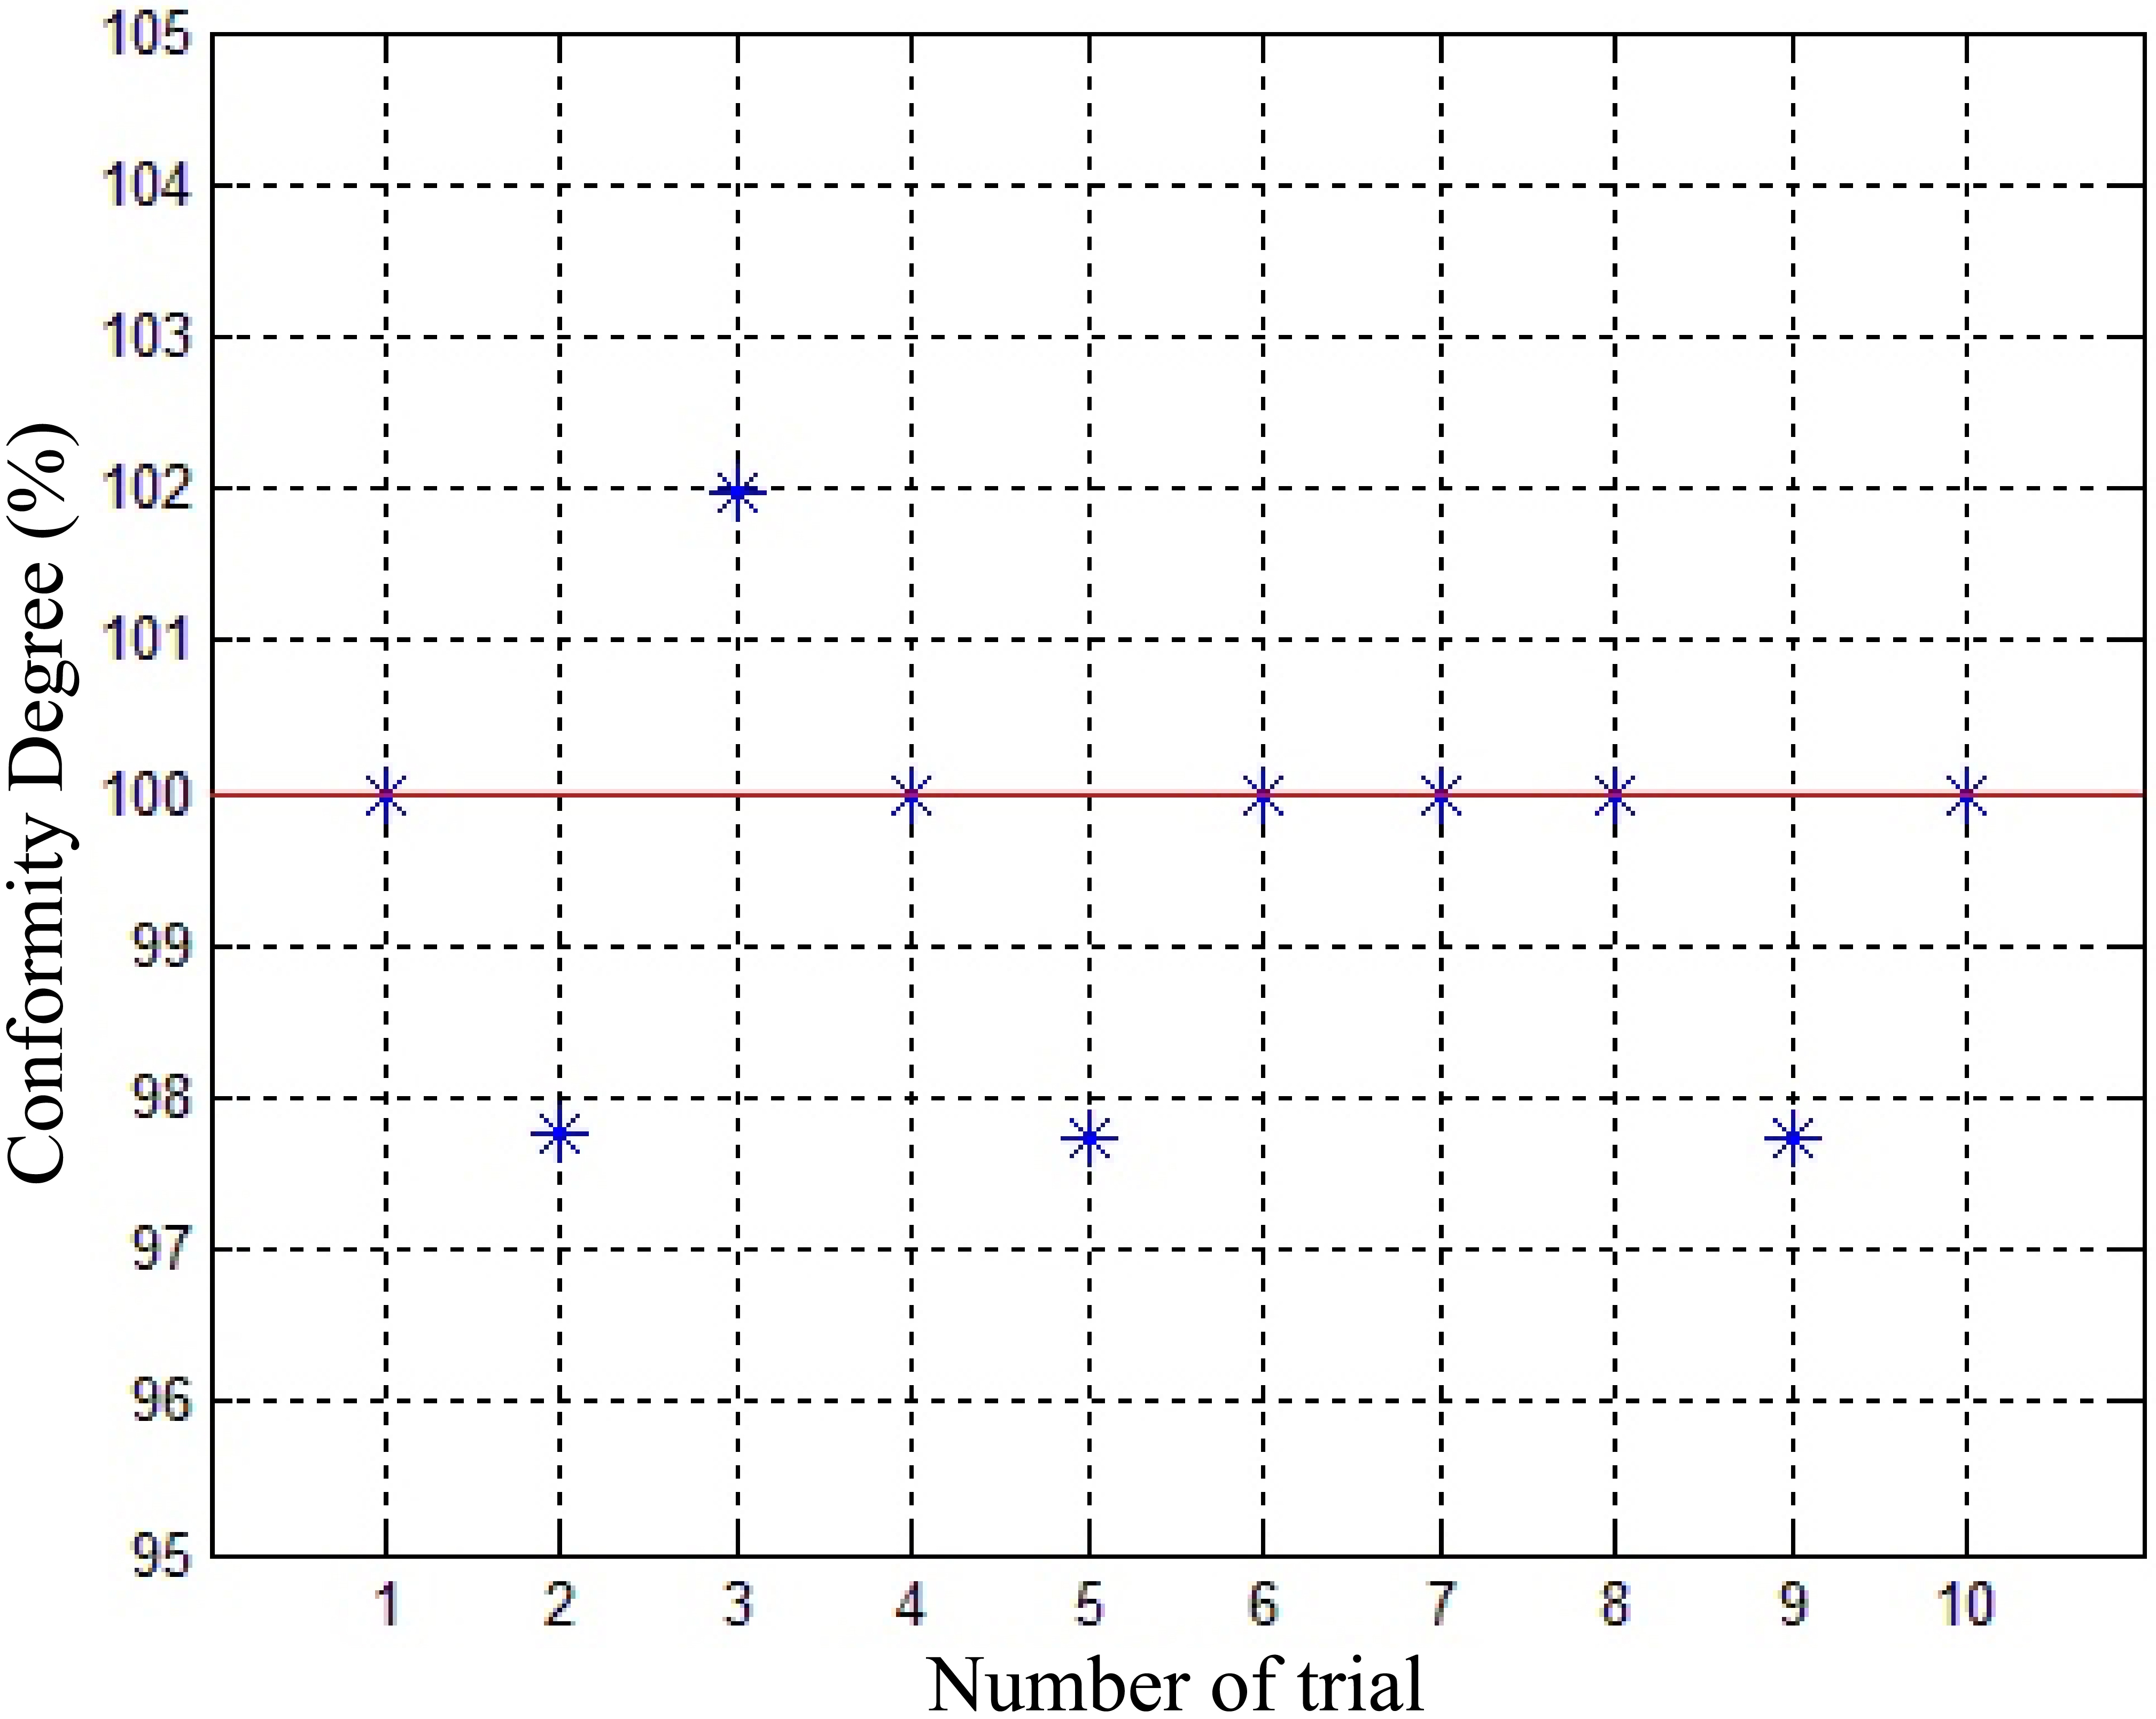
Figure 8.
Mean error of algorithm.
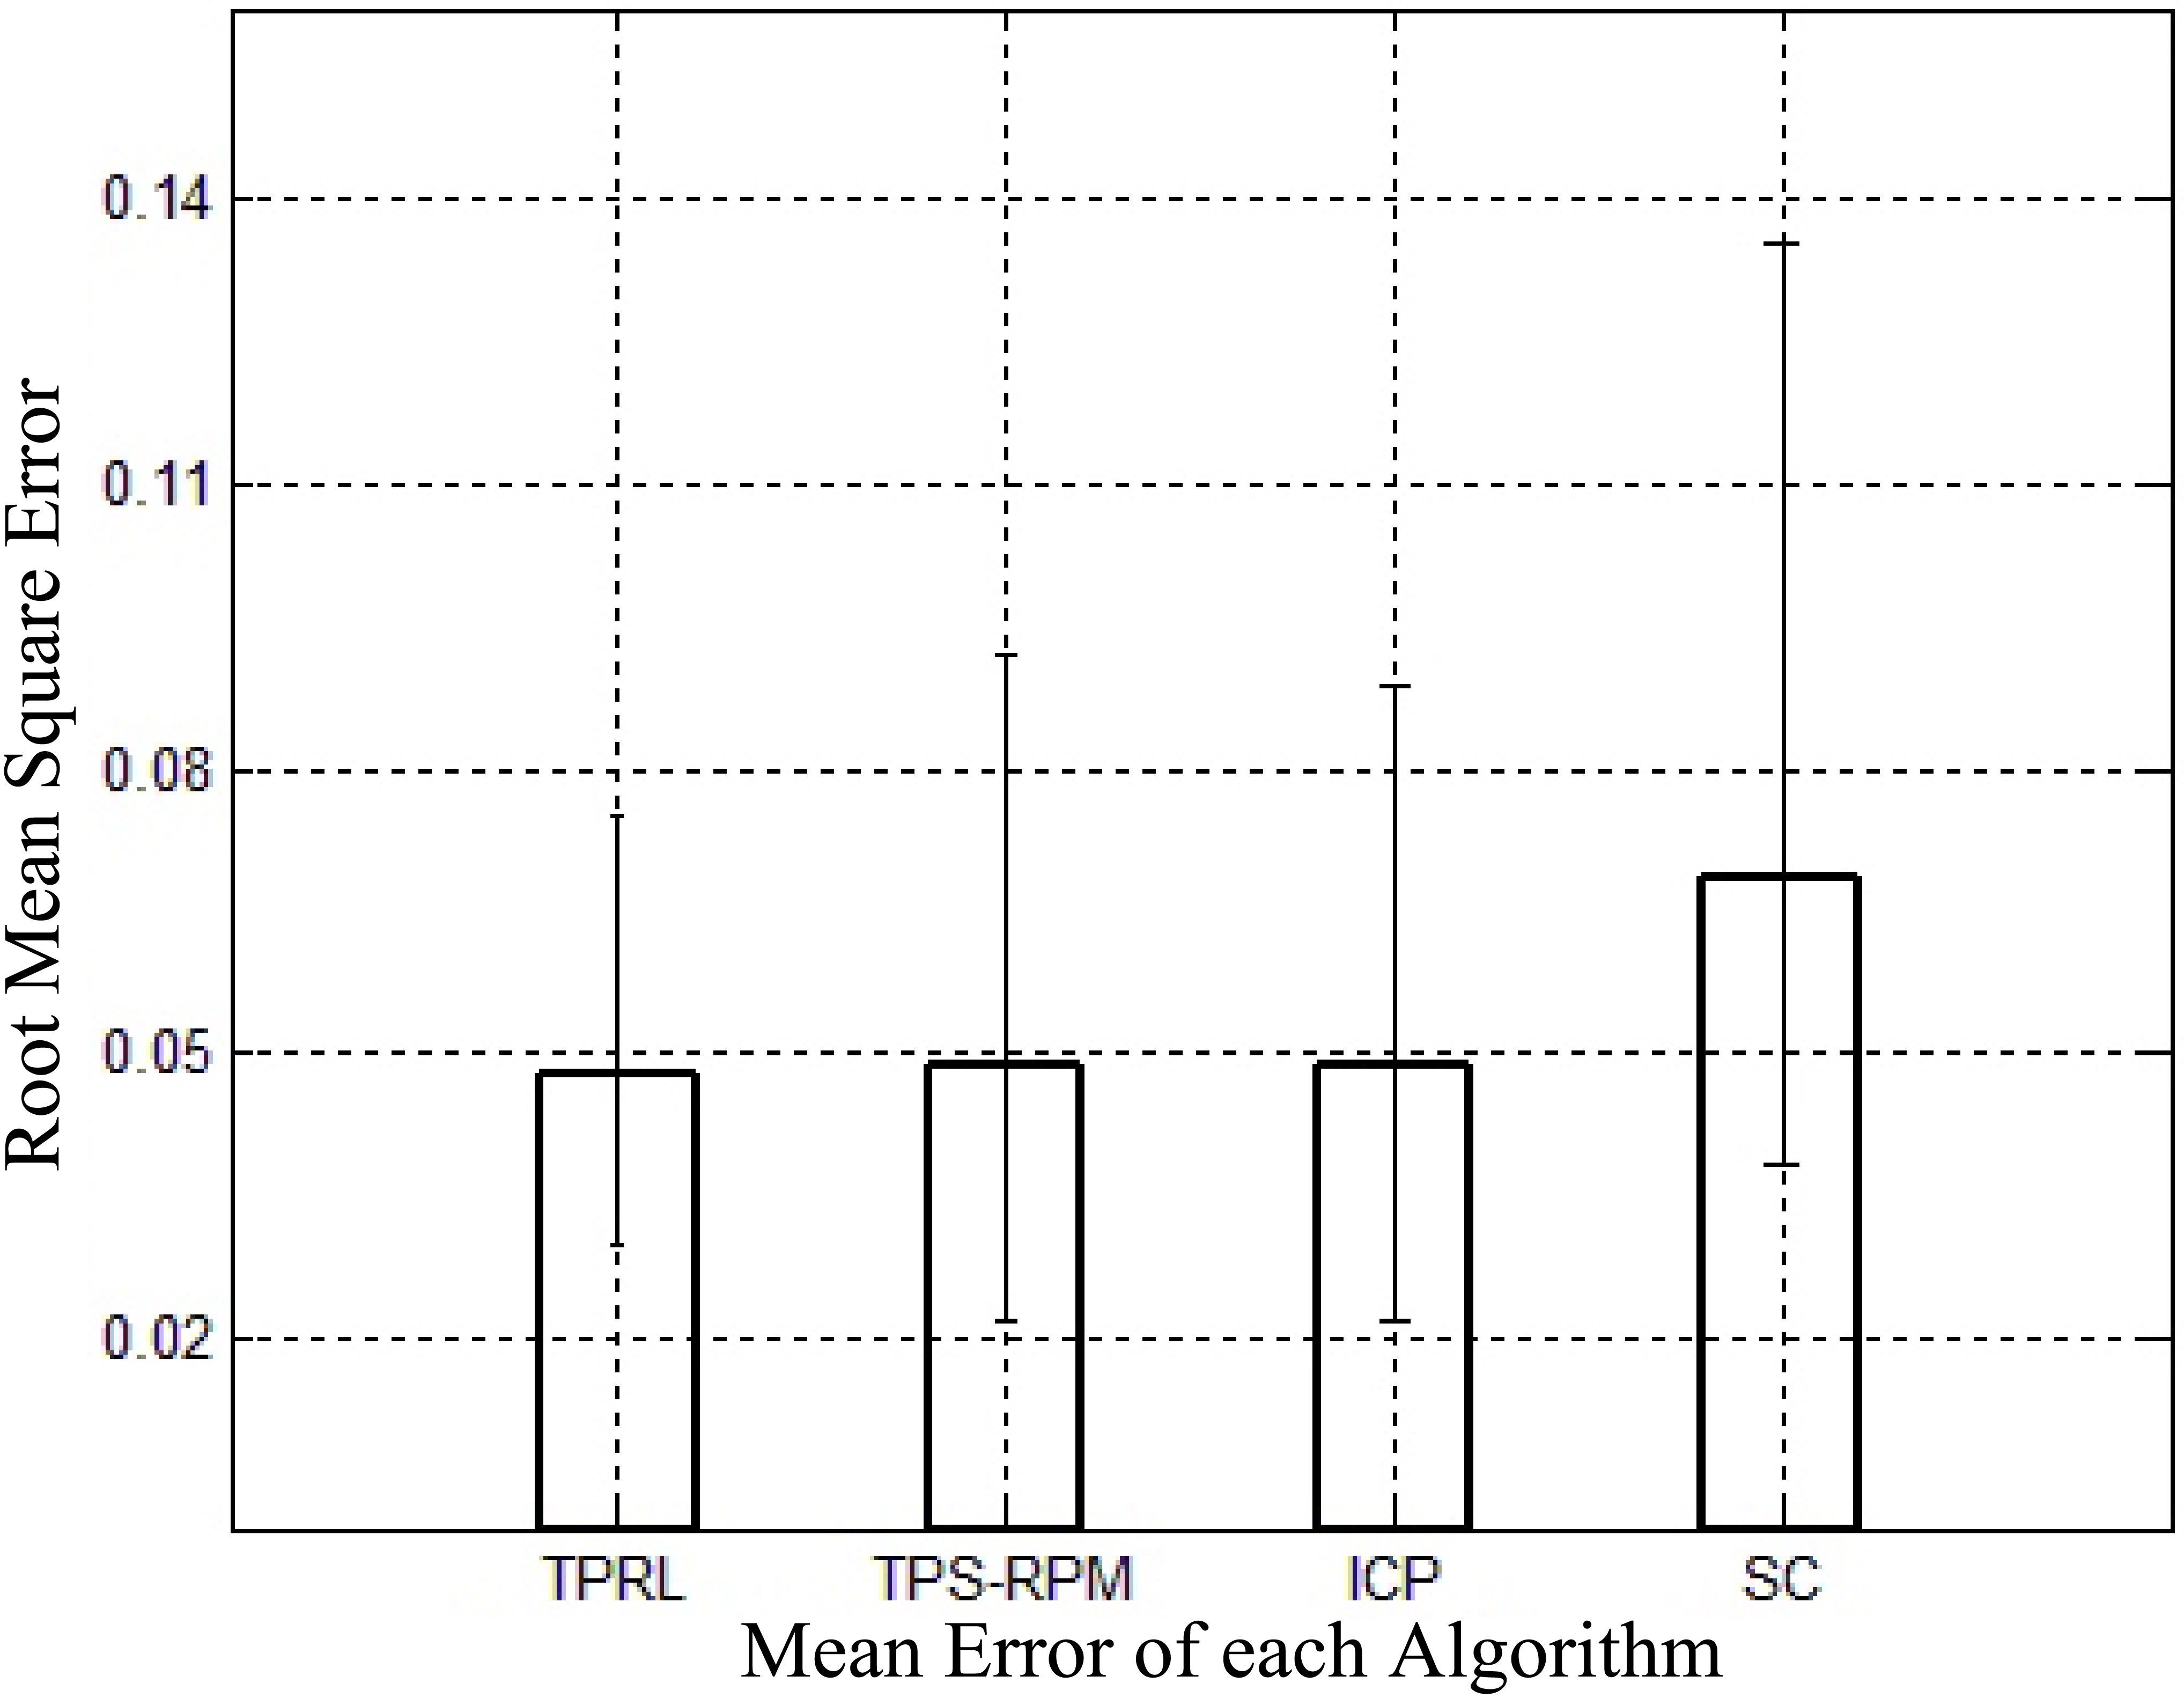
Figure 9.
Mean error of rotation test.
The results of occlusion strain experiment are as Table 4. With a 0.3 occlusion ratio, the mean RMS error is 0.08 mm, compared to 0.085 mm in ICP, the second smallest error among the algorithms.
In this study, to measure non-contact method for pulse oximetry, we used image sequence. 40 by 40 pixels which had enough photon from acquired image sequence were selected. After the selected area signal divided into R, G, B channels, we calculated mean of G channel. Then, odd frame and even frame were divided. 0.5
Figure 10.
Mean error of noise test.
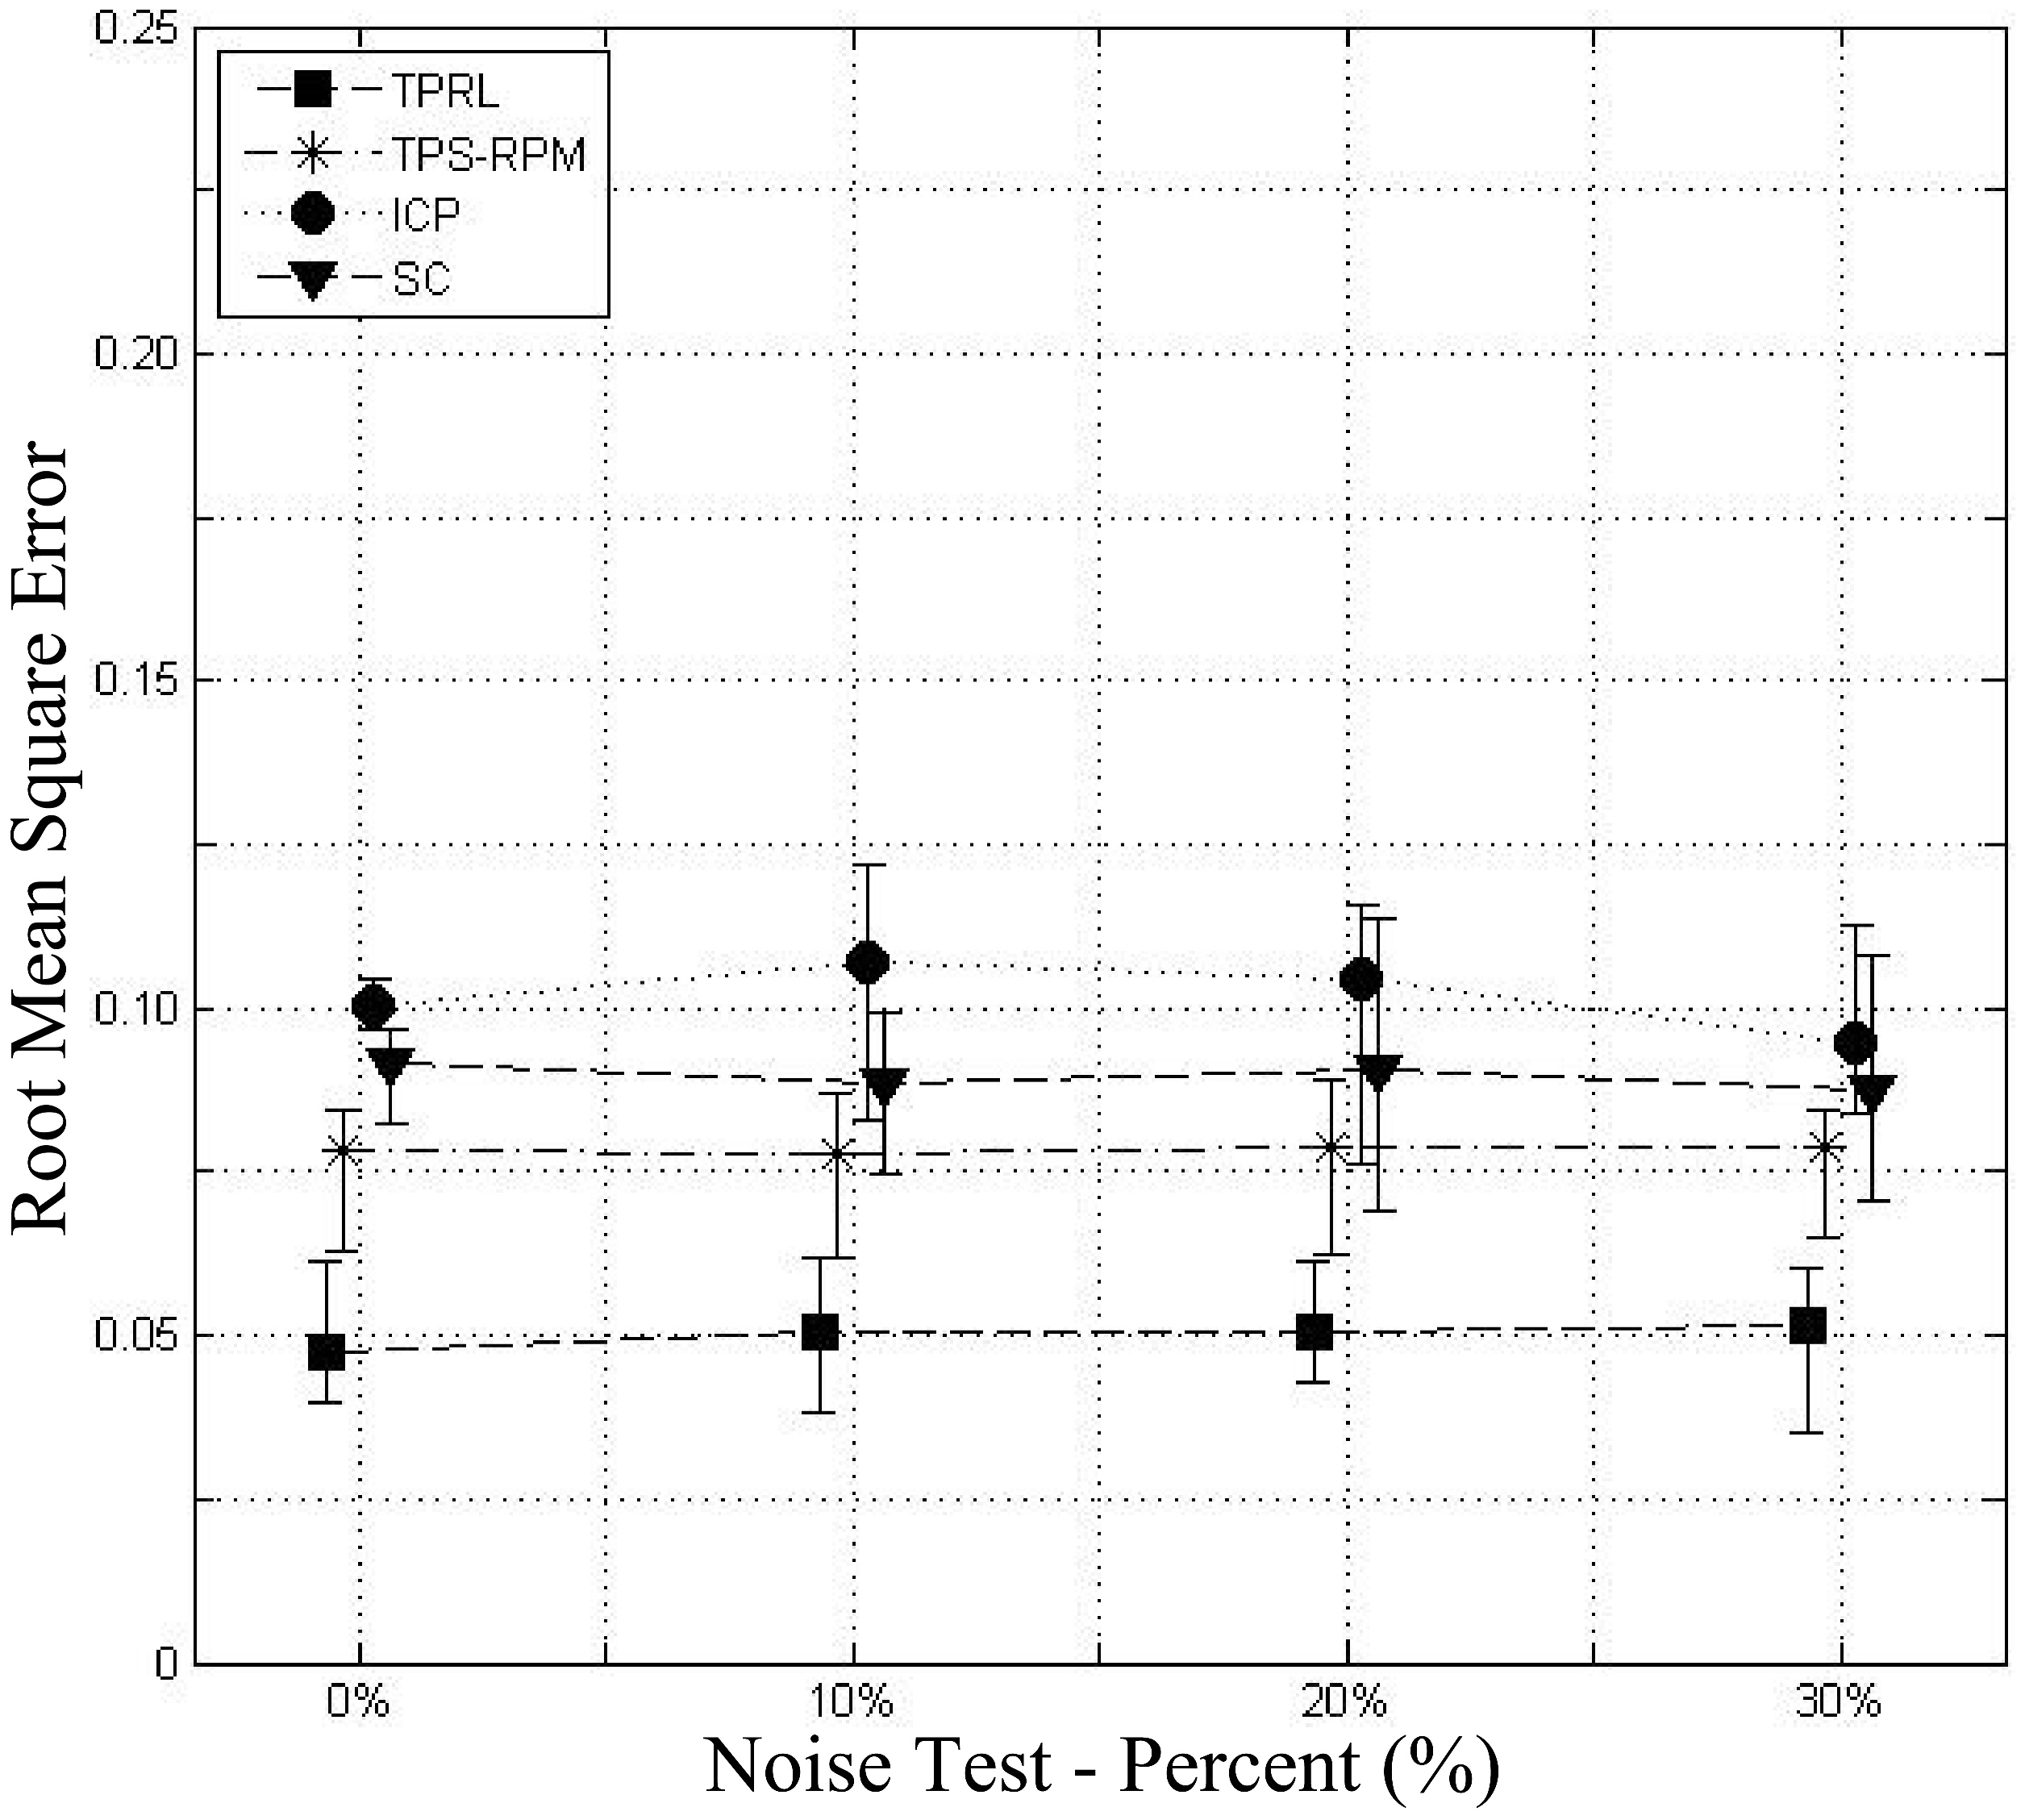
Figure 11.
Mean error of occlusion test.
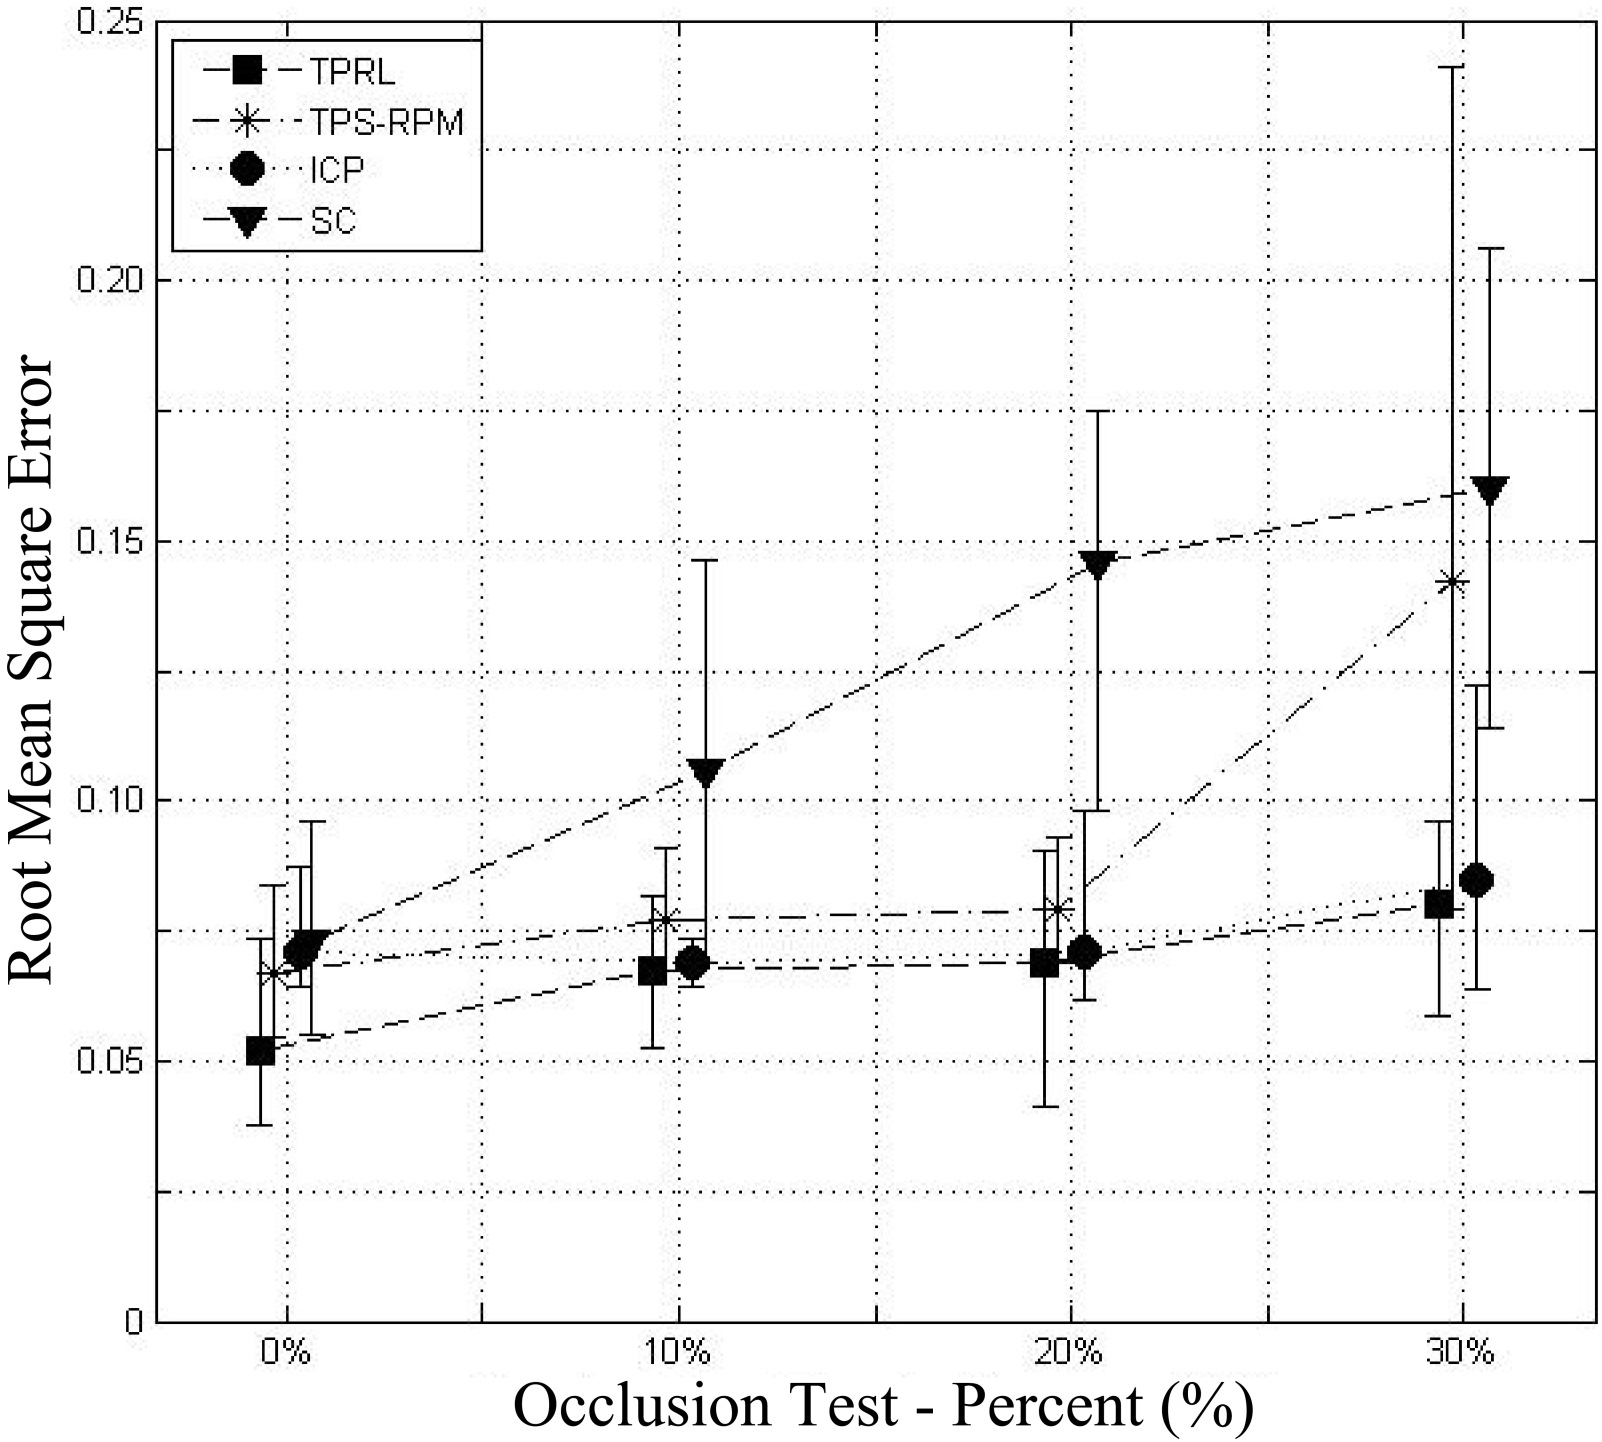
Figure 12.
Signals after bandpass filter (Left) 765 nm (Right) 880 nm.
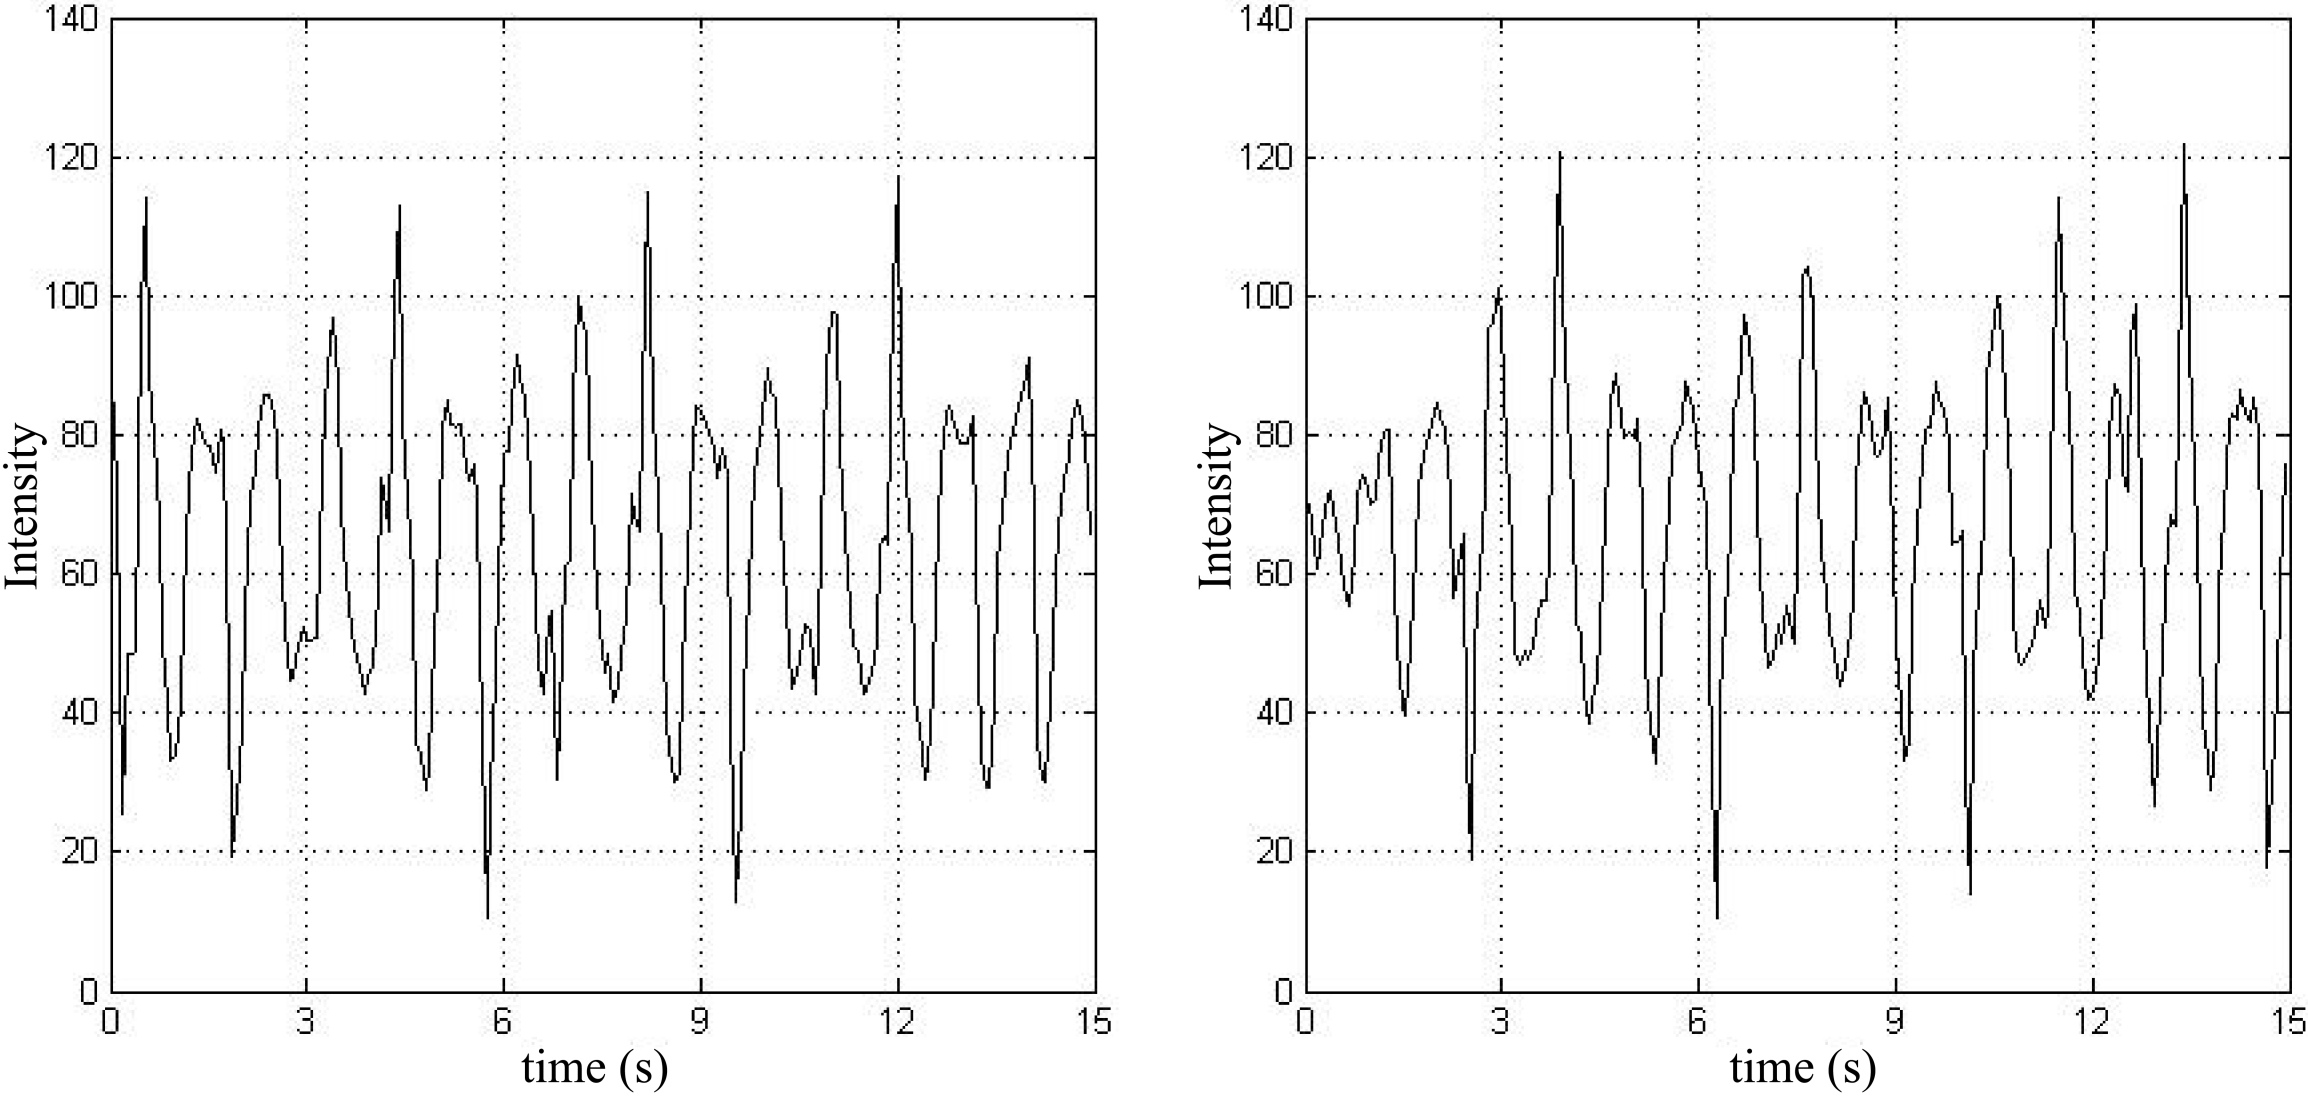
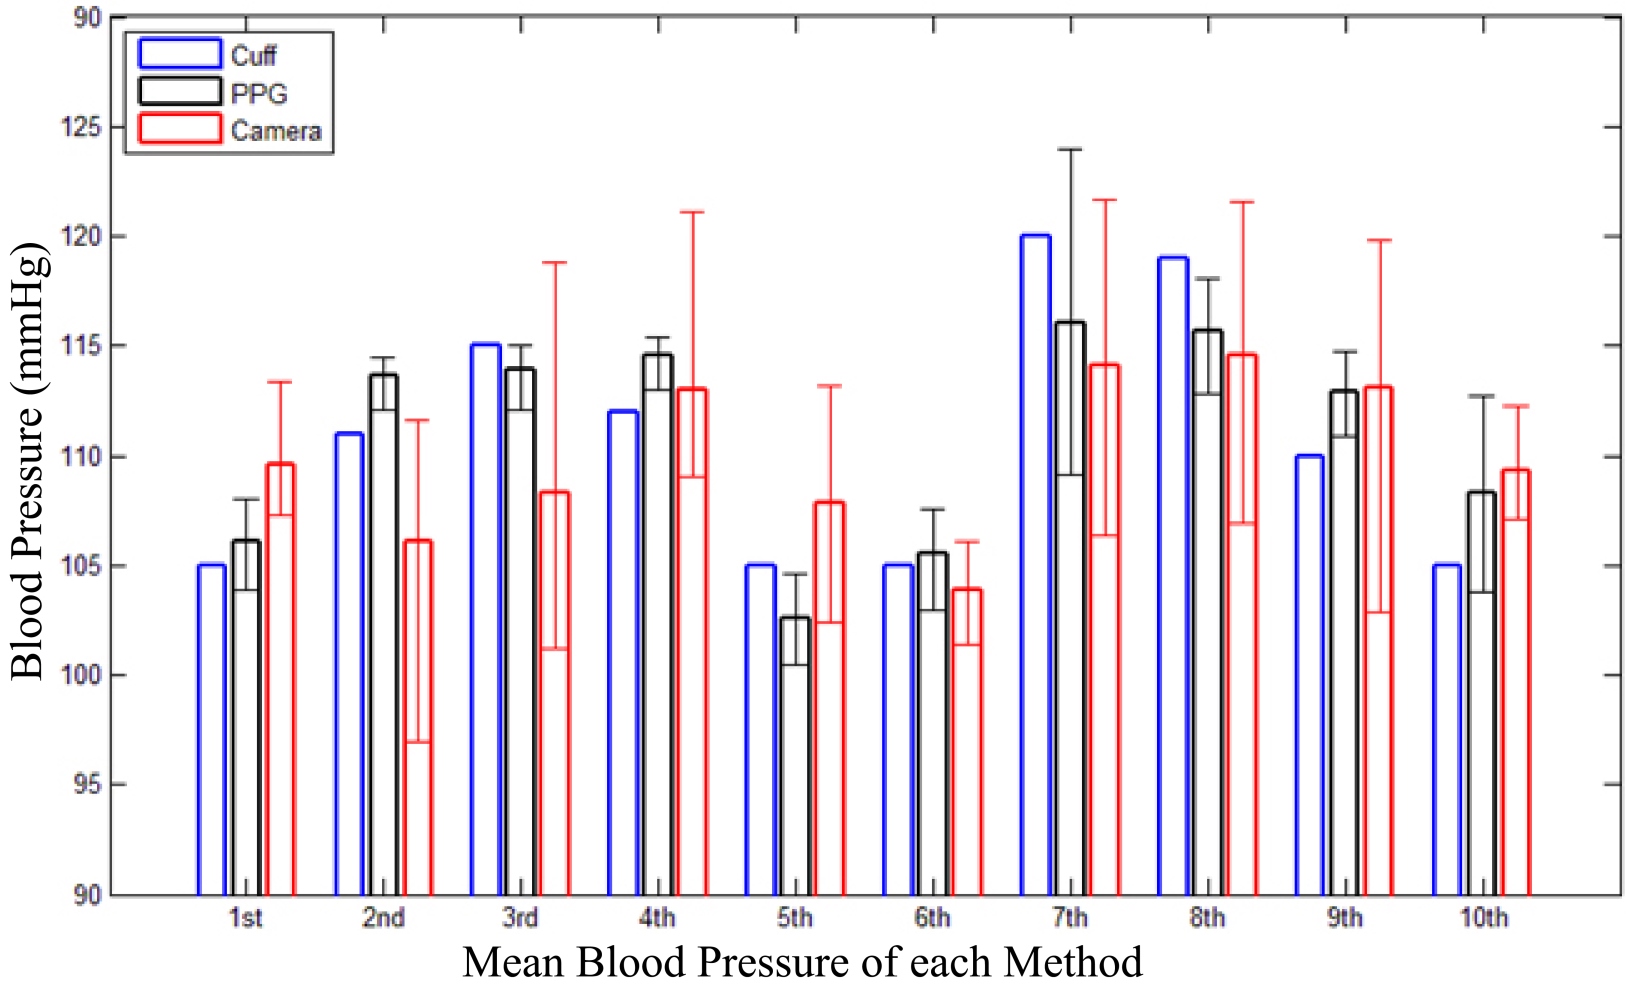
Figure 13.
Blood pressure measurement results.
To get
Non-contact method for pulse rate was available as average error of 3.66% and 0.72% for each case. And in non-contact method for pulse oximetry was proportional related to common
We measured blood pressured with camera and PPG sensors. To compare with standard method, we use cuff based blood pressure measurement tool and ECG measurement tool in BioPac. We calculate blood pressure with estimated ECG R peak time. The result of our system shows 4.45 mmHg mean difference with cuff based blood pressure measurement method.
4.Discussion
In this paper we propose an identification process to non-contact bio signal measuring method. And each part of system works as well as standard method. The key of our system was combining identification process and non-contact bio signal measuring system. In order to be an effective system we will proceed with additional steps to improve the accuracy of the system. And in this paper, we preceded experiments at independently performed on movements, lighting variations or noise. We are going to progress experiments in the case of simultaneous events.
5.Conclusion
This study proposes an authentication process, implemented at the same time as measuring biometric data, through a non-contact method. In the face recognition experiment, we conducted face recognition in various situations. The recognition rate of this system exhibited 96.0% accuracy when trying to recognize the front, and exhibited 86.0% accuracy from the sides of the face. The average heart rate estimation accuracy was 99.1%, compared to the gold standard method. The systolic atrial blood pressure estimation accuracy was 91.9% and saturation accuracy was 92.5%.
Acknowledgments
This research was supported by the Keimyung University Research Grant of 2017.
Conflict of interest
None to report.
References
[1] | Webster JG. ed., Encyclopedia of Medical Devices and Instrumentation, New York: John Wiley and Sons; (1988) . |
[2] | Geddes LA, Baker LE. Principles of Applied Biomedical Instrumentation, New York: John Wiley and Sons; (1989) . |
[3] | Verkruysse W, Svaasand LO, Nelson JS. Remote plethysmographic imaging using ambient light. Optics Express December (2008) ; 16: (26): 21434-21445. |
[4] | Poh M-Z, McDuff DJ, Picard RW. Non-contact, automated cardiac pulse measurements using video imaging and blind source separation. Optics Express May (2010) ; 18: (10): 10762-10774. |
[5] | Poh M-Z, McDuff DJ, Picard RW. Advancements in noncontact, multiparameter physiological measurements using a webcam. IEEE Transactions on Biomedical Engineering January (2011) ; 58: (1): 7-11. |
[6] | McDuff D, Gontarek S, Picard RW. Improvements in remote cardiopulmonary measurement using a five band digital camera. IEEE Transactions on Biomedical Engineering October (2014) ; 61: (10): 2593-2601. |
[7] | Zhao W, et al. Face recognition: A literature survey. ACM Computing Surveys Dec (2003) ; 35: (4): 399-458. |
[8] | Turk M, Pentland A. Eigenfaces for recognition. Journal of Cognitive Neuroscience (1991) ; 3: (1): 71-86. |
[9] | Kamarainen J-K, Kyrki V, Kalviainen H. Invariance properties of gabor filter-based features-overview and applications. Image Processing, IEEE Transactions on Image Processing May (2006) ; 15: (5): 1088-1099. |
[10] | Zheng Y, Doermann D. Robust point matching for nonrigid shapes by preserving local neighborhood structures. IEEE Trans Pattern Analysis and Machine Intelligence Apr (2006) ; 28: (4): 643-649. |
[11] | Tsin Y, Kanade T. A correlation-based approach to robust point set registration. Proc 8th European Conf Computer Vision (2004) ; 558-569. |
[12] | Gesche H, Grosskurth D, Küchler G, Patzak A. Continuous blood pressure measurement by using the pulse transit time: Comparison to a cuff-based method. European Journal of Applied Physiology (2012) ; 112: (1): 309-315. |


