Prediction of microRNA and gene target from an integrated network in chronic obstructive pulmonary disease based on canonical correlation analysis
Abstract
BACKGROUND:
Chronic obstructive pulmonary disease (COPD) is a complex disorder with a high mortality. The pathophysiology of COPD has not been characterized till date.
OBJECTIVE:
To identify COPD-related biomarkers by a bioinformatics analysis.
METHODS:
Here, we conducted the canonical correlation analysis to extract the potential COPD-related miRNAs and mRNAs based on the miRNA-mRNA dual expression profiling data. After identifying miRNAs and mRNAs related to COPD, we constructed an interaction network by integrating three validated miRNA-target sources. Then we expanded the network by adding miRNA-mRNA pairs, which were identified by Spearman rank correlation test. For miRNAs involved in the network, we further performed the Gene Ontology (GO) functional enrichment analysis of their targets. To validate COPD-related mRNAs involved in the network, we performed receiver operating characteristic (ROC) curve analysis and Support Vector Machine (SVM) classification on only those mRNAs that overlapped with COPD-related mRNAs of Online Mendelian Inheritance in Man (OMIM) database.
RESULTS:
The results indicate that some identified miRNAs and their targets in the constructed network might be potential biomarkers of COPD.
CONCLUSIONS:
Our study helps us to predict the potential risk biomarkers of COPD, and it can certainly help in further elucidating the genetic etiology of COPD.
1.Introduction
Chronic obstructive pulmonary disease (COPD) is caused by excessive exposure to highly polluted air containing high concentration of metallic oxidants. It is a chronically progressive disease that causes obstruction of airflow in patients [1]. The pathophysiology of COPD has not been understood completely till date; however, cigarette smoking is considered as an important risk factor. Previous studies have reported that oxidative stress plays a pivotal role in the pathogenesis of COPD by initiating and mediating various redox-sensitive signal transduction pathways and gene expression [2]. The pathogenesis of COPD includes multiple risk factors, including environmental [3], genetic and epigenetic components and a combination of these components. Therefore, it is important to investigate COPD-related biomarkers to comprehensively elucidate the pathogenesis of COPD.
MicroRNAs (miRNAs) are small (
To address this issue, we conducted canonical correlation analysis on miRNA-mRNA dual expression profile data in this study. The results of canonical correlation analysis were used to identify the potential miRNAs and mRNAs associated with COPD. After identifying miRNAs and mRNAs, we constructed their interaction network by integrating the three validated miRNA-target sources. Then, we expanded this network by combining miRNA-mRNA pairs based on Spearman rank correlation test. For miRNAs involved in the network, we further performed the GO functional enrichment analysis of their targets. In particular, we manually searched COPD-related genes from Online Mendelian Inheritance in Man (OMIM) database. Furthermore, we extracted genes that overlapped with target genes of miRNAs involved in the network. On these extracted genes, we performed ROC curve analysis and SVM classification to explore their potential association with COPD. The results indicate that some identified miRNAs and their targets in the constructed network might be potential risk biomarkers of COPD. The results of our study can be used to predict the potential risk biomarkers of COPD, which can then be used to comprehensively elucidate the regulatory changes associated with the development and progression of COPD.
2.Materials and methods
2.1Data source
In the current study, we used miRNA-mRNA dual expression profiling data (GSE38974) to implement our analysis. MicroRNAs were profiled in subjects with 19 COPD patients and 8 normal smokers using Exiqon miRNA microarrays (GPL7723). Microarray of mRNAs was obtained from Agilent Quick Amp Labeling technologies (GPL4133), which includes 9 normal smokers and 23 COPD patients. The processing of raw miRNA and mRNA microarray data was in complete agreement with the original contribution [10]. We used SAM (Significance Analysis of Microarrays) method [11] to identify statistically significant differential expression of mRNAs and miRNAs that distinguish COPD patients from the normal smokers. To eliminate false positive discoveries and to ensure the results agreed with other sample sets of COPD, we selected more rigorous criteria of
2.2Sample matching based on the propensity score
Because the sample size of miRNA and mRNA expression profile datasets was different, we could not delete samples arbitrarily. Therefore, we first performed matching using the propensity score (PS) method, which was performed in the ratio of 1:1 sub-samples on two datasets. Propensity score (PS) is often defined as the conditional probability of receiving a certain treatment from the given covariates [13]. In the current PS matching, the selected covariates are as follows: age, gender, height, weight and smoking history. The logistic regression model was used for PS matching in this analysis. As a result, four samples having lower PS score of mRNA expression profiling were discarded. Then, we performed further analysis on the miRNA-mRNA dual expression profile of 19 COPD patients as they had matching propensity score analysis.
2.3Canonical correlation analysis
In general, canonical correlation analysis was performed to identify and measure the association between two sets of variables. It can find the two bases in which the correlation matrix between the variables is diagonal and the correlations on the diagonal are maximized [14]. It is important to note that canonical correlation method loses its effect if overfull variables are included in the analysis; therefore, we did not select the whole differentially expressed miRNAs and mRNAs to perform canonical correlation analysis. Alternatively, we only selected those differentially expressed miRNAs and mRNAs involved in the miRNA-target relationships that integrate three miRNA-target sources: miRTarBase [15], miRecords [16] and TarBase [17]. In this analysis, miRNAs were considered as the first set of variables and mRNAs as the second set of variables. Consider the number of variables exceeded the number of samples; we performed the regularized canonical correlation (RCC) to seek the potential associations between miRNAs and mRNAs. Before performing RCC on two variables sets, we used the leave-one-out criterion to determine the optimal values of two regularization parameters. The CCA package of R software (http://www.r-project.org) was used to perform canonical correlation analysis.
2.4Network construction
For the extracted miRNAs and mRNAs from the canonical correlation analysis, except kept those miRNA-target relationships obtained from three miRNA-target sources, we expanded the network based on the associations between identified miRNAs and mRNAs. We only selected those miRNA-mRNA interactions showing significant p-values
Table 1
The miRNAs and mRNAs identified by canonical correlation analysis
| miRNA and miRNA | mRNA and miRNA | miRNA and mRNA | mRNA and mRNA | ||||
| canonical variables | canonical variables | canonical variables | canonical variables | ||||
| miRNA | Correlation | miRNA | Correlation | miRNA | Correlation | miRNA | Correlation |
| coefficient | coefficient | coefficient | coefficient | ||||
| miR-378 | 0.7319 | CDKN1A | 0.6184 | miR-378 | 0.7460 | CDKN1A | 0.6548 |
| miR-151-3p | 0.6677 | PAX3 | 0.5865 | miR-519d | 0.6283 | PAX3 | 0.5976 |
| miR-519d | 0.6378 | HIF1A | 0.5546 | miR-151-3p | 0.6141 | PA2G4 | 0.5552 |
| miR-193b | 0.5306 | PA2G4 | 0.5341 | miR-423-3p | 0.5741 | HIF1A | 0.5449 |
| miR-208b | 0.5214 | CCNF | 0.5167 | miR-193b | 0.5412 | THRAP3 | 0.5355 |
| miR-423-3p | 0.4523 | FADD | 0.5019 | miR-208b | 0.4790 | FADD | 0.5225 |
| miR-214 | 0.3962 | FEN1 | 0.4808 | miR-214 | 0.3926 | RAB1B | 0.4905 |
| miR-186 | 0.3700 | FAF1 | 0.4413 | miR-361-5p | 0.3662 | FEN1 | 0.4833 |
| miR-892b | 0.3661 | RAB1B | 0.4217 | miR-186 | 0.3488 | CCNF | 0.4521 |
| miR-326 | 0.3428 | THRAP3 | 0.3925 | miR-422a | 0.3321 | VEGFA | 0.4326 |
| miR-422a | 0.3392 | VEGFA | 0.3722 | miR-892b | 0.3295 | FAF1 | 0.4125 |
| miR-361-5p | 0.3024 | ACVR1B | 0.3694 | miR-383 | 0.3126 | ACVR1B | 0.4017 |
| FGFR1 | 0.3682 | miR-326 | 0.3045 | CDK2 | 0.3998 | ||
| GPD1 | 0.3513 | TLR2 | 0.3977 | ||||
| PKM2 | 0.3423 | MCL1 | 0.3842 | ||||
| CDK2 | 0.3370 | MAPK9 | 0.3750 | ||||
| MAPK9 | 0.3211 | GPD1 | 0.3655 | ||||
| MCL1 | 0.3162 | FGFR1 | 0.3522 | ||||
| TLR2 | 0.3124 | NOTCH1 | 0.3481 | ||||
| NOTCH1 | 0.3083 | TLR4 | 0.3315 | ||||
| PTEN | 0.3047 | PTEN | 0.3276 | ||||
| KRAS | 0.3006 | ATF6B | 0.3246 | ||||
| KRAS | 0.3162 | ||||||
| AKT1 | 0.3105 | ||||||
| P2RX7 | 0.3096 | ||||||
| PKM2 | 0.3035 | ||||||
2.5GO function enrichment analysis
In the constructed network, for each miRNA, we performed the Gene Ontology (GO) function enrichment analysis for their target genes. We used clusterProfiler package of R software (http://www.r-project.org) to implement this analysis. The multiple testing corrections based on Benjamini-Hochberg method [18] were performed; those GO terms whose adjusted p-values were less than 0.05 were considered significant.
2.6Validation of the potential COPD-related genes involved in the network
2.6.1Classification performance analysis for the identified potential COPD-related genes
To find whether the genes involved in the constructed network might be potential COPD-related genes, we manually selected genes that overlapped with COPD-related genes included in Online Mendelian Inheritance in Man (OMIM) database [19]. The area under receiver operating characteristic (ROC) curve of these overlapping genes was calculated to detect COPD. We used the expression of these overlapping genes as predictor variables, and applied Support Vector Machine (SVM) [20] to distinguish COPD patients from normal smokers. In practice, cross-validation can limit problems like overfitting and derive a more accurate estimate of model prediction performance. Because enough data was not available to partition it into “training set” and “test set”, significant modeling or testing capability would have got compromised [21]. To tackle this problem, we performed 5-fold cross validation in SVM program. In this procedure, we divided all samples into five sets. For each analysis, one set was considered as testing data whereas the remaining sets were considered as training data.
2.6.2Cluster analysis by combining miRNA with mRNA expression profiling to validate the identified potential COPD-related genes
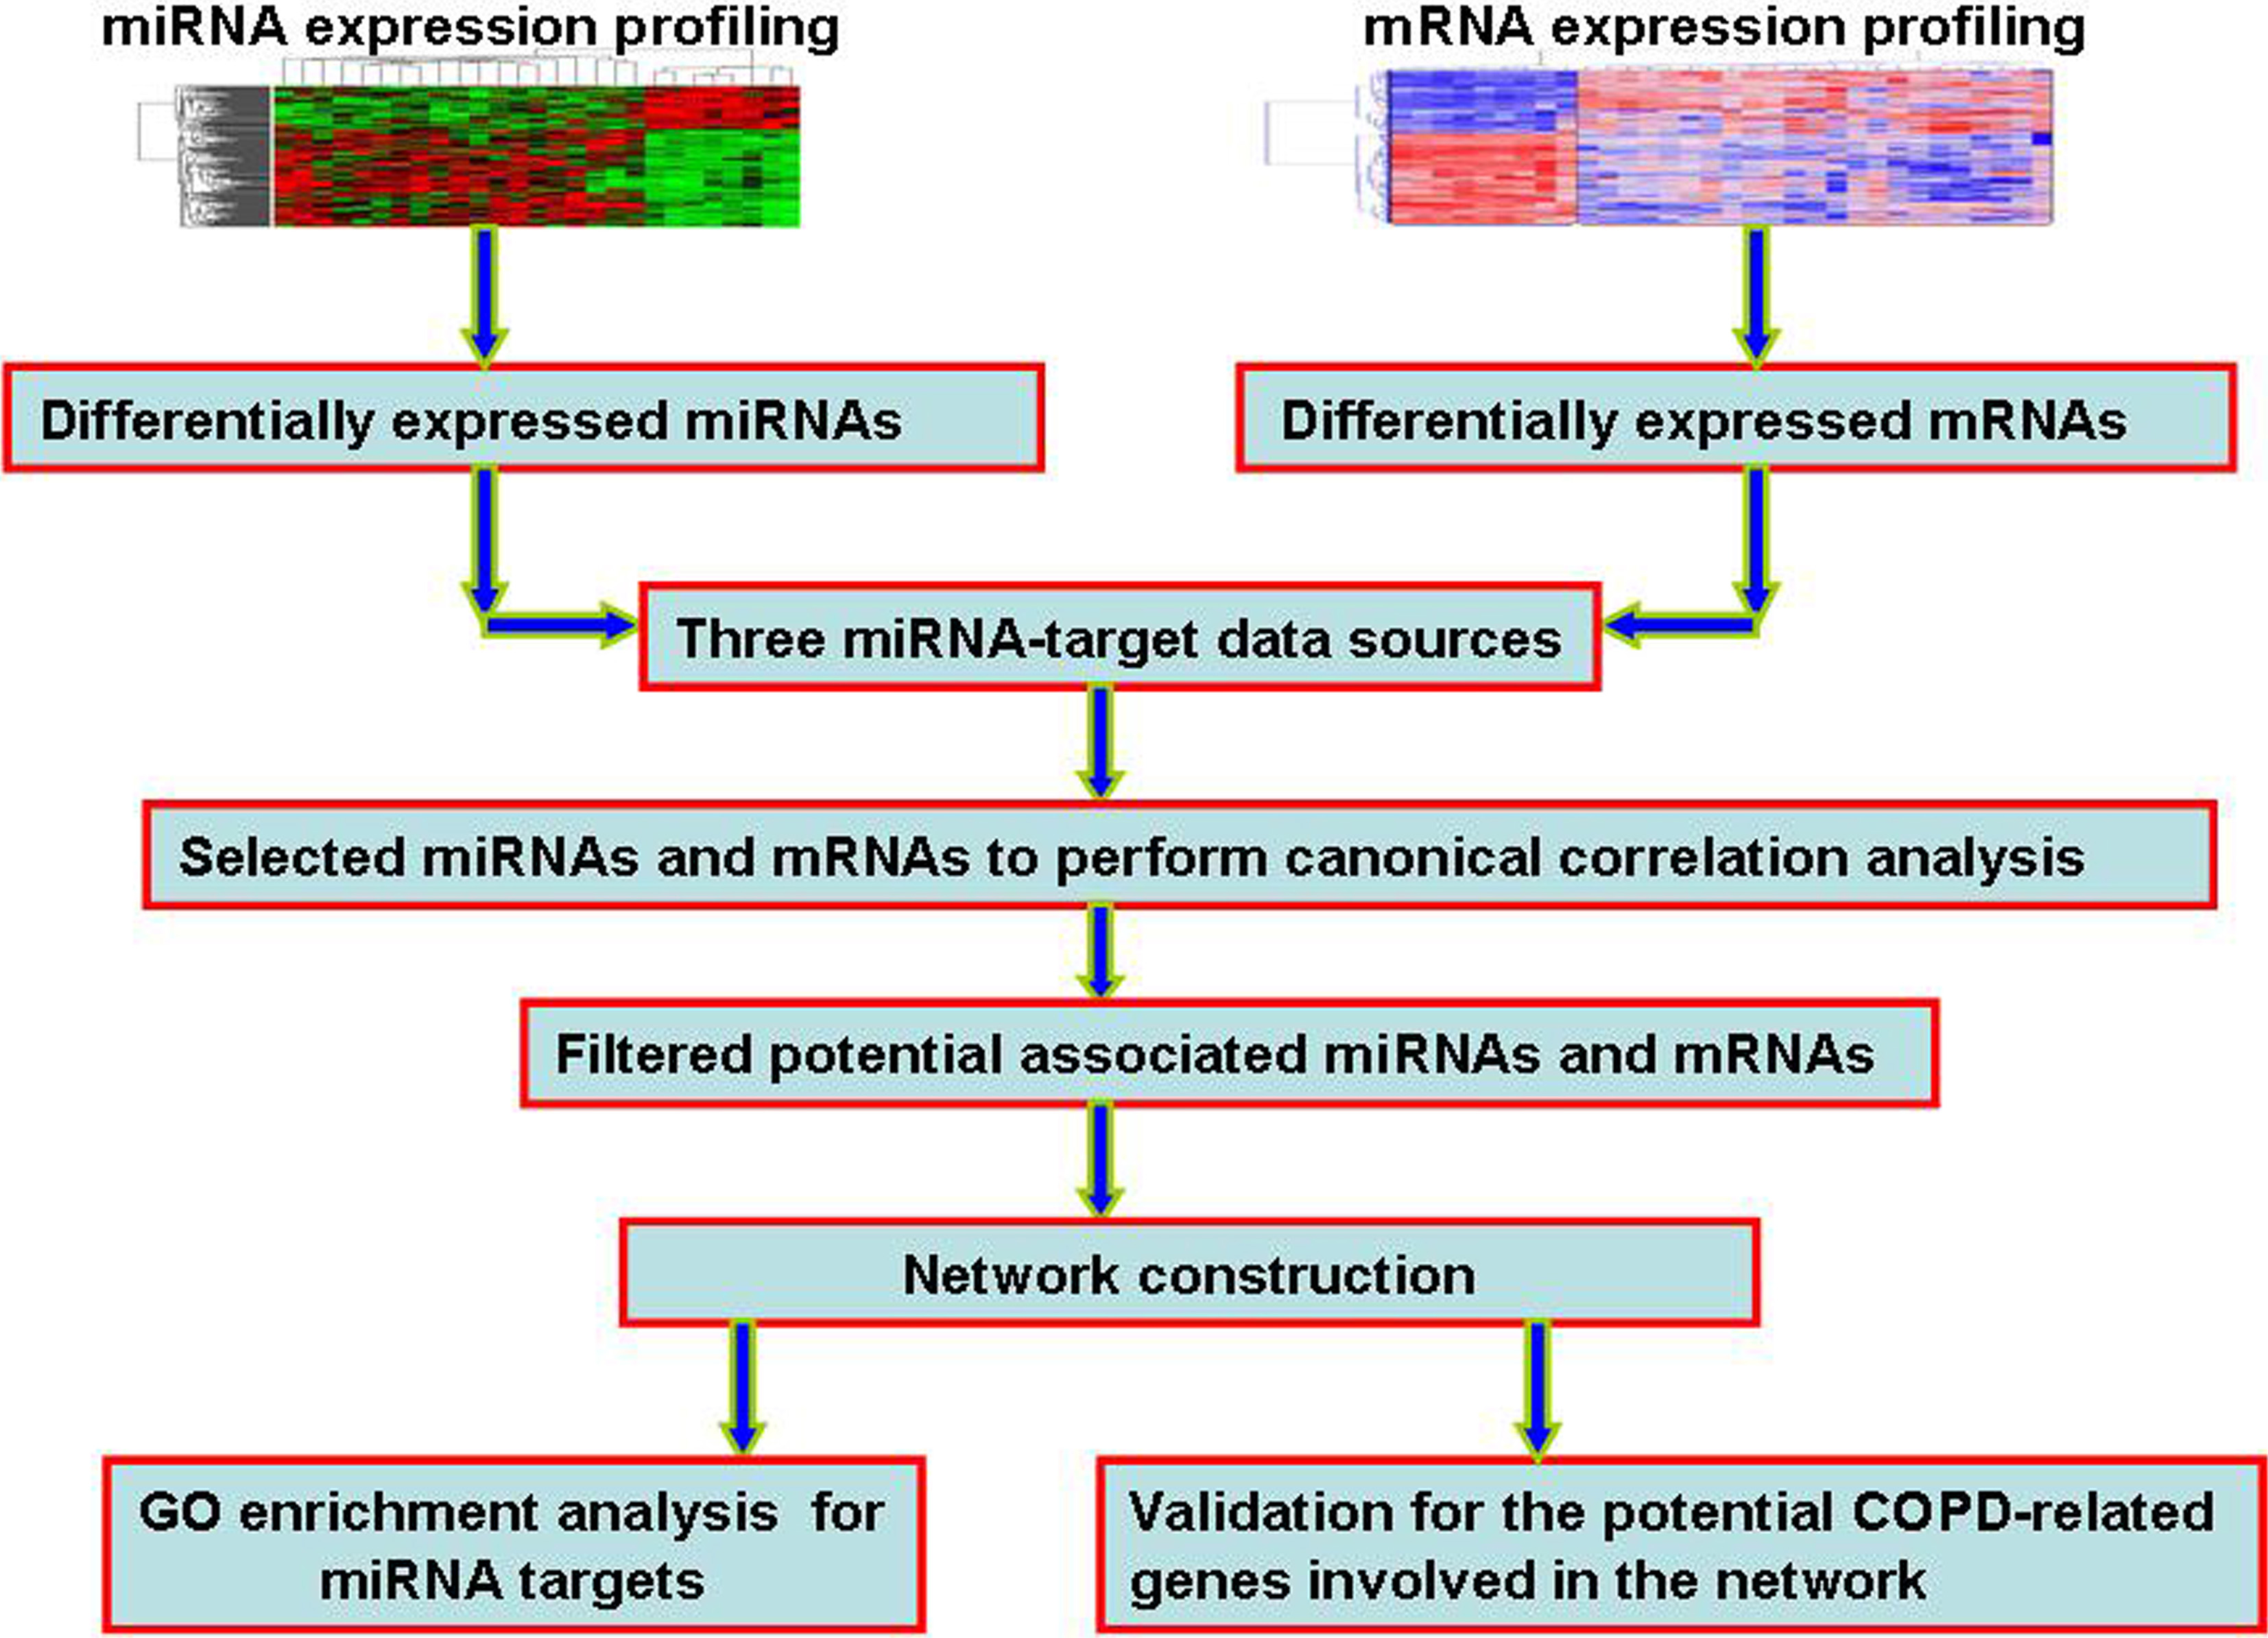
To validate the potential COPD-related genes involved in the network, we performed cluster analysis by combining miRNA with mRNA expression profile of 19 patients using Similarity Network Fusion (SNF) method [22]. SNF is a multi-omics data processing method in which the similarities between patients from different data types are integrated by a cross-network diffusion process to construct the fusion patient similarity matrix. After clustering 19 COPD patients to three clusters (subtypes), we extracted top 50 most significant differentially expressed genes distinguishing each of three clusters from normal smokers respectively, and the overlapped genes of three gene sets were extracted. Figure 1 illustrates the flowchart of our work in this analysis.
Figure 1.
The flowchart of our work. Firstly, we identified the differentially expressed miRNAs and mRNAs. Secondly, by integrating three miRNA-target sources, we performed canonical correlation analysis to identify potential COPD-related miRNAs and mRNAs. Thirdly, we constructed and expanded miRNA-mRNA network. Finally, for miRNAs involved in the network, we performed GO functional enrichment analysis of their targets. We also performed the validation of potential COPD-related genes involved in the consturction network, including ROC curve analysis, SVM classification, and cluster analysis.
3.Results
3.1Canonical Correlation analysis
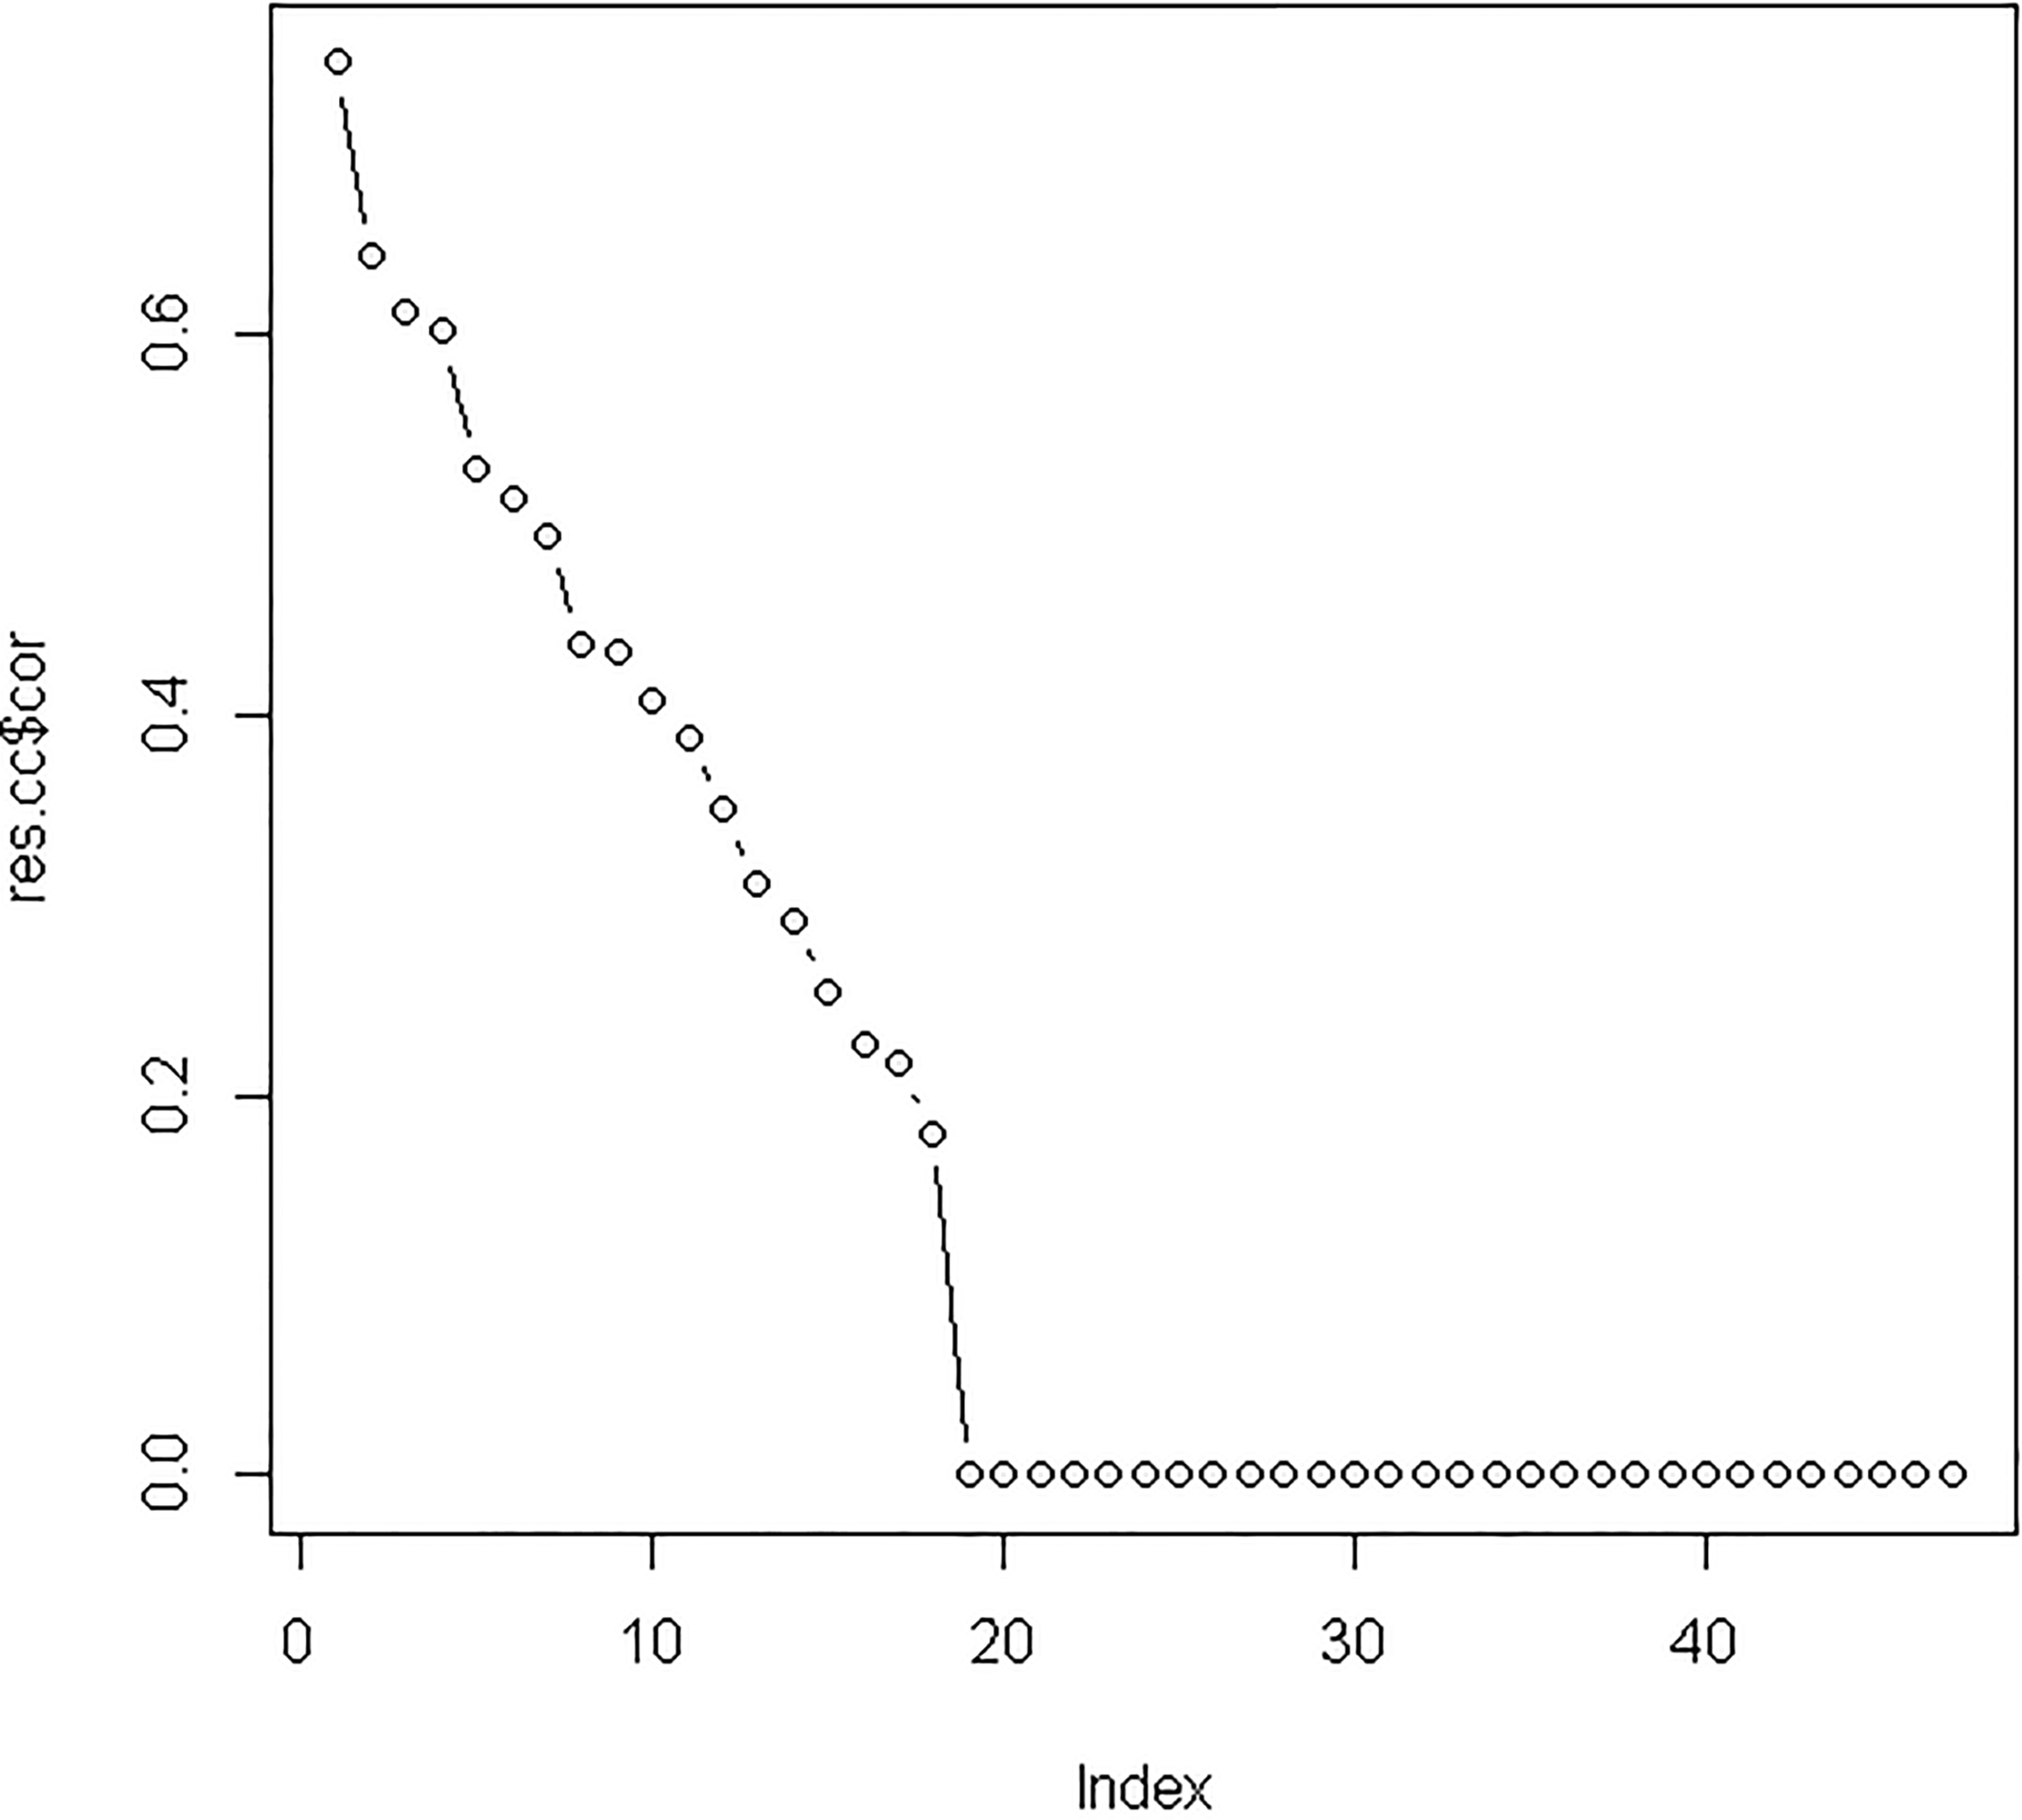
After integrating three miRNA-target sources into differentially expressed miRNAs and mRNAs, we used 47 differentially expressed miRNAs and 85 differentially expressed mRNAs to perform canonical correlation analysis. Based on leave-one-out criterion, we found that the optimal values of two regularization parameters were 0.25 and 0.75, respectively. After performing regularized canonical correlation, we obtained the four matrixes: the correlation between miRNA and miRNA canonical variables; the correlation between mRNA and miRNA canonical variables; the correlation between miRNA and mRNA canonical variables and the correlation between mRNA and mRNA canonical variables. For these four matrixes, we selected the correlation coefficients of the original variable and the first canonical variable because the first canonical variable had the highest canonical correlation coefficient of 0.74 (see Supplementary Fig. 1). We identified 13 miRNAs and 26 mRNAs with correlation coefficients
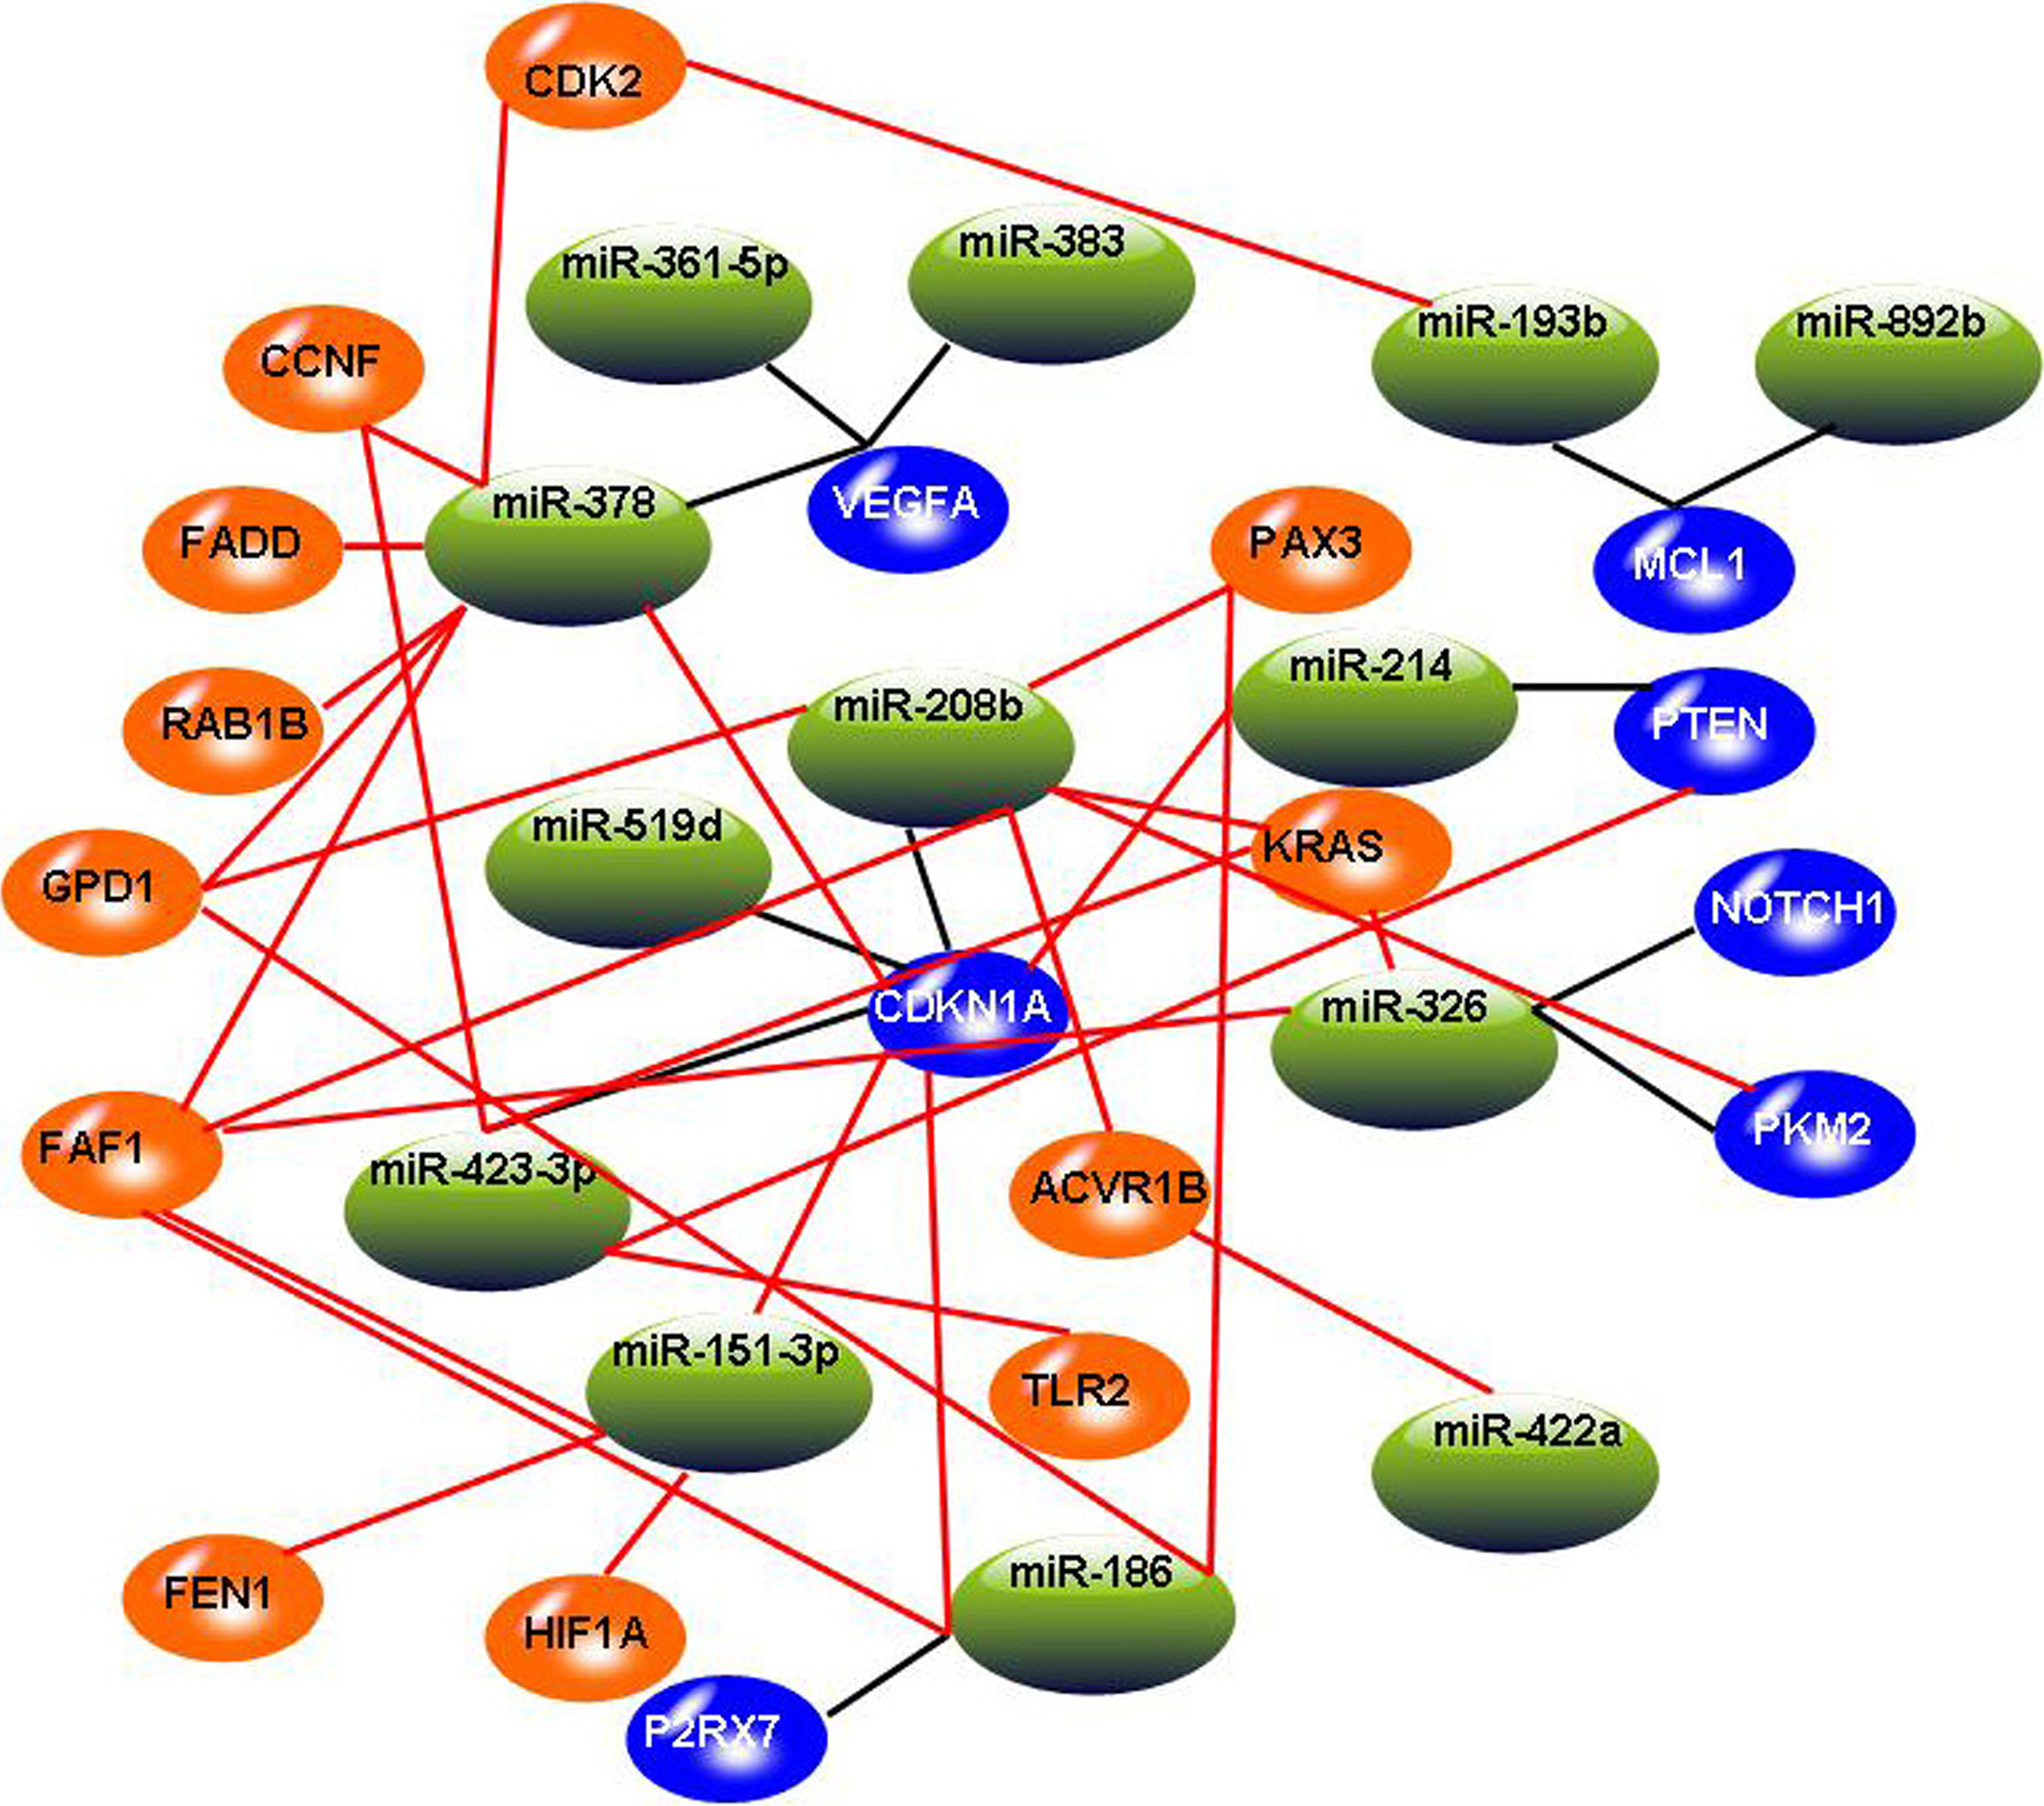
Figure 2.
The constructed miRNA-mRNA regulation network. In this graph, blue circles indicate target genes involved in three miRNA-target databases, and the orange circles indicate added target genes involved in significant miRNA-mRNA pairs. Black lines indicate miRNA-mRNA relationships involved in three miRNA-target databases, and red lines indicate added miRNA-mRNA relationships involved in significant miRNA-mRNA pairs.
3.2Network construction
After identifying 13 miRNAs and 26 mRNAs by canonical correlation analysis, we expanded the network by adding miRNA-mRNA pairs identified by Spearman rank correlation test. According to the criterion of
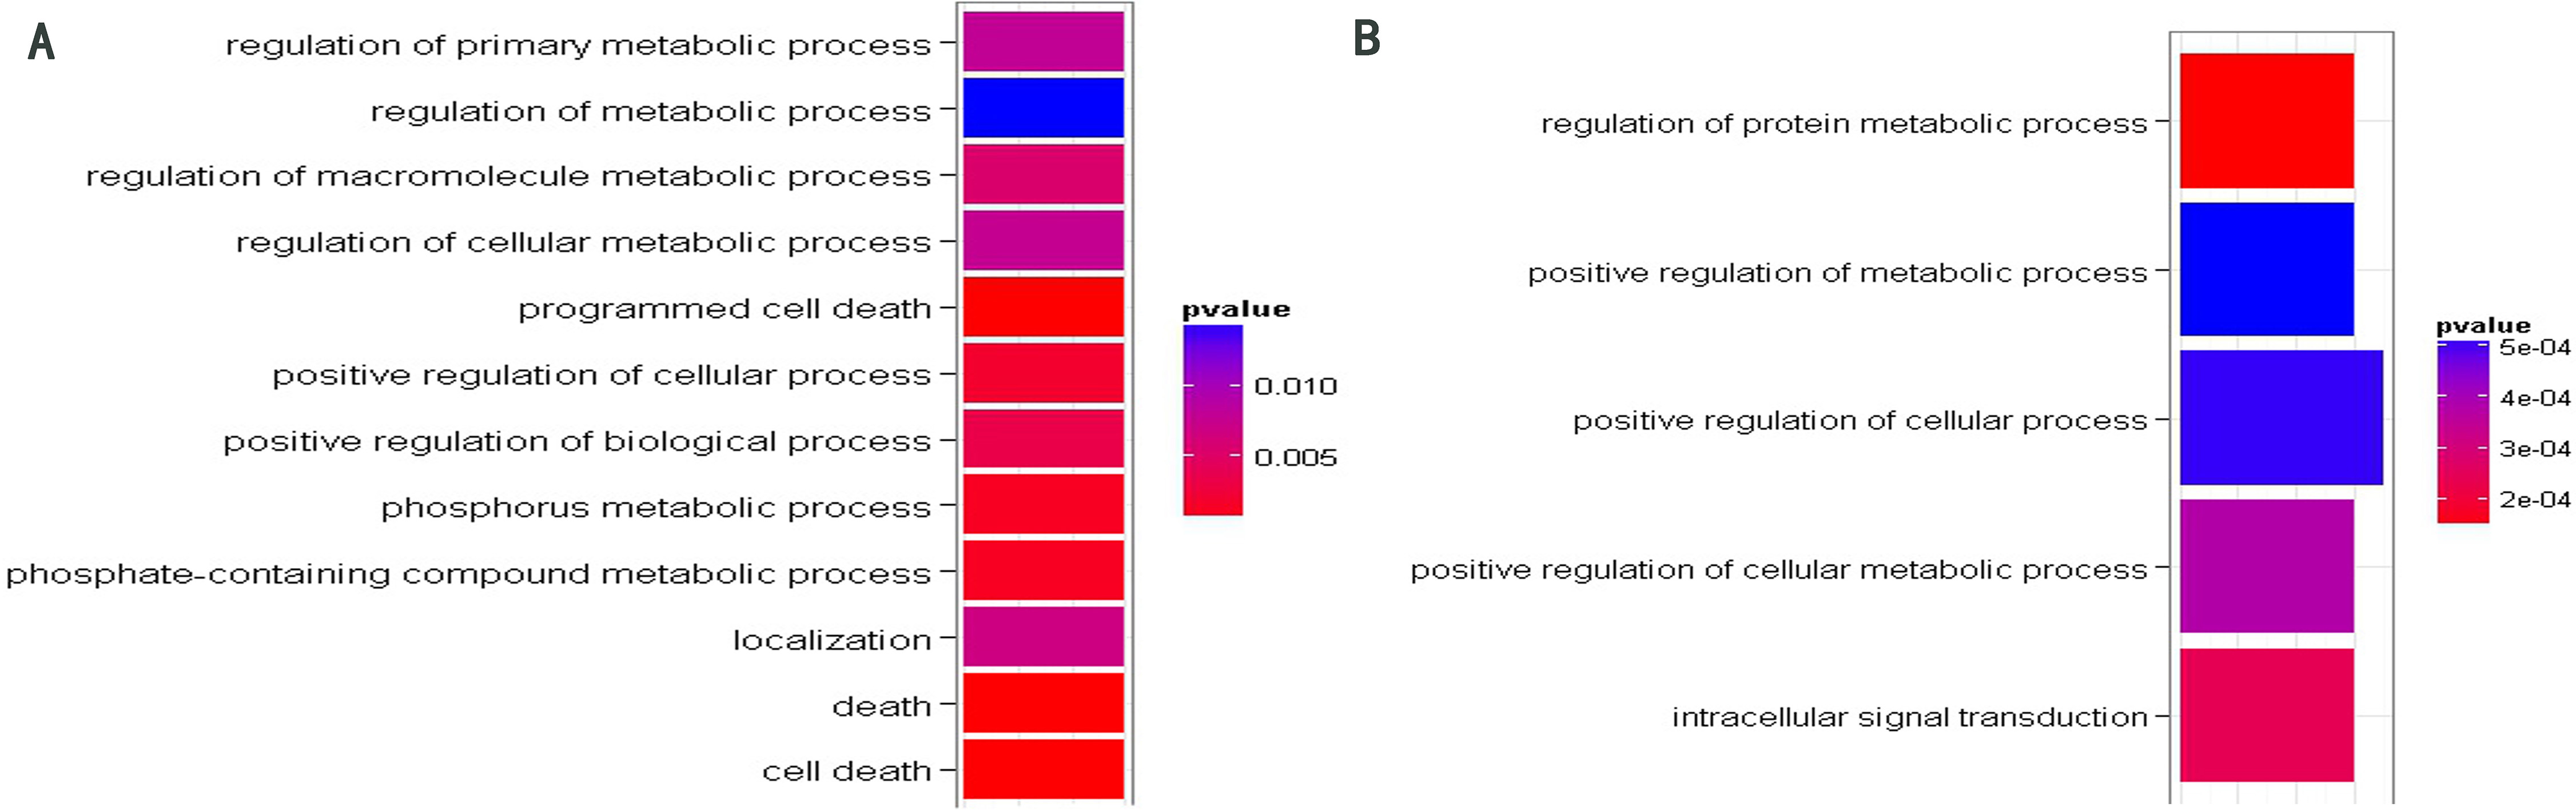
Figure 3.
GO function enrichment analysis of target genes of miR-208b (A) and miR-378 (B). The significant GO terms about BP were shown in different colors. The cooler colors indicate more significant GO terms (The p-values displayed in the graph were not adjusted).
3.3GO function enrichment analysis
Figure 4.
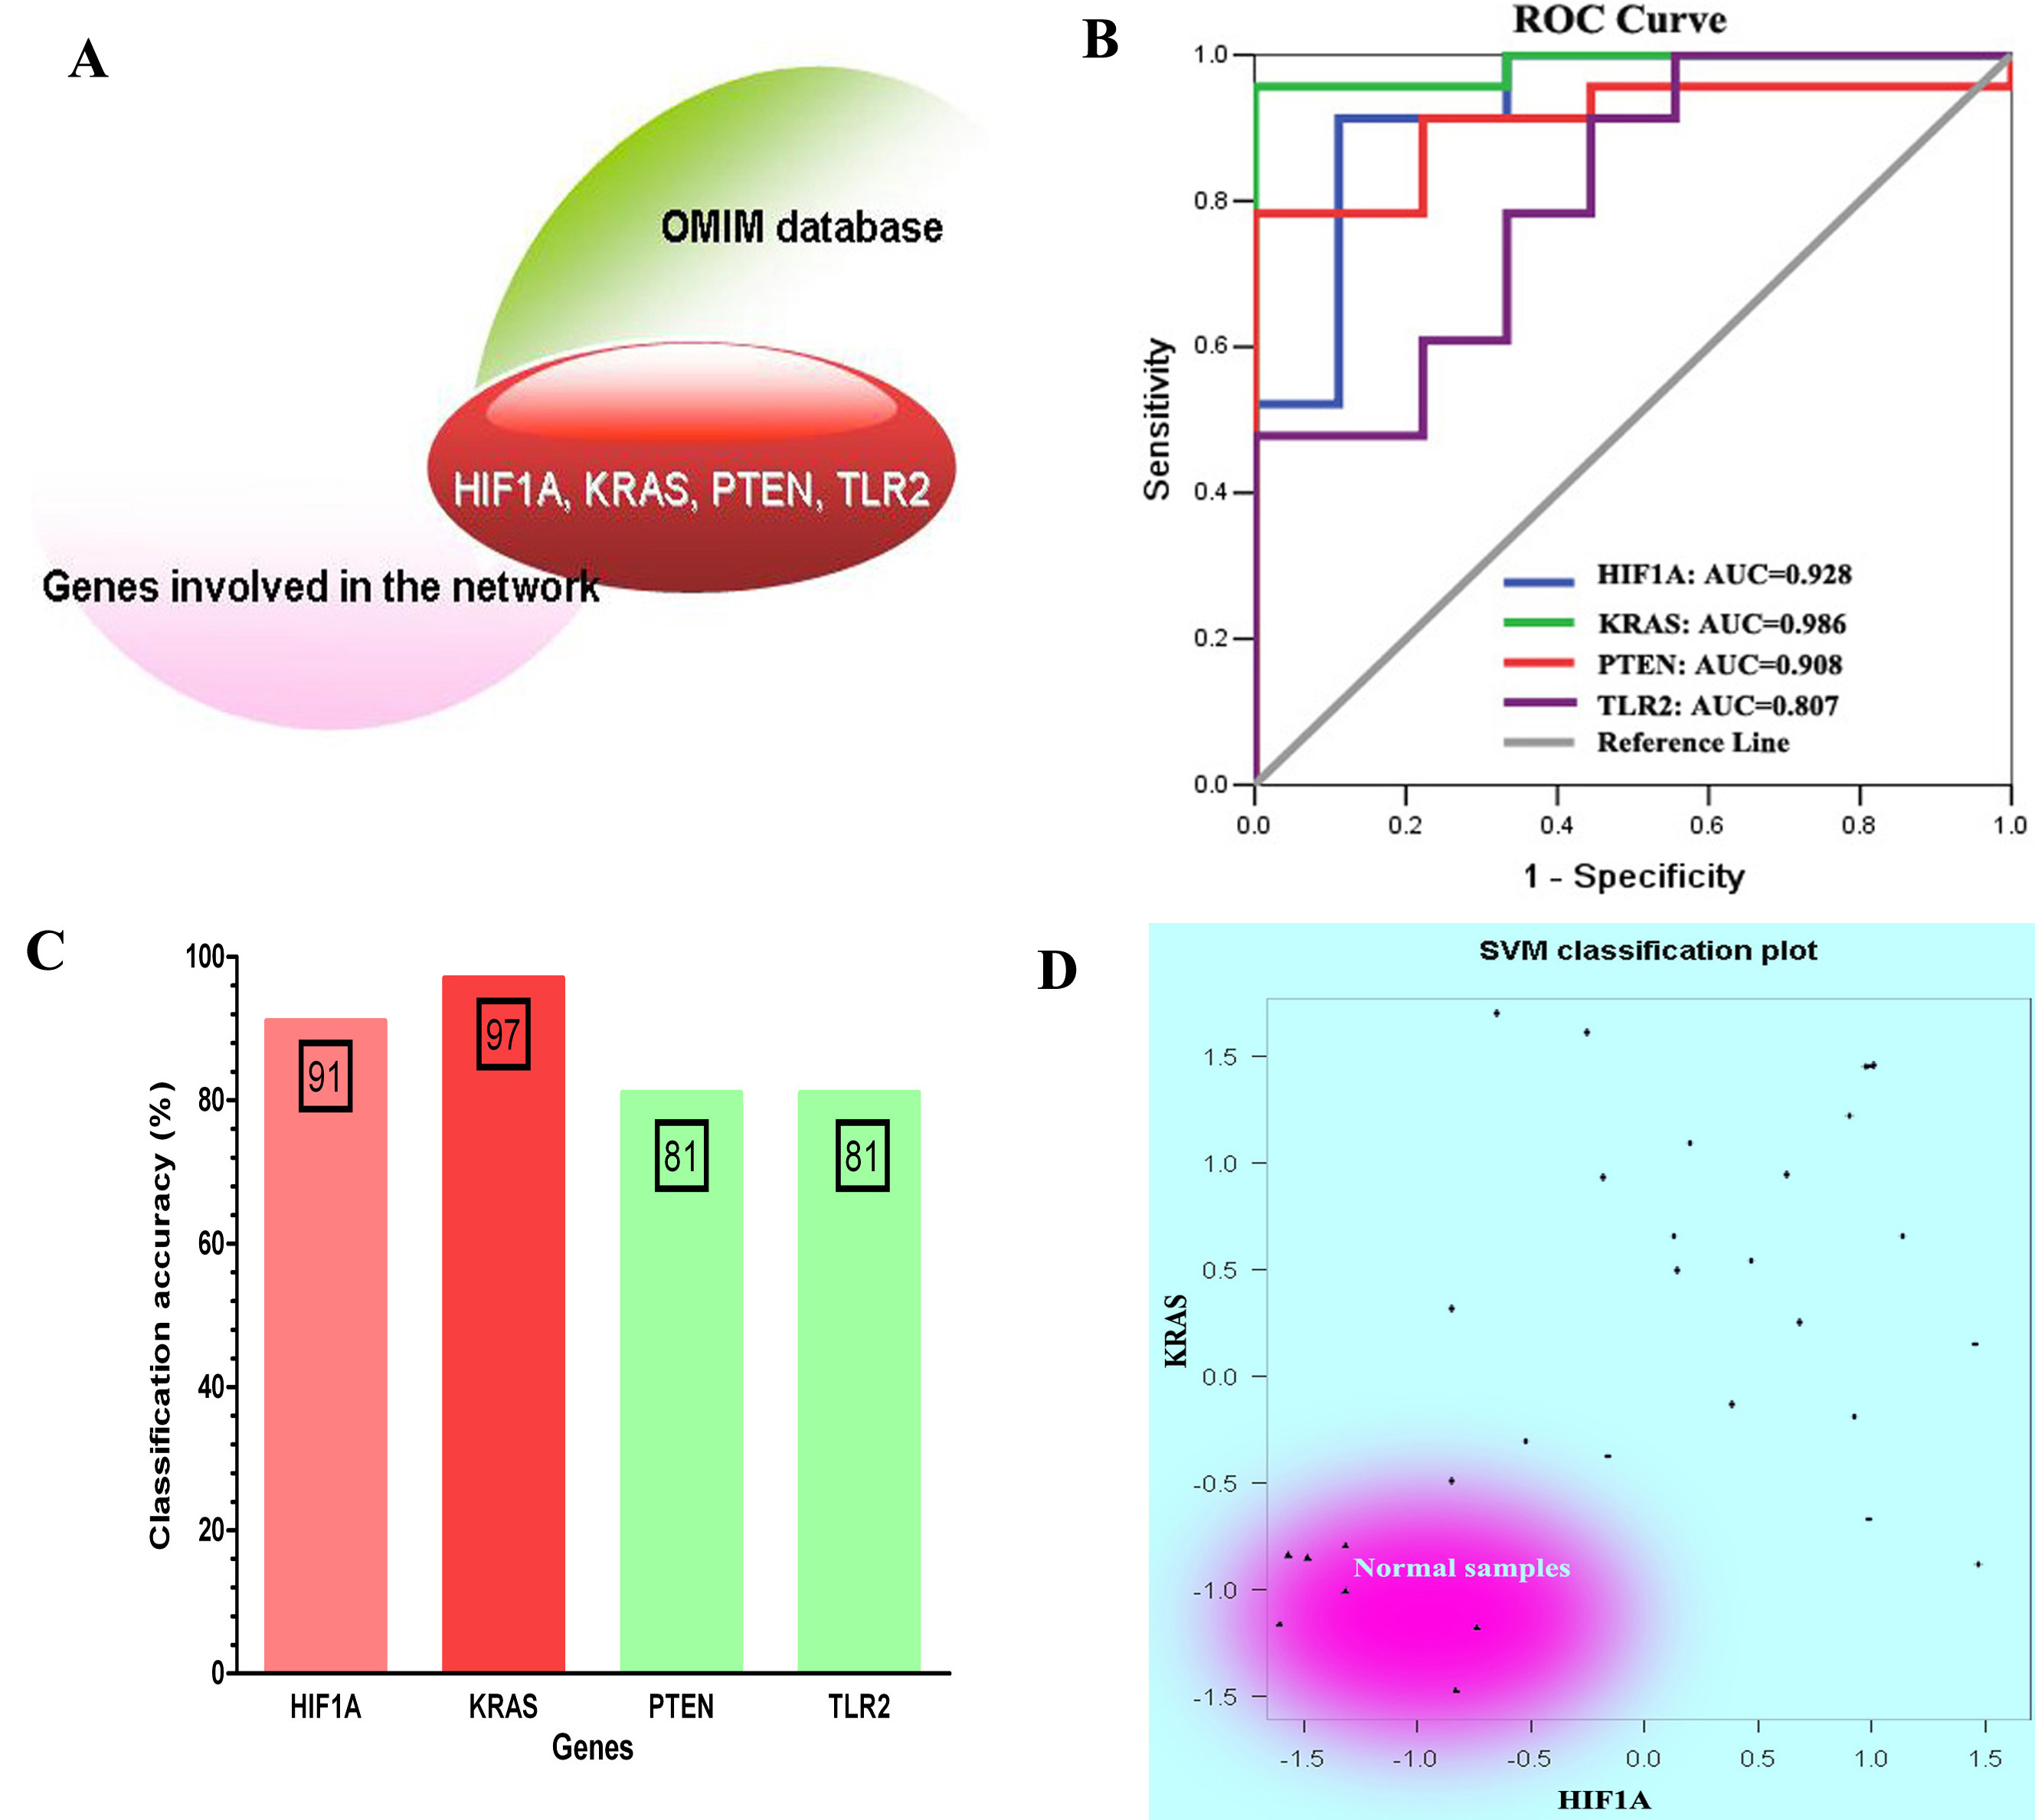
The classification performance analysis for four genes that overlap with COPD-related genes recognized in OMIM database. (A) Four overlapped genes: HIF1A, KRAS, PTEN and TLR2. (B) The ROC curve analysis for four genes. (C) The classification accuracy rate of four genes based on SVM method. (D) The SVM classification plot for HIF1A and KRAS.
For each miRNA, we performed the Gene Ontology (GO) function enrichment analysis of their target genes involved in the network. Only target gene sets of miR-378 and miR-208b were enriched with some significant GO terms (see Supplementary Table 1). Figure 3 illustrates significant GO terms about biological process (BP). As shown in Fig. 3, the target genes of miR-208b were enriched on cell death and metabolic process. In a previous study conducted on mice, we found that in pulmonary endothelial or epithelial cells, the direct induction of cell apoptosis was accompanied with emphysematous changes. This implies that there are defects in these clearance mechanisms, and many evidences prove that such defects are quite common in patients with COPD [32]. Furthermore, target genes of miR-208b were enriched on GO term “localization” (GO: 0051179), which is defined as any process in which a cell, a substance, or a cellular entity is transported, tethered to, or otherwise maintained in a specific location. In practice, “localization” may also be achieved via selective degradation. In a recent COPD-related study, we found that interstitial PTX3 levels were not correlated with mRNA transcripts of whole tissue. These results indicate the lack of selection of cells relevant for PTX3 production at the chosen anatomical sites. In other words, PTX3 levels reflect selective degradation or post-transcriptional regulation [33]. Other significant functions of target genes of miR-208b and miR-378 focus on the metabolic process. In practice, we reported that skeletal muscle proteins become mobilized during inflammation. In COPD patients, the increased levels of acute phase proteins are correlated with an enhanced resting metabolic rate and fat free mass (FFM) loss [34].
3.4Classification performance analysis for potential COPD-related genes involved in the network
To determine whether the genes involved in the constructed network were potential COPD-related genes, we manually selected genes that overlapped with COPD-related genes included in OMIM database. We found 6 genes (HIF1A, KRAS, P2RX7, PTEN, TLR2 and VEGFA) which have been approved to be associated with COPD (see Fig. 4A). Meanwhile, the area under ROC curve (AUC) of four genes (HIF1A, KRAS, PTEN, and TLR2) was greater than 0.8, which can be used as an indicator to detect COPD in patients (see Fig. 4B). By considering the expression of these four genes as prediction variables, we classified samples by SVM method. The classification accuracy rate of HIF1A, KRAS, PTEN, and TLR2 were 91%, 97%, 81%, and 81%, respectively (see Fig. 4C). In particular, we used SVM classification plot to determine classification performance of two genes (HIF1A and KRAS) that show higher classification accuracy rate than the other two genes. The two-dimensional classification diagram showed a good classification performance in which normal smokers were distinguished well from COPD patients (see Fig. 4D).
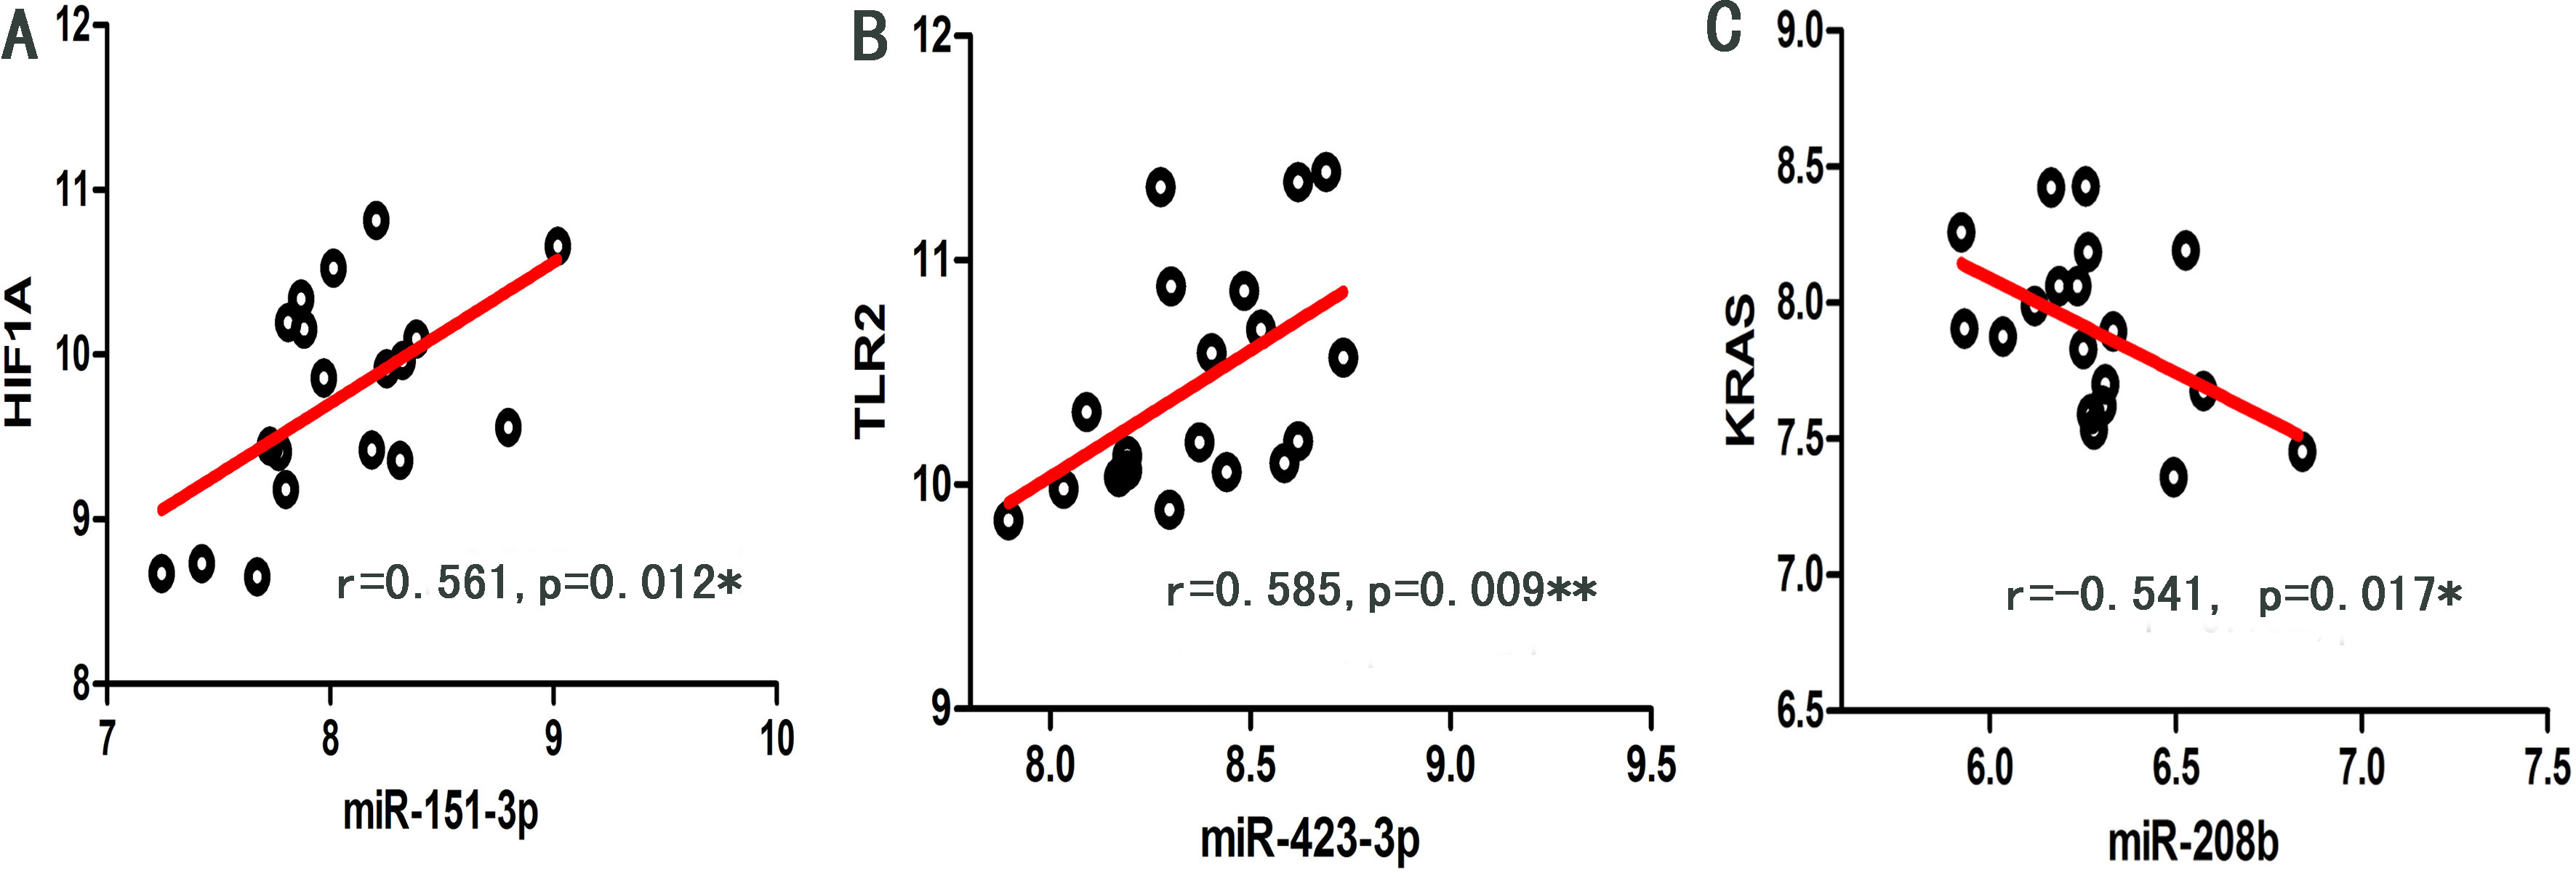
As shown in Fig. 5, significant regulation (
Figure 5.
Scatter dot plots of significant regulation (
3.5Cluster analysis by combining miRNA with mRNA expression profiling to validate the identified potential COPD-related genes
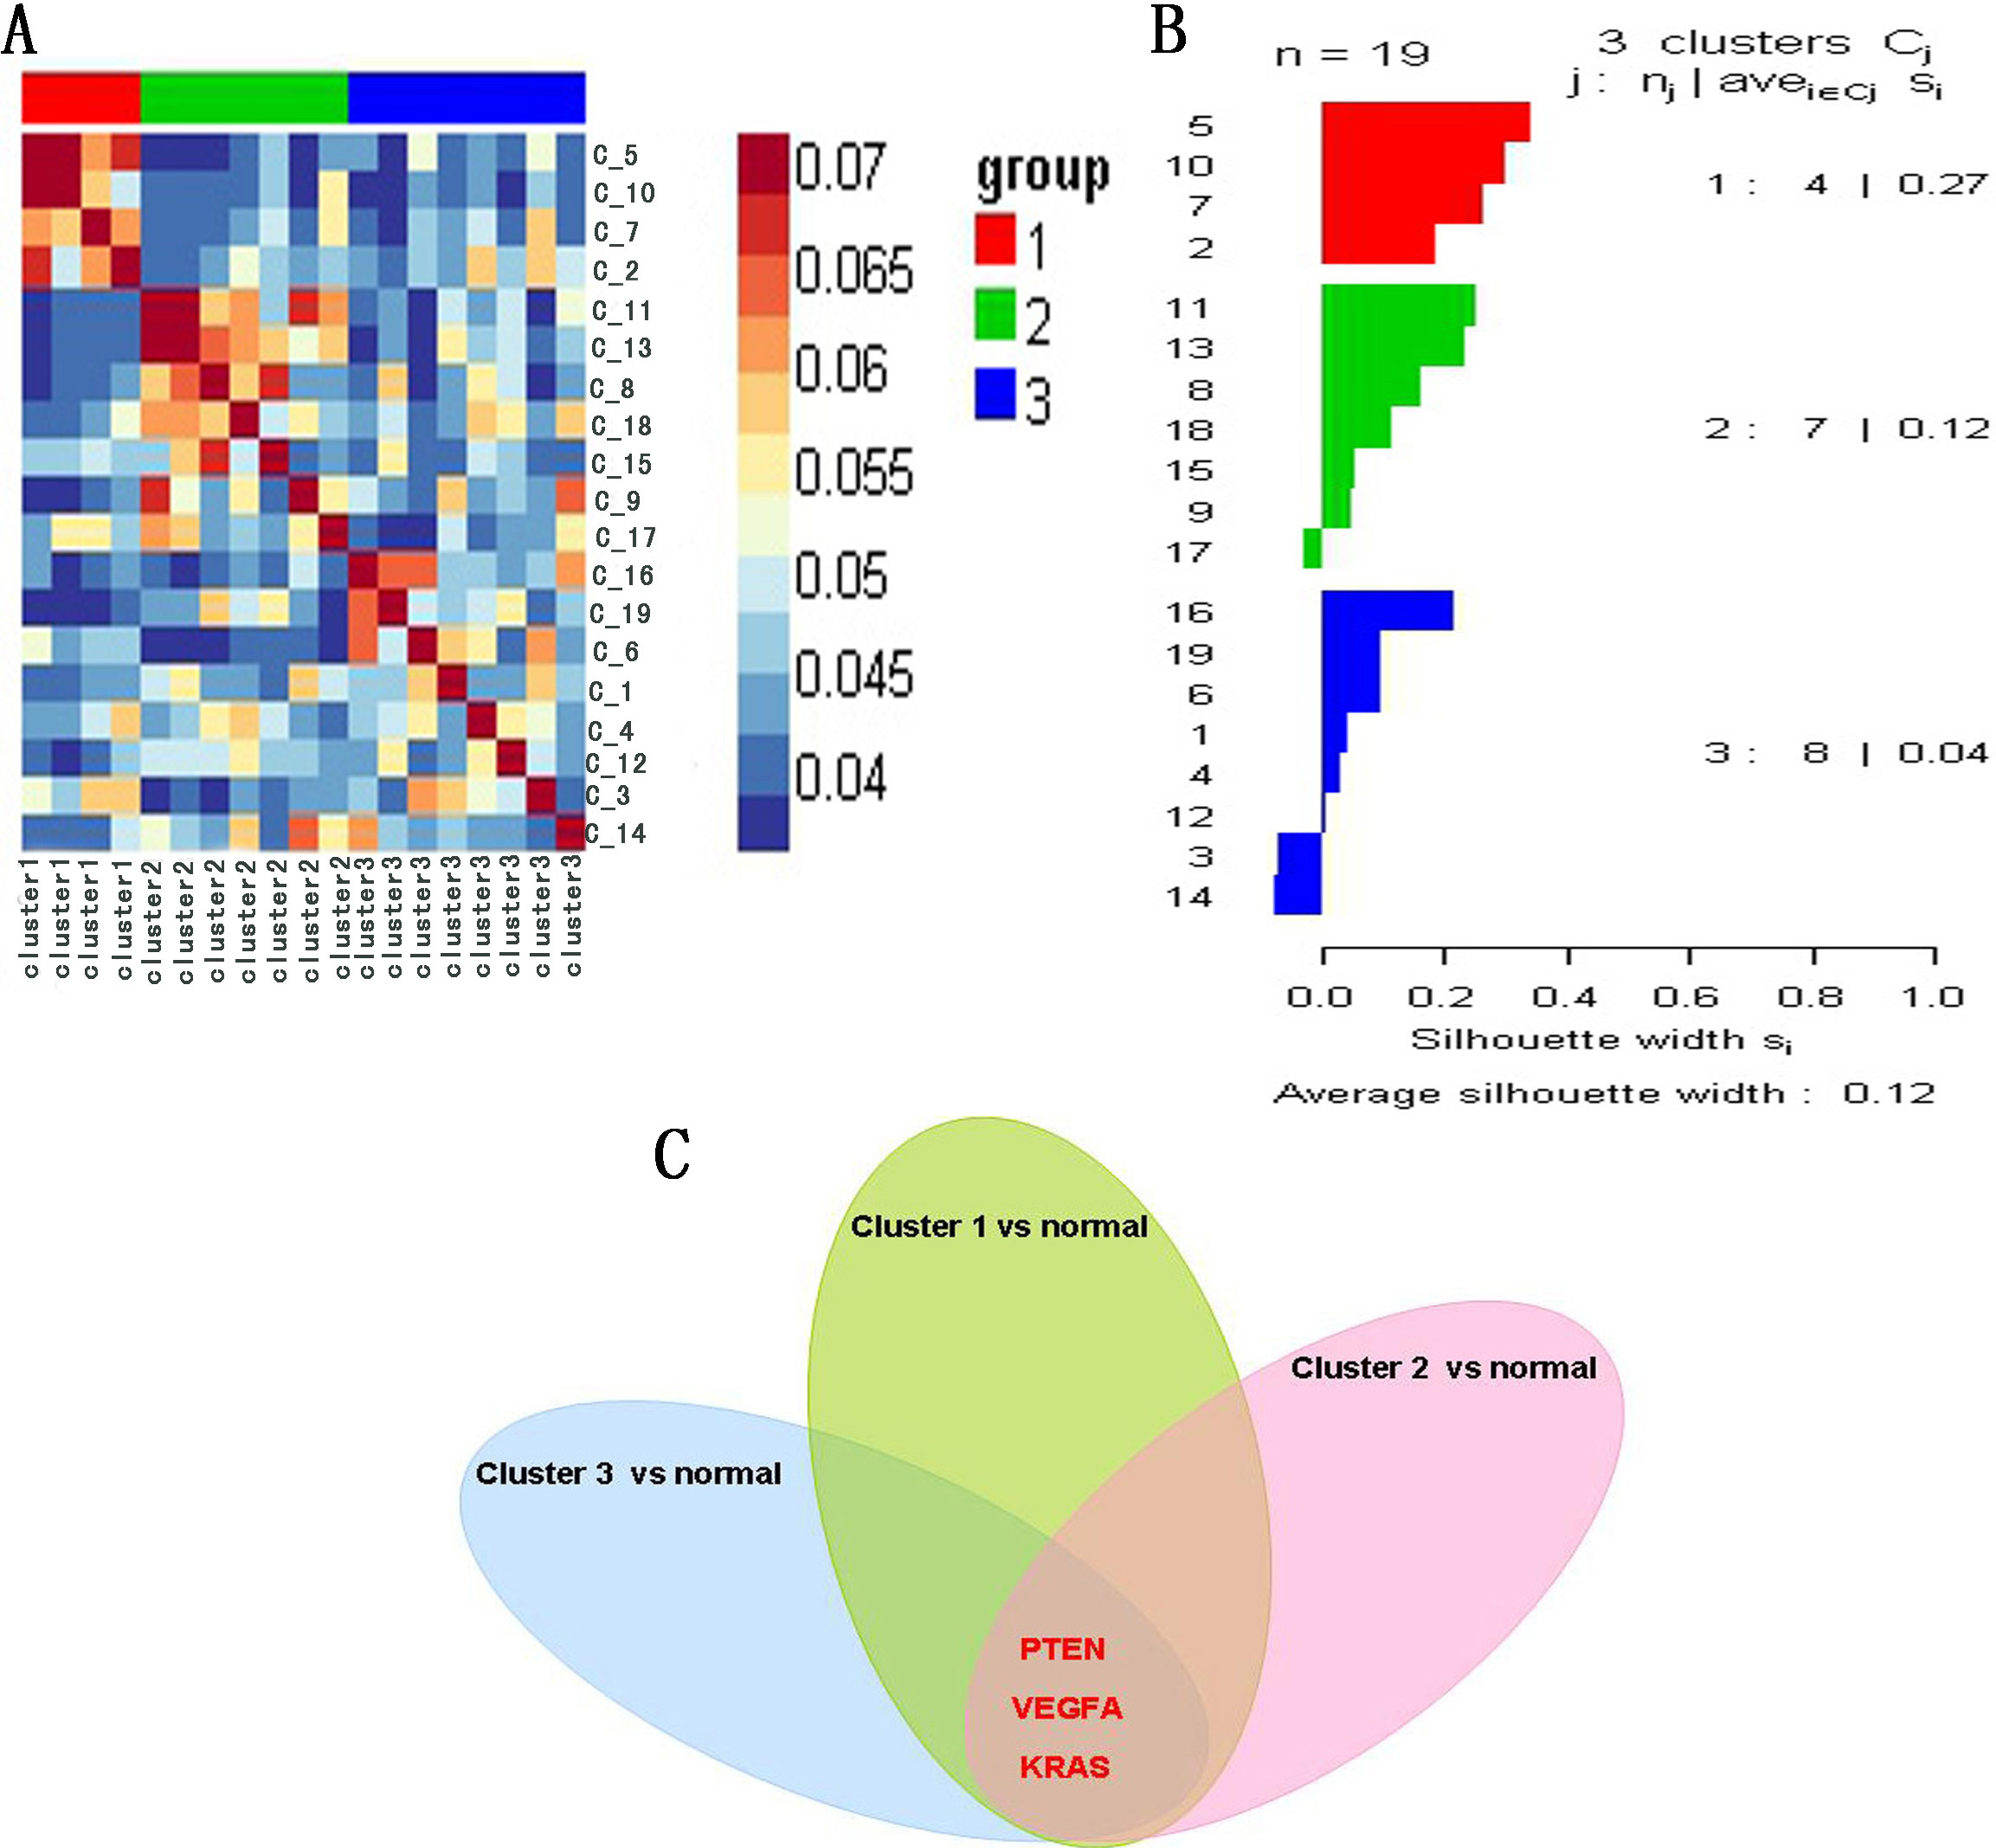
To validate the potential COPD-related genes involved in the network, we performed cluster analysis by combining miRNA with mRNA expression profile of 19 COPD patients based on SNF method. The results indicate that 19 COPD patients were divided into three clusters: A heatmap (Fig. 6A) and a silhouette plot (Fig. 6B) describe these three clusters. Cluster 1, cluster 2 and cluster 3 include 4, 7 and 8 COPD patients respectively. A higher silhouette score indicates that there is greater similarity between samples of the same cluster. In this analysis, silhouette score of cluster 1 was the highest (S
Figure 6.
(A) Heatmap of cluster analysis based on SNF method. (B) Silhouette plot of three clusters. Silhouette score indicates the consistency within clusters of data. (C) The common genes: PTEN, VEGFA and KRAS, were shared by three top 50 differentially expressed genes sets.
4.Discussions
Currently, many studies have established that genetic, epigenetic, and environmental factors are risk factors responsible for the incidence and progression of COPD in general population. By performing integration data analysis, the key regulators of COPD can be identified. In the past few years, many studies have shown that miRNA-mRNA dysregulation leads to the metastasis of cancers [37]. Previous studies have reported about the effects of smoke exposure on the expression of miRNA; however, these studies have provided little information about the role of miRNAs in COPD ci38. Very few studies have reported about how miRNA-mRNA dysregulation triggers COPD in patients, because very less data is available about miRNA-mRNA dual expression profile till date. In the present study, we conducted canonical correlation analysis to extract the potential COPD-related genes: the miRNA-mRNA dual expression profile data was analyzed to determine miRNA-mRNA association with COPD. The identified genes were found to be strongly associated with the susceptibility of COPD in patients, and this observation was supported by previous and recent evidences. By performing integrative data analysis of miRNA-mRNA dual expression profile, we found that miRNA-mRNA regulation played a pivotal role in the incidence and progression of COPD. Furthermore, the novel COPD-related key regulators and biomarkers could be directly identified by this analysis.
Canonical correlation analysis (CCA) does have some limitations. Because CCA is based on linear transformations, it has limited applications in biomedical sciences. Furthermore, some identified potential biomarkers may be identified as false positive predictors by CCA. Recently, non-linear canonical correlation analysis has been developed; this technique applies non-linear functions to original variables in order to extract correlated components from two sets of variables [39]. In future studies, we will consider some new methods to implement this analysis. Another important limitation of this study is as follows: we only selected the validated miRNA-target regulations in databases, and many predicted miRNA-target regulations were not come into the analysis. Our method also does not identify regulation by translation inhibition. In addition, one of the major limitations of our analysis is the fact that there are very few miRNA-mRNA dual expression profiles related to COPD. As we know, unconvincing results are obtained by analyzing small sample sizes. In this study, we used algorithms that effectively analyzed high-dimensional data from small sample sizes, such as SAM, RCC, and SNF. Thus, we ensured that reliable results could be obtained from this analysis. We hope that more miRNA-mRNA dual expression profiles related to COPD would be available in the near future. These COPD-related profiles can then be used to perform similar analysis and to validate these results. In our current study, the identified COPD-related biomarkers were not validated by biological assays. In future studies, molecular biology experiments must be conducted to validate the findings of our study.
Another limitation of this study is that the multiple testing was not performed when filtering miRNA-mRNA pairs based on spearman correlation test. In fact, multiple testing procedures play an important role in detecting the presence of correlation. False Discovery Rate (FDR) is one of the multiple testing methods. The simple FDR estimation can be computed from p-values using Benjamini-Hochberg procedure. In this way, small p-values result in small FDR estimates. In our current study, the most significant miRNA-mRNA pairs with the smallest p-values were kept in the network. However, we could not ascertain whether those extracted miRNA-mRNA pairs that were not able to pass multiple testing were significant, and they might be the false positive discoveries.
Moreover, some studies that were based on network analysis have reported the following results: they found that the expressions of genes with differential methylation regions (DMRs) were highly negatively correlated with corresponding DNA methylations levels. This indicates that DNA methylation plays an important role in the incidence and progression of diseases [40]. Indeed, the high-throughput sequencing data analysis and the global DNA methylation analysis of airway epithelia in COPD have found some genes that are hyper-methylated and down-regulated in COPD, such as VEGFA, which is regulated by miR-378, miR-361-5p and miR-383 [41]. In the current study, we did not identify methylation events because the matched COPD-related DNA methylation data are lacking. In fact, it is preferable to combine multiple data types rather than exploiting them separately; this will be an effective strategy to identify biomarkers related to COPD. In future studies, the underlying mechanism governing complex molecular regulation must be investigated by integrating multiple data types, such as DNA methylation data, somatic mutation data, and copy number data of biological networks. These studies will help researchers to have a better understanding of biological factors, which can be used for further experimental validations and discoveries of COPD biomarkers.
Acknowledgments
This work is supported by Beijing Natural Science Foundation (Grant No. 7142015), National Natural Science Foundation of China (Grant Nos. 31100905) and the foundation-clinical cooperation project of Capital Medical University (16JL58).
Conflict of interest
None to report.
References
[1] | Freeman CM, Martinez CH, Todt JC, Martinez FJ, Han MK, Thompson DL, et al. Acute exacerbations of chronic obstructive pulmonary disease are associated with decreased CD4+ & CD8+ T cells and increased growth & differentiation factor-15 (GDF-15) in peripheral blood. Respiratory Research. (2015) ; 16: : 94. |
[2] | Tse HN, Tseng CZS. Update on the pathological processes, molecular biology, and clinical utility of N-acetylcysteine in chronic obstructive pulmonary disease. Int J Chron Obstruct Pulmon Dis. (2014) ; 9: : 825-36. |
[3] | Chu J-H, Hart JE, Chhabra D, Garshick E, Raby BA, Laden F. Gene expression network analyses in response to air pollution exposures in the trucking industry. Environmental Health. (2016) ; 15: : 101. |
[4] | Quitadamo A, Tian L, Hall B, Shi X. An integrated network of microRNA and gene expression in ovarian cancer. BMC Bioinformatics. (2015) ; 16: (Suppl 5): S5. |
[5] | Francis SMS, Davidson MR, Tan ME, Wright CM, Clarke BE, Duhig EE, et al. MicroRNA-34c is associated with emphysema severity and modulates SERPINE1 expression. BMC Genomics. (2014) ; 15: : 88. |
[6] | Francis SMS, Larsen JE, Parey SJ, DuhigEE, ClarkeBE, BowanRV, et al. Genes and Gene Ontologies Common to Airflow Obstruction and Emphysema in the Lungs of Patients with COPD. PLoS ONE. (2011) ; 6: (3): e17442. |
[7] | Wang M, Huang Y, Liang ZA, Liu D, Lu Y, Dai Y, et al. Plasma miRNAs might be promising biomarkers of chronic obstructive pulmonary disease. Clin Respir J. (2016) ; 10: : 104-11. |
[8] | Conickx G, Mestdagh P, Cobos FA, Verhamme FM, Maes T, Vanaudenaerde BM, et al. MicroRNA Profiling Reveals a Role for MicroRNA-218-5p in the Pathogenesis of Chronic Obstructive Pulmonary Disease. Am J Respir Crit Care Med. (2016) ; Jul 13. |
[9] | Fawzy MS, Hussein MH, Abdelaziz EZ, Yamany HA, Ismail HM, Toraih EA. Association of MicroRNA-196a2 Variant with Response to Short-Acting β2-Agonist in COPD: An Egyptian Pilot Study. PLoS ONE. (2016) ; 11: (4). |
[10] | Ezzie ME, Crawford M, Cho J-H, Orellana R, Zhang S, Gelinas R, et al. Gene expression networks in COPD: microRNA and mRNA regulation. Thorax. (2012) ; 67: : 122-31. |
[11] | Larsson O, Wahlestedt C, Timmons JA. Considerations when using the significance analysis of microarrays (SAM) algorithm. BMC Bioinformatics. (2005) ; 6: : 129. |
[12] | Reiner A, Yekutieli D, Benjamini Y. Identifying differentially expressed genes using false discovery rate controlling procedures. Bioinformatics. (2003) ; 19: (3): 368-75. |
[13] | Lunt M, Solomon D, Rothman K, Glynn R, Hyrich K, Symmons DPM, et al. Different Methods of Balancing Covariates Leading to Different Effect Estimates in the Presence of Effect Modification. Am J Epidemiol. (2009) ; 169: (7): 909-17. |
[14] | Becker S. Mutual information maximization: models of cortical selforganization. Network Computation in Neural Systems. (1996) ; 7: (1): 7-31. |
[15] | Hsu S-D, Lin F-M, Wu W-Y, Liang C, Huang W-C, Chan W-L, et al. miRTarBase: a database curates experimentally validated microRNA – target interactions. Nucleic Acids Res. (2011) ; 39: (Database issue): D163-D9. |
[16] | Xiao F, Zuo Z, Cai G, Kang S, Gao X, Li T. miRecords: an integrated resource for microRNA – target interactions. Nucleic Acids Res. (2009) ; 37: (Database issue): D105-D10. |
[17] | Sethupathy P, Corda B, Hatzigeorgiou AG. TarBase: A comprehensive database of experimentally supported animal microRNA targets. RNA. (2006) ; 12: (2): 192-7. |
[18] | Diz AP, Carvajal-Rodríguez A, Skibinski DOF. Multiple Hypothesis Testing in Proteomics: A Strategy for Experimental Works. Mol Cell Proteomics. (2011) ; 10: (3): M110004374. |
[19] | Hamosh A, Scott AF, Amberger JS, Bocchini CA, McKusick VA. Online Mendelian Inheritance in Man (OMIM), a knowledgebase of human genes and genetic disorders. Nucleic Acids Res. (2005) ; 33: (Database issue): D514-D7. |
[20] | Furey TS, Cristianini N, Duffy N, Bednarski DW, Schummer M, Haussler D. Support vector machine classification and validation of cancer tissue samples using microarray expression data Bioinformatics. (2000) ; 16: (10): 906-14. |
[21] | Usai MG, Goddard ME, Hayes BJ. LASSO with Cross-Validation for Genomic Selection. Genetics Research. (2009) ; 91: (6): 427-36. |
[22] | Wang B, Mezlini AM, Demir F, Fiume M, Tu Z, Brudno M, et al. Similarity network fusion for aggregating data types on a genomic scale. Nature Methods. (2014) ; 11: : 333-7. |
[23] | Wang J, Huang W, Wu Y, Hou J, Nie Y, Gu H, et al. MicroRNA-193 Pro-Proliferation Effects for Bone Mesenchymal Stem Cells After Low-Level Laser Irradiation Treatment Through Inhibitor of Growth Family, Member 5. Stem Cells Dev. (2012) ; 21: (13): 2508-19. |
[24] | Wang H, Fan Z, Zhao M, Li J, Lu M, Liu W, et al. Oscillating primary transcripts harbor miRNAs with circadian functions. Sci Rep. (2016) ; 6: : 21598. |
[25] | Menche J, Sharma A, Cho MH, Mayer RJ, Rennard SI, Celli B, et al. A diVIsive Shuffling Approach (VIStA) for gene expression analysis to identify subtypes in Chronic Obstructive Pulmonary Disease. BMC Systems Biology. (2014) ; 8(Suppl 2): : S8. |
[26] | McDonald M-LN, Mattheisen M, Cho MH, Liu Y-Y, Harshfield B, Hersh CP, et al. Beyond GWAS in COPD: Probing the Landscape between Gene-Set Associations, Genome-Wide Associations and Protein-Protein Interaction Networks. Hum Hered. (2014) ; 78: : 131-9. |
[27] | Yasuo M, Mizuno S, Kraskauskas D, Bogaard HJ, Natarajan R, Cool CD, et al. Hypoxia inducible factor-1α in human emphysema lung tissue. Eur Respir J. (2011) ; 37: (4): 775-83. |
[28] | Scheele IV, Larsson K, Dahleń B, Billing B, Skedinger M, Lantz A-S, et al. Toll-like receptor expression in smokers with and without COPD. Respiratory Medicine. (2011) ; 105: : 1222-30. |
[29] | Zhou S, Li M, Zeng D, Xu X, Fei L, Zhu Q, et al. A Single Nucleotide Polymorphism in 3’ Untranslated Region of Epithelial Growth Factor Receptor Confers Risk for Pulmonary Hypertension in Chronic Obstructive Pulmonary Disease. Cell Physiol Biochem. (2015) ; 36: (1): 166-78. |
[30] | Bei L, Xuan Z, Li C, Cong F, Tanshi L. Expression of microRNAs in lung homogenates in rats with chronic obstructive pulmonary disease. Zhonghua Wei Zhong Bing Ji Jiu Yi Xue. (2014) ; 26: (12): 905-9. |
[31] | Rabinovich RA, Drost E, Manning JR, Dunbar DR, Díaz-Ramos M, Lakhdar R, et al. Genome-wide mRNA expression profiling in vastus lateralis of COPD patients with low and normal fat free mass index and healthy controls. Respir Res. (2015) ; 16: (1): 1. |
[32] | Henson PM, Vandivier RW, Douglas IS. Cell death, remodeling, and repair in chronic obstructive pulmonary disease? Proc Am Thorac Soc. (2006) ; 3: (8): 713-7. |
[33] | Mantovani A. Pentraxin-3 in COPD: innocent bystander or amplifier? European Respiratory Journal. (2012) ; 39: : 795-6. |
[34] | Boots AW, Haenen GRMM, Bast A. Oxidant metabolism in chronic obstructive pulmonary disease. Eur Respir J Suppl (2003) ; 46: : 14s-27s. |
[35] | Hu H, Zhang L, Teng G, Wu Y, Chen Y. A variant in 3’-untranslated region of KRAS compromises its interaction with hsa-let-7g and contributes to the development of lung cancer in patients with COPD. International Journal of COPD. (2015) ; 10: : 1641-9. |
[36] | Molina-Pinelo S, Pastor MD, Suarez RO, Romero-Romero B, Peña MGlDl, Salinas A, et al. MicroRNA clusters: dysregulation in lung adenocarcinoma and COPD. Eur Respir J. (2014) ; 43: : 1740-9. |
[37] | Jacobsen A, Silber J, Harinath G, Huse JT, Schultz N, Sander C. Analysis of microRNA-target interactions across diverse cancer types. Nature Structural & Molecular Biology Volume. (2013) ; 20: : 1325-32. |
[38] | Izzotti A, Calin GA, Steele VE, Croce CM, Flora SD. Relationships of microRNA expression in mouse lung with age and exposure to cigarette smoke and light. The FASEB Journal. (2009) ; 23: (9): 3243-50. |
[39] | Hsieh WW. Nonlinear canonical correlation analysis by neural networks. Neural Netw. (2000) ; 13: (10): 1095-105. |
[40] | Yu K, Steppi A, Xu Y, Tang K, Zhang J. Abstract A04: Differential DNA methylation and network analysis in African American breast cancer. Cancer Epidemiology Biomarkers & Prevention. (2016) ; 25: (3 Supplement): A04-A. |
[41] | Yoo S, Takikawa S, Geraghty P, Argmann C, Campbell J, Lin L, et al. Integrative Analysis of DNA Methylation and Gene Expression Data Identifies EPAS1 as a Key Regulator of COPD. PLoS Genet. (2015) ; 11: (1): e1004898. |
Appendices
Supplementary materials
Supplement Table 1
GO function enrichment analysis for miRNAs targets
| miRNA | Domains | GO ID | Description | p-value | Adjusted p-value |
|---|---|---|---|---|---|
| miR-378 | CC | GO:0044444 | Cytoplasmic part | 2.3E-03 | 0.0259 |
| CC | GO:0043234 | Protein complex | 4.0E-03 | 0.0259 | |
| CC | GO:0032991 | Macromolecular complex | 9.5E-03 | 0.0413 | |
| BP | GO:0051246 | Regulation of protein metabolic process | 1.4E-04 | 0.004 | |
| BP | GO:0035556 | Intracellular signal transduction | 2.4E-04 | 0.004 | |
| BP | GO: 0031325 | Positive regulation of cellular metabolic process | 3.8E-04 | 0.004 | |
| BP | GO: 0048522 | Positive regulation of cellular process | 5.1E-04 | 0.004 | |
| BP | GO: 0009893 | Positive regulation of metabolic process | 5.2E-04 | 0.004 | |
| MF | GO:0005515 | Protein binding | 1.1E-02 | 0.0317 | |
| miR-208b | BP | GO: 0012501 | Programmed cell death | 2.1E-05 | 0.0003 |
| BP | GO:0008219 | Cell death | 4.3E-05 | 0.0003 | |
| BP | GO: 0016265 | Death | 4.4E-05 | 0.0003 | |
| BP | GO: 0006796 | Phosphate-containing compound metabolic process | 1.0E-03 | 0.0053 | |
| BP | GO: 0006793 | Phosphorus metabolic process | 1.1E-03 | 0.0053 | |
| BP | GO: 0048522 | Positive regulation of cellular process | 1.7E-03 | 0.0068 | |
| BP | GO: 0048518 | Positive regulation of biological process | 3.2E-03 | 0.011 | |
| BP | GO:0060255 | Regulation of Macromolecule metabolic process | 5.5E-03 | 0.016 | |
| BP | GO: 0051179 | Localization | 6.9E-03 | 0.017 | |
| BP | GO: 0031323 | Regulation of cellular metabolic process | 7.8E-03 | 0.017 | |
| BP | GO:0080090 | Regulation of primary metabolic process | 8.0E-03 | 0.017 | |
| BP | GO:0019222 | Regulation of metabolic process | 1.4E-02 | 0.029 |
CC: Cellular Component; BP: Biological Process; MF: Molecular Function.
Supplement Fig. 1.
The canonical correlation coefficients between the original variable and the canonical variables. The highest canonical correlation coefficient of 0.74 was seen from the original variable and the first canonical variable; therefore all of the correlation coefficients between the original variable and the first canonical variable were selected.