
A comprehensive prediction and evaluation method of pilot workload
Abstract
BACKGROUND:
The prediction and evaluation of pilot workload is a key problem in human factor airworthiness of cockpit.
OBJECTIVE:
A pilot traffic pattern task was designed in a flight simulation environment in order to carry out the pilot workload prediction and improve the evaluation method.
METHODS:
The prediction of typical flight subtasks and dynamic workloads (cruise, approach, and landing) were built up based on multiple resource theory, and a favorable validity was achieved by the correlation analysis verification between sensitive physiological data and the predicted value.
RESULTS:
Statistical analysis indicated that eye movement indices (fixation frequency, mean fixation time, saccade frequency, mean saccade time, and mean pupil diameter), Electrocardiogram indices (mean normal-to-normal interval and the ratio between low frequency and sum of low frequency and high frequency), and Electrodermal Activity indices (mean tonic and mean phasic) were all sensitive to typical workloads of subjects.
CONCLUSION:
A multinominal logistic regression model based on combination of physiological indices (fixation frequency, mean normal-to-normal interval, the ratio between low frequency and sum of low frequency and high frequency, and mean tonic) was constructed, and the discriminate accuracy was comparatively ideal with a rate of 84.85%.
1.Introduction
Research indicated that humans were the cause of more than 2/3 aviation accidents [1]. Based on this information, to guarantee safety, Federal Aviation Administration (FAA) in Federal Aviation Regulation (FAR) 25.771 and FAR 25.1523 stated the related requirements of pilot workload [2]. The promotion and application of Head-Up Display (HUD) technique has been used to solve the allocation of attention resource problems induced by the frequent alternation between head down display and head up to the target outside the cockpit. But certain difficulties in ergonomics need to be further optimized and solved, such as fatigue based on visual coding, confusion caused by vision overlay, and spatial orientation caused by single color display [3, 4]. Subjective assessment was the primary method for the certification of pilot workload, and the physiological method can also be accepted for reference [3].
Researchers claimed that during a flight task, the fixation and saccade behavior of eye movements are closely related to pilot workload and attention allocation [5, 6]. When dealing with a visual task the pilot’s blinking pattern changes; the pupil dilation and cognitive workload in a human-computer interaction task were closely connected [7, 8]. The Low Frequency (LF) and High Frequency (HF) elements of Heart Rate Variability (HRV) indicated the activation of sympathetic nerve and parasympathetic nerve system, and in the actual flight task, the HF increased as the task difficulty increased [9]. The ratio between LF and HF (LF/HF) decreased as the task difficulty increased, which reflects the balance between the sympathetic nerve and parasympathetic nerve system [7, 10]. The stimulation of the sympathetic nerve system speeds up skin’s metabolism and the secretion of sweat glands, and the increase of perspiration can lead to a higher Electrodermal Activity (EDA) response in a complicated flight task [11]. When compared with assessments based on the single index, a comprehensive evaluation that combines eye movement, Electrocardiogram (ECG) data, and other physiological measurements can achieve better results [9, 12].
The Timeline Analysis and Prediction (TLAP) method and McCrachen-Aldrich (M-A) prediction technology [13] were two major prediction methods of task workload. The multiple resource theory [14] was widely acknowledged in the prediction of workload, and a combination of them has been done in our research to realize a theoretical prediction of workload. There were many research groups globally who relied on mathematical modeling in order to discriminate the pilot workload status. The major workload models include discriminant analysis [15, 16], regression analysis [17] and support vector machine (SVM) model [18], but the modeling of dynamic flight task based on HUD simulation was relatively rare. Nowadays, pilot discrimination models face several major setbacks, such as relatively stronger subjective factors, the undesirable consequences of single or comprehensive physiological indices, and the high expenses of physiological equipment [12]. From the perspective of principles and applications of the model, discriminant analysis was based on the discrepancy of distance between output of models and the center of category. Logistic regression responsible for classification of samples was based on regression function values, and the maximum likelihood method was used to estimate the parameters of the equation regression.
Focusing on the background, research was carried out on workload based on HUD to test the subject’s physiological response. To test the sensitivity of the physiological index to workload, a new index, LF/LHF (the ratio between LF and sum of LF and HF), was attempted. And at last, a comprehensive prediction and evaluation method of pilot workload based on the theoretical prediction of pilot workload and the physiological discriminate method was put forward. Our study started with the basic duties and pilot workload element in FAR 25 Appendix D [2], combined with relevant above flight task requirements in the flight manual to conduct a pilot traffic pattern task in flight simulation environment. That was also a basis for TLAP and M-A technology, and used for the prediction of pilot workload. Then, a statistical analysis was conducted to select sensitive physiological indices for mathematical modeling, and a better discriminate result was obtained on multinomial logistic regression model. Our research carried out a preliminary experiment study, which can offer a certain physiological basis for compliance verification of the airworthiness terms relevant to human factor.
2.Prediction and evaluation method of workload
2.1Prediction of workload
Wickens put forward a multiple resource theory where the visual, verbal, cognitive, and motion dimensions constituted the information processing resource of human beings [14]. When combined with the task timeline analysis method and the MaCrachen-Aldrich scale (M-A scale) evaluation method [13], the multiple resource theory [14] introduced the time effect and task decomposition to typical flight tasks to accomplish the dynamic workload prediction.
(1)
Equation (1) calculated the total workload of flight phases. While
Table 1 shows the subtask duration and M-A scores. For example, take the approach phase with regards to subtask 8, and the M-A scores were 7.1 points (visual: the recognition of altitude on HUD, 3.7 point; verbal: no activity, 0 point; cognition: the next operation to speed controls, 1.2 point; motion: adjust speed controls to 160 knots, 2.2 point). The accumulated workload was
Table 1
Design of flight simulation task and prediction of subtask workload
| Phases | No. | Operations | Detailed operations | Concerned instrument ( | Duration | M-A |
|---|---|---|---|---|---|---|
| Cruise | 1 | Monitor parameters on HUD | Monitor primary flight parameters on HUD | Altitude, airspeed, pitch angle, roll angle, and heading displayed on HUD | 138.09 | 2 |
| Approach | 1 | APP mode | Search for position of glide slope indicator on HUD | HUD glide slope indicator, APP switch | 3 | 7.7 |
| 2 | Flaps down to 15 degree | (Keyboard Operation in “F7” 3 times), Flaps down | Flap position indicator | 2 | 3.2 | |
| 3 | Altitude descend to 2000 ft | Observe altitude on HUD | HUD altitude | 6 | 5 | |
| 4 | Flaps down to 35 degree | (Keyboard operation “F7” 2 times), Flaps down | Flap position indicator | 2 | 3.2 | |
| 5 | Adjust airspeed to 180 knots | MCP panel adjustment (mouse operation) | HUD airspeed | 5 | 7.1 | |
| 6 | Set auto-brake switch | Auto-brake switch stage 2 (mouse operation) | Auto brake select switch | 2 | 7.1 | |
| 7 | Altitude descend to 1500 ft | Observe altitude on HUD | HUD altitude | 6 | 5 | |
| 8 | Adjust airspeed to 160 knots | MCP panel adjustment (mouse operation) | HUD airspeed | 5 | 7.1 | |
| 9 | Gear down | (Keyboard operation “G”), confirm landing gear | Landing gear panel | 3 | 8.2 | |
| 10 | Altitude descend to 1000 ft | Observe altitude on HUD | HUD altitude | 6 | 5 | |
| 11 | Adjust airspeed to 140 knots | MCP panel adjustment (mouse operation) | HUD airspeed | 5 | 7.1 | |
| 12 | Arm spoilers | (Keyboard operation “shift+/”) | HUD altitude | 2 | 4.2 | |
| 13 | Cut off autothrotte | MCP panel adjustment (mouse operation) | Command engage switch | 2 | 4.4 | |
| 14 | Disconnect the auto-pilot | (keyboard operation “Z”) | Command engage switch | 3 | 13.4 | |
| 15 | Monitor parameter on HUD | Instrument monitoring | HUD flight parameters | 87.09 | 2 | |
| Landing | 1 | Descend altitude placidly | (Flying rocker operation) | HUD altitude | 22 | 8.6 |
| 2 | Throttle down | (Flying rocker operation) | Engine indication | 5 | 8.6 | |
| 3 | Prepare to pull up | (Flying rocker operation) | HUD airspeed | 12 | 18.2 | |
| 4 | Slow it down | (Flying rocker operation) | Information of airport runway | 3 | 12.2 | |
| 5 | When touched the ground | Decide according to runway | HUD altitude | 8 | 11.6 | |
| 6 | Open the thrust reverser | (Keyboard operation “F2”, flying rocker operation) | Information of airport runway | 5 | 10.3 | |
| 7 | Brake manually | (Keyboard operation “. ”, flying rocker operation) | HUD airspeed | 5 | 7.6 | |
| 8 | Close thrust reverser | (Keyboard release “F2”) | HUD airspeed | 44.36 | 2 | |
| 9 | Monitor parameters on HUD | Instrument monitoring | HUD flight parameters | 22 | 8.6 |
2.2Evaluation of workload
A further modeling for the three typical flight phases (cruise, approach and landing) was developed. To build up the model with an eye for an uncertain practical category of typical workload and to the greatest extent for the reduction of misjudgment, the multinomial logistic regression theory was selected. The multinomial logistic regression was a natural expansion of regression analysis, which the independent variables don’t have to fulfill the multivariate normal distribution hypothesis. The multinomial logistic regression had the least assumption and the least strict criterion, therefore it can be employed if there is uncertainty of whether all assumptions can be satisfied or whether there is an order of typical workloads [17].
Within a
(2)
and the final class (class
(3)
Note
3.Materials and methods
3.1Subjects
Fourteen male flying cadets were recruited in our study; two that crashed, one that ran out of the runway (since these subjects were unable to accomplish our experiment, and the data could not be recorded for analysis), and eleven who had valid data. Each cadet had either one or two years of flight simulation experience with in-depth knowledge of flight simulation operations from the Civil Aviation University of China. Their ages ranged from 18–26, with the average age of 20.6. Each of them were right-handed with normal or rectified vision and normal hearing. All subjects were required to refrain from drinking caffeinated or alcoholic beverages, smoking, taking any medication, and strenuous exercise for twelve hours prior to the experiment.
3.2Apparatus
A Tobii TX300 with a 300 HZ sample rate was used to collect eye movement data; a five-point calibration was conducted before the formal test. KingFar International Inc provided a wireless photoelectric pulse sensor with a 64 HZ sample rate which was used to gather the ECG data. Also, a wireless galvanic skin sensor and wireless breathing sensor with a sample rate 64 HZ was provided by the same company. An ErgoLab wireless received all digital radio frequency signals.
3.3Experimental scenario
A vivid HUD flight environment (the primary flight information included airspeed, altitude, pitch, etc.) was included in the HUD display, and a single green color was used for visual coding in a simulated quiet environment for all subjects. The flying rocker, computer keyboard, and computer mouse were used to accomplish a dynamic process of traffic pattern task which included take-off, climbing, cruise, approach, and landing. The flight simulation task was conducted during the summer in Tianjin Binhai international airport, and the aircraft was 737–700 NG. The take-off runway was 16R and the frequency of localizer in instrument landing system was 110.9 MHZ. The left and right fuel tank was set at 25% of total capacity, the center tank was set at 10%, and the other original settings were as follows: park the aircraft on the runway when preparing for takeoff, switch the angle of view to interior 2D visual angle, open no smoking, fasten seat belt switch, turn on taxiing, flag indicator and high frequency flare lights, adjust the magnetic heading to 160, open flight director switch, set the speed hold 220 knots, set heading hold 160, set altitude hold 3000ft, adjust the auto-brake to RTO position and lay down 5 degree flap.
3.4Experimental design
A single factor within-subject design was applied in our experiment, the workload of typical flight phases were the diverse experimental level. Each subject has certain aircraft and HUD display training prior to the experiment. In order to be familiar with the procedures prior to the formal experiment, there was a 30-minute adaptation training. The formal experiment lasts about 20 minutes; all subjects should keep the task instructions to accomplish the experiment. HUD was used more frequently during the approach and landing phases and used less frequently during the take-off and climbing phases (lasted 73.6 s and 73.9 s); it was taken after the cruising altitude was set as 3000 ft. Based on this, a reasonable abstraction has be completed to flight operations, a reasonable abstraction has be completed to flight operations, and three typical flight phases (cruise, approach, and landing), which the mean durations were 138.09 s, 139.09s , and 107.36 s respectively, were selected to conduct an analysis of physiological indices in the dynamic full flight envelope task environment. Table 1 shows the operations of three typical flight phases and concerned instruments, including particularly concerned instruments.
4.Experimental results and analysis
Eye movement data (fixation frequency, mean fixation time, saccade frequency, mean saccade time, mean blink time, blink rate, and mean pupil diameter), ECG data (mean NN and LF element), and EDA data (mean phasic and mean tonic) were recorded and analyzed for the statistical method. For the analysis of the above data, repetitive measure analysis of variance (ANOVA) was employed. Sphericity is the condition where the variances of the differences between all combinations of related groups (levels) are equal, and the Mauchly’s test was used to test the sphericity of the data [19]. A Greenhouse-Geisser test [20, 21, 22] will be used to correct for the lack of sphericity statistically in the case that the sphericity cannot be fulfilled. The Post-hoc comparison was LSD method while the significance level was
4.1Eye movement
An analysis was conducted for the three basic eye movements: fixation, saccade, and blink. A declining trend was shown by the fixation frequency, and an increasing trend was shown by the mean fixation time with the ongoing typical flight task, as shown in Fig. 1a and b, and the CR, AP, LA of x-coordinate stands for cruise, approach and landing phases. As to typical phases of flight, the single-factor repeated measure ANOVA showed fixation frequency has significant main effects of workload (
Figure 1.
Analysis of physiological indices in typical workload.
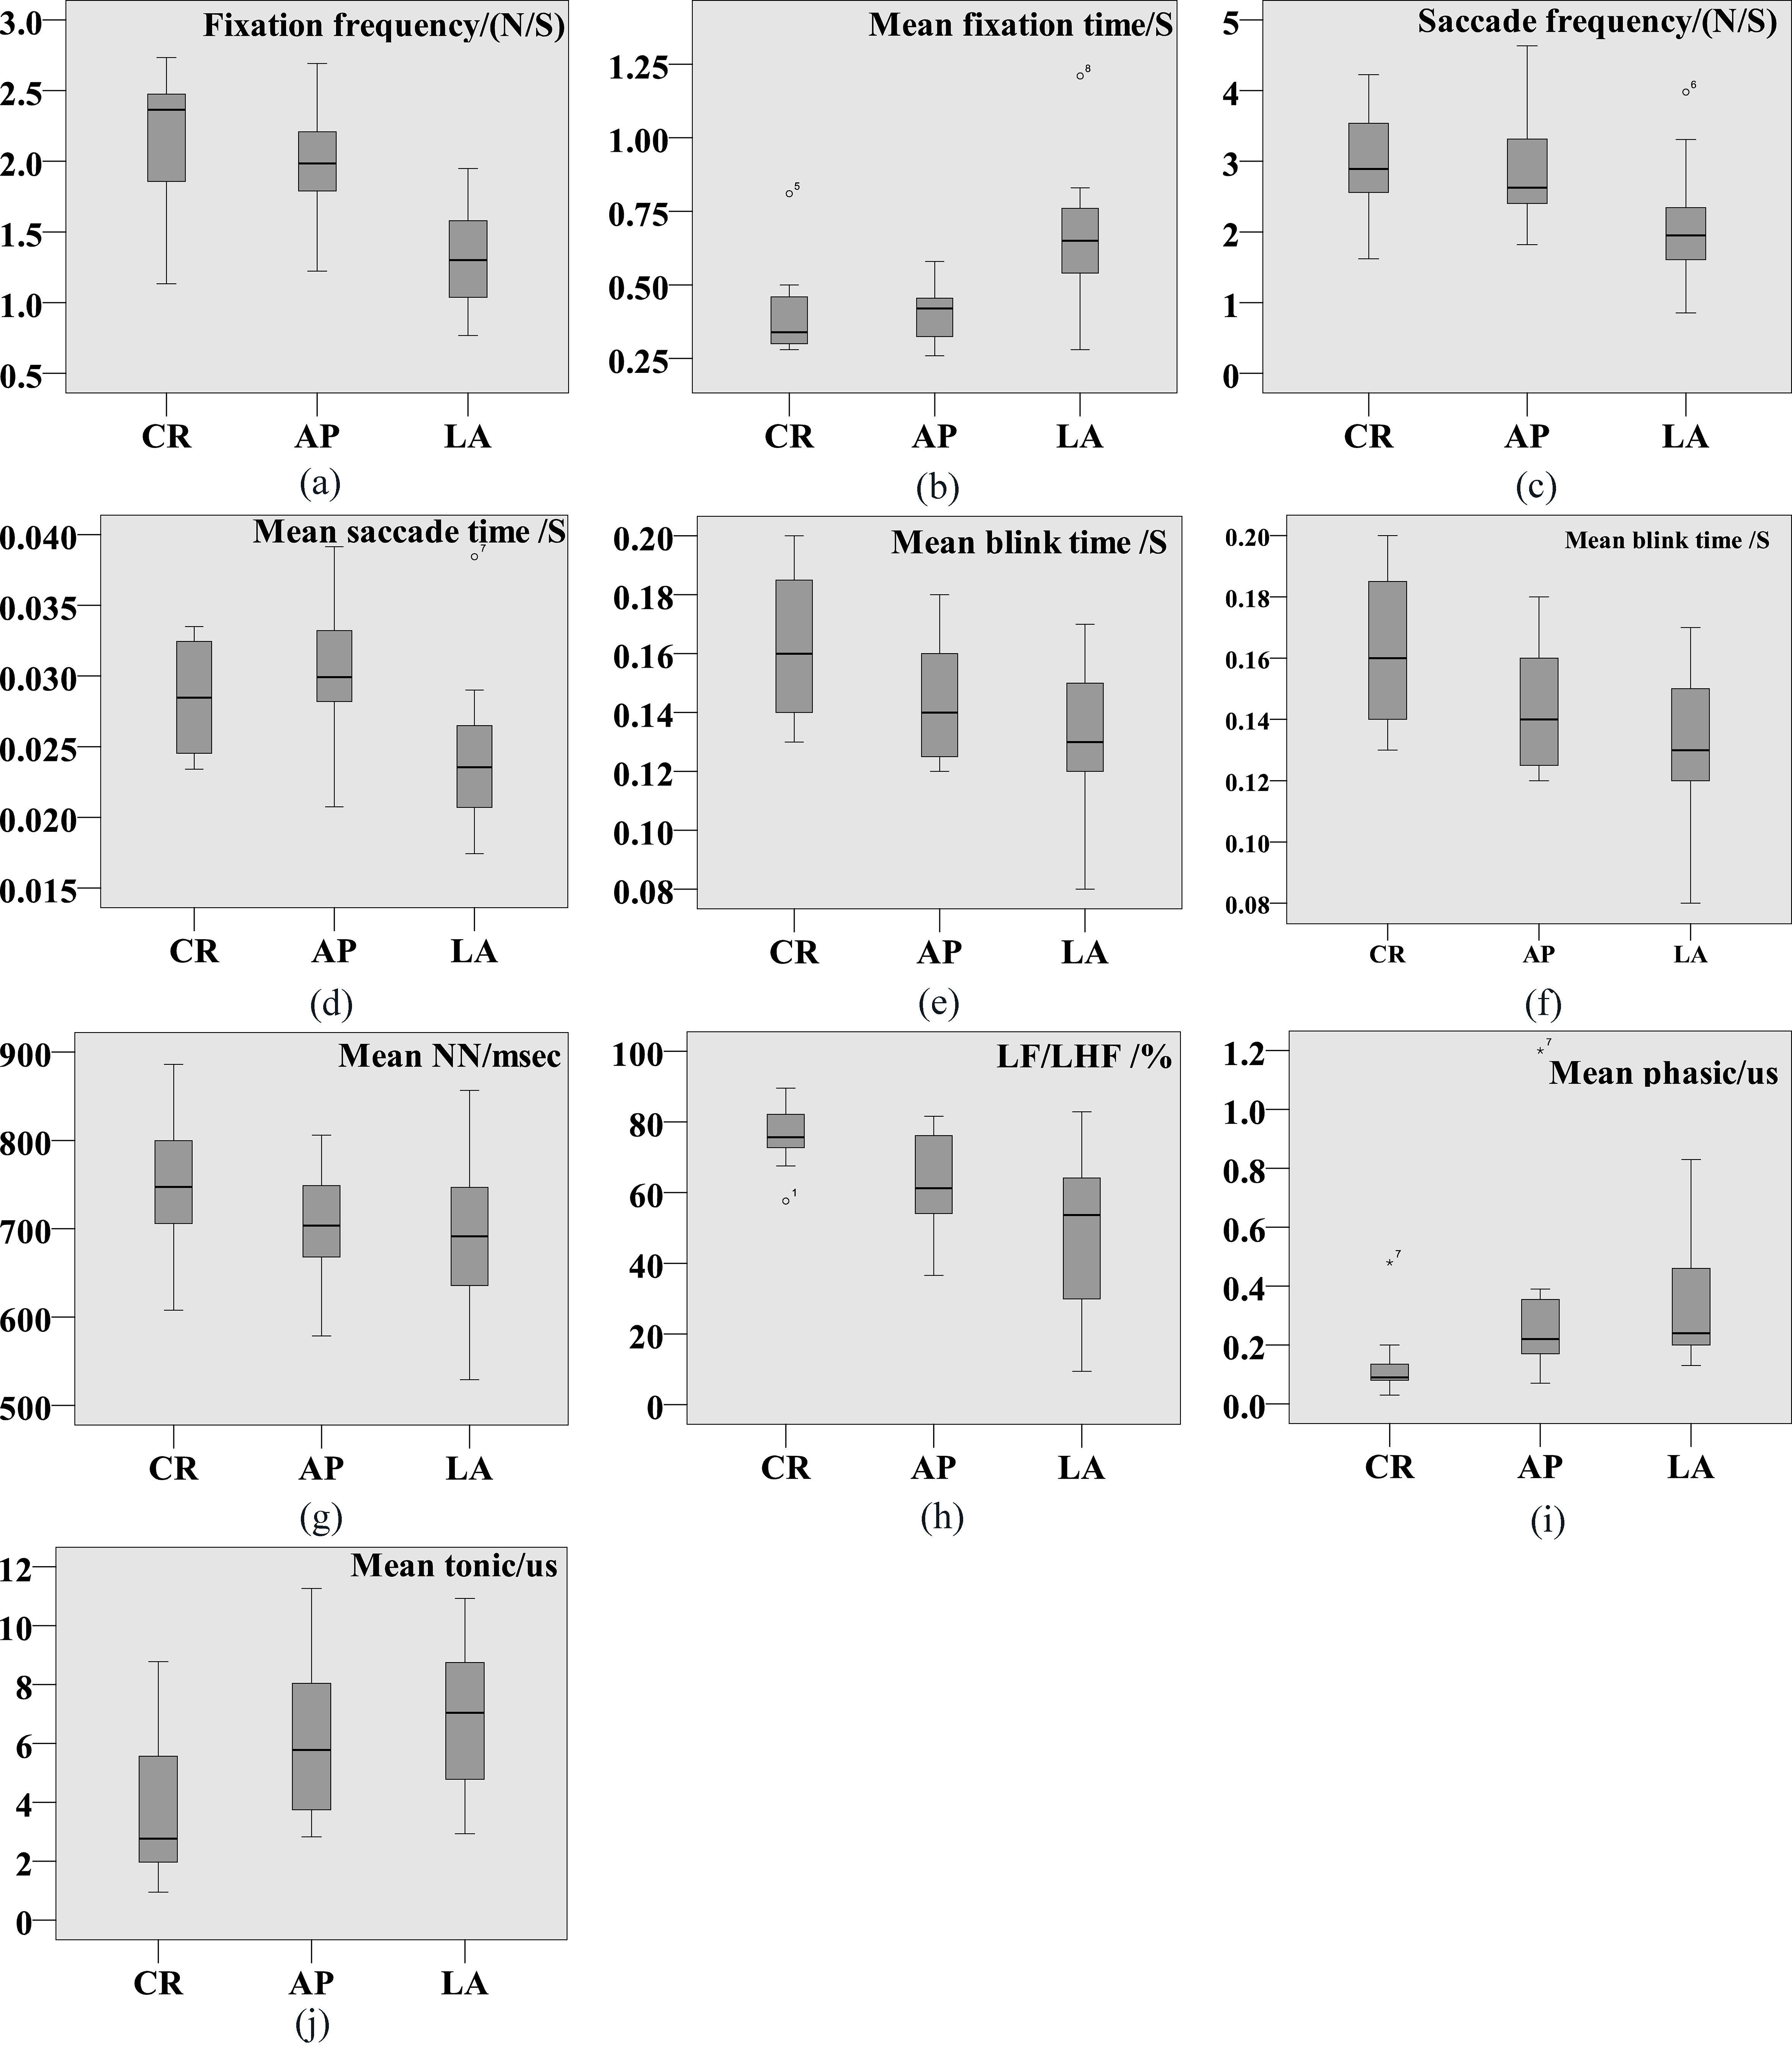
Figure 1c and d showed the average saccade frequencies and mean saccade times of the subjects under different workloads. The One-way repeated measures ANOVA indicated significant main effect of workload (
With the increase of workload, mean blink time showed a decline trend, while the mean pupil diameter showed an increase trend, as is showed in Fig. 1e and f. One-way repeated measures ANOVA showed that the effect of workload on mean blink time was significant (
4.2ECG indices
Figure 1g and h showed the average values of NN interval – the time domain index of HRV and LF/LHF – the frequency domain index of HRV under different workloads. The main effect of workload on mean NN was significant (
4.3EDA
The mean phasic and mean tonic were presented in Fig. 1i and j, and both of them showed an increase trend with the increase of workload. The main effect of workload on mean phasic was significant (
4.4Validation of workload prediction and correlation analysis between physiological indices
A protocol modeling the average pilot was used to analyze the correlation between the predictions and the measurement indices by Wickens [23, 24], and it was also used in our study for model validation purpose. The predicted value of the three typical flight subtasks (“the adjustment of airspeed”, “disconnected the auto-pilot”, “prepare to pull up”) quantified by workload prediction method, were 7.1, 13.4, and 18.2, respectively. When taking into consideration the differences among operation times of the subjects, a Pearson correlation analysis between predicted values of flight subtask and mean value of physiological indices was carried out to the validation of workload prediction method [24]. Conclusions showed that the predicted values had a highly positive correlation with mean pupil diameter (
A correlation analysis between the mean value of physiological indices and the predicted value during typical workload phase was completed; the results claimed that the physiological indices and predicted value had a high correlation (
Table 2
Correlation between predicted MW values and physiological indices
| Fixation | Mean | Saccade | Mean | Mean | pupil | Mean | LF/ | Mean | Mean | |
|---|---|---|---|---|---|---|---|---|---|---|
| frequency/ | fixation | frequency/ | Saccade | blink | diameter/ | NN/ | LHF/ | phasic/ | tonic/ | |
| (N/S) | time/ms | % | time/s | time/% | mm | msec | % | |||
| MW | ||||||||||
| r | 0.391 | |||||||||
| P | 0.002 | 0.011 | 0.070 | 0.006 | 0.120 | 0.090 | 0.001 | 0.050 | 0.025 |
The correlation analysis among physiological indices was also completed. At
The correlation among physiological indices can provide a reference for further selection of pilot physiological indices. According to the analysis results, it can be concluded that the eye movement indices (blink rate excluded) were sensitive to various inflight workloads; the mean NN and LF/LHF of HRV, the tonic and the phasic data of EDA were also sensitive to various typical workload environments. The information concluded in our experiment can provided physiological support for pilot workload evaluation and real flight environment attempts.
5.Multinomial logistic regression of pilot workload
The analysis of variance confirmed the sensitive physiological indices. A reference indices can be selected for the model when combined with the correlation analysis. The fixation frequency of eye movement, mean NN and LF/LHF of ECG, and mean tonic of EDA were applied for mathematical modeling. The fixation frequency (
(4)
(5)
(6)
Table 3
Results of Predicted accuracy
| Phases | Predicted number | Accuracy | ||
| Cruise | Approach | Landing | ||
| Cruise | 10 | 1 | 0 | 90.91% |
| Approach | 1 | 9 | 1 | 81.82% |
| Landing | 0 | 2 | 9 | 81.82% |
| Percentage | 33.33% | 36.36% | 30.30% | 84.85% |
Table 3 shows the classification of prediction results after the computation. There was a regression forecasting to the primitive data; results showed that the correct discrimination of cruise, approach, and landing were 90.91%, 81.82%, 81.82% respectively. The average accuracy was more than 80%, which stated that the model had an ideal effect for workload discrimination.
6.Discussion
Due to the application of HUD in our cockpit display environment, the subjects can monitor the flight parameters during the approach and landing phases with a head up status, and certain changes occurred with the behavior of eye movements, which was reflected by the variation of pilot workloads. Fixation frequency was defined as the fixation number divided by fixation time. The vision workload level can be characterized by the fixation frequency to a great extent. In comparison to cruise, the fixation frequency decreased during landing, indicating the enhancement of arousal level. Due to a higher monitoring task, the fixation frequency increased during cruise, also indicating higher visual information and a higher efficiency of information processing [25]. The mean fixation time was defined as the mean fixation duration every single point of fixation behavior. The longer the fixation duration, the deeper the information processing. Among all phases, the landing phase has the longest fixation duration. The fixation duration during landing phase decreased with the augment of saccade operations, which also shows that more saccade operations are needed for the preparation of the final landing.
Saccade frequency is the ratio of saccade number to single total task time. During the approach phase, it is vital to adjust and supervise the altitude and airspeed, while controlling the altitude is vital during the landing phase. The discrepancy that the saccade frequency decreased during landing in comparison with real flight missions can be explained by the lack of landing experience equipped with HUD. Therefore, more research is needed to explore the nature of HUD before promotion. Mean saccade time is the ratio of total saccade time and total saccade number. It described the saccade distance on the HUD display and reflected the difficulty level of visual information acquisition. Mean blink time is the ratio of total blink time and total blink number. It decreased gradually in the typical workload task and was consistent with previous research, which indicated that during visual stimulation tasks, the blink duration decreased as the workload during visual stimulation task increased [26]. At first, the mean saccade time increased and then decreased during the typical workload task. Both mean saccade time and mean blink time was correlated with depth of attention, and a further elaborated workload experiment was needed to observe the accurate variations. Blink rate decreased with the increase of visual processing requirements [27]. It claimed that the blink rate can characterize the workload of information presentation styles to some extent, but there was no significant changes observed during complicated workload operations, this was consistent with the basic theory that no external message was seized during blink behavior. Mean pupil diameter was sensitive to workload, and it increased gradually with the increase of workload. It indicated that a further resource was needed to deal with the increase of workload [28].
The function relationship between NN interval and time was built up by the time domain analysis, and a statistical property was extracted. The contiguous R waveform duration was also called NN interval. During the approach and landing phases, mean NN decreased with the aggravation of tension and activity. During the tracking task, the mean NN of fighter-pilot was greater than that of the counterwork task [9]. The Fourier transform transformed the HRV time domain into HRV frequency signals, and then the HRV frequency band was obtained via power spectral density analysis. The HRV signal was refined as Ultra-Low Frequency (ULF 0–0.0033 HZ), Very Low Frequency (VLF 0.0033–0.04 HZ), Low Frequency (LF 0.04–0.015), and High Frequency (HF 0.15–0.4 HZ) in frequency domain. A large number of studies have shown that the LF ingredient of HRV frequency spectrum can characterize the sympathetic nerve activity; consistent with prior research, during landing LF/LHF significantly decreased with the increase of workload [26].
The original EDA signals can be divided into tonic data and phasic data. Tonic data revealed the galavanic skin level of the task, and the event-related potential in two seconds after a stable stimulation was claimed by phasic data [29]. When a person is in an awake, excited, or nervous state, the sympathetic nerve system will accelerate the skin’s metabolism, increasing the temperature of the skin relevant sweat gland secretion. EDA was sensitive to mental workload, and a fierce EDA response was founded during take-off, go around, and landing in Visual Flight Rules (VFR) [11]. The variation of tonic data and phasic data was triggered by the verbal stimulation and fierce external visual environment in the approach and landing phases. The mean phasic had a better evaluation efficiency in our experiment [29].
Table 4
Results of predicted accuracy
| Physiological indices | Predicted accuracy (%) | |||
|---|---|---|---|---|
| Cruise | Approach | Landing | Mean | |
| Fixation frequency | 63.64 | 45.45 | 72.73 | 60.61 |
| Mean NN | 72.73 | 36.36 | 63.64 | 57.58 |
| Mean tonic | 63.64 | 18.18 | 54.55 | 45.45 |
| Fixation frequency | 81.82 | 63.64 | 72.73 | 72.73 |
| Fixation frequency | 63.64 | 54.55 | 81.82 | 66.67 |
| Mean NN | 81.82 | 36.36 | 72.73 | 63.64 |
| Multidimensional | 90.91 | 81.82 | 81.82 | 84.85 |
A correlation analysis was both used in our work and the research of Liang et al. [13]. They laid emphasis on the validation to subjective indices, while what we focused on were the physiological metrics, both of us achieved acceptable results. The conclusion can be made when the single index was used for modeling, eye response (followed by ECG and EDA) has the best discriminant effect. As for combination of two physiological indices, the combination of eye response and ECG has a better effect than the others, which was consistent with the study of Hogervorst [30]. It is presented that when dealing with vision-related workload, better results were achieved by eye response than any other external measurements (ECG, EDA, and respiration), and EEG combined with eye response has a better result than single EEG and eye response [30]. Table 4 claimed that the combination of two physiological measurements (“eye response and ECG”, “eye response and EDA”, and “ECG and EDA”) was better than the single one, and combining three of them achieved the best results (84.85%) [16]. For the discriminate accuracy, a multinomial logistic regression model was a little lower than the comprehensive Bayes discrimination model (89.58%) indexed by respond time, accuracy, NASA-TLX scores, and SDNN. However, compared to the combination of subjective, performance, and physiological indices, the subjective post analysis was avoided in the multinomial logistic regression model, which might provide certain ideas for online detection. The lack of abundant physiological data in flight was the weakness of this model.
7.Conclusion
This research had three different aspects compared to others. At first, the HUD was used as the major visual coding display to test the human errors in our research; the relevant physiological results can be a reference for others. Additionally, a new physiological index-LF/LHF which showed a higher sensitivity to pilot workload was raised and analyzed in the research. Lastly, and most importantly, was the prediction and evaluation method of pilot workload, which included the multiple resource theoretical prediction and multinominal logistic regression model based on combination of physiological indices. Considering the difference between our subject and the real pilot and the difference between the flight simulation environment and real flight circumstances, there were some defects in our work; the experimental results can offer a certain reference and still need more tests in complicated conditions.
Several conclusions can be made based on the result analyzed above:
(1) Based on multiple resource in dynamic flight task and a correlation analysis, a workload prediction has been completed. Predicted by workload prediction method, it claimed that the variation of physiological indices in typical flight subtasks and workload status could be preferable. The results indicated that the comprehensive prediction and evaluation method of workload that the dynamic predict method combined with objective physiological measurement had a favorable effect.
(2) Analysis of variance stated that eye movement, ECG indices, and EDA indices were all sensitive to typical workload. In typical HUD workload status, LF/LHF and fixation frequency were positively correlated; mean phasic and mean blink time were positively correlated; there was also a correlation between fixation, saccade, and blink behavior of eye response; mean NN was positively correlated with saccade frequency and mean blink time; and there mean pupil diameter and other physiological indices has no significant correlation.
(3) The comprehensive model in combination with eye movement, ECG, and EDA had a better discriminate result than the combination of any two or single physiological index. Based on the combination of physiological indices (fixation frequency, mean NN, LF/LHF, and mean tonic), the multinominal logistic regression model had a favorable discriminate accuracy (reaches 84.85%), which can provide a certain reference for pilot workload evaluation.
Acknowledgments
This study is supported by the National Natural Science Foundation of China (Grant No. 71301005) and the jointly program by National Natural Science Foundation of China and Civil Aviation Administration of China (Grant No. U1733118).
Conflict of interest
None to report.
References
[1] | Dong DY, Yu JH, Li BF, Chen YC. Airworthiness compliance certification technology of civil aircraft flight deck human factor. Acta Aeronaut et Astronaut Sin. (2016) ; 37: (1): 310-316; doi: 10.7527/S1000-6893.2015.0317. |
[2] | Federal Aviation Regulations, Part 25-Airworthiness standards: Transport category airplanes. Federal Aviation Administration (FAA), Washington DC, USA, (2013) . |
[3] | Xiao X, Wanyan XR, Zhuang DM. Mental workload prediction based on attentional resource allocation and information processing. Bio-Med Mater Eng. (2015) ; 26: (s1): S871-S879; doi: 10.3233/BME-151379. |
[4] | Wickens CD, Brian PS, Andre TS, Reynolds TJ. Unusual attitude recoveries with a spatial disorientation icon. Int J Aviat Psychol. (2007) ; 17: (2): 153-165; doi: 10.1080/10508410701328821. |
[5] | Yu CS, Wang EM, Li WC, Braithwaite G, Greaves M. Pilots’ visual scan patterns and attention distribution during the pursuit of a dynamic target. Aerosp Med Hum Perf. (2016) ; 87: (1): 40-47; doi: 10.3357/AMHP.4209.2016. |
[6] | Sarter NB, Mumaw RJ, Wickens CD. Pilots’ monitoring strategies and performance on automated flight decks: An empirical study combining behavioral and eye-tracking data. Hum Factors. (2007) ; 49: (3): 347-357; doi: 10.1518/001872007X196685. |
[7] | Hwang SL, Yau YJ, Lin YT, Chen JH, Huang TH, Yenn TC, et al. Predicting work performance in nuclear power plants. Safety Sci. (2008) ; 46: (7): 1115-1124; doi: 10.1016/j.ssci.2007.06.005. |
[8] | Di Stasi LL, Antolí A, Gea M, Cañas JJ. A neuroergonomic approach to evaluating mental workload in hypermedia interactions. Int J Ind Ergonom. (2011) ; 41: (3): 298-304; doi: 10.1016/j.ergon.2011.02.008. |
[9] | Wilson GF, Fullenkamp P, Davis I. Evoked potential, cardiac, blink, and respiration measures of pilot workload in air-to-ground missions. Aviat Space Envir Md. (1994) ; 65: (2): 100-105. |
[10] | Durantin G, Gagnon JF, Tremblay S, Dehais F. Using near infrared spectroscopy and heart rate variability to detect mental overload. Behav Brain Res. (2014) ; 259: : 16-23; doi: 10.1016/j.bbr.2013.10.042. |
[11] | Wilson GF. An analysis of mental workload in pilots during flight using multiple psychophysiological measures. Int J Aviat Psychol. (2002) ; 12: (1): 3-18; doi: 10.1207/S15327108IJAP1201_2. |
[12] | Bai J, Feng CY, Yang K. Research progress of physiological measurement of mental workload in pilots. Space Med Eng. (2016) ; 29: (2): 150-156; doi: 10.16289/j.cnki.1002-0837.2016.02.013. |
[13] | Liang SFM, Rau CL, Tsai PF, Chen WS. Validation of a task demand measure for predicting mental workloads of physical therapists. Int J Ind Ergonom. (2014) ; 44: (5): 747-752; doi: 10.1016/j.ergon.2014.08.002. |
[14] | Wickens CD. Multiple resources and mental workload. Hum Factors. (2008) ; 50: (3): 449-455; doi: 10.1518/001872008X. |
[15] | Lu K, Wei ZM, Zhuang DM, Wanyan XR. Integrated physiological model for mental workload assessment and prediction of aircraft flight deck display interface. J Beijing Univ Aeronaut Astronaut. (2016) ; 42: (4): 685-693; doi: 10.13700/j.bh.1001-5965.2015.0254. |
[16] | Wei ZM, Zhuang DM, Wanyan XR, Liu C, Zhuang H. A model for discrimination and prediction of mental workload of aircraft cockpit display interface. Chin J Aeronaut. (2014) ; 27: (5): 1070-1077; doi: 10.1016/j.cja.2014.09.002. |
[17] | Airila A, Hakanen JJ, Luukkonen R, Lusa S, Punakallio A, Leino-Arjas P. Developmental trajectories of multisite musculoskeletal pain and depressive symptoms: the effects of job demands and resources and individual factors. Psychol Health. (2014) ; 29: (12): 1421-1441; doi: 10.1080/08870446.2014.945929. |
[18] | Cinaz B, Arnrich B, Marca RL, Tröster G. Monitoring of mental workload levels during an everyday life office-work scenario. Pers Ubiquit Comput. (2013) ; 17: (2): 229-239; doi: 10.1007/s00779-011-0466-1. |
[19] | Field A. Discovering Statistics Using SPSS. 3rd ed. London: Sage; (2009) . |
[20] | Smith ME, Gevins A, Brown H, Karnik A, Brown H, Du R. Monitoring task loading with multivariate EEG measures during complex forms of human-computer interaction. Hum Factors. (2001) ; 43: (3): 366-380; doi: 10.1518/001872001775898287. |
[21] | Mehler B, Reimer B, Coughlin JF. Sensitivity of physiological measures for detecting systematic variations in cognitive demand from a working memory task: an on-road study across three age groups. Hum Factors. (2012) ; 54: (3): 396-412; doi: 10.1177/0018720812442086. |
[22] | Biswas P, Robinson P. Evaluating interface layout for visually impaired and mobility-impaired users through simulation. Universal Access Inf. (2013) ; 12: (1): 55-72; doi: 10.1007/s10209-011-0265-5. |
[23] | Wickens CD. Display formatting and situation awareness model (DFSAM): an approach to aviation display design. Technical Report AHFD-05-14/NASA-05-5. USA: NASA Ames Research Center; (2005) . p. 1-15. |
[24] | Liu S, Wanyan XR, Zhuang DM. Modeling the situation awareness by the analysis of cognitive process. Bio-Med Mater Eng. (2014) ; 24: (6): 2311-2318; doi: 10.3233/BME-141044. |
[25] | Wiberg H, Nilsson E, Lindén P, Svanberg B, Poom L. Physiological responses related to moderate mental load during car driving in field conditions. Biol Psychol. (2015) ; 108: : 115-125; doi: 10.1016/j.biopsycho.2015.03.017. |
[26] | Gao Q, Wang Y, Song F, Li ZZ, Dong XL. Mental workload measurement for emergency operating procedures in digital nuclear power plants. Ergonomics. (2013) ; 56: (7): 1070-85; doi: 10.1080/00140139.2013.790483. |
[27] | Sirevaag EJ, Kramer AF, Reisweber CDWM, Strayer DL, Grenell JF. Assessment of pilot performance and mental workload in rotary wing aircraft. Ergonomics. (1993) ; 36: (9): 1121-1140; doi: 10.1080/00140139308967983. |
[28] | Wanyan XR, Zhuang DM, Zhang H. Improving pilot mental workload evaluation with combined measures. Bio-medical Materials and Engineering. (2014) ; 24: (6): 2283-2290; doi: 10.3233/BME-141041. |
[29] | Benedek M, Kaernbach C. A continuous measure of phasic electrodermal activity. J Neurosci Meth. (2010) ; 190: (1): 80-91; doi: j.jneumeth.2010.04.028. |
[30] | Hogervorst MA, Brouwer AM, van Erp JB. Combining and comparing EEG, peripheral physiology and eye-related measures for the assessment of mental workload. Front Neurosci. (2014) ; 8: (5): 322; doi: 10.3389/fnins.2014.00322. |


