
A new idea for visualization of lesions distribution in mammogram based on CPD registration method
Abstract
BACKGROUND:
Mammography is currently the most effective technique for breast cancer. Lesions distribution can provide support for clinical diagnosis and epidemiological studies.
OBJECTIVE:
We presented a new idea to help radiologists study breast lesions distribution conveniently. We also developed an automatic tool based on this idea which could show visualization of lesions distribution in a standard mammogram.
METHODS:
Firstly, establishing a lesion database to study; then, extracting breast contours and match different women’s mammograms to a standard mammogram; finally, showing the lesion distribution in the standard mammogram, and providing the distribution statistics. The crucial process of developing this tool was matching different women’s mammograms correctly. We used a hybrid breast contour extraction method combined with coherent point drift method to match different women’s mammograms.
RESULTS:
We tested our automatic tool by four mass datasets of 641 images. The distribution results shown by the tool were consistent with the results counted according to their reports and mammograms by manual. We also discussed the registration error that was less than 3.3 mm in average distance.
CONCLUSIONS:
The new idea is effective and the automatic tool can provide lesions distribution results which are consistent with radiologists simply and conveniently.
1.Introduction
As the most common tumor in women, breast cancer has seriously affected the health of women. Many retrospective studies on age distribution, geographic distribution, ethnic distribution and lesion location distribution of breast cancer provided support for clinical diagnosis and epidemiological studies. Mammography is the most preferred technique of imaging diagnosis for breast cancer. Professor Hu, a breast imaging diagnostic and general investigation expert, studied breast tumor distribution according to 721 cases of breast cancer data acquired from the First Affiliated Hospital of Peking University and Beijing Cancer Institute. He then found the incidence of breast cancer associated with the following lesion locations, over 1/3 in upper-outer quadrant, about 1/3 in areola area, and less than 1/3 within other areas [1]. Meantime, he found tumors close to areola area would easily lead to IDC (Invasive Ductal Carcinoma) because the tumors may adhere to surrounding blood vessels or lymph-vessels as they gradually grew up. Therefore, studies on distribution of lesion locations have an important clinical significance. However, at present this kind of studies need radiologists to review many reports in which lesion locations were described or classified. This is tedious and boring work. Moreover, lesion locations can’t be shown precisely and intuitively only according to reports. So these useful studies are very difficult to carry out in-depth and meticulously.
This paper presented a new idea based on CPD registration method to help radiologists study distribution of breast lesions in mammogram simply and conveniently. We also developed an automatic tool based on this new idea that could show visualization results of distribution of breast lesions. The radiologists could see the distribution of the interest lesions of selected data set on one standard breast image by the automatic tool that can help radiologists accumulate statistic information for further clinical research.
Owing to the various breast shapes for each woman, it is necessary to match different women’s mammograms to the standard mammogram in order to tag all locations of the interested lesions of the selected data set in the standard mammogram. However, previous registration studies have been done to compare and match multiple-view mammograms from the same woman to determine the presence of lesions. In general, the multiple-view match methods can be divided into three categories: 1) Match methods for two different projection view of the same breast [2, 3, 4, 5]; 2) bilateral analysis for breast comparison [6, 7, 8]; 3) prior and current mammogram match methods of the same breast [9, 10, 11, 12, 13]. To our knowledge, no study to date has reported the utilization of registration for different women in medical research application.
It is not suitable to adopt pixel-based registration method to match different women’s mammograms because different women’s breast density and the lesion locations are different. However, the breast shapes of different women in the same view are similar. The registration method based on breast border point set is suitable in this application. The ICP algorithm [20] is a popular registration method based on point sets that requires that the initial pose of the two point sets be adequately close, so it is not suitable in this application. The coherent point drift (CPD) algorithm is a powerful approach for point set registration [17] that can estimate complex non-linear transformations. We proposed a hybrid breast contour extraction method combined with CPD method to match different women’s mammograms, so that all lesions from these women could be shown in one standard mammogram and counted with a pie chart.
2.Method
2.1Framework of the new idea and the automatic tool
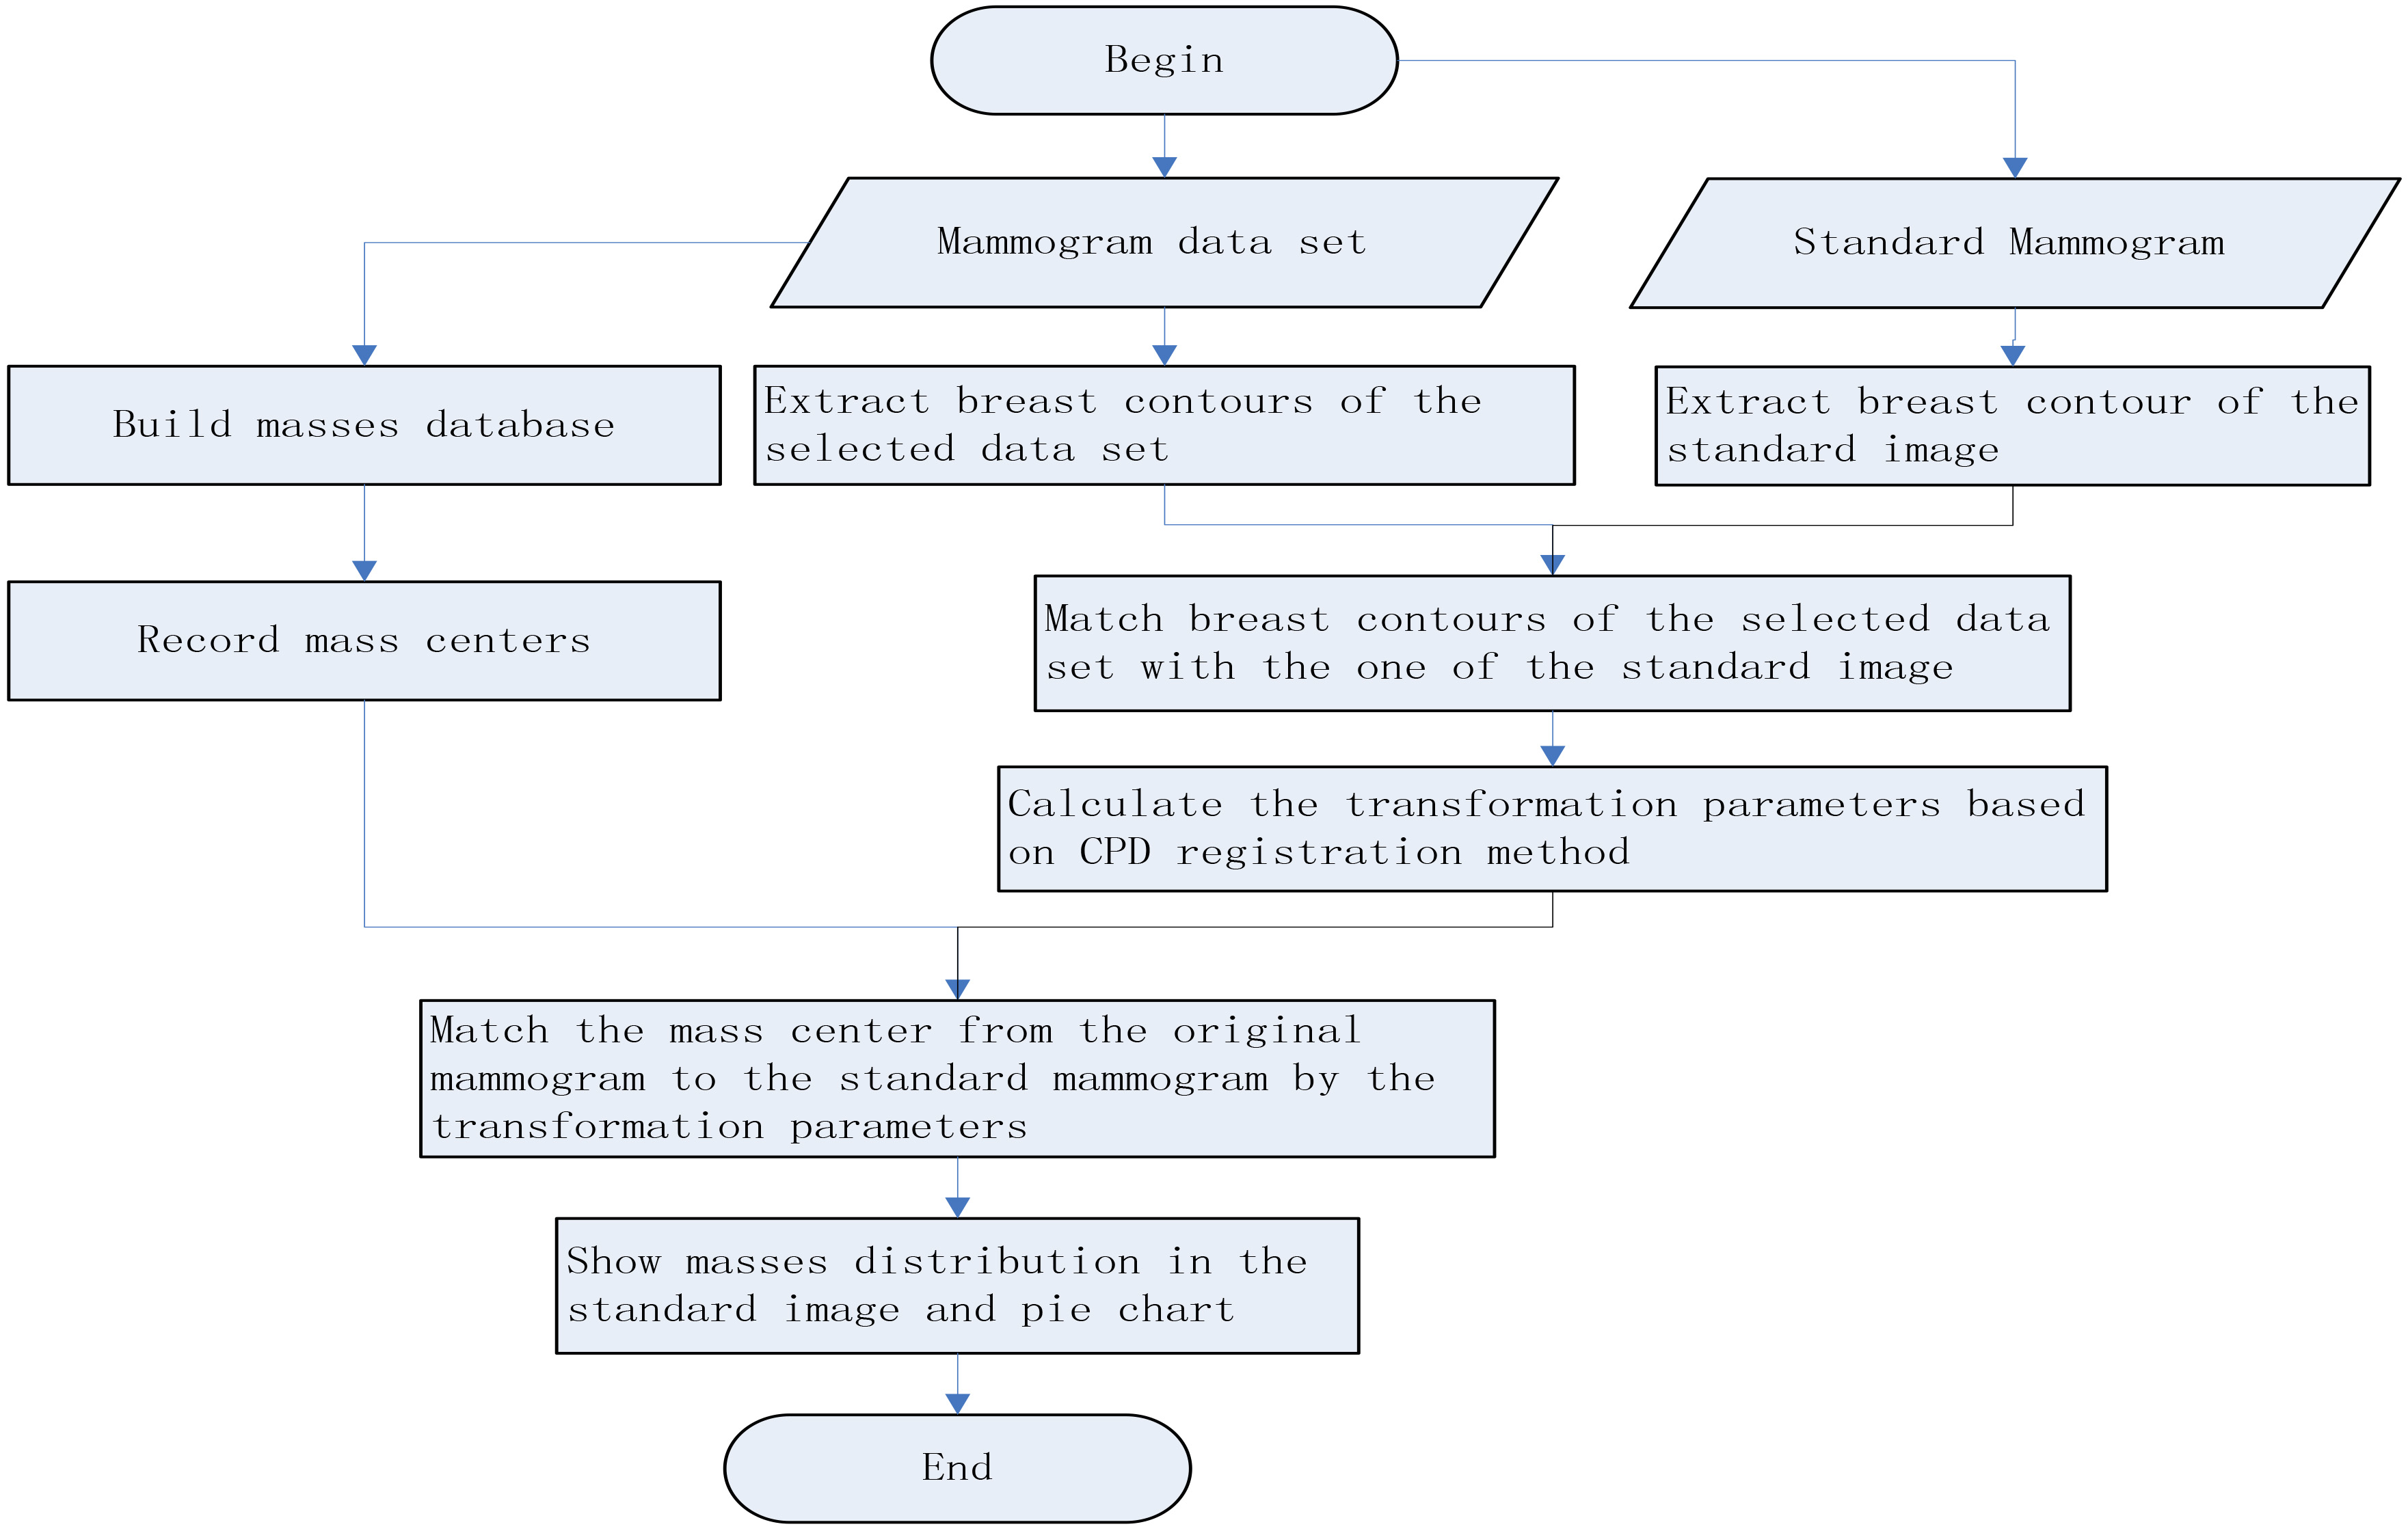
This paper described how the automatic tool we proposed worked with analysis of malignant mass distribution as an example. The steps using the automatic tool were as follows: Firstly, establishing the mass database that include corresponding patient ID, image view positions typically cranio caudal (CC) and medio lateral oblique (MLO) views, and more detail information such as mass type, X-ray signs of the mass and so on. Secondly, the radiologists only need to select a database and a standard mammogram, and the tool will automatically give distribution of the lesions in the standard mammogram and the corresponding distribution pie chart. The standard image can be any mammogram that is proposed to have a normal, but too excessive, too small or too pendulous breast in it. The procedure of the automatic tool was shown as Fig. 1.
Figure 1.
The flow chart of distribution tool for breast mass locations.
Matching different women’s mammogram is the most difficulty and pivotal task in developing the automatic tool. We used a hybrid breast contour extraction method to extract the breast contour point sets, and matched them by the CPD method.
2.2The hybrid breast contour extraction method
In this paper, we briefly introduce the segmentation method that will be described in detail in another article.
1) Breast foreground segmentation: Breast foreground segmentation from the background is a fundamental step in mammogram analysis. Extracting the breast from the other objects in the background, such as some annotations or labels can remove the effect of the other objects and accelerate image analysis process. Our algorithm began by finding thresholds using histogram information. Breast foreground was segmented looking for the largest object in the image. We used improved Otsu method combined with the region grow method to find the breast foreground. Improved Otsu method can determine multiple thresholds in a gray image with more than two peaks in its histogram.
2) Pectoral muscle segmentation: When the MLO view was properly imaged, the pectoral muscle should always appear as a high-intensity, triangular region across the upper posterior margin of the image [14]. Firstly, we segmented roughly by Otsu method based on knowledge about the position and shape of the pectoral muscle on MLO views. Secondly, we estimated the pectoral edge by a straight line. Then we used iterative “cliff detection” to refine the pectoral margin more accurately. Finally, we got an enclosed region as a segmentation mask which represented the pectoral muscle.
3) Nipple detection: Breast edge, pectoral muscle and nipple are three important anatomic landmarks in mammogram. Each quadrant of the breast is divided by nipple position. Because a nipple’s shape and its location relative to breast outer edge in mammogram are very similar to a nodule connected to pleura in CT cross-sectional images. Our method to find the nipple location was reference to the method for detection of nodules connected to pleura [15].
4) Redundant arm removal: In some cases, the redundant arm tissue can be entrained in mammogram in order to let radiologists see beast issue close to the chest wall more clearly. The redundant arm makes the ultimate breast boundary different from the others that will affect the results of registration. If redundant arm appears in mammogram, there are two cases, one is that the arm region and the breast region are not connected in mammogram, then the arm region will be removed in the first step, the other is the arm region is connected with the breast region and its edge intersect with the bottom boundary edge of the breast. In this step, we will deal with the second case. Our algorithm determined possible region according to the position of redundant arm, and then find the inflection point of breast boundary edge, after which was thought as redundant arm edge.
Through the above image preprocessing, the input CC image and MLO image are segmented, and then the contour of the segmented binary image is extracted. The contour points are the points used for the next step of registration.
2.3Point sets registration with coherent point drift algorithm
The CPD algorithm is regarded as a maximum likelihood (ML) estimation problem with motion coherence constraint over the velocity field [16, 17]. One point set is taken as centroids of Gauss mixture model and the other as the data points. The essential of the CPD algorithm is to compel the centroids as a group to move coherently. This make the topological structure of the point sets preserved. Let us describe the algorithm briefly.
We suppose two point sets, where one point set
(1)
Where
equal isotropic covariances
(2)
In order to reparameterize the GMM centroid locations, we estimate a set of transformation parameters
(3)
The EM algorithm is used to estimate
(4)
The EM algorithm proceeds by alternating between E- and M-steps until convergence. Ignoring the constants of
(5)
Where
(6)
We specify the transformation
3.Experiments and results
To evaluate the performance of our automatic tool, we carried out experiments on data sets from different hospitals, different equipments or different races, which were collected in three domestic hospitals and a foreign specialist clinic. The detail information of the data sets was shown in Table 1.
Table 1
Data information
| Image num. | Patient num. | Image revolution | Pixel size (mm) | Manufacture | Digital image type | Bits of image | |
|---|---|---|---|---|---|---|---|
| 1 | 222 | 111 | 2294*1914 | 0.0941 | GE | for presentation | 16 |
| 2 | 259 | 128 | 2294*1914 | 0.0941 | GE | for presentation | 16 |
| 3 | 96 | 47 | 2816*2016 | 0.0814 | Giotto | for processing | 16 |
| 4 | 64 | 32 | 2294*1914 | 0.0941 | GE | for presentation | 16 |
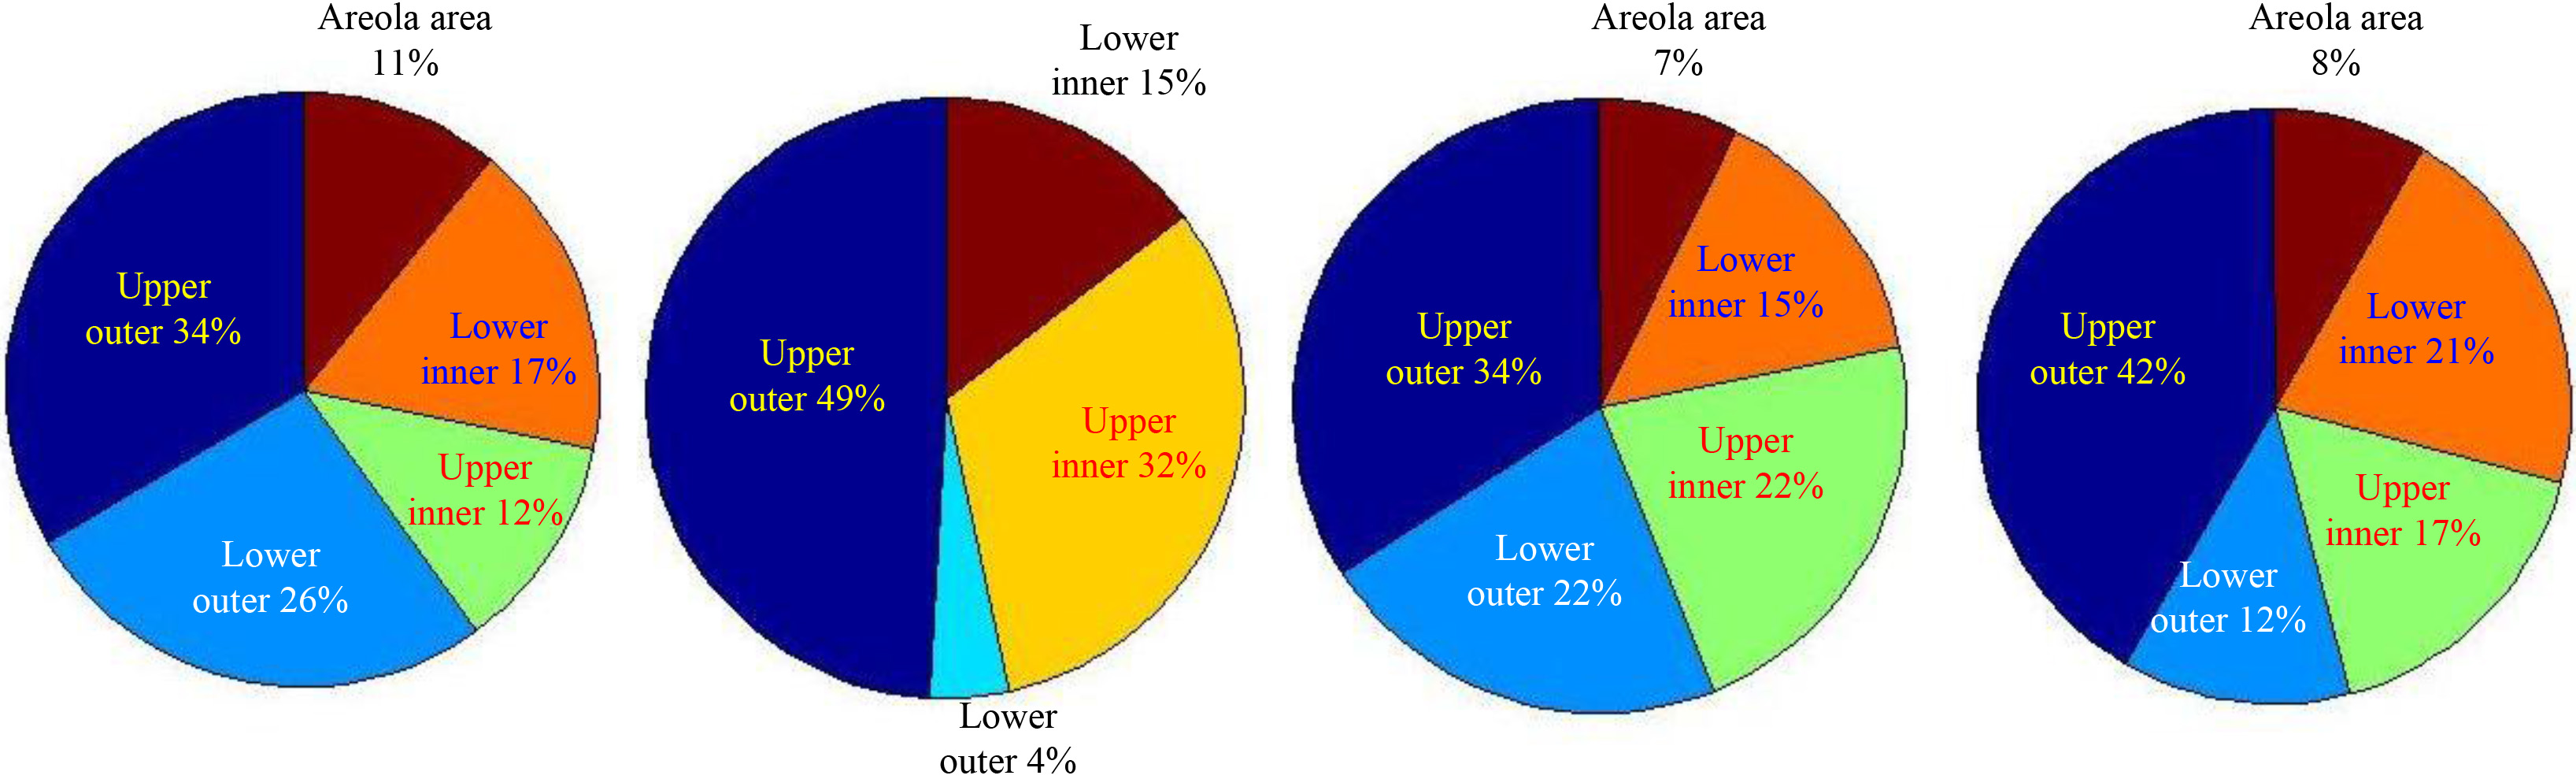
Figure 2 showed the distribution of the masses of data set 1 described in Table 1 in the selected standard mammogram. We traced different region boundaries of the breast with blue lines and use red dots to represent centers of the masses of data set 1. Our automatic tool could calculate the proportion of masses in each part of the breast and each mass distribution of the four data sets in Table 1 was shown as pie charts in Fig. 3, from which we could see masses appears mainly in the upper-outer quadrant of breast.
Figure 2.
Mass distribution in CC view and MLO view of data set 1.
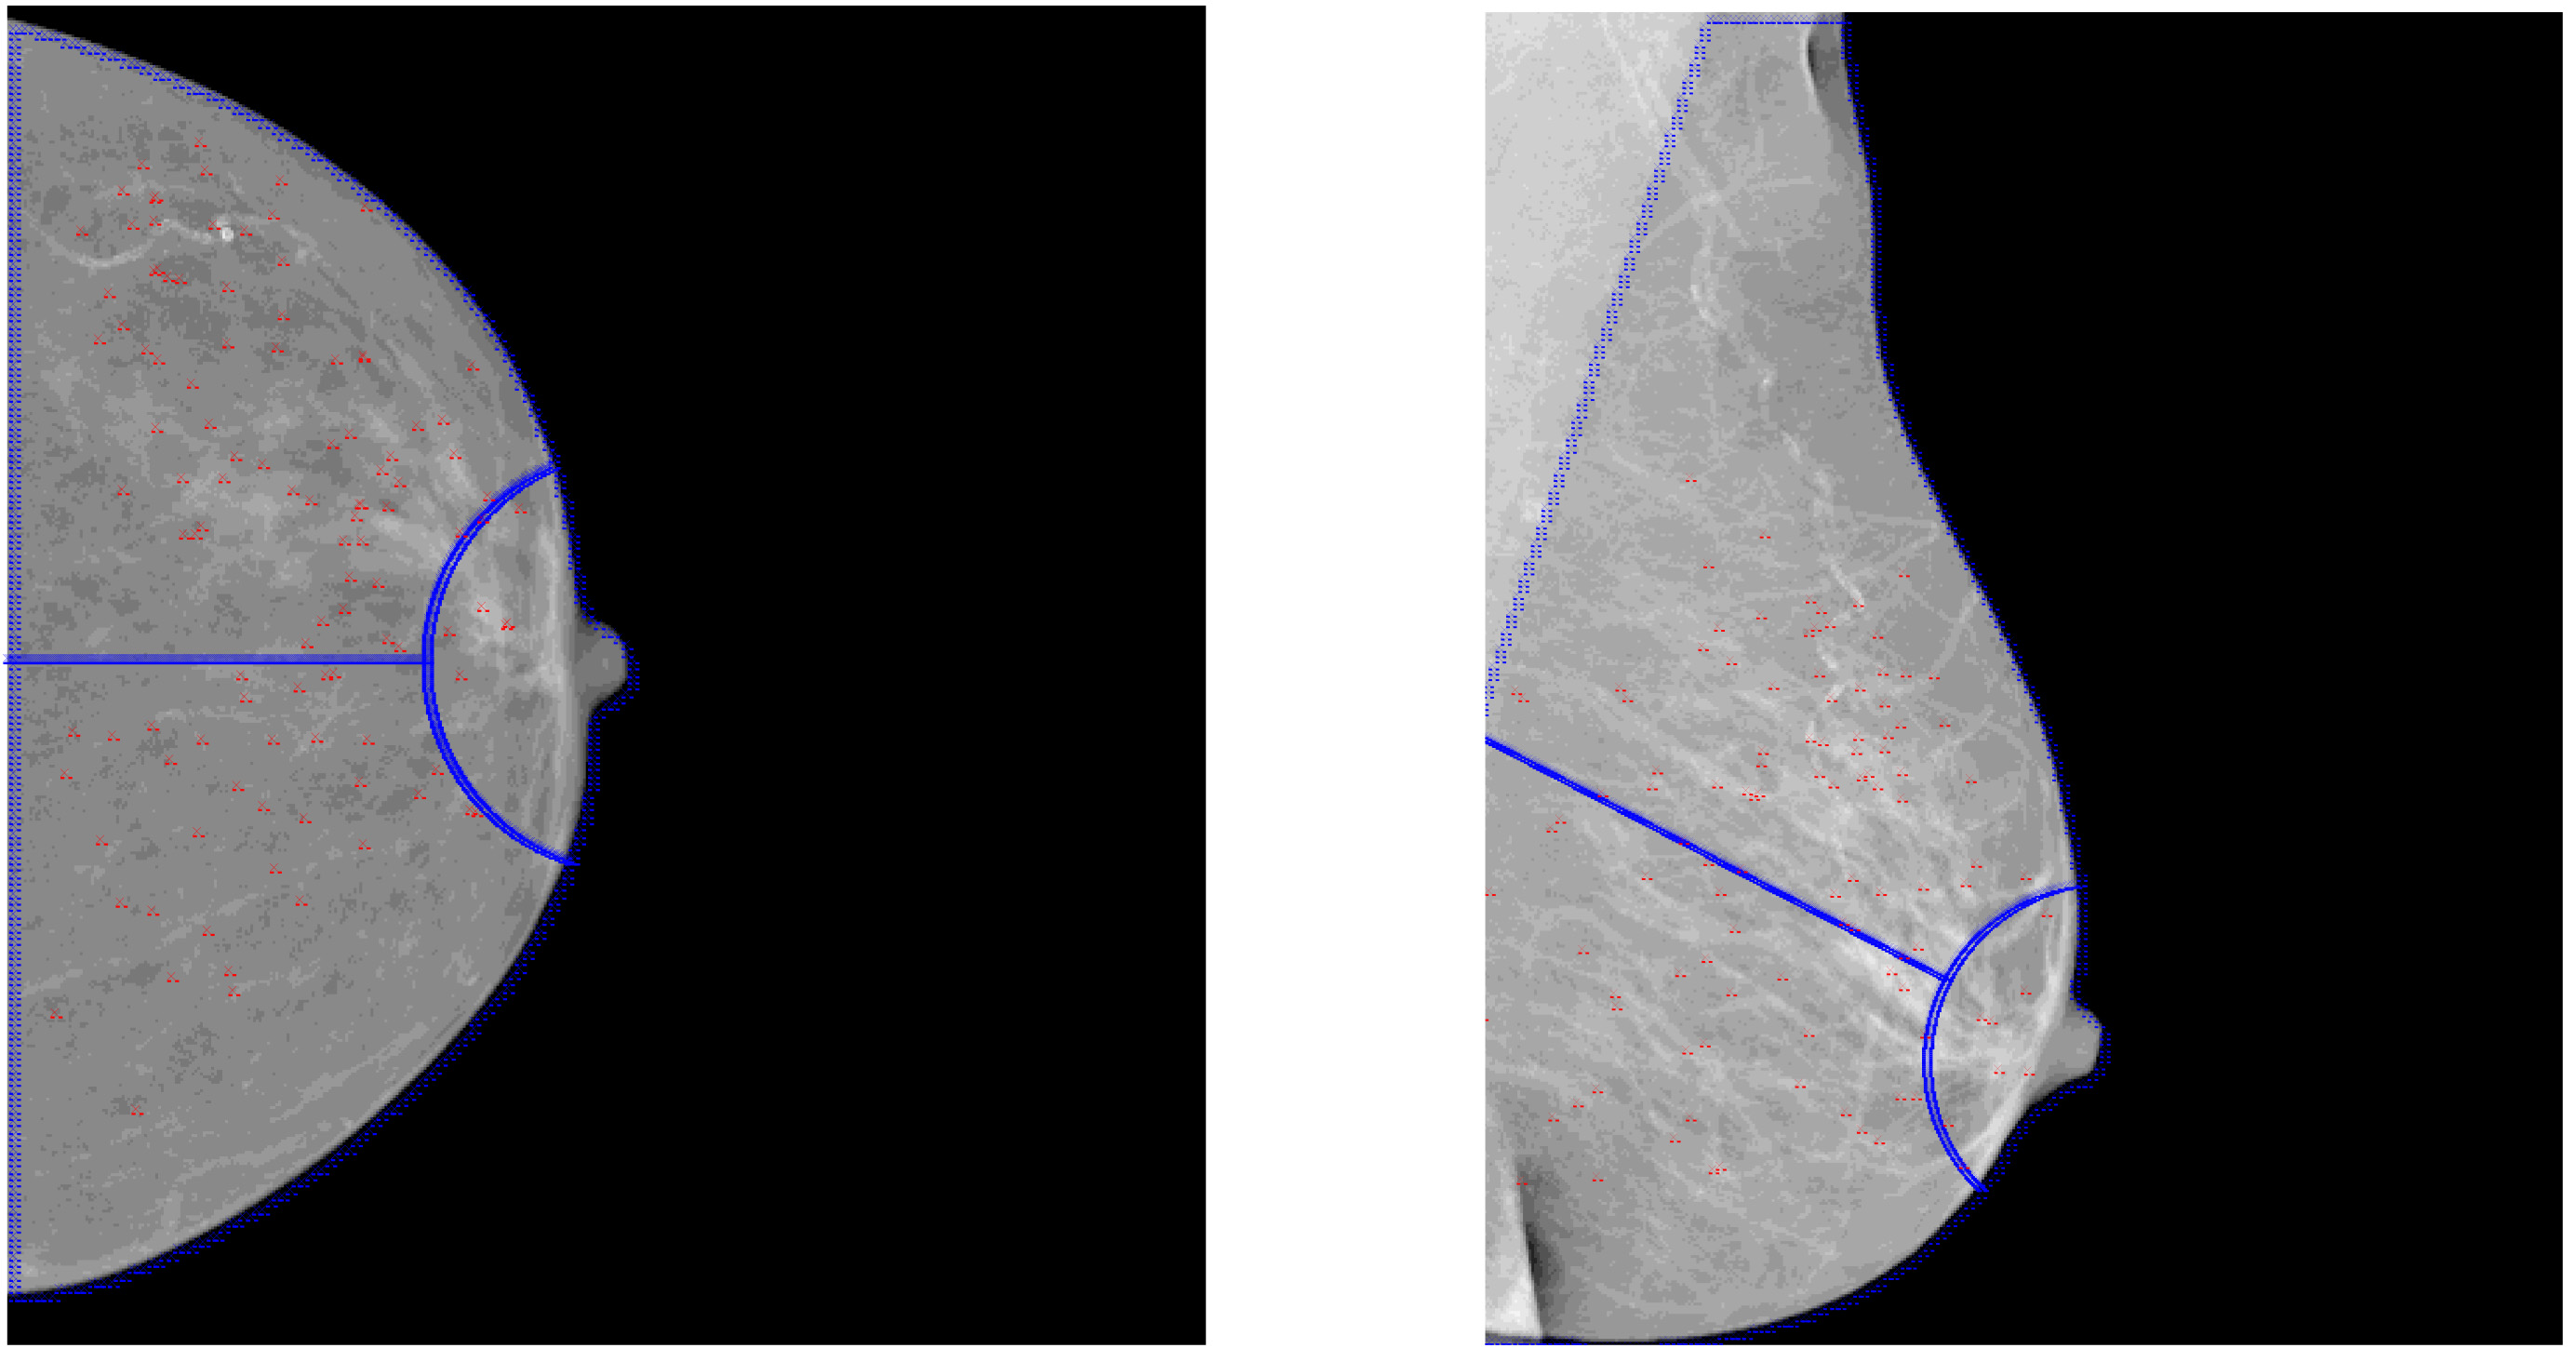
Figure 3.
Pie charts for mass distribution of the four datasets.
4.Discussion and conclusion
We could determine the accuracy of the automatic tools from two aspects: the core algorithm of the tool was registration algorithm for different mammograms. If registration results were effective, then the automatic tool should be effective; furthermore, a more direct way to determine the accuracy of the tool was to compare the statistical results of automatic tool’s and manual calculation. If the two results were highly consistent, the automatic tool should be accurate and valid.
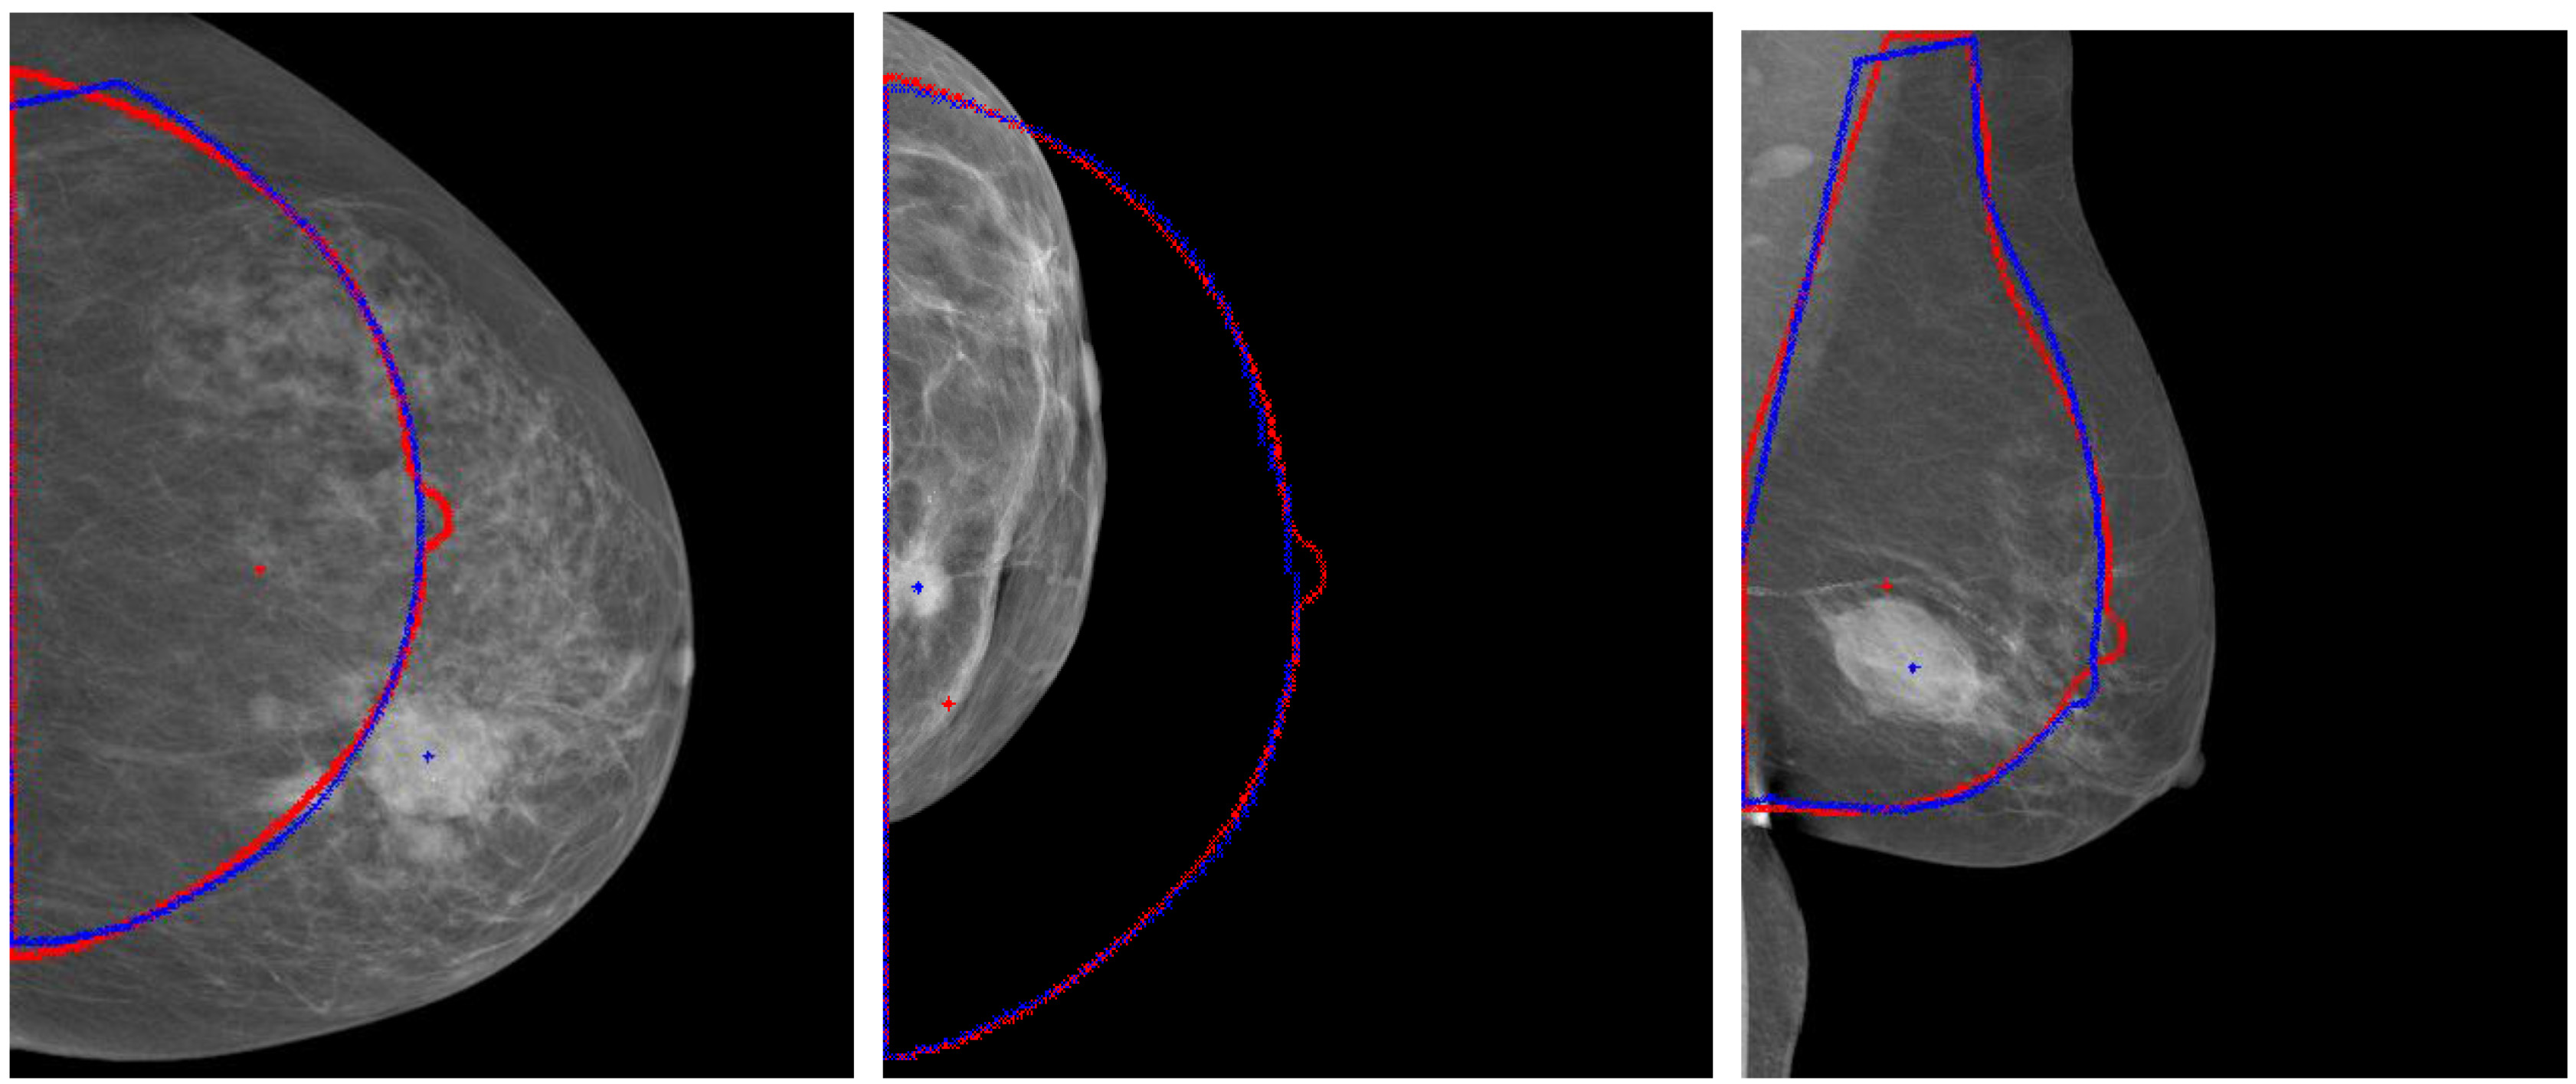
Firstly, the effect of registration was observed from the following results. Registration could “correct” the wrong position caused by excessive, too small or pendulous breast. Figure 4 showed the too large, too small or pendulous breast image and their counters and mass locations before and after registration. The blue lines represented their counters after registration and red lines represented the standard breast counters. The blue and red crosses represented the mass center locations before and after registration respectively. The distance of mass movement between after registration was relatively large.
Two indicators were used to evaluate the registration algorithm, one was the average distance between two breast contours in the standard image and in the image after registration, and the other was the key points distance between them. We selected two key points in each image, the first was nipple point, and the other was the midpoint in inner border of CC view or the starting point of pectoral in inner border of MLO view. The average distance between the breast contours was the most important indicator that could be calculated by summing the distance from one point to its corresponding point (point pairs) and then dividing the total numbers of point pairs. The results were shown as Table 2.
Table 2
Registration results of four data sets (unit: mm)
| Data set | Between the breast contours | Between nipples | Between midpoints | |||
|---|---|---|---|---|---|---|
| Average | STDEV | Average | STDEV | Average | STDEV | |
| 1 | 2.45 | 0.72 | 4.36 | 1.05 | 2.80 | 0.75 |
| 2 | 3.03 | 0.89 | 5.72 | 0.67 | 3.65 | 0.69 |
| 3 | 2.76 | 1.21 | 3.8 | 1.59 | 3.16 | 0.35 |
| 4 | 3.21 | 0.97 | 10.16 | 5.24 | 3.12 | 0.58 |
Figure 4.
Results for aligning the large, small and pendulous breast with the standard breast.
Secondly, we compared the statistic results between manual and tool’s calculation. Two radiologists counted the number of the masses of four data sets in each part of breast according to the reports and mammograms and the results shown in Table 3. We calculated statistical deviations between manual and tool’s calculation or two manual calculation with the formula of different classification number / total number of masses
Table 3
Statistic results of four data sets: mass number in different areas
| Data set | Statistic method | Upper outer | Areola area | Lower inner | Upper inner | Lower outer | Total |
|---|---|---|---|---|---|---|---|
| 1 | By the tool | 38 | 12 | 19 | 13 | 29 | 111 |
| By manual A | 40 | 11 | 19 | 13 | 28 | 111 | |
| By manual B | 39 | 12 | 19 | 13 | 28 | 111 | |
| 2 | By the tool | 68 | 0 | 21 | 44 | 6 | 139 |
| By manual A | 67 | 0 | 21 | 45 | 6 | 139 | |
| By manual B | 69 | 0 | 20 | 44 | 6 | 139 | |
| 3 | By the tool | 16 | 3 | 7 | 11 | 11 | 48 |
| By manual A | 17 | 3 | 7 | 11 | 10 | 48 | |
| By manual B | 15 | 3 | 8 | 12 | 10 | 48 | |
| 4 | By the tool | 15 | 3 | 8 | 6 | 4 | 36 |
| By manual A | 15 | 3 | 8 | 6 | 4 | 36 | |
| By manual B | 14 | 4 | 8 | 6 | 4 | 36 |
In conclusion, we developed an automatic tool to help radiologists study distribution of breast lesions in mammogram simply and conveniently. The tool could show all locations for the interested lesions in the selected data set in one standard mammogram and give a distribution pie chart for the lesions. This tool has been used to obtain the distribution for four mass data sets. The distribution that the tool has shown was consistent to the result counted by manual. Precision errors of registration of different women’s mammograms have been evaluated by the indicator of average distance between the breast contours and were found less than 3.3 mm.
Conflict of interest
None to report.
Acknowledgments
Supported by the National Natural Science Foundation of China, Grant Number: 61302013.
References
[1] | Hu YS. Modern Breast Image Diagnostics, Beijing: Science Press. (2001) . |
[2] | Paquerault S, Petrick N, Chan HP, Sahiner B, Helvie MA. Improvement of computerized mass detection on mammograms: fusion of two view information. Med Phys. (2002) ; Feb; 29: (2): 238-47. |
[3] | Chang YH, Good WF, Sumkin JH, Zheng B, Gur D. Computerized localization of breast lesions from two views: An experimental comparison of two methods. Investigative Radiology. (1999) ; Sep; 34: (9): 585-8. |
[4] | Liu B, Metz CE, Jiang Y. Effect of correlation on combining diagnostic information from two images of the same patient. Med Phys. (2005) ; Nov; 32: (11): 3329-38. |
[5] | van Engeland S, Karssemeijer N. Combining two mammographic projections in a computer-aided mass detection method, Med Phys. (2007) ; Mar; 34: (3): 898-905. |
[6] | Leung JW, Sickles EA. Developing asymmetry identified on mammography: Correlation with imaging outcome and pathologic findings. AJR Am J Roentgenol. (2007) ; Mar; 188: (3): 667-75. |
[7] | Wu YT, Wei J, Hadjiiski LM, Sahiner B, Zhou C, Ge J, Shi J, Zhang Y, Chan HP. Bilateral analysis based false positive reduction for computer-aided mass detection. Med Phys. (2007) ; Aug; 34: (8): 3334-44. |
[8] | Ericeira DR, Silva AC, de Paiva AC, Gattass M. Detection of masses based on asymmetric regions of digital bilateral mammograms using spatial description with variogram and cross-variogram functions. Comput Biol Med. (2013) ; Sep; 43: (8): 987-99. |
[9] | Timp S, van Engeland S, Karssemeijer N. A regional registration method to find corresponding mass lesions in temporal mammogram pairs. Med Phys. (2005) ; Aug; 32: (8): 2629-38. |
[10] | Sanjay-Gopal S, Chan HP, Wilson T, Helvie M, Petrick N, Sahiner B. A regional registration technique for automated interval change analysis of breast lesions on mammograms. Med Phys. (1999) , 26: (12): 2669-79. |
[11] | Filev P, Hadjiiski L, Sahiner B, Chan HP, of similarity measures or the task of template matching of masses on serial mammograms. Med Phys. (2005) , 32: (2): 515-29. |
[12] | Brandt SS, Karemore G, Karssemeijer N, Nielsen M, An anatomically oriented breast coordinate system for mammogram analysis. IEEE Trans Med Imaging. (2011) , 30: (10): 1841-51. |
[13] | Timp S, Karssemeijer N. Interval change analysis to improve computer aided detection in mammography. Med Image Anal, (2006) , 10: (1): 82-95. |
[14] | Kwok SM, Chandrasekhar R, Attikiouzel Y, Rickard MT. Automatic pectoral muscle segmentation on mediolateral oblique view mammograms. IEEE Trans Med Imaging, (2004) , 23: (9): 1129-40. |
[15] | Li Q, Li F, Doi K. Computerized detection of lung nodules in thin-section CT images by use of selective enhancement filters and an automated rule-based classifier. Acad Radiol. (2008) , 15: (2): 165-75. |
[16] | Myronenko A, Song X. Point set registration: coherent point drift. IEEE Trans Pattern Anal Mach Intell. (2010) , 32: (12): 2262-75. |
[17] | Wang P, Gao YH, et al. A refined coherent point drift (CPD) algorithm for point set registration. Science China Information Sciences. (2011) , 54: (1): 2639-2646. |
[18] | Pereira SM, Hipwell JH, McCormack VA, et al. Automated registration of diagnostic to prediagnostic x-ray mammograms: Evaluation and comparison to radiologists’ accuracy. Med Phys. (2010) , 37: (9): 4530-4539. |
[19] | Li WG, Wang T. Image Registration Technique Based on a Fast CPD Algorithm. Journal of Computer and Communications. (2015) , 3: (5): 182-188. |
[20] | Zhong Y, Zhang M. Automatic Registration Technology of Point Cloud Based on Improve ICP Algorithm. Control Engineering of China. (2014) , 21: : 112-121. |


