
The diagnostic value of susceptibility-weighted imaging for ischemic penumbra in patients with acute ischemic stroke
Abstract
BACKGROUND:
The ischemia penumbra area is not easy to be detected accurately using noninvasive imaging methods.
OBJECTIVE:
We aim to assess the diagnostic value of susceptibility-weighted imaging (SWI) for ischemic penumbra in patients with acute ischemic stroke.
METHODS:
A retrospective analysis was carried out in 47 patients with ischemic stroke involving the middle cerebral artery. Mean transit time (MTT), time to peak, relative cerebral blood flow, and relative cerebral blood volume maps were created after image processing.
RESULTS:
No significant difference was found in the mismatch between the SWI and diffusion-weighted imaging (SWI-DWI) or in the MTT-DWI mismatch scores (
CONCLUSIONS:
SWI provides information comparable to PWI and, thus, could serve as a reliable magnetic resonance technique for assessing ischemic penumbrae.
1.Introduction
The ischemic penumbra, first proposed by Astrup et al. [1], initially referred to the area of the brain in which electrical activity disappeared. This disappearance was thought to be caused by maintenance of the membrane potential and transmembrane ion potential during cerebral ischemia. Perfusion abnormalities in brain tissue can be seen clearly with perfusion-weighted magnetic resonance imaging (PWI) following a rapid bolus of a contrast agent. This imaging technique shows four key characteristics: relative cerebral blood flow (rCBF), relative cerebral blood volume (rCBV), time to peak (TTP), and mean transit time (MTT). Changes in brain tissue hemodynamics can be evaluated visually by combining the values of these four characteristics. In previous studies [2, 3], investigators reported that the hyperintense lesion seen with diffusion-weighted imaging (DWI) generally indicated the core infarct area. Kamath et al. [4] suggested that MTT was most closely related to the oxygen extraction fraction (OEF). In a study using positron emission tomography (PET), Yata et al. [5] reported that an increase in OEF is closely related to an increase in MTT. Based on the similarity in metabolism data indicated by these two values, MTT was used as the perfusion index for comparison with SWI in their study.
Penumbra has been defined as an area of increased OEF detected by PET-CT [6]. Ischemic penumbra has also been evaluated using CT-PWI. Maija et al. [7] were able to determine a reference value for distinguishing the infarct from the penumbra, but were not able to establish reliable thresholds. While Chen and Ni [8] suggested that PDM could replace PET-CT. Additionally, gadolinium, which is introduced during perfusion scans, can induce an allergic reaction in some patients. Huang et al. [9] believe that gadolinium may cause nephrogenic systemic fibrosis (NSF), which may trigger renal dysfunction. Kuo et al. [10] have also suggested that any contrast agent may cause NSF. In patients who have had an acute ischemic stroke, deoxygenated hemoglobin may serve as a “natural” contrast agent, given that it is hypointense on minimum intensity projection (minIP) imaging.
Therefore, we carried out a prospective study in those patients who had had an acute ischemic stroke using susceptibility-weighted imaging (SWI) and MR PWI as a contrast to detect ischemic penumbrae.
2.Materials and methods
2.1Patients
Patients who had had an acute ischemic stroke between 2013 and 2014 were selected as study subjects. Inclusion criteria were a maximum of 72 hours from time of stroke onset to the time of the MR testing; clinical symptoms that included hemiplegia or hemiparesis, with or without a speech disorder; an abnormal signal within the area served by the middle cerebral artery and identified on the MR-DWI (
2.2Image acquisition
The Siemens Verio 3.0-T MRI system used in this study (Siemens; Munich, Germany). Post-MRI processing and image evaluation were carried outin a syngo
2.3Image processing
Post-imaging SWI processing for the whole-brain vein image involved a 1.2-mm thick slice of the original image. The minIPwas carried out on the magnetic torque image using 3DMIP software. A rebuilt slice thickness of 9.6 mm was obtained without any gap. Processing of MRI brain perfusion images involved sending the scanning images to the post-processing syngo
2.4Assessing ischemic penumbra with PWI, SWI
The perfusion-diffusion mismatch (PDM) was determined by superposing the PWI (MTT) map on the DWI image using Fusion software, which was available with the syngo
2.5Statistical analysis
To define ischemic penumbra by PDM, the SDM and PDM were analyzed by chi-square test, with a
3.Results
3.1DWI, SWI, and PWI manifestations of acute ischemic stroke
A total of 137 lesions were found in 47 patients with acute ischemic stroke. These lesions demonstrated hyperintensity on DWI (
Table 1
PWI-DWI mismatch, increased cortical veins sign
| Increased cortical veins sign | ||
| PWI-DWI | Positive | Negative |
| Positive | 16 | 3 |
| Negative | 0 | 28 |
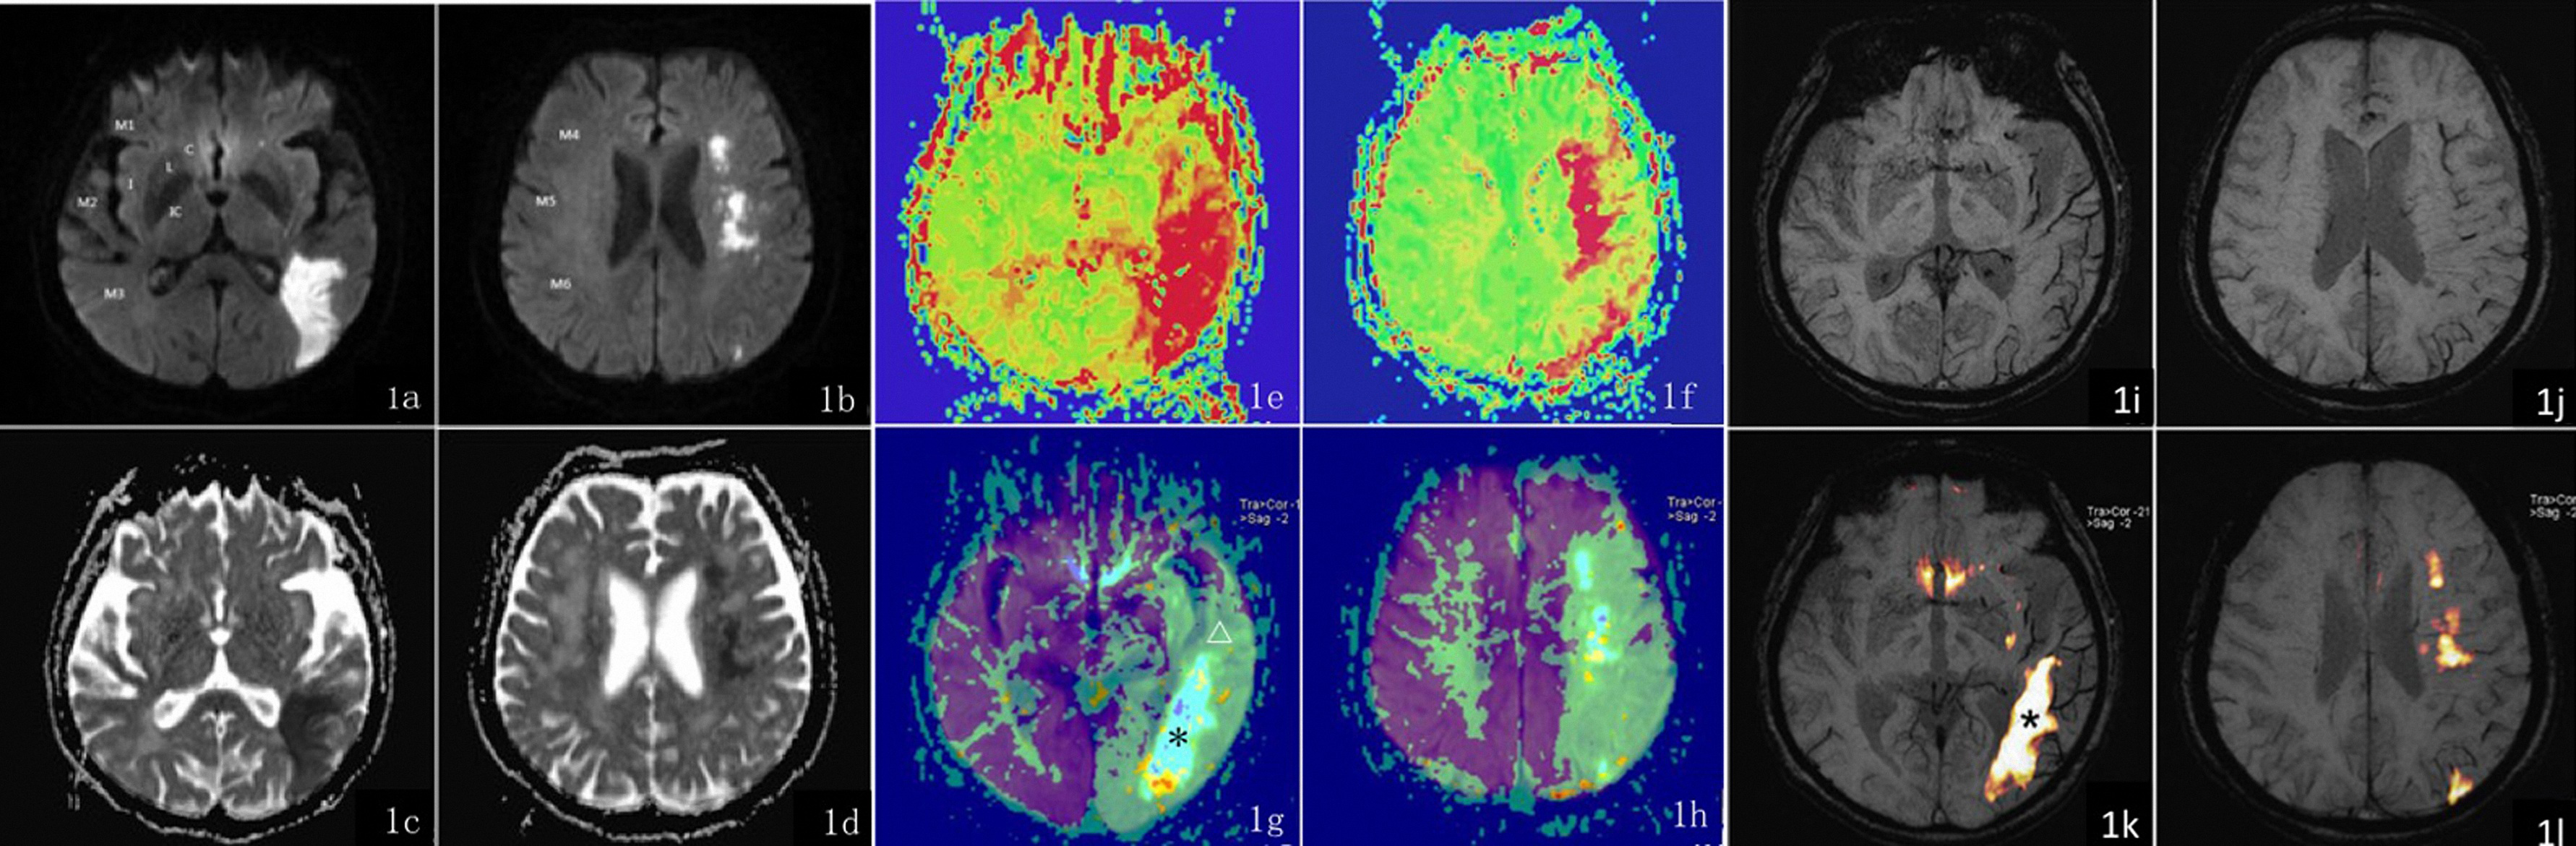
Figure 1.
A female patient, 76 years old, complains of left-sided numbness on when she tries to stand quickly and aphasia over the past 15 hours. Figures 1a and 1c show a patchy hyperintensity on SWI in a single cortical area (Section M3) served by the left middle cerebral artery (area M3). The ADC image shows a reduced ADC value in the left occipital lobe. Figures 1b and 1d show a patchy hyperintensity on SWI in 3 areas served by the left middle cerebral artery (Sections M4-M6) and a decreased ADC signal: ASPECTS
3.2A consistent analysis for assessing ischemic penumbrae with PWI and SWI
Table 1 shows PWI values that define the ischemic penumbra and signs of an increased number of enlarged veins. The change in these values did not reach statistical significance (
An ASPECTS assessment performed on 16 patients revealed both a PWI-DWI and a prominent vein sign. The difference in PWI-DWI versus SWI-DWI scores did not reach statistical significance (
Table 2
ASPECTS assessment with different imaging techniques
| Imaging techniques | |||
| Case | SWI | DWI | PWI(MTT) |
| 1 | 3 | 6 | 4 |
| 2 | 3 | 5 | 4 |
| 3 | 7 | 9 | 6 |
| 4 | 3 | 8 | 4 |
| 5 | 5 | 8 | 5 |
| 6 | 4 | 7 | 3 |
| 7 | 3 | 7 | 3 |
| 8 | 6 | 8 | 6 |
| 9 | 7 | 9 | 6 |
| 10 | 4 | 7 | 4 |
| 11 | 5 | 9 | 5 |
| 12 | 5 | 9 | 5 |
| 13 | 5 | 8 | 5 |
| 14 | 3 | 8 | 4 |
| 15 | 5 | 7 | 5 |
| 16 | 3 | 8 | 3 |
4.Discussion
There are currently three hypotheses for the increase in vein area occupied by an acute ischemic penumbra detected by SWI of the epithelial layer: (1) an increase in deoxyhemoglobin (DHb) levels in venous blood; (2) an increase cerebral blood volume (CBV) facilitated by compensatory vascular dilation; and (3) an increase in the number of veins around the infarct involved in the formation of a compensatory collateral circulation.
Regarding the first hypothesis, the reduced blood supply following the formation of an infarct increases the need for oxygen than normal by affected brain tissue. The relative increase in oxygen required in the artery around the infarct results in a relative increase in DHb in venous blood. Mittal et al. [12] reported that the increase in DHb and decrease in oxyhemoglobin in the capillary and vein may be caused by the uncoupling of oxygen in the hypoperfused tissue. Mammen [13] reported further that the magnetic susceptibility of the tissue could change in response to the reduction in blood flow caused by a thromboembolism, which, in turn could cause an increase in DHb and in the amount of deoxygenated blood. This could lead to the appearance of a cortical vein on SWI. Regarding the second hypothesis, the first compensatory response to a decrease in cerebral perfusion pressure may involve an increase in cerebral blood volume (CBV), which would be facilitated by blood vessel dilation [14]. This could result in the appearance of a prominent vein on SWI with no additional changes. Additionally, 70% to 80% of the total blood volume is venous blood. Therefore, a change in blood volume can result from the dilation of a small vein. Regarding the third hypothesis, the formation of a collateral venous circulation around the infarct may facilitate the restoration of a normal blood supply to the ischemic tissue in the future [15]. The smaller the “new” veins are, the better the collateral circulation is.
Thrombolytic therapy is the most effective treatment currently available for patients who have had an acute ischemic stroke. Our study demonstrates that the selection of patients with an ischemic penumbra and lacking any bleeding risks is the key to a successful outcome with thrombolytic therapy. Thus, an pre-treatment assessment for ischemic penumbrae is of great importance. The internationally recognized therapeutic time window (TTW) for thrombolytic therapy following a stroke is 3 hours [16]. In clinical practice, however, neurologists have found that some patients who are seen within the TTW demonstrate an infarct on imaging tests. It may still be possible to save cerebral tissue in some patients who are seen well past the TTW using a functional imaging test, and neurological function could be restored satisfactorily using thrombolytic therapy. Some investigators now believe that the TTW can be extended up to 12 hours [17]. If so, thrombolytic therapy that is provided according to the accepted TTW could be ineffective in some patients, whereas other patients who could have benefited from early therapy may “miss the boat.” Thus, determining whether an ischemic penumbra exists could be the most important process in thrombolytic therapy. Parsons et al. [18] compared patients who underwent thrombolytic therapy with those who received the recombinant tissue plasminogen activator (rt-PA) and found that the development of an infarct due to mismatching tissue could be reduced in patients with an acute infarction and PDM. In a multicenter study [19], a significant correlation between early reperfusion and clinical recovery was found for patients with PDM but not for those without PDM. Since the aim of the study was to compare SWI and PWI, no follow-up was provided for patients with increased veins, although three patients demonstrated a final infarcted area that was smaller in size than the abnormal perfusion area initially measured during in the clinical examination. Neurological function in these patients was successfully recovered. Further study should focus on the correlation between the increase in epithelial vessels on SWI and prognosis.
SWI has been drawing an increasing amount of attention from the medical profession as an MRI test that can reflect changes in cerebral blood oxygen levels [20]. In our study, 16 patients showed signs of an increase in vein size and they all had a PDM. Meanwhile, the prolongation of MTT and TTP and the decline in CBF and CBV on the perfusion map indicated a state of hypoperfusion in the infarcted cerebral area. The ASPECTS system was used to assess PDM and evaluate SWI quantitatively in terms of the increased epithelial area occupied by veins. The system provided information about local anatomy, thereby reducing differences among raters or misjudgment caused by tissue atrophy and edema. In a study by Barber and colleagues [21, 22], the ASPECTS assessment was also applied in PWI and DWI imaging and found to be related to planimetric volume measurements. Mismatched areas could be predicted by the MR mismatch fraction, which is height-specific. Given that a clinician would probably assess the patient’s medical conditions on a scale, ASPECTS may play an important role in the quantitative evaluation of patients with acute ischemic stroke. ASPECTS is also believed to be an independent factor for predicting the prognosis for patients with an acute ischemic stroke [23]. A comparison of quantitative scores for the MTT-DWI mismatch versus the SWI-DWI mismatch revealed no significant difference and good consistency (
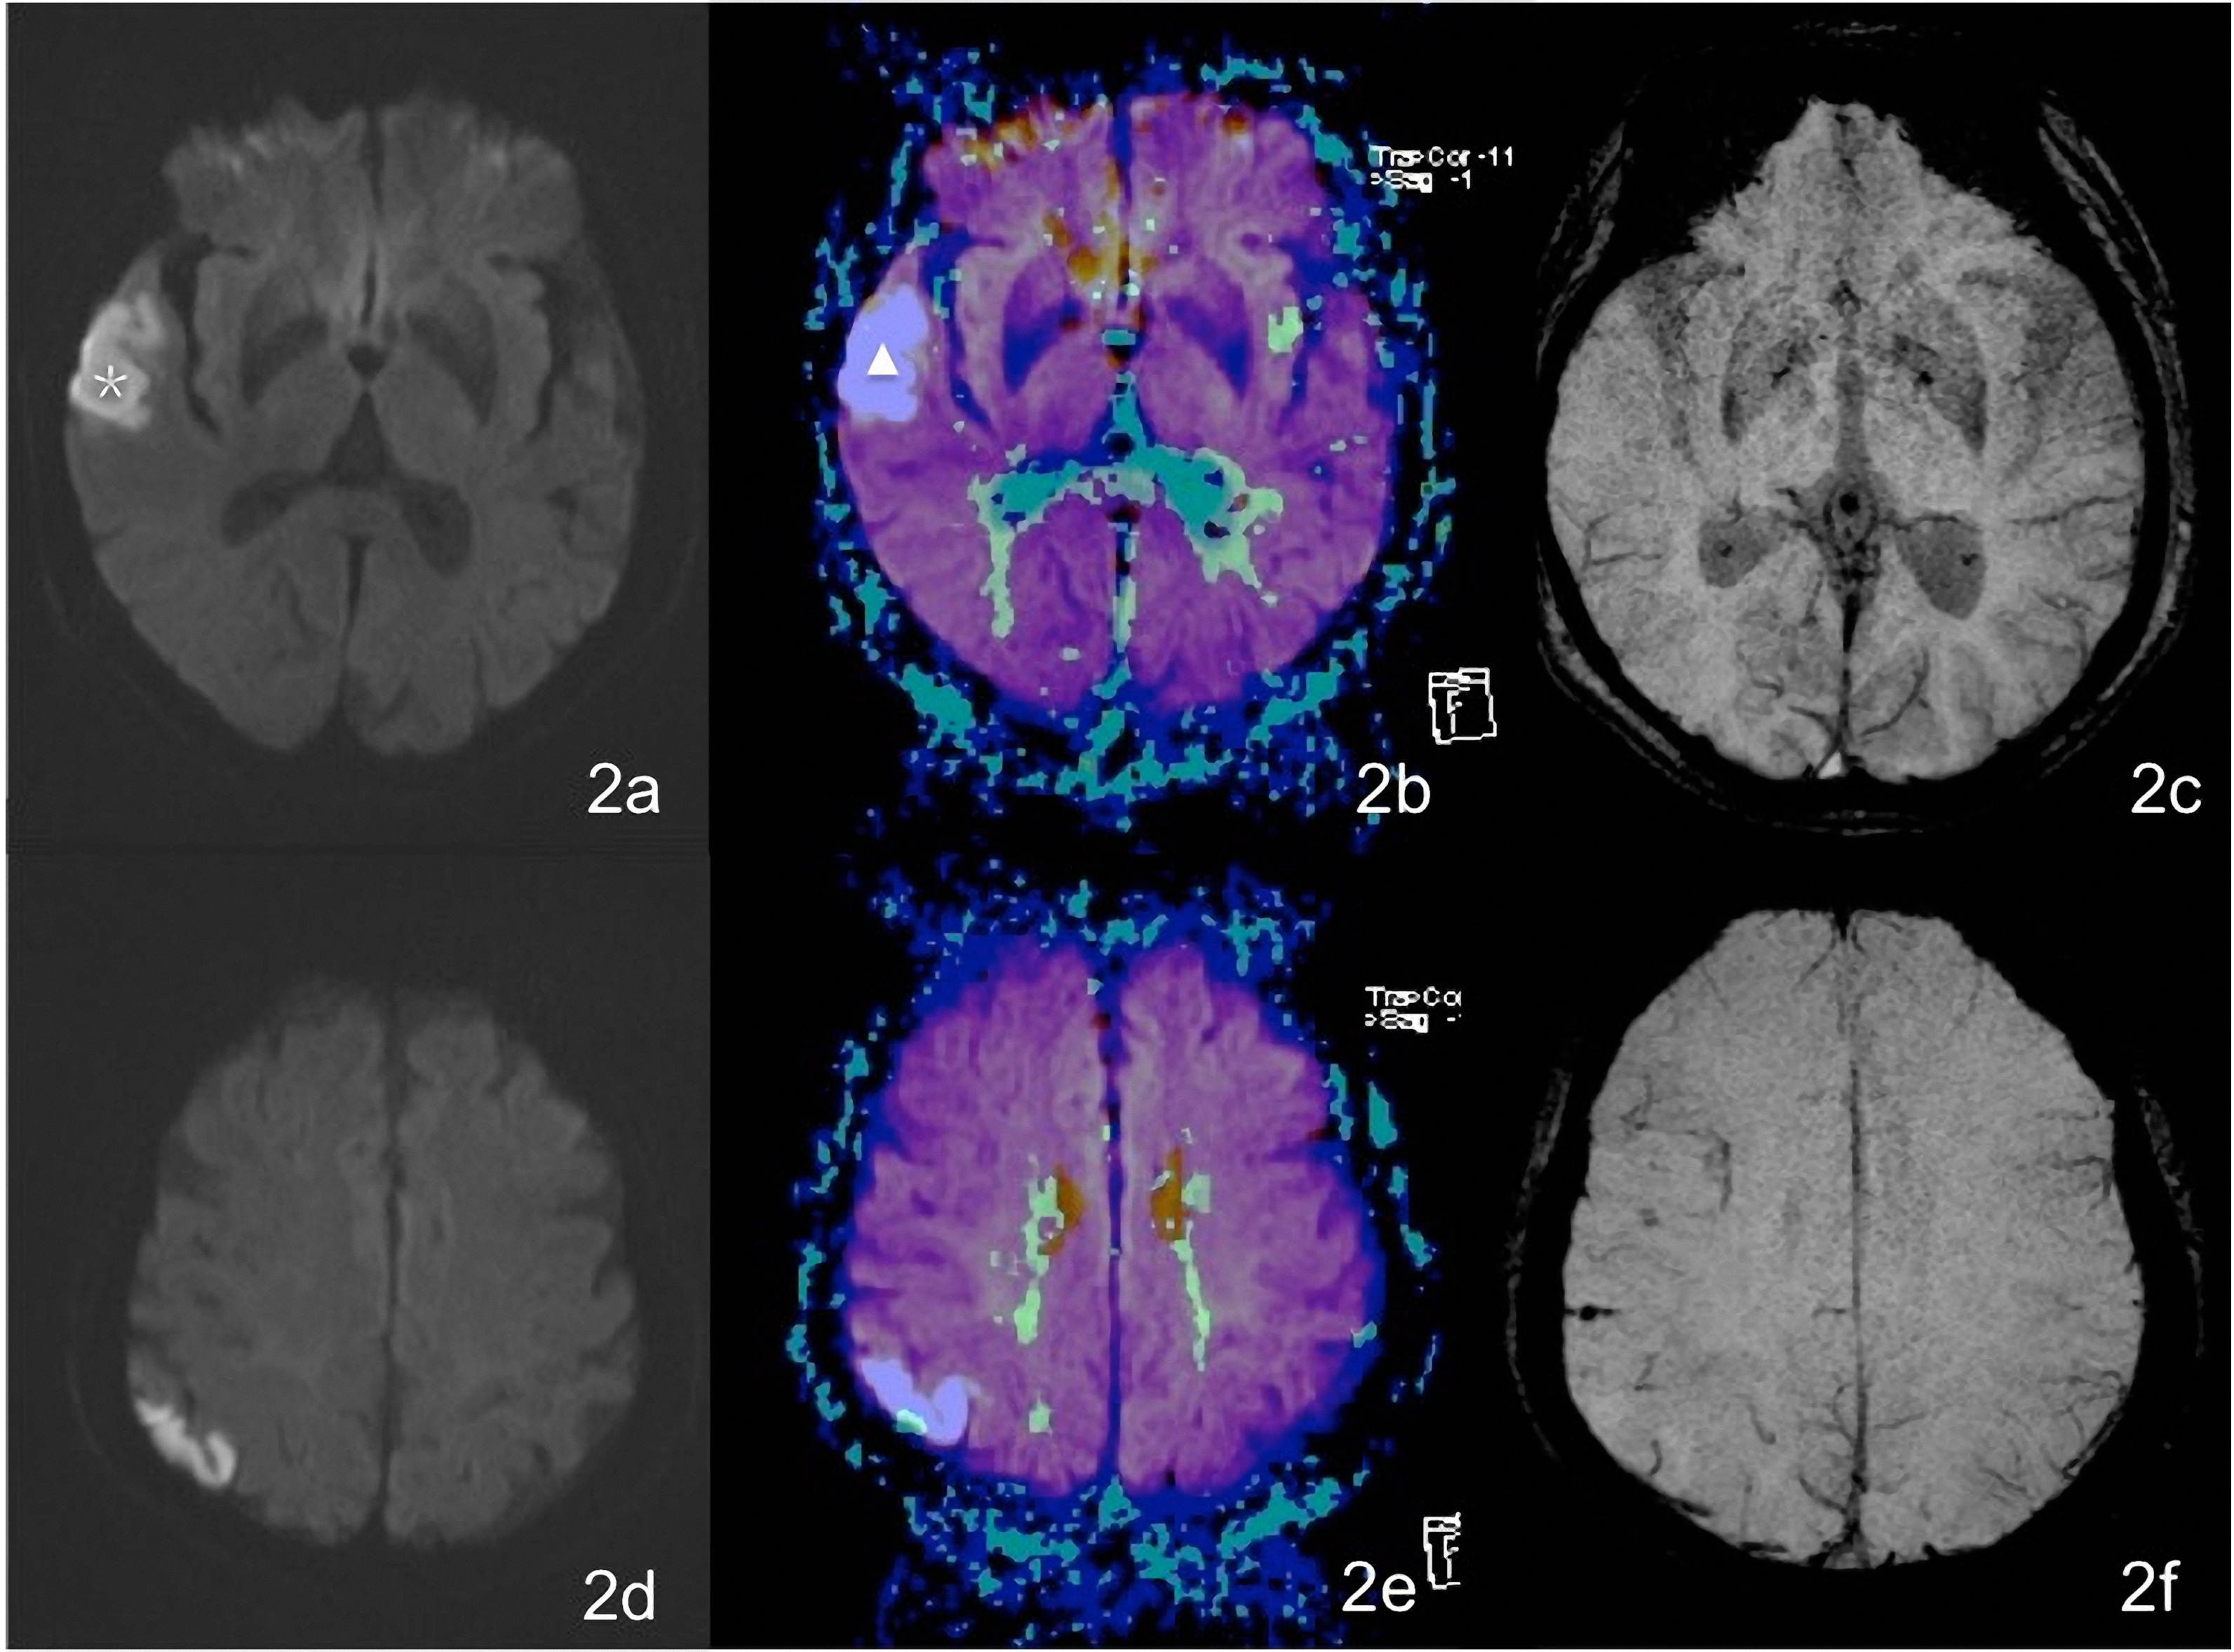
Figure 2.
A female patient aged 76 years complains of vague speech for 46 hours. Figures 2a and 2d show patchy hyperintensity on a DWI of the right temporal lobe and occipital lobe. In Figs 2b and 2e, the white
An intracranial artery thrombus was seen as a hypointensity walking along the vessel on an SWI image. It has been reported in the literature [24] that a magnetic resonance angiogram (MRA) and SWI can be used to detect an intracranial artery embolus in a patient with an acute ischemic stroke. Compared with an MRA, however, a susceptibility vessel sign (SVS) is more likely to indicate a clogged artery. A cerebral artery embolus was identified in 14 patients in our study. Moulin et al. [25] reported that more than one-fourth of patients with acute ischemic stroke may present microbleeds compared with no more than 10% of a healthy population. Microbleeds appeared as dispersed hypointensities less than 0.5 cm in diameter in our study. These hypointensities indicated hemosiderin deposits [26]. Multiple microbleeds may indicate an increase in blood vessel fragility. Among patients with an acute infarction, 20% to 40% showed bleeding transitions one week after onset, this introduces a great possibility of serious complications [27]. Studies have suggested a significant correlation between microbleeds and bleeding transitions after infarction [25]. However, the foci of potential microbleeds could not be detected using a conventional MRI. The SWI was of great importance as a conventional test sequence for patients with acute ischemic stroke.
The findings of this study are limited due to an inadequate number of study samples and that a relatively long SWI scanning time (5 min 5 s). Some patients with a serious acute ischemic stroke were uncooperative during the examination, and this led to some mobile false images and deviations in judgment. There are some limitations in this study. First, the sample size of this study was small, more samples were required to validate the effect in clinical. Second, the scan time of SWI was long (5’5”), that some patients with serious clinical symptoms cannot remain stationary in the whole examination, it may produce some motion artifacts and then affected the image interpretation. Third, only the MTT maps from PWI were selected for this research, it could not represent all PWI parameters, what roles about the CBV, CBF and TTP maps would play requires further study.
The potential for an effective outcome using the SWI in patients who have had an acute ischemic stroke was demonstrated by the finding that an SWI can detect an intracranial artery embolus or ischemic penumbra, as well as microbleeds, thereby serving as a “one-stop” reference for the selection of clinical therapy and a conventional test sequence. The clinical application of SWI could be improved, however, by reducing the scanning time while maintaining or improving image quality; this possibility is worth of further study. Because of a lack of follow-up in this study for patients with increased veins, we recommend further investigation of the relationship between increased veins and prognosis.
5.Conclusion
SWI and PWI showed excellent consistency in their assessment of ischemic penumbrae. As a simple and feasible imaging test method for ischemic penumbra assessment, SWI may be of significant clinical value.
Conflict of interest
None to report.
Acknowledgments
This work was supported by the grant of Young Medical Talents Science Foundation of Nantong (WQ2015020).
References
[1] | Astrup J, Symon L, Branston NM, Lassen NA. Cortical evoked potential and extracellular K+ and H+ are at critical levels of brain ischemia. Stroke. (1977) ; 8: (1): 51-57. |
[2] | Loh PS, Butcher KS, Parsons MW, MacGregor L, Desmond PM, Tress BM, et al. Apparent diffusion coefficient thresholds do not predict the response to acute stroke thrombolysis. Stroke. (2005) ; 36: (12): 2626-2631. |
[3] | Kidwell CS, Saver JL, Mattiello J, Starkman S, Vinuela F, Duckwiler G, et al. Thrombolytic reversal of acute human cerebral ischemic injury is shown by diffusion/perfusion magnetic resonance imaging. Ann Neurol. (2000) ; 47: (4): 462-469. |
[4] | Kamath A, Smith WS, Powers WJ, Cianfoni A, Chien JD, Videen T, et al. Perfusion CT is compared to H2 (15)O/O (15)OPET in patients with chronic cervical carotid artery occlusion. Neuroradiology. (2008) ; 50: (9): 745-51. |
[5] | Yata K, Suzuki A, Hatazawa J, Shimosegawa E, Nagata K, Sato M, et al. A positron emission tomography study showed the relationship between cerebral circulatory reserve and oxygen extraction fraction in patients with major cerebral artery occlusive disease. Stroke. (2006) ; 37: (2): 534-536. |
[6] | Guadagno JV, Warburton EA, Jones PS, Fryer TD, Day DJ, Gillard JH, et al. Heterogeneous patterns of flow/metabolism uncoupling as assessed by quantitative positron emission tomography showed the diffusion-weighted lesion in acute stroke. Cerebrovasc Dis. (2005) ; 19: (4): 239-246. |
[7] | Maija R, Gaida K, Karlis K, Evija M. Perfusion computed tomography relative threshold values are in definition of acute stroke lesions. Acta Radiol Short Rep. (2013) ; 2: (3): 2047981613486099. |
[8] | Chen F, Ni YC. An update of magnetic resonance diffusion-perfusion mismatches in acute ischemic stroke. World J Radiol. (2012) ; 4: (3): 63-74. |
[9] | Huang P, Chen CH, Lin WC, Lin RT, Khor GT, Liu CK. Susceptibility weighted imaging in patients with major stroke applied in clinic. J Neurol. (2012) ; 259: (7): 1426-1432. |
[10] | Kuo PH, Kanal E, Abu-Alfa AK, Cowper SE. Gadolinium-based MR contrast agents shows nephrogenic systemic fibrosis. Radiology. (2007) ; 242: (3): 647-649. |
[11] | Barber PA, Demchuk AM, Zhang J, Buchan AM. Validity and reliability of a quantitative computed tomography score are used to predict outcome of hyperacute stroke before thrombolytic therapy. Lancet. (2000) ; 355: (9216): 1670-1674. |
[12] | Mittal S, Wu Z, Neelavalli J, Haacke EM. Part 2 is susceptibility weighted imaging in technical aspects and clinical applications. Am J Neuroradiol. (2009) ; 30: (2): 232--252. |
[13] | Mammen EF. Pathogenesis of venous thrombosis. Chest. (1992) ; 102(6 Suppl): : 640S-644S. |
[14] | Roussel SA, van Bruggen N, King MD, Gadian DG. Collaterally perfused areas following focal cerebral ischemia in the rat are identified by comparison of gradient echo and diffusion-weighted MRI. J Cereb Blood Flow Metab. (1995) ; 15: (4): 578-586. |
[15] | Schaffer CB, Friedman B, Nishimura N, Schroeder LF, Tsai PS, Ebner FF, et al. Two-photon imaging of cortical Surface microvessels reveals a robust redistribution in blood flow after vascular occlusion. PLoSBiol. (2006) ; 4: (2): 258-270. |
[16] | Worp HB, Gijn JV. Clinical practice is used to acute ischemic stroke. N Engl J Med. (2007) ; 357: (6): 572-579. |
[17] | Bai Q, Zhao Z, Sui H, Xie X, Chen J, Yang J, Zhang L. Susceptibility-weighted imaging for cerebral microbleed detects in super-acute on ischemic stroke patients treated with intravenous thrombolysis. Neurol Res. (2013) ; 35: (6): 587-593. |
[18] | Parsons MW, Barber PA, Chalk J, Darby DG, Rose S, Desmond PM, et al. Diffusion- and perfusion-weighted MRI respond to thrombolysis in stroke. Ann Neurol. (2002) ; 5: (1): 28-37. |
[19] | Albers GW, Nlijs VN, Wechsler L, Kemp S, Schlaug G, Skalabrin E, et al. Magnetic resonance imaging profiles predict clinical response to early reperfusion including the diffusion and perfusion imaging evaluation for understanding stroke evolution (DEFUSE) study. Ann Neurol. (2006) ; 60: : 508-517. |
[20] | Jensen-Kondering U, Baron JC. Oxygen imaging by MRI answersthe question whether blood oxygen level-dependent imaging can depict the ischemic penumbra? Stroke. (2012) ; 43: (8): 2264-2269. |
[21] | Barber PA, Hill MD, Eliasziw M, Demchuk AM, Pexman JH, Hudon ME, et al. ASPECTS Study Group. Imaging of the brain in acute ischaemic stroke compares computed tomography and magnetic resonance diffusion-weighted imaging. J Neurol Neurosurg Psychiatry. (2005) ; 76: (11): 1528-1533. |
[22] | Butcher K, Parsons M, Allport L, Lee SB, Barber PA, Tress B, et al. EPITHET Investigators. Rapid assessment of perfusion-diffusion mismatches. Stroke. (2008) ; 39: (1): 75-81. |
[23] | Edlow JA. Evidence-based guideline shows diffusion and permission MRI play a role in the diagnosis of acute ischemic stroke from the report of the Therapeutics and Technology Assessment Subcommittee of the American Academy of Neurology. Neurology. (2011) ; 76: : 2036. |
[24] | Huang P, Chen CH, Lin WC, Lin RT, Khor GT, Liu CK. Susceptibility weighted imaging in patients with major stroke applies in clinic. J Neurol. (2012) ; 259: (7): 1426-1432. |
[25] | Moulin T, Leblond T, Chopard JL, Bogousslavsky J. Hemorrhagic infarcts. Eur Neurol. (1993) ; 34: (2): 64-77. |
[26] | Hermier M, Nighoghossian N, Derex L, Adeleine P, Wiart M, Berthezène Y, et al. Hypointensetrans-cerebral veins at T2*-weighted MRI which is a marker of hemorrhagic transformates risk in patients treated by intravenous tissue plasminogen activator. J Cereb Blood Flow Metab. (2003) ; 23: (11): 1362-1370. |
[27] | Kidwell CS, Saver JL, Villablanca JP, Duckwiler G, Fredieu A, Gough K, et al. Detection of microbleeds before thrombolysis with magnetic resonance imaging is an emerging application. Stroke. (2002) ; 33: (1): 95-98. |


