
A surface acoustic wave ICP sensor with good temperature stability
Abstract
BACKGROUND:
Intracranial pressure (ICP) monitoring is very important for assessing and monitoring hydrocephalus, head trauma and hypertension patients, which could lead to elevated ICP or even devastating neurological damage. The mortality rate due to these diseases could be reduced through ICP monitoring, because precautions can be taken against the brain damage.
OBJECTIVE:
This paper presents a surface acoustic wave (SAW) pressure sensor to realize ICP monitoring, which is capable of wireless and passive transmission with antenna attached.
METHODS:
In order to improve the temperature stability of the sensor, two methods were adopted. First, the ST cut quartz was chosen as the sensor substrate due to its good temperature stability. Then, a differential temperature compensation method was proposed to reduce the effects of temperature. Two resonators were designed based on coupling of mode (COM) theory and the prototype was fabricated and verified using a system established for testing pressure and temperature.
RESULTS:
The experiment result shows that the sensor has a linearity of 2.63% and hysteresis of 1.77%.
CONCLUSIONS:
The temperature stability of the sensor has been greatly improved by using the differential compensation method, which validates the effectiveness of the proposed method.
1.Introduction
ICP monitoring was first recorded as far back as 1783 by Alexander Monro [1]. These days, long term and continuous ICP monitoring is in great demand for hydrocephalus patients, patients with head injury, and patients with hypertension [2]. The current methods can be divided into invasive and noninvasive techniques. Noninvasive techniques include CT, MRI, and transcranial Doppler, all of which are low risk in terms of complications although the accuracy is not so good [3]. The invasive method, named gold standard, adopts a catheter-based system to realize pressure measurements by placing a catheter into the ventricle to drain the cerebrospinal fluid to an external pressure transducer. This method has good accuracy, but it is suitable for short period measurement as it lacks mobility and has high risk of infection [4]. In this paper, a SAW pressure sensor is developed to achieve real time and long term monitoring. Furthermore, if a corresponding antenna is added to the sensor, it can function passively and wirelessly [5].
The temperature effect is a very important factor to be considered in SAW pressure sensor design since temperature could decrease the accuracy of the sensor [6]. In this paper, two methods are adopted to decrease the temperature effect. First, ST cut quartz is selected as the sensor substrate due to its good temperature stability. Second, two resonators are designed with one of them affected by pressure and temperature and the other influenced by temperature changes only. The output frequency equals the difference between the two resonators so that the temperature effect can be reduced. The paper is organized as follows: Section 2 introduces the working principles, simulation and temperature compensation of the SAW resonator type pressure sensor; Section 3 explains the sensor’s fabrication and experimental setup; and Section 4 presents the experiment results of the study.
2.SAW sensor design and simulation
2.1Working principle of SAW pressure sensor
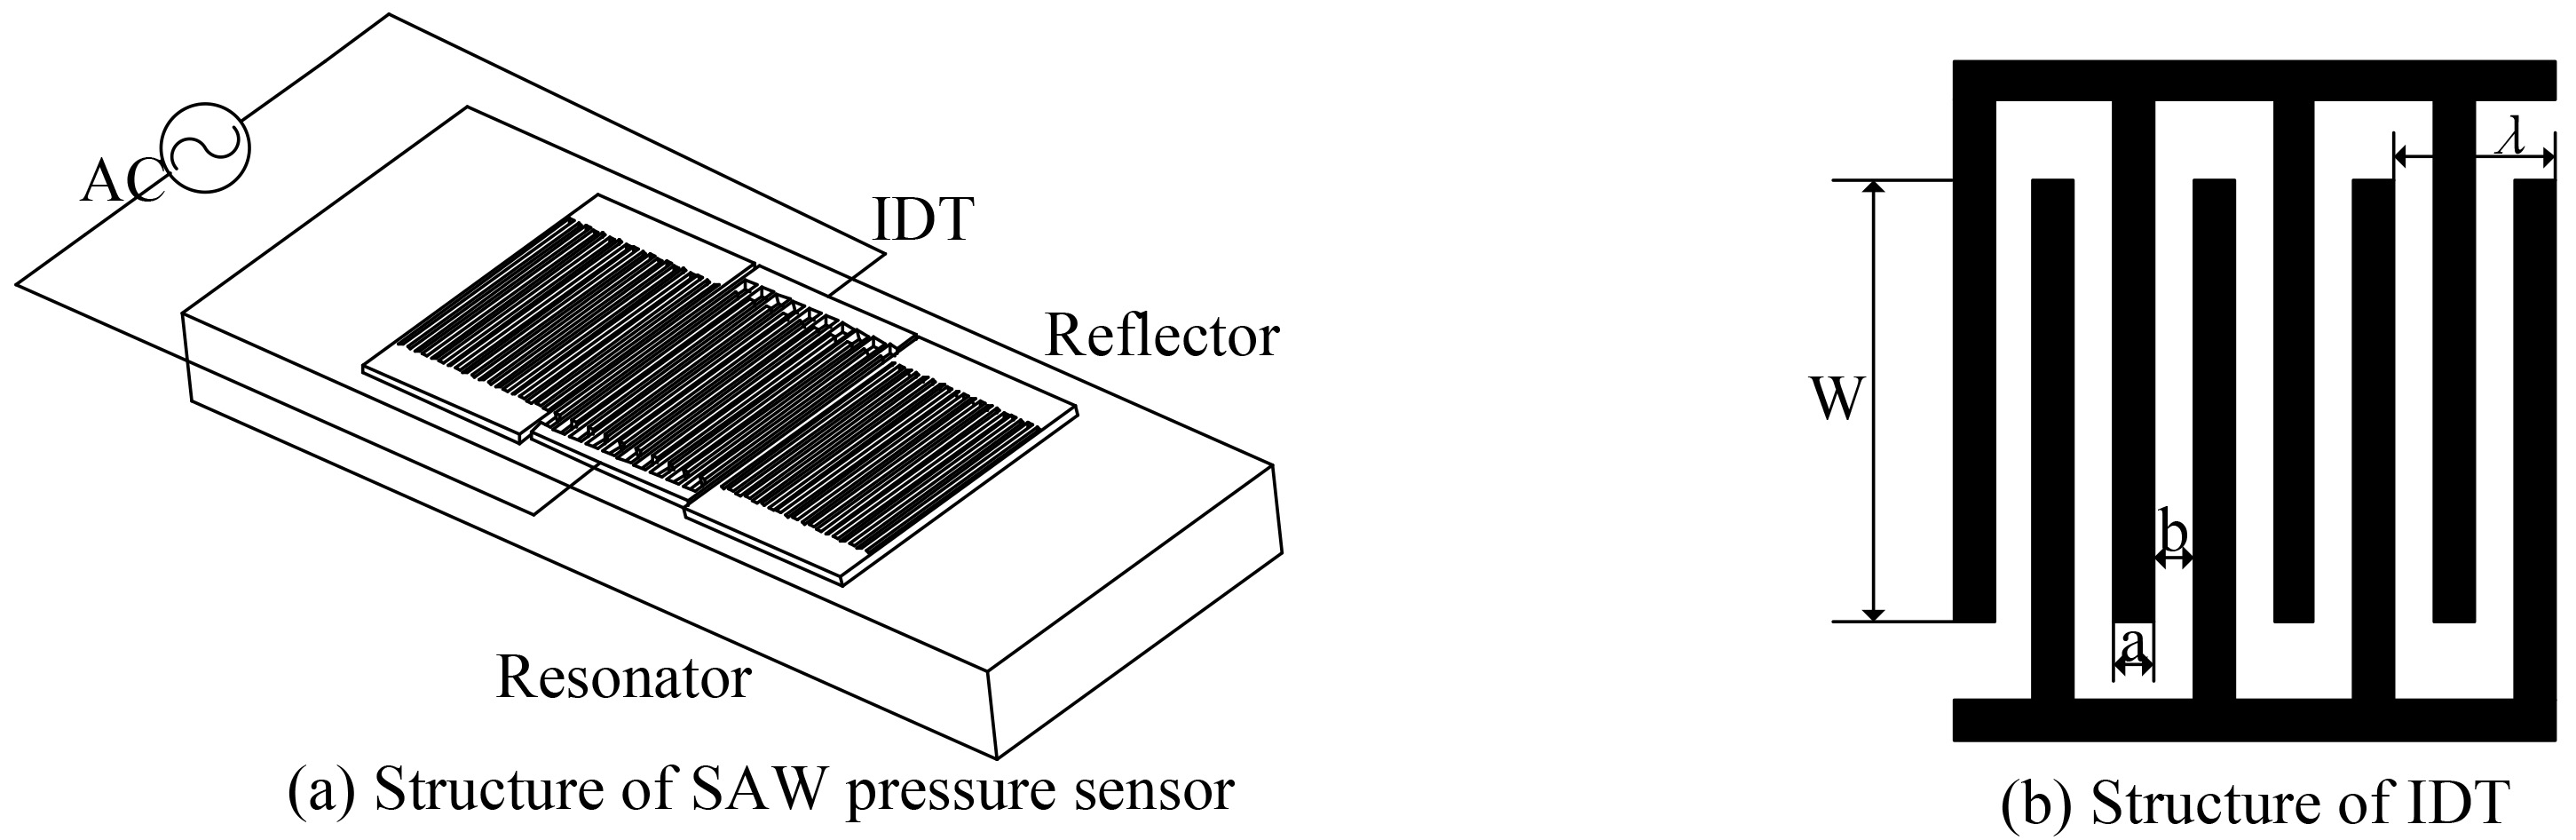
The structure of a SAW device can be classified into two types: the resonator type and the delay line type [7]. In this paper, the resonator type pressure sensor is designed and simulated. The working principle of a resonator device is as follows: the aluminum electrodes are deposited on the quartz surface to form one inter-digital transducer (IDT) and two reflectors, as shown in Fig. 1a. The RF signal is applied to the IDT, which converts the electric signals into mechanical wave through the inverse piezoelectric effect. The IDT and resonators thus form a resonant cavity, which corresponds to a resonant frequency. If the pressure is applied to the sensor, the frequency is changed with the input pressure. So the relationship between pressure and frequency can be obtained. Figure 1b is the detailed structure of the IDT. Performance of a SAW device is related to parameters such as electrode width, thickness, aperture, and number pairs.
Figure 1.
Schematic diagram of SAW pressure sensor.
2.2SAW pressure sensor design and simulation
The coupling of mode (COM) model is an effective and efficient method for the analysis of SAW devices. In this paper, the COM model of SAW device was established to calculate the optimal design parameters through Matlab. Each part of the resonator, like IDT, reflector, or gap can be described by a 3
(1)
Where
After establishment of the COM model, the design parameters were obtained by choosing a sharp S11. The values of these parameters are listed in Table 1.
Table 1
Design parameters of SAW pressure sensor
| Design parameters | Design parameters | ||
|---|---|---|---|
| Wavelength | 7.8 | Reflector number | 150 |
| Half wavelength p | 3.9 | h | 0.04 |
| IDT pair number | 179 | Aperture | 50 |
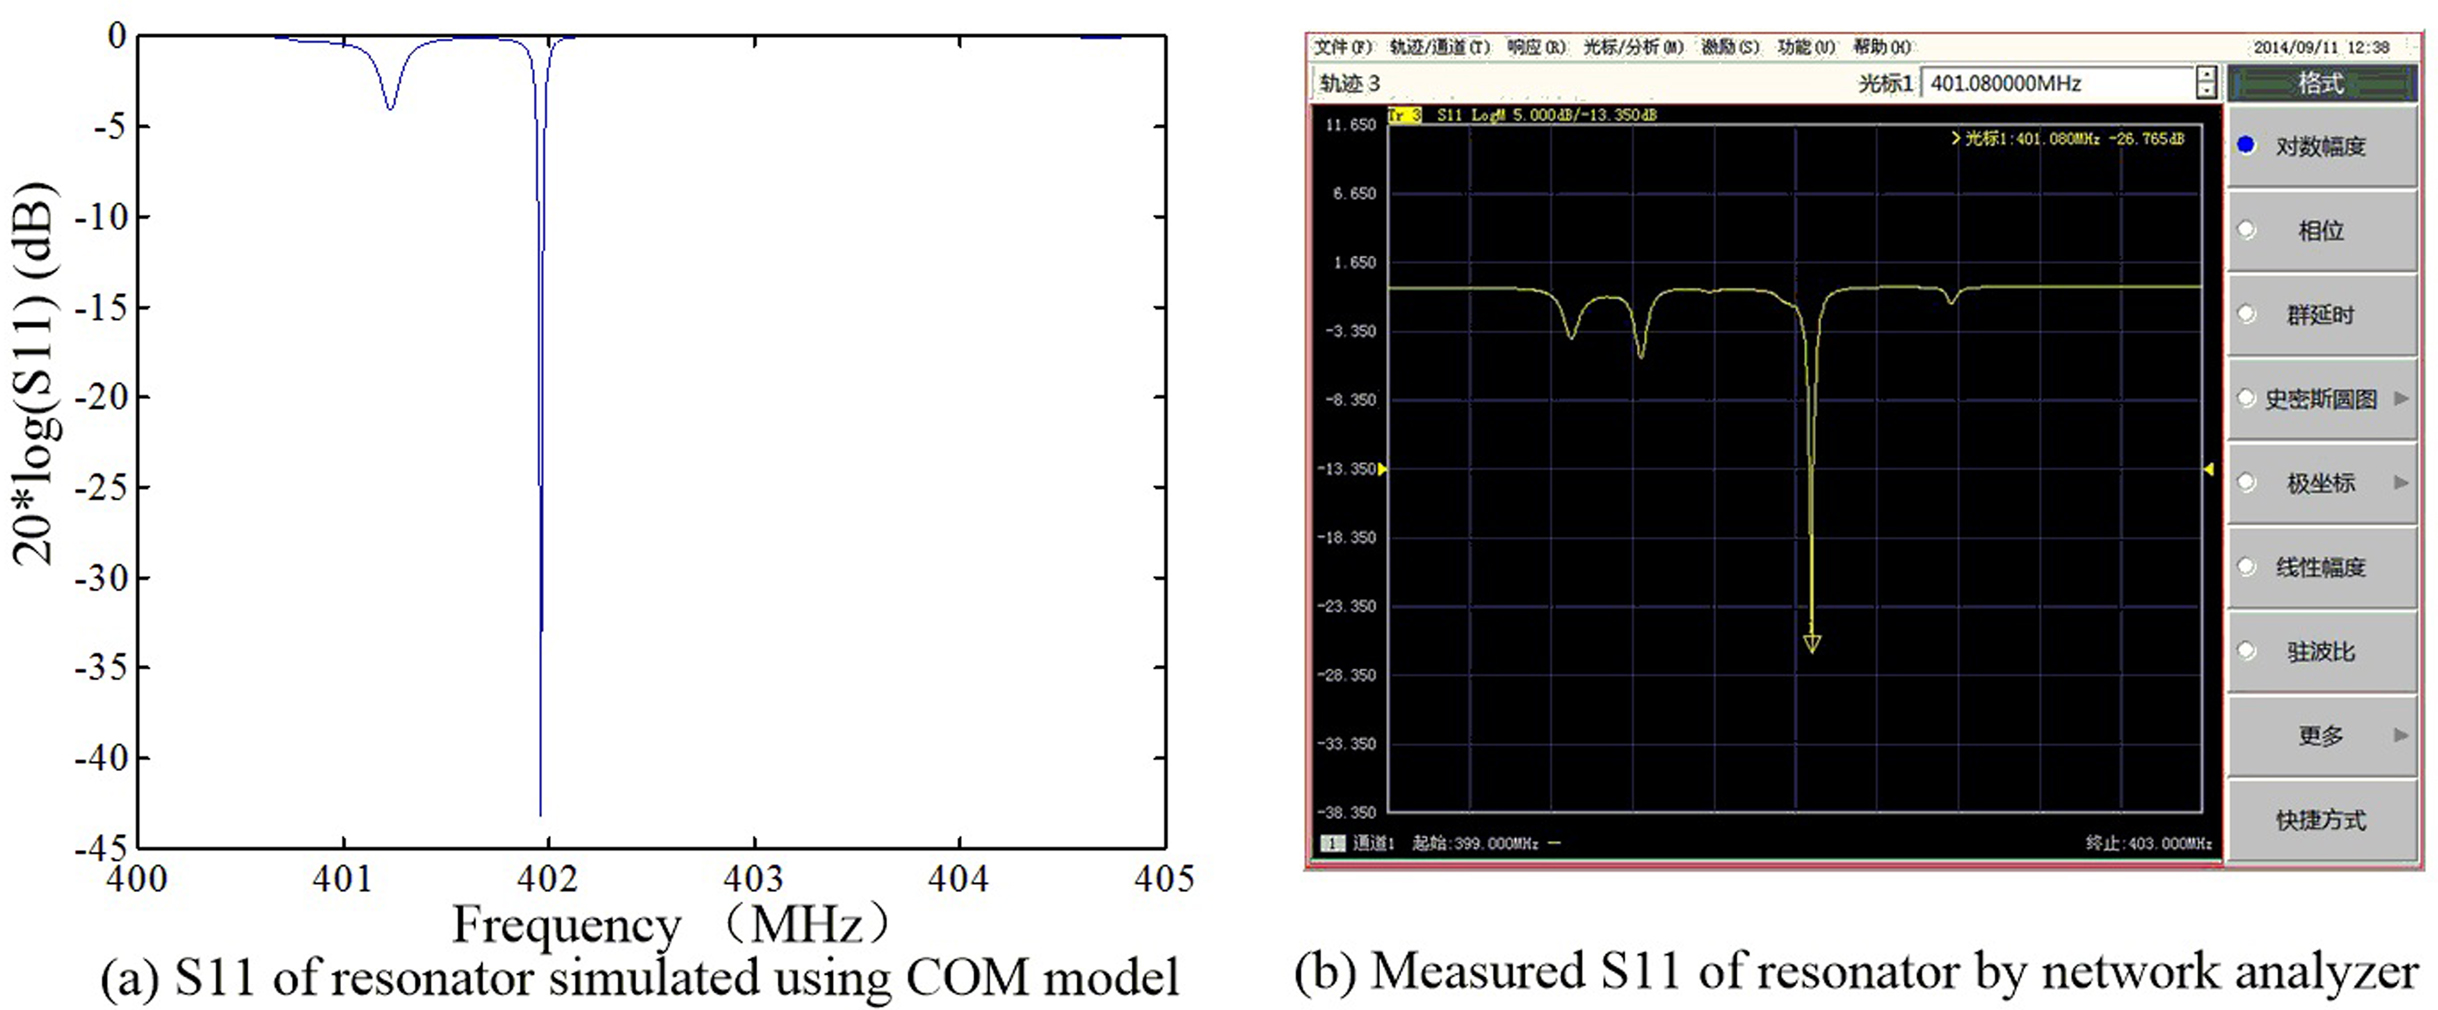
Figure 2 shows the simulated reflection coefficient S11 in the frequency domain. A sharp and narrow bandwidth of S11 was obtained. Figure 2b shows the measured S11 of the sensor through network analyzer. It can be seen that the device was well-simulated using the COM model.
Figure 2.
S11 of the resonator type SAW sensor.
2.3Temperature compensation of SAW pressure sensor
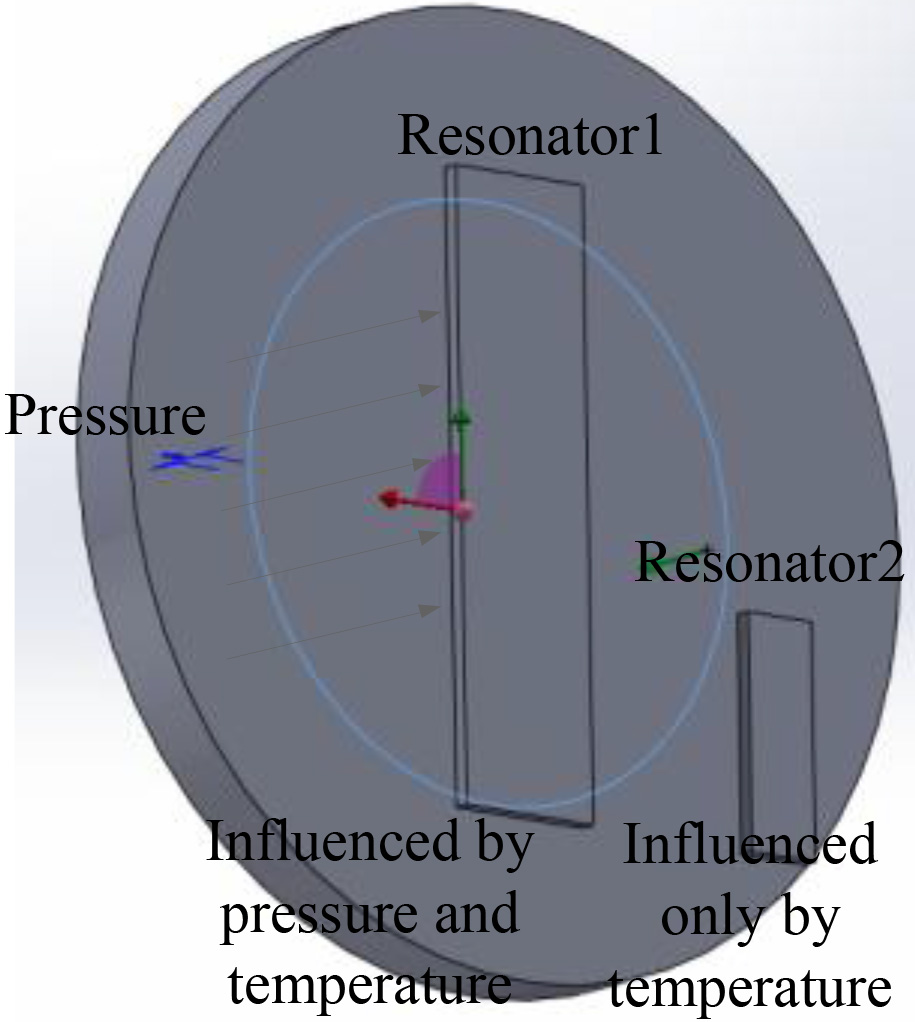
Temperature compensation is very important for pressure sensors. Although ST cut quartz is selected as the substrate because of its temperature stability [9], the sensor still shows temperature susceptibility. So the differential temperature compensation structure was designed by using two resonators. Resonator 1 (R1) was influenced by temperature and pressure, while R2 was installed on the package, so it was only impacted by temperature (see Fig. 3).
Figure 3.
Placement of two resonators.
For Resonator 1, the output frequency can be expressed by
(2)
Where
For Resonator 2, since it is installed on the package, it is only susceptible to temperature change, so
(3)
Where
The temperature influence can be compensated by the difference between R1 and R2, so
(4)
If the two resonators are fabricated on the same substrate, the temperature coefficient are almost equal, that is,
(5)
From the above equation, the temperature effect could be eliminated and the difference frequency is only related to the input pressure.
3.Fabrication and experimental setup
3.1Fabrication process of SAW sensor
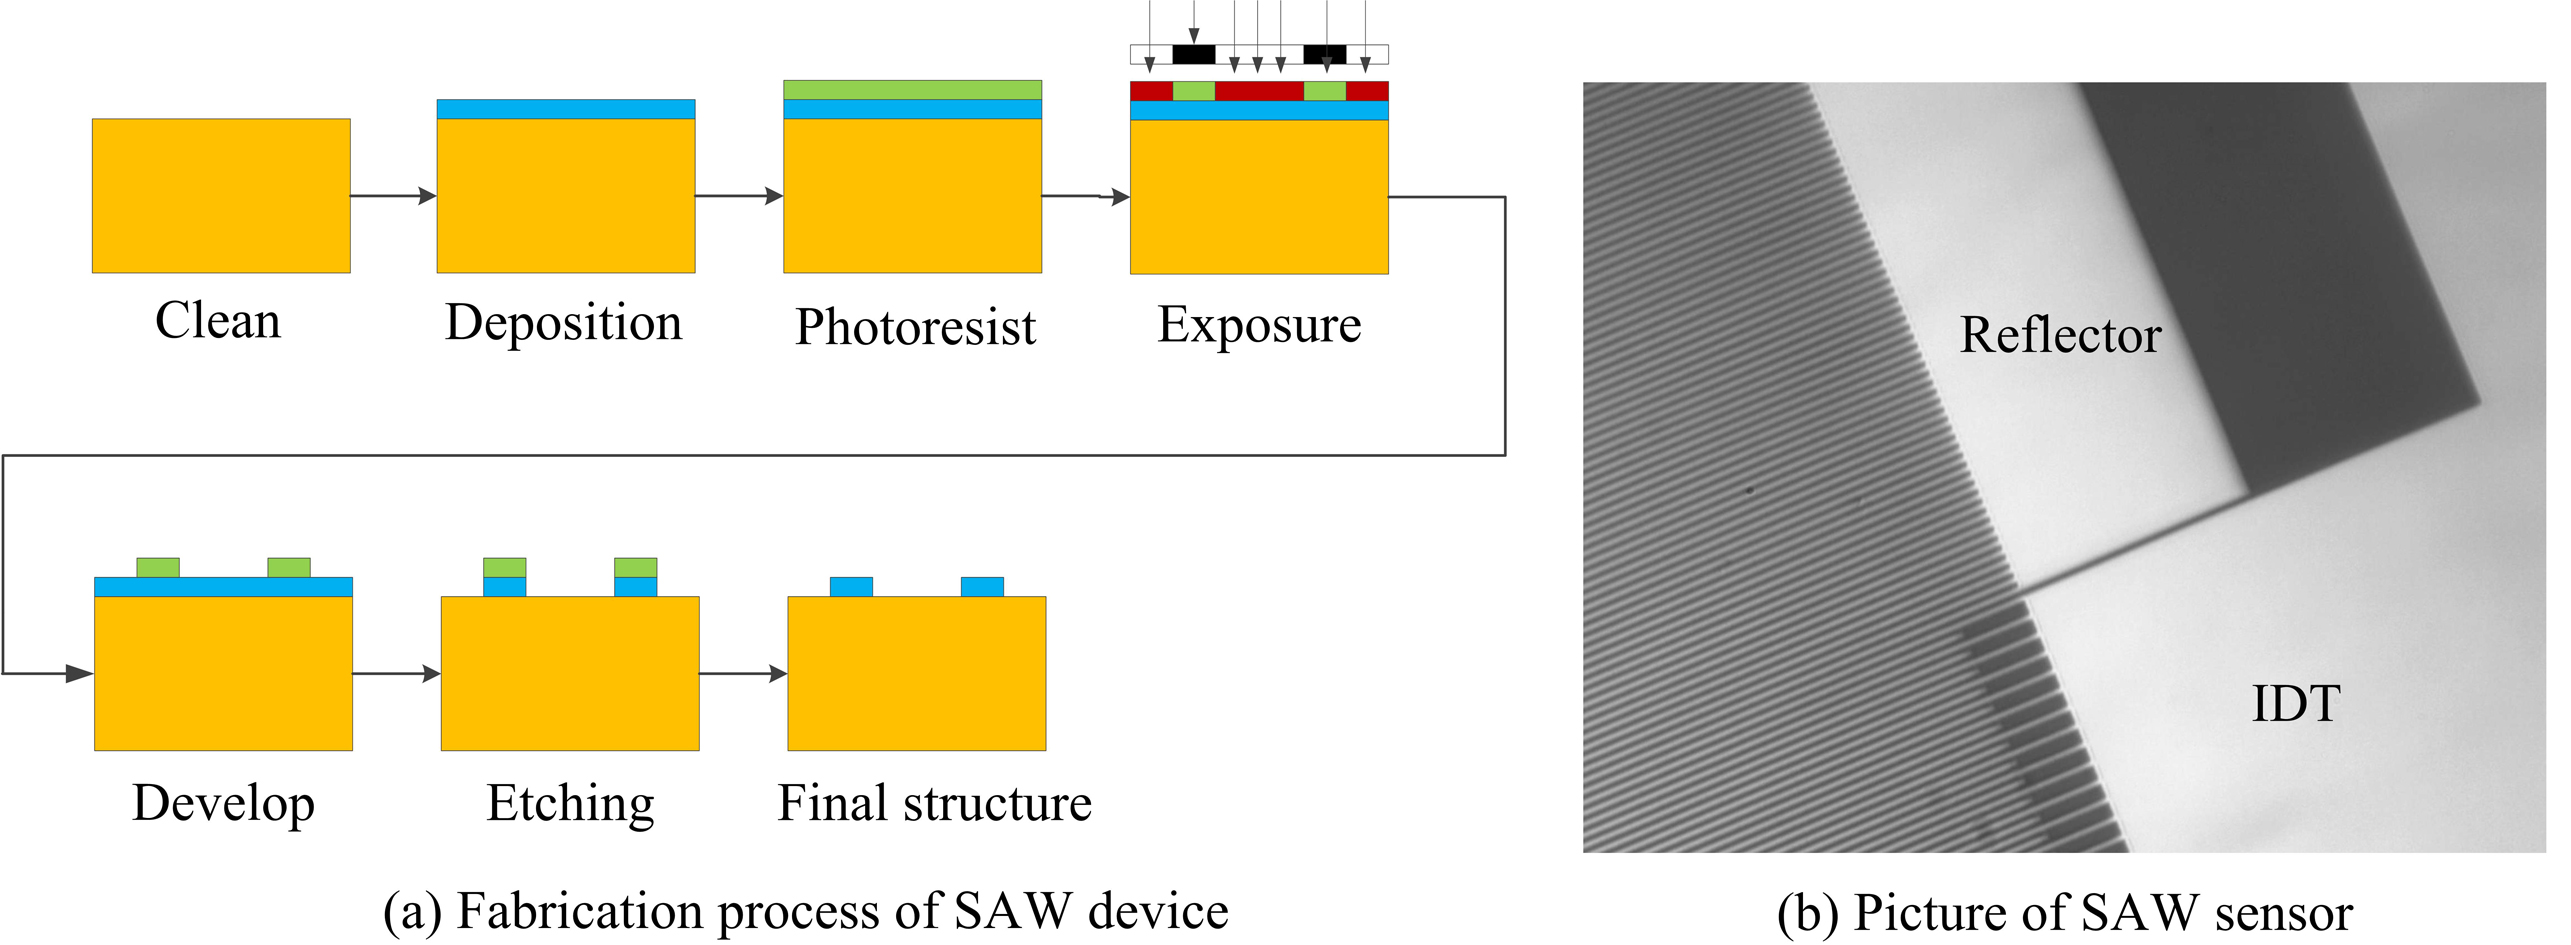
Figure 4a shows the fabrication process of the SAW sensor. First the wafer was completely cleaned to remove particles on the surface. Then a layer of Aluminum with the thickness of 1560 Å was deposited on the top surface. The photoresist was coated, exposed and developed to form the structure of the IDT and reflectors. Finally, the electrodes were formed on the quartz substrate through dry etching method RIE. Figure 4b is a picture of the SAW sensor.
Figure 4.
Fabrication of SAW pressure sensor.
3.2Experimental setup
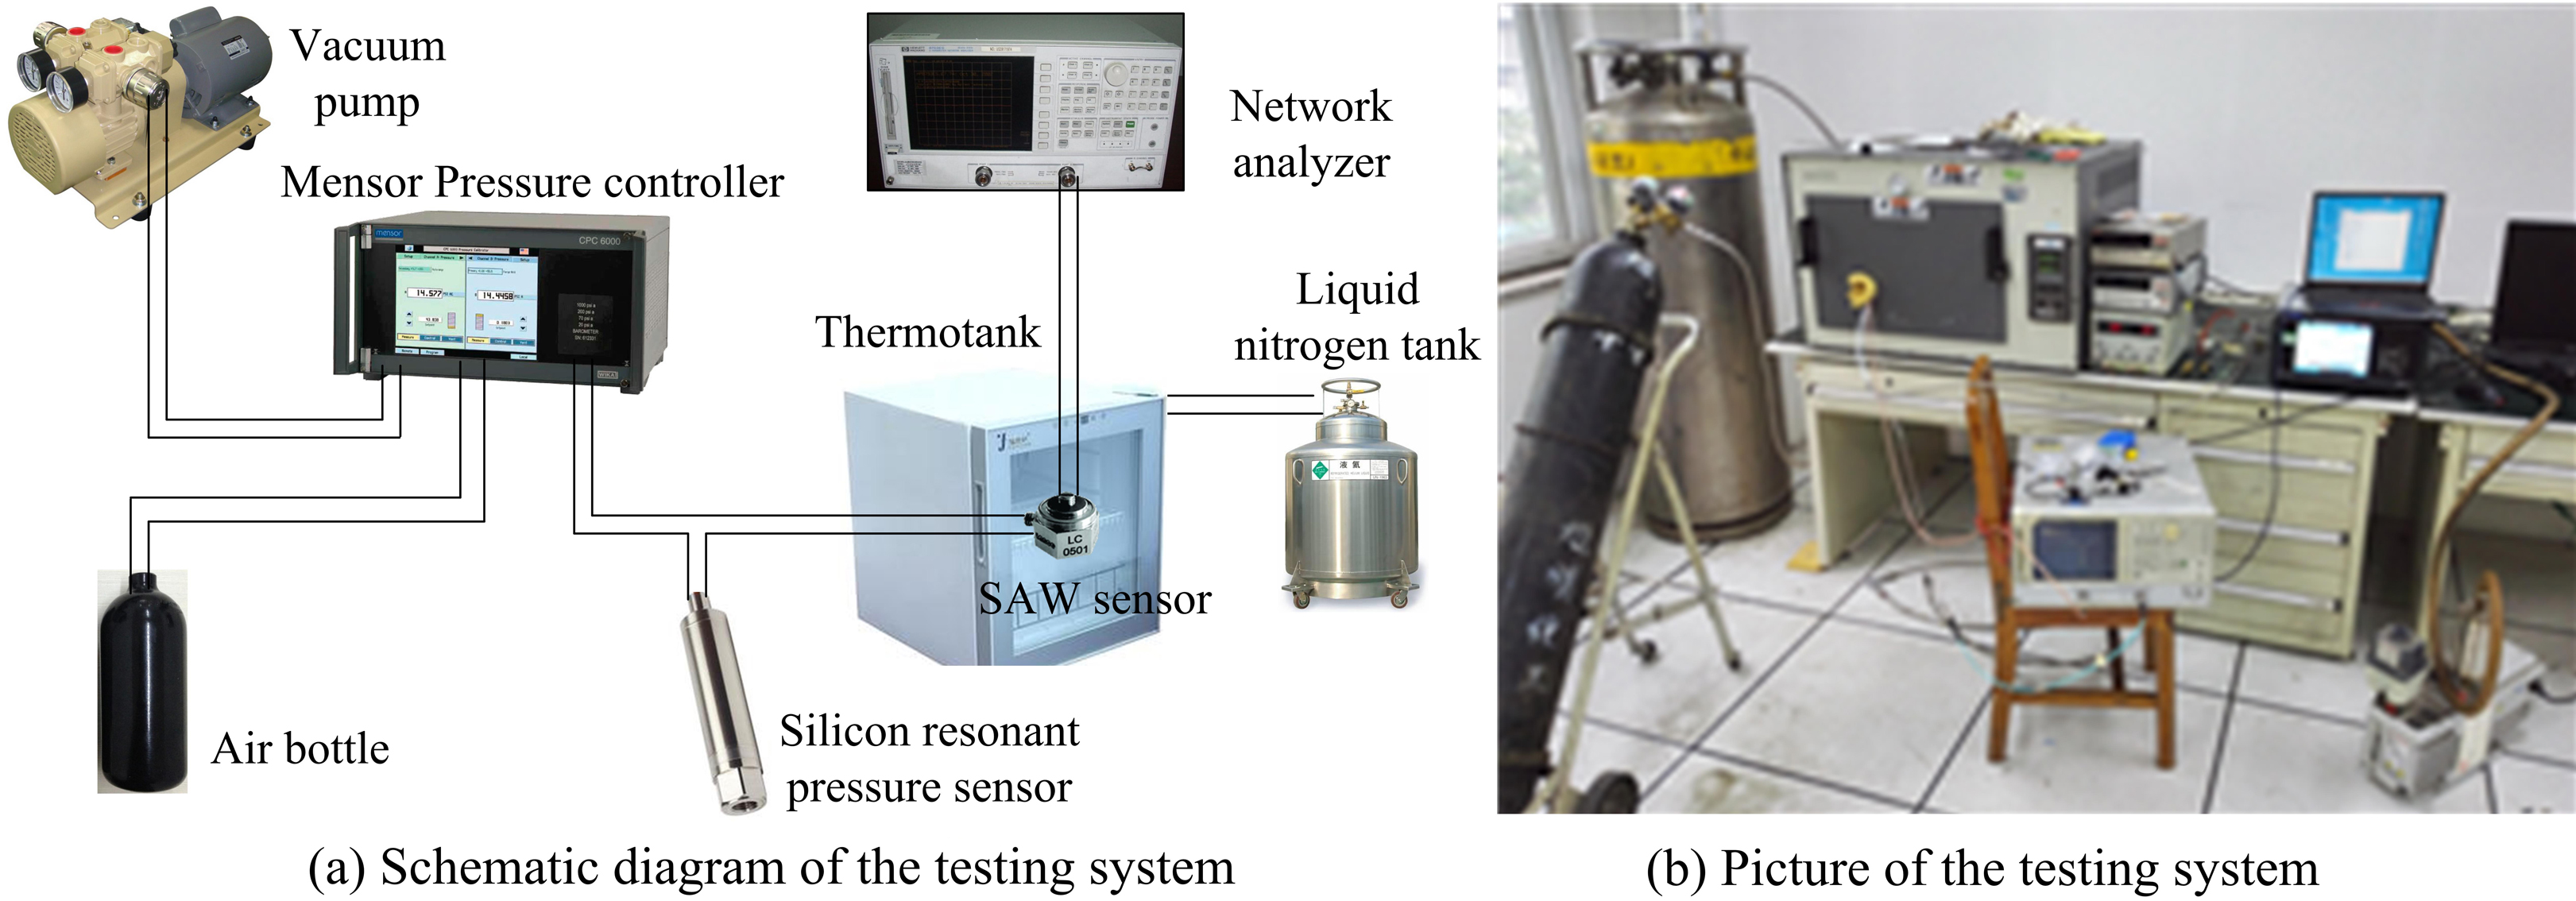
The sensor was tested using a network analyzer (Agilent 8753ES) by measuring the reflection coefficient S11 under different temperatures and pressure. It was placed in a thermotank with a liquid nitrogen tank connected. A vacuum pump and air bottle were used to generate the input pressure, which could be regulated by a pressure controller (Mensor CPC6000). A high accuracy pressure sensor (RPT350, accuracy 0.01%) was put inside together with SAW sensor, so that its measured pressure could be considered as the true value and used for calibration. Figure 5a shows a block diagram of the overall setup. By using the above equipment, the temperature and pressure can be quickly and precisely adjusted.
Figure 5.
Setup of SAW pressure sensor testing system.
4.Results
4.1Test of a single resonator sensor
The sensor was tested using the above setup system. A single resonator type pressure sensor was tested at room temperature. The pressure was increased from 0 kPa to 22 kPa and then decreased to 0. Figure 7 shows the relationship between the input pressure and output frequency. It was calculated that the linearity of the sensor was 2.63% and the hysteresis 1.77%.
Figure 6.
Relationship between pressure and frequency of Resonator1 pressure sensor.
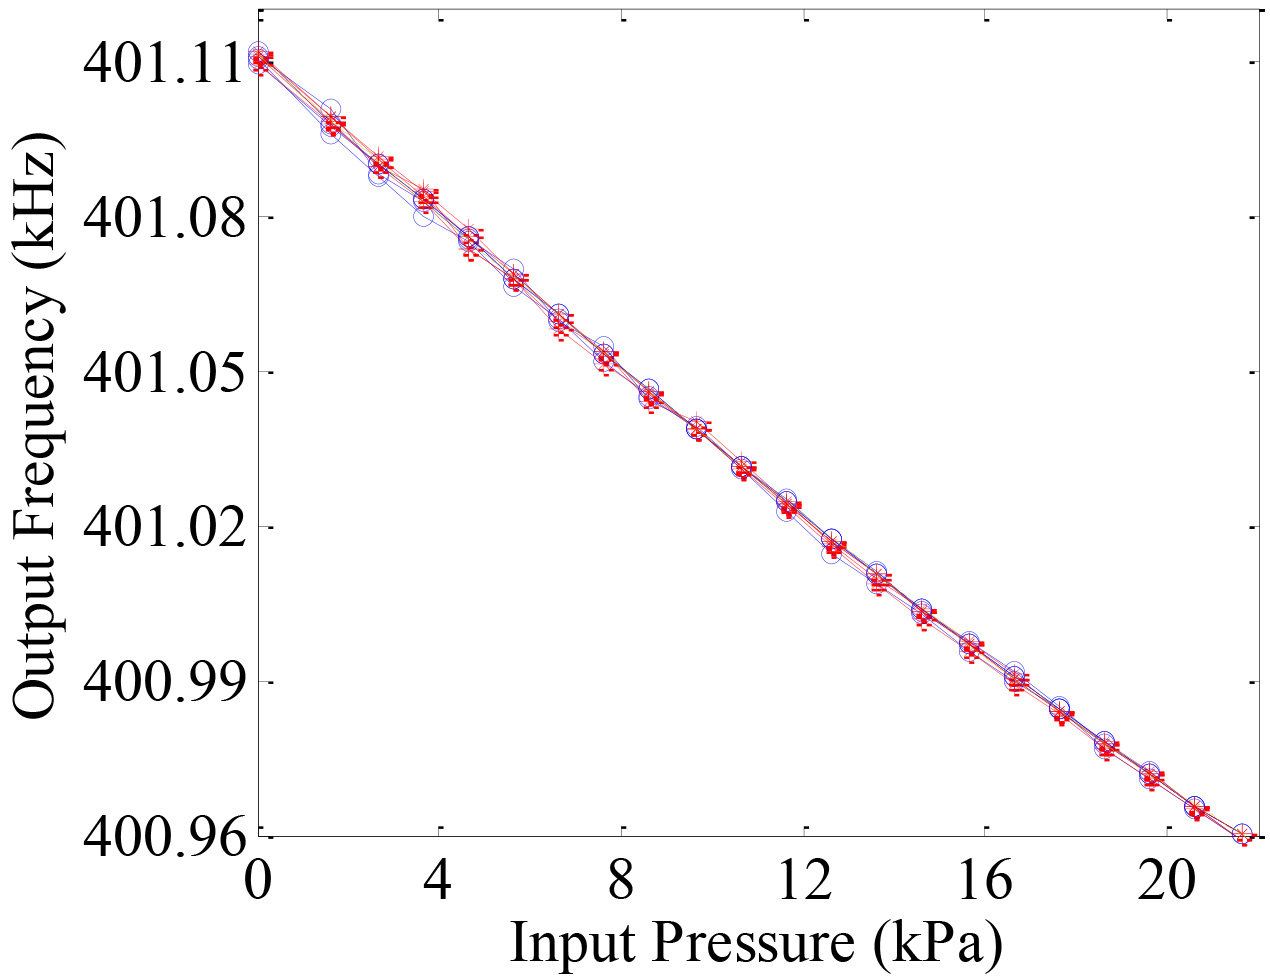
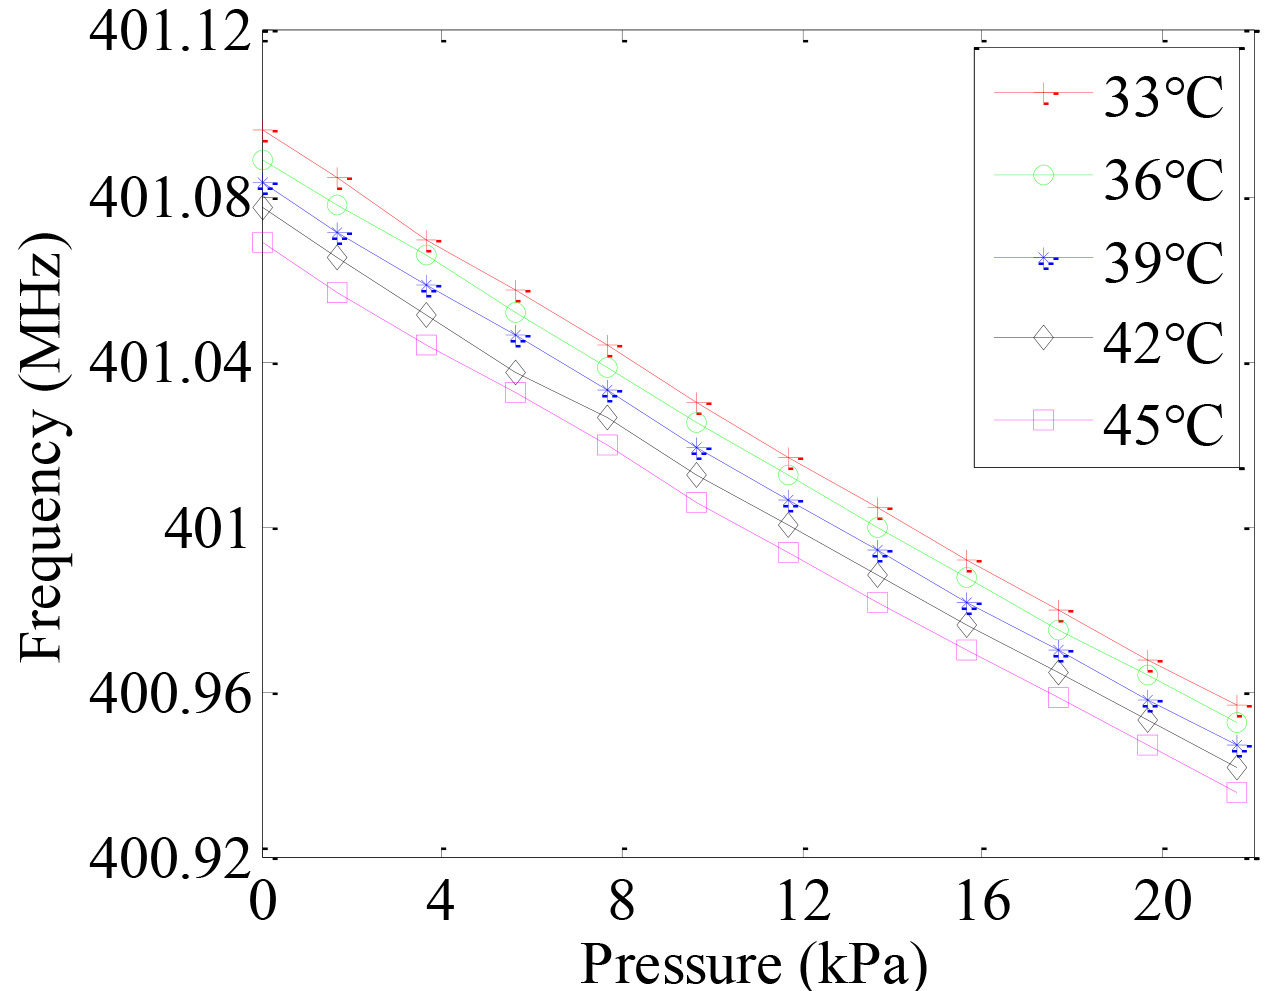
Figure 7.
Relationship between pressure and frequency of Resonator1 under different temperature.
4.2Temperature compensation by differential method
The sensor was then tested under different temperatures ranging from 33
Figure 8.
Difference frequency output vs pressure under different temperature.
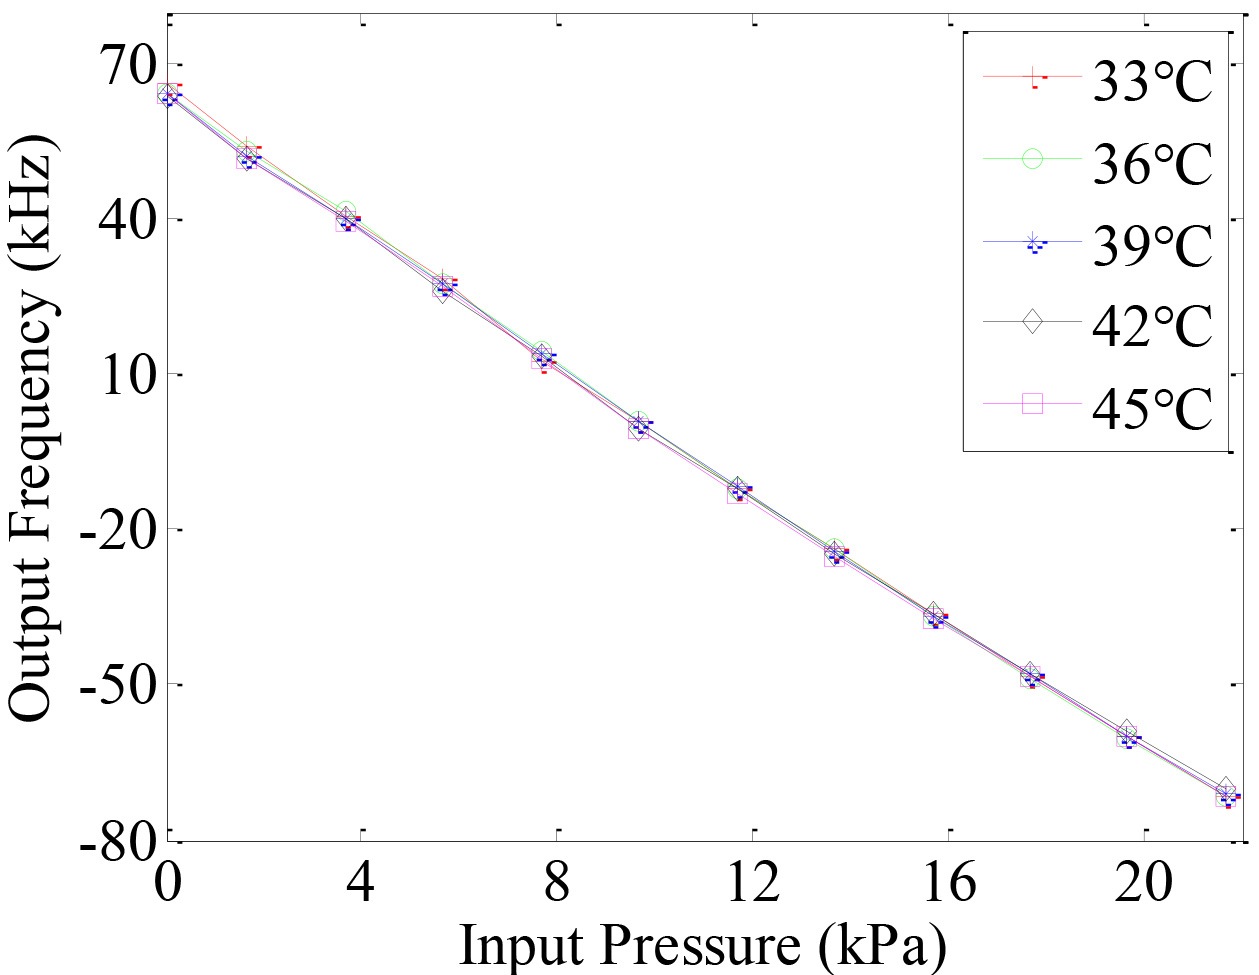
Figure 8 shows the relationship between input pressure and output frequency after temperature compensation. The output frequency was calculated by the difference between Resonators 1 and 2. From the figure, it can be seen that the output frequency was improved a lot under different temperatures, which demonstrates the effectiveness of this method.
5.Conclusion
In this paper, a surface acoustic wave pressure sensor was designed for ICP monitoring. The mathematical model of SAW sensor was established through COM model. A differential temperature compensation structure was proposed to improve temperature stability, which was theoretically proven to work. An experimental setup system was established to test the performance of sensors under different pressure and temperatures. The results show that the proposed sensor has a linearity of 2.63% and hysteresis of 1.77%. But there still needs a lot of improvements, especially in size and packaging, clinical application of the sensor is still a long way off.
Conflict of interest
None to report.
Acknowledgments
The authors gratefully acknowledge the support from the National Nature Science Foundation of China under the NSFC Grant 51375118, and the support from Shenzhen Government Founding GJHZ20140419142750948. The authors wish to thank Yunqiao Mei and Xingye Liu from AVIC Chengdu CAIC Electronics Co. Ltd for their support in establishing the experimental setup system.
References
[1] | Mokri B., The Monro-Kellie hypothesis: applications in CSF volume depletion. Neurology. (2001) : 56: : 1746–1748. |
[2] | Shimbles S., Dodd C., Banister K., Mendelow A.D., and Chambers I.R., Clinical comparison of tympanic membrane displacement with invasive intracranial pressure measurements. Physiological Measurement. (2005) : 26: : 1085–1092. |
[3] | Wiegand C., and Richards P., Measurement of intracranial pressure in children: a critical review of current methods. Developmental Medicine and Child Neurology. (2007) : 49: : 935–941. |
[4] | Zhong J., Dujovny M., Park H.K., Perez E., Perlin A.R., and Diaz F.G., Advances in ICP monitoring techniques. Neurological Research. (2003) : 25: : 339–350. |
[5] | Aubert T., Elmazria O., and Assouar M.B., Wireless and batteryless surface acoustic wave sensors for high temperature environments. International Conference on Electronic Measurement & Instruments: (2009) . |
[6] | Zhang X.W., Wang FY., and Li L., Optimal selection of piezoelectric substrates and crystal cuts for SAW-based pressure and temperature sensors. IEEE Transactions on Ultrasonics,Ferroelectrics and Frequency Control: (2007) . |
[7] | Honghu B., and Li T., A surface acoustic wave sensor for the treatment of hydrocephalus. Journal of Mechanics in Medicine and Biology. (2014) : 14: : 1–9. |
[8] | Lim C., Wang W., Yang S., and Lee K., Development of SAW-based multi-gas sensor for simultaneous detection of CO2 and NO2. Sensors and Actuators B: Chemical. (2011) : 154. |
[9] | Schulz M.B., and Holland M.G., Surface acoustic wave delay lines with small temperature coefficient. Proceedings of the IEEE: (2005) : 1361–1362. |


