
Optimal three-dimensional reconstruction for lung cancer tissues
Abstract
The existing three-dimensional (3D) x-ray reconstruction methods for lung cancer tissue reconstruct the investigated objects based on a series of two-dimensional (2D) image sections and a chosen 3D reconstruction algorithm. However, because these procedures apply the same segmentation method for all 2D image sections, they may not achieve the optimal segmentation for each section. As a result, the reconstructed 3D images have limited spatial resolution. Furthermore, the existing 3D reconstruction method is time-consuming and results in a limited time resolution. This research presents an innovation of 3D reconstruction by reformulating two main components of the method. First, a validity index for fuzzy clustering is used to obtain the optimal segmentations of any 2D x-ray image. The process is realized by automatically determining the optimal number of clusters for the image. Second, unlike the existing 3D reconstruction methods, a fast-FCM algorithm is used to speed up the 2D image segmenting process, thereby raising the time resolution of the 3D reconstruction process. With the aid of commonly used VTK software, the proposed method has been used to visualize four classes of typical lung cancer tissues: adenocarcinoma, large cell carcinoma, small cell carcinoma, and squamous cell carcinoma. Experimental results validate the effectiveness and efficiency of the proposed algorithm. Thus, the method contributes a useful tool for x-ray-based 3D image reconstruction.
1.Introduction
X-ray computed tomography (XCT) is a widely-used imaging technique in medical applications [1, 2, 3]. In the existing methods of three-dimensional (3D) x-ray reconstruction of lung cancer tissue, the investigated objects are reconstructed from a series of two-dimensional (2D) image sections using a 3D reconstruction algorithm. Fast and efficient 3D reconstruction of human tissues can help doctors identify the investigated objects, and improve the accuracy and objectiveness of lung cancer diagnosis. Many 3D reconstruction methods have been proposed that apply the same segmenting procedure for all 2D image sections. However, for a given section, the procedure may not yield the optimal 2D image segmentation. This leads to the limited spatial resolution of the reconstructed 3D image. Furthermore, the existing methods are time-consuming and have a limited time resolution [4].
The segmentation quality of any 2D section will directly affect the spatial resolution of the corresponding 3D reconstruction of the investigated objects. Several hard and fuzzy clustering algorithms have been created to perform the 2D segmentation of medical images. For the diagnosis of lung cancer, fuzzy clustering is the most frequently used method [5, 6]. There are at least two reasons to choose fuzzy clustering. First, any 2D XCT image contains uncertain measurements due to limited spatial resolution and inevitable noisy data. Second, natural human tissues may lack clear edges and may have independently distributed areas. In addition, when tissues overlap, some organs of lung cancer patients are inaccessible for x-ray detection, and cannot be observed efficiently. Therefore, the measurement data may be inconsistent and incomplete. In such situations, fuzzy clustering can work better than other segmenting methods. But when fuzzy clustering is applied to segment a 2D image, it is generally assumed that the number of clusters is known, and this number is used to segment all of the 2D images. This procedure may fail to obtain the optimal 2D segmentation for all candidate 2D images for a particular section. When the 2D sections correspond to different parts of a human body, which differ in the number of tissue types, the same number of clusters cannot represent the natural structure of human tissue distribution. As a result, the reconstructed 3D image maybe less than optimal [7, 8]. This study presents an innovation of 3Dreconstruction, built on the foundation of two different reformulations. First, a validity index for fuzzy clustering was used to obtain the optimal segmentations of any 2D x-ray image. The process was realized by automatically determining the optimal number of clusters by a trial-and-error method. Second, a fast-FCM algorithm was used to speed up the 2D image segmenting process, thus raising the time resolution of the 3D reconstruction process [9].
The Visualization Tool Kit (VTK) is a shared, cross-platform, parallel processing supported graphics function library that is widely used in different areas. With the aid of VTK software, the method proposed in this paper has been applied to reconstruct 3D images of four typical lung cancer shapes. The VTK includes two standard 3D medical image reconstruction methods: surface reconstruction and volume reconstruction. Although surface reconstruction is much faster than volume reconstruction, the latter can present a deeper understanding of the investigated objects. Thus, in this study we applied a typical volume reconstruction Marching Cube (MC) algorithm in the VTK to validate our proposed method.
2.Proposed method
This section describes a two-part method. First, a fast fuzzy clustering algorithm was conducted to increase the time resolution for any 2D image. Then, two fuzzy indexes were introduced to improve the spatial resolution of a 2D image.
2.1The application of fast fuzzy clustering to raise time resolution
One of the most effective algorithms for dealing with uncertain and inconsistent information is the fuzzy c-means (FCM) algorithm [10]. Consequently, different FCM derivative algorithms have been developed for different applications. Fast FCM (f-FCM) is one that can be used in the image processing field [11].
Suppose that a 2D image is composed of a set
(1)
where
(2)
and
(3)
The terminal condition of this algorithm is set when a user-specified threshold value is reached according to the following formulas:
(4)
The fast FCM function is performed based on a one-dimensional attribute such as the gray-scale value. Thus, its computational complexity is
2.2The application of validity index to raise spatial resolution
If the number of clusters is not known, it can be calculated using a proper function called the cluster validity index [12, 13]. The two most commonly used fuzzy validity indexes are the partitioning entropy (PE) index [14] and the Xie-Beni index [15]. The PE index is defined as
(5)
Where
On the other hand, Xie and Beni et al. [15] defined a validity index as
(6)
where the value of
The proposed 3D XCT imaging algorithm includes the following six steps for handling a series of 2D image sections:
Step1. Partition the 2D XCT image into a group of pixels (rectangular or triangular units). The number of pixels is
Step2. Segment all pixels in any 2D XCT image into
Step3. Find the optimal 2D section for any 2D image by using the chosen clustering validity indexes.
Step4. Perform Step2 and Step3 forall 2D sections that are candidates for 3D reconstruction.
Step5. Reconstruct a 3D XCT image from a series of optimal 2D sections using a chosen 3D volume reconstruction algorithm.
Step6. Explain the pathology characteristics of the obtained 3D images.
Hereafter, the optimal 2D section-based 3D XCT reconstruction method will be referred to as OP-3D-XCT.
Table 1
Sampling distribution
| Tissue type | Lesion type | Number | Total |
|---|---|---|---|
| Normal tissue | – | 109 | 109 |
| Lesion tissue | AD | 34 | 91 |
| SQ | 29 | ||
| LA | 11 | ||
| SM | 9 | ||
| Other | 8 |
3.Experiment and analysis
The medical image 3D reconstruction system for VTK was developed with Visual C
Experimental samples of lung tissue were provided by the General Hospital of Tianjin Medical University. These samples consisted of tumor tissues and the surrounding normal parts. As shown in Table 1, there were a total of 109 lung tissues. After removal of the invalid data such as noise and error, only 91 groups of data were available. These samples were classified by pathological type into the following categories: 34 adenocarcinoma (AD), 11 large cell carcinoma (LA), 29 squamous cell carcinoma (SQ), 9 small cell carcinoma (SM), and 9 categorized as Other.
3.1Description of lung cancer types
Based on diverse histopathology characteristics and shape distributions, there are four common lung cancer types, as shown in Fig. 1.
Figure 1.
Pathological section of four types of typical lung cancer tissues (he, 50x).
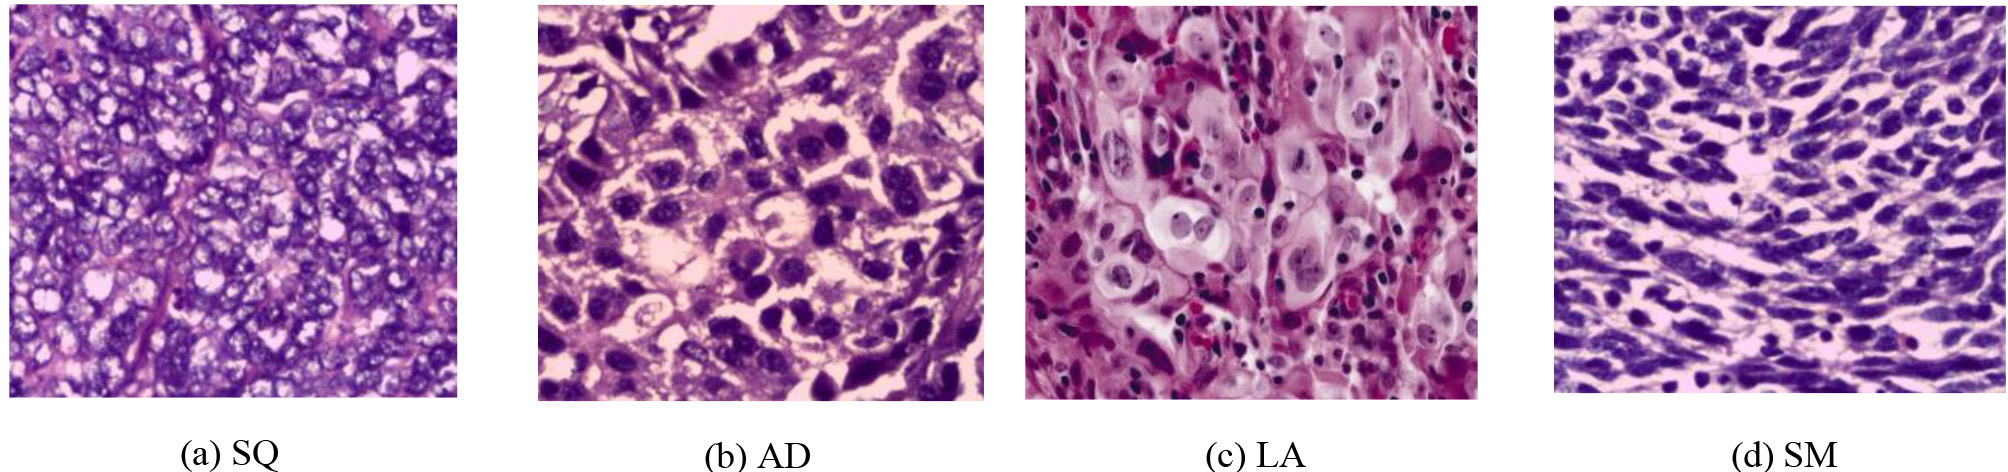
3.1.1Squamous cell carcinoma
Figure 1a shows SQ, which makes up about 40%
3.1.2Adenocarcinoma
Figure 1b shows AD, which accounts for 25% of lung cancer carcinoma. Unlike SQ, AD is more likely to occur in women and non-smokers. AD is originated in the bronchial epithelium. Its incidence is lower than those of squamous carcinoma and undifferentiated carcinoma, and its onset age is relatively low [17].
3.1.3Large cell carcinoma
Also known as large cell anaplastic carcinoma, LA is shown in Fig. 1c. It is a carcinoma that has no morphological features. The cancer cell is large and has polymorphism. Clinically rare, it accounts for about 1% of all lung cancer cases. LA commonly occurs in the upper lobe, and has a larger volume and clear boundaries. It has a high degree of malignancy, and a poor treatment effect and prognosis [18].
3.1.4Small cell carcinoma
In Fig. 1d, it can be seen that the small, undifferentiated cells in an SM type of lung carcinoma are the most malignant. Most patients are already in advanced metastasis when their carcinoma is found. There currence rate is high. SM accounts for almost 20% of all lung carcinoma [19].
3.2The optimal 2D sections
The 2D sections of musculoskeletal and viscera lung tissuesshown in Figs 2–4 were obtained by different numbers of clusters and the optimal segmentation identified by the f-FCM algorithm. Figures 2–4 clearly show that 2D segmentations under different numbers of clusters have various spatial resolutions, and that there is an optimal image for each type of tissue. These optimal images correspond to different numbers of clusters.
Figure 2.
CT image of musculoskeletal tissues in different number of clusters.
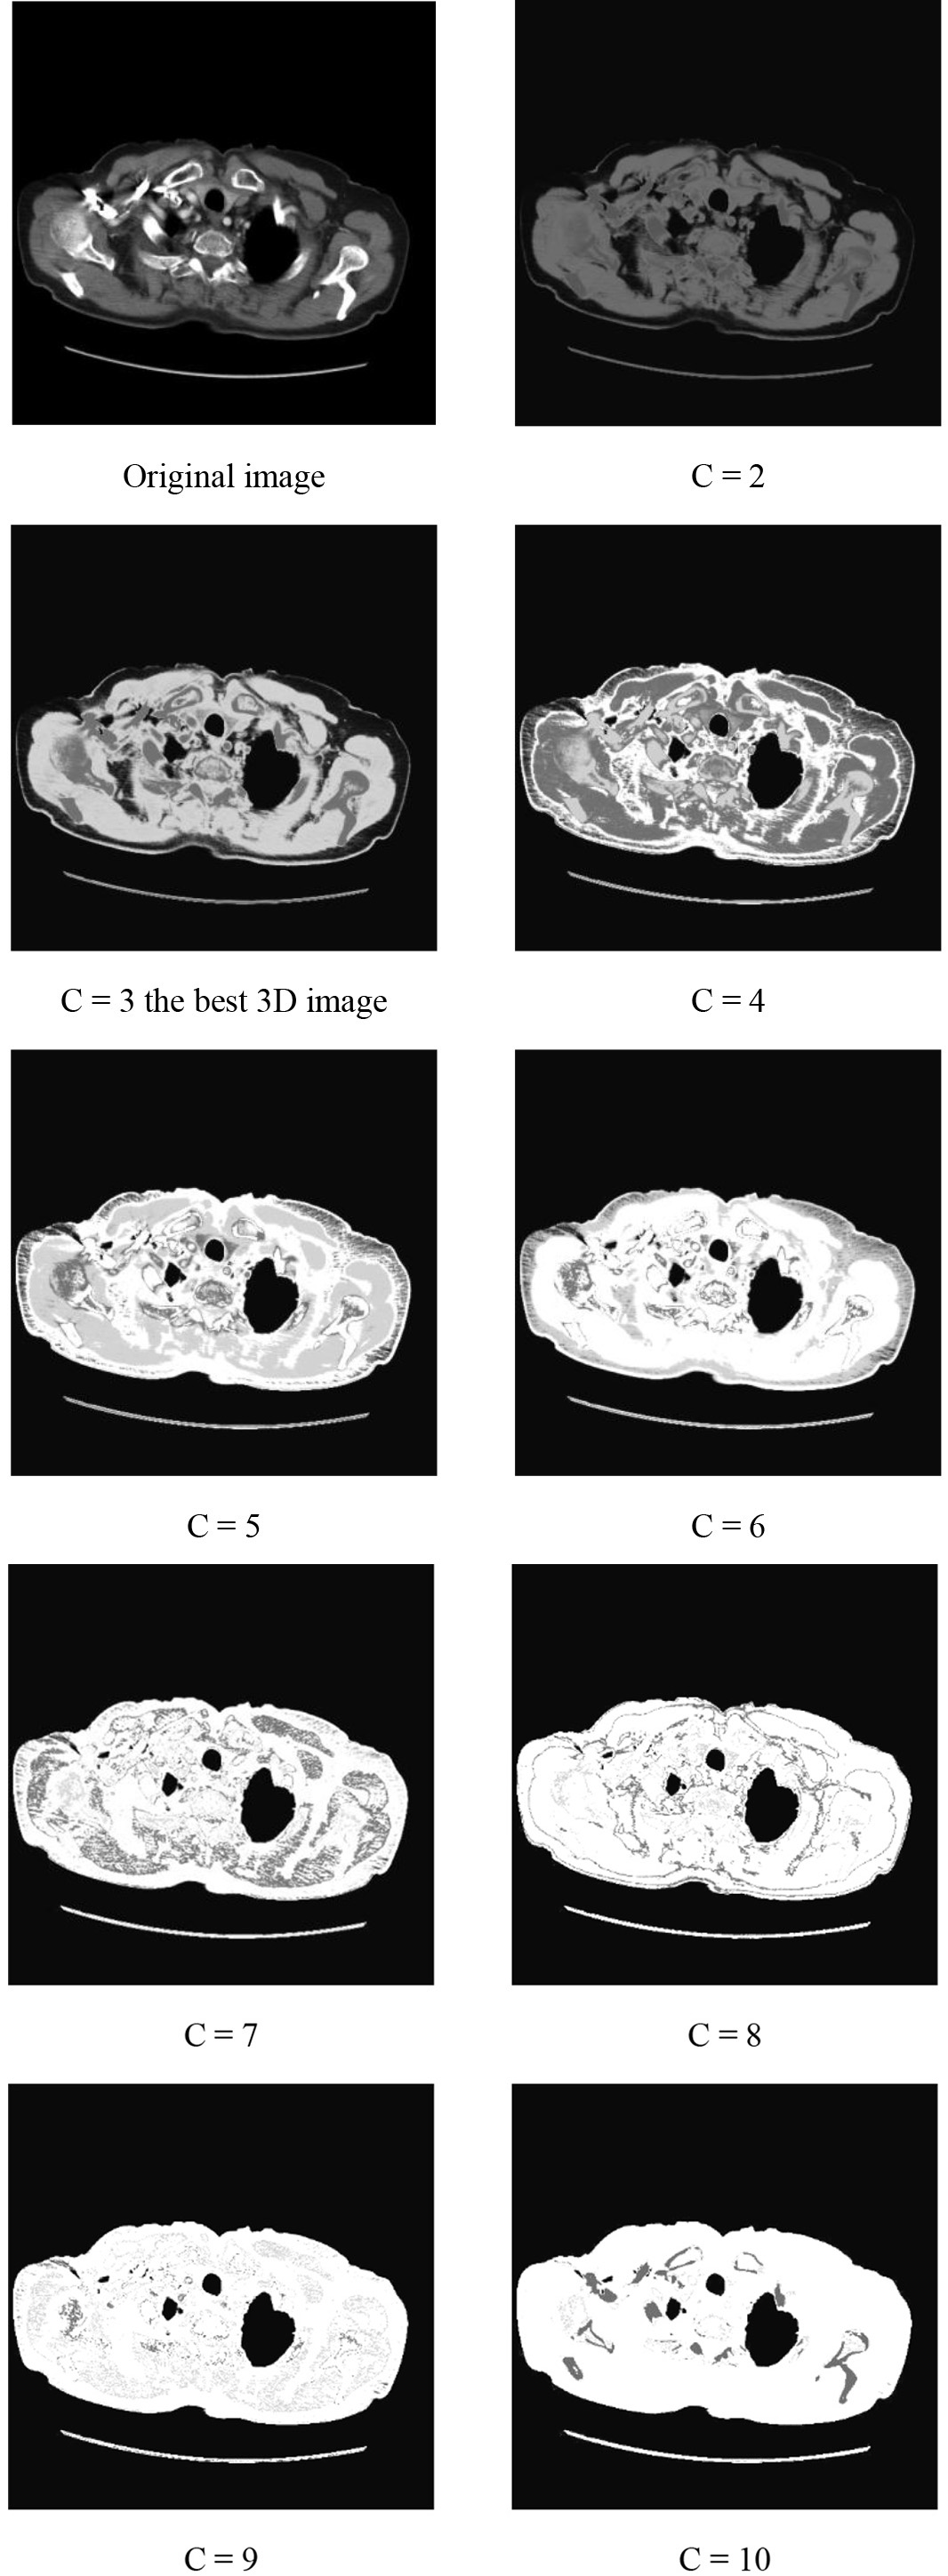
Figure 3.
CT image of Viscera tissues in different number of clusters.
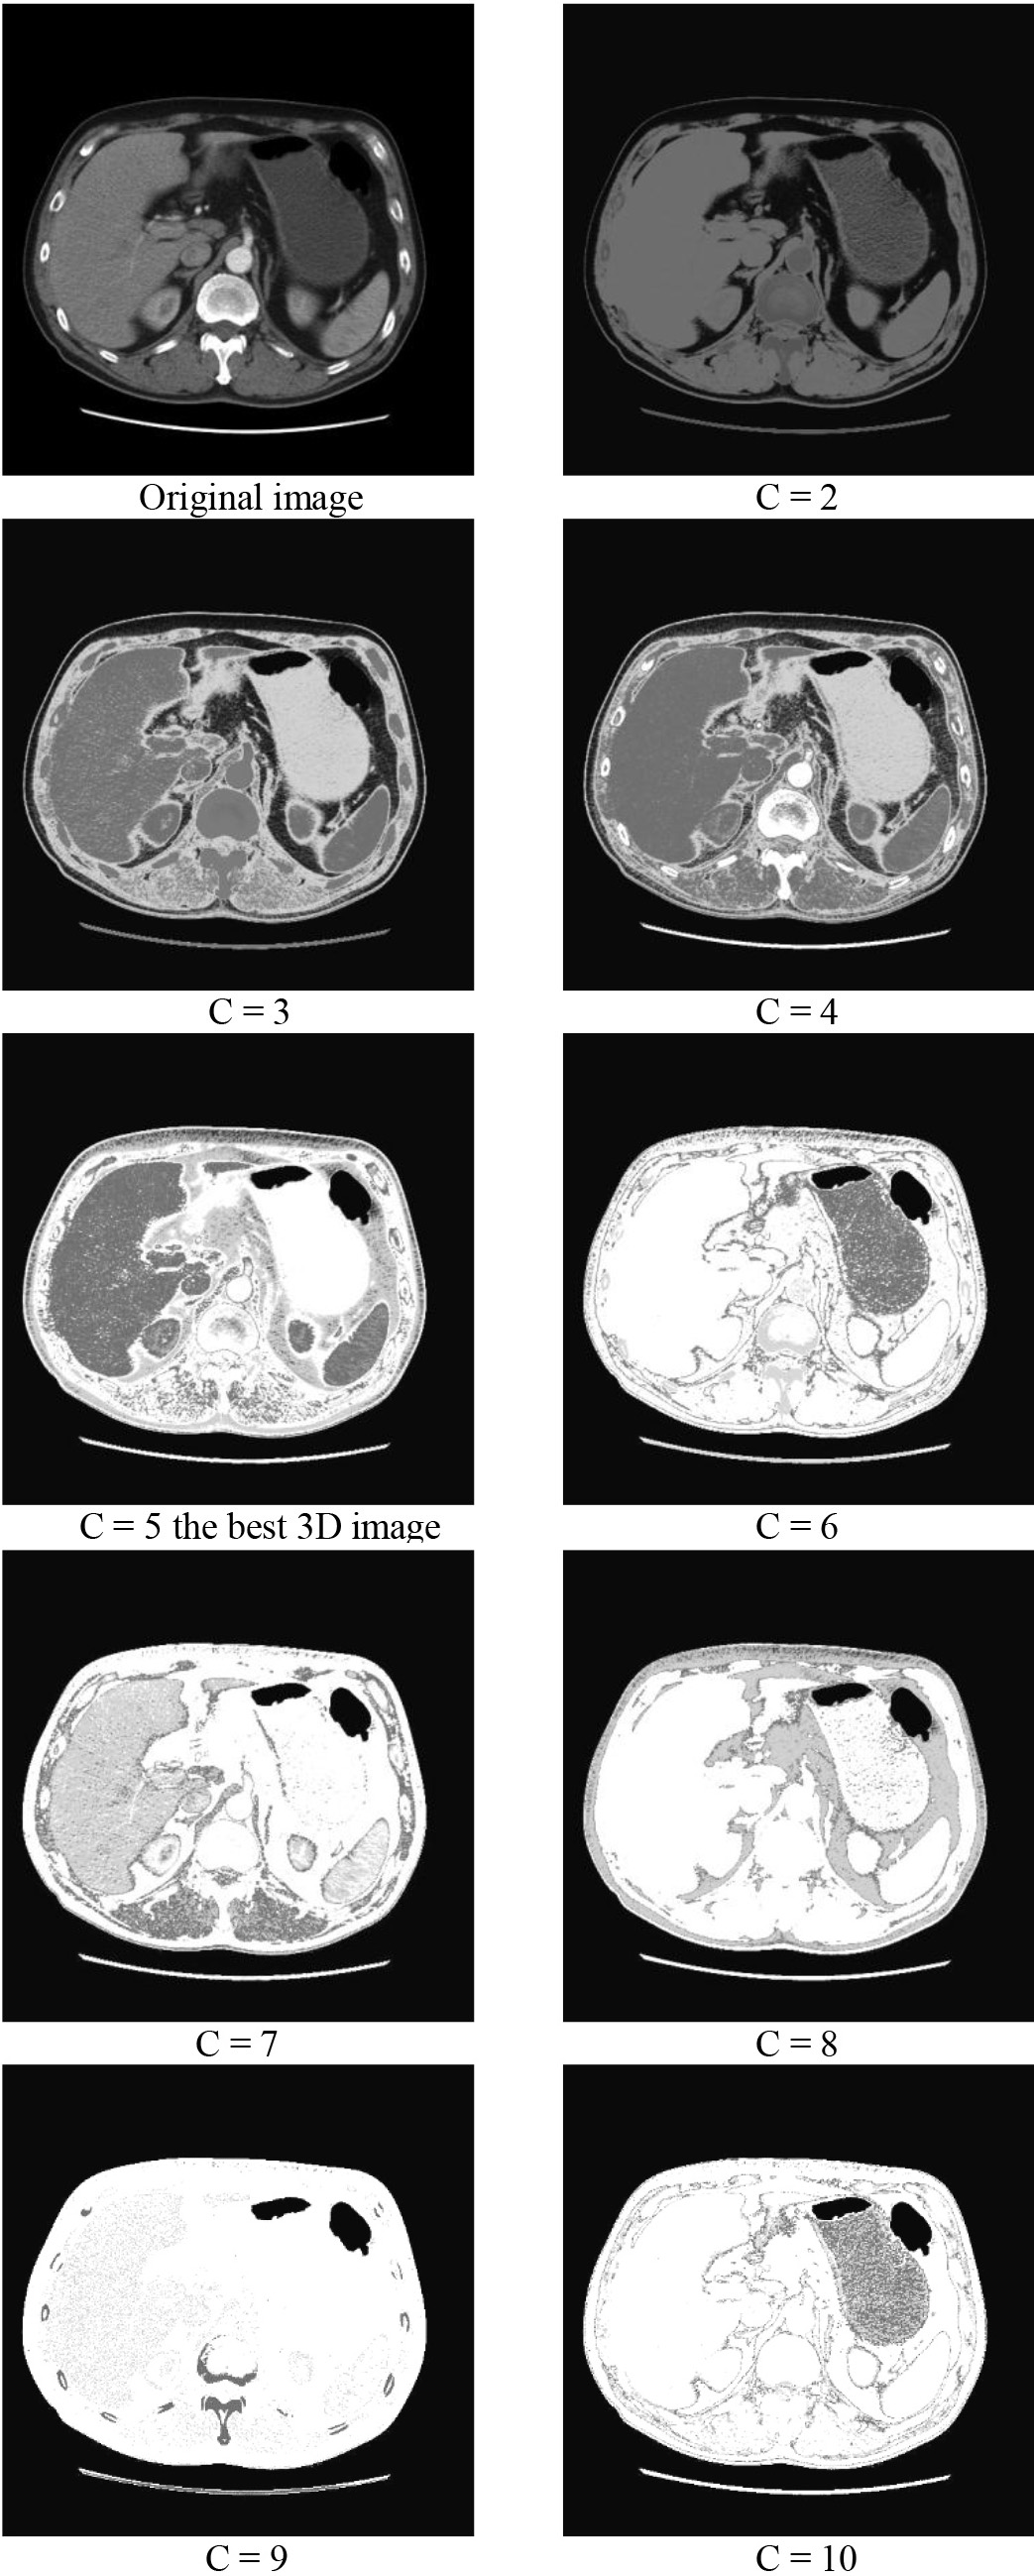
Figure 4.
CT image of Lung tissue in different number of clusters.
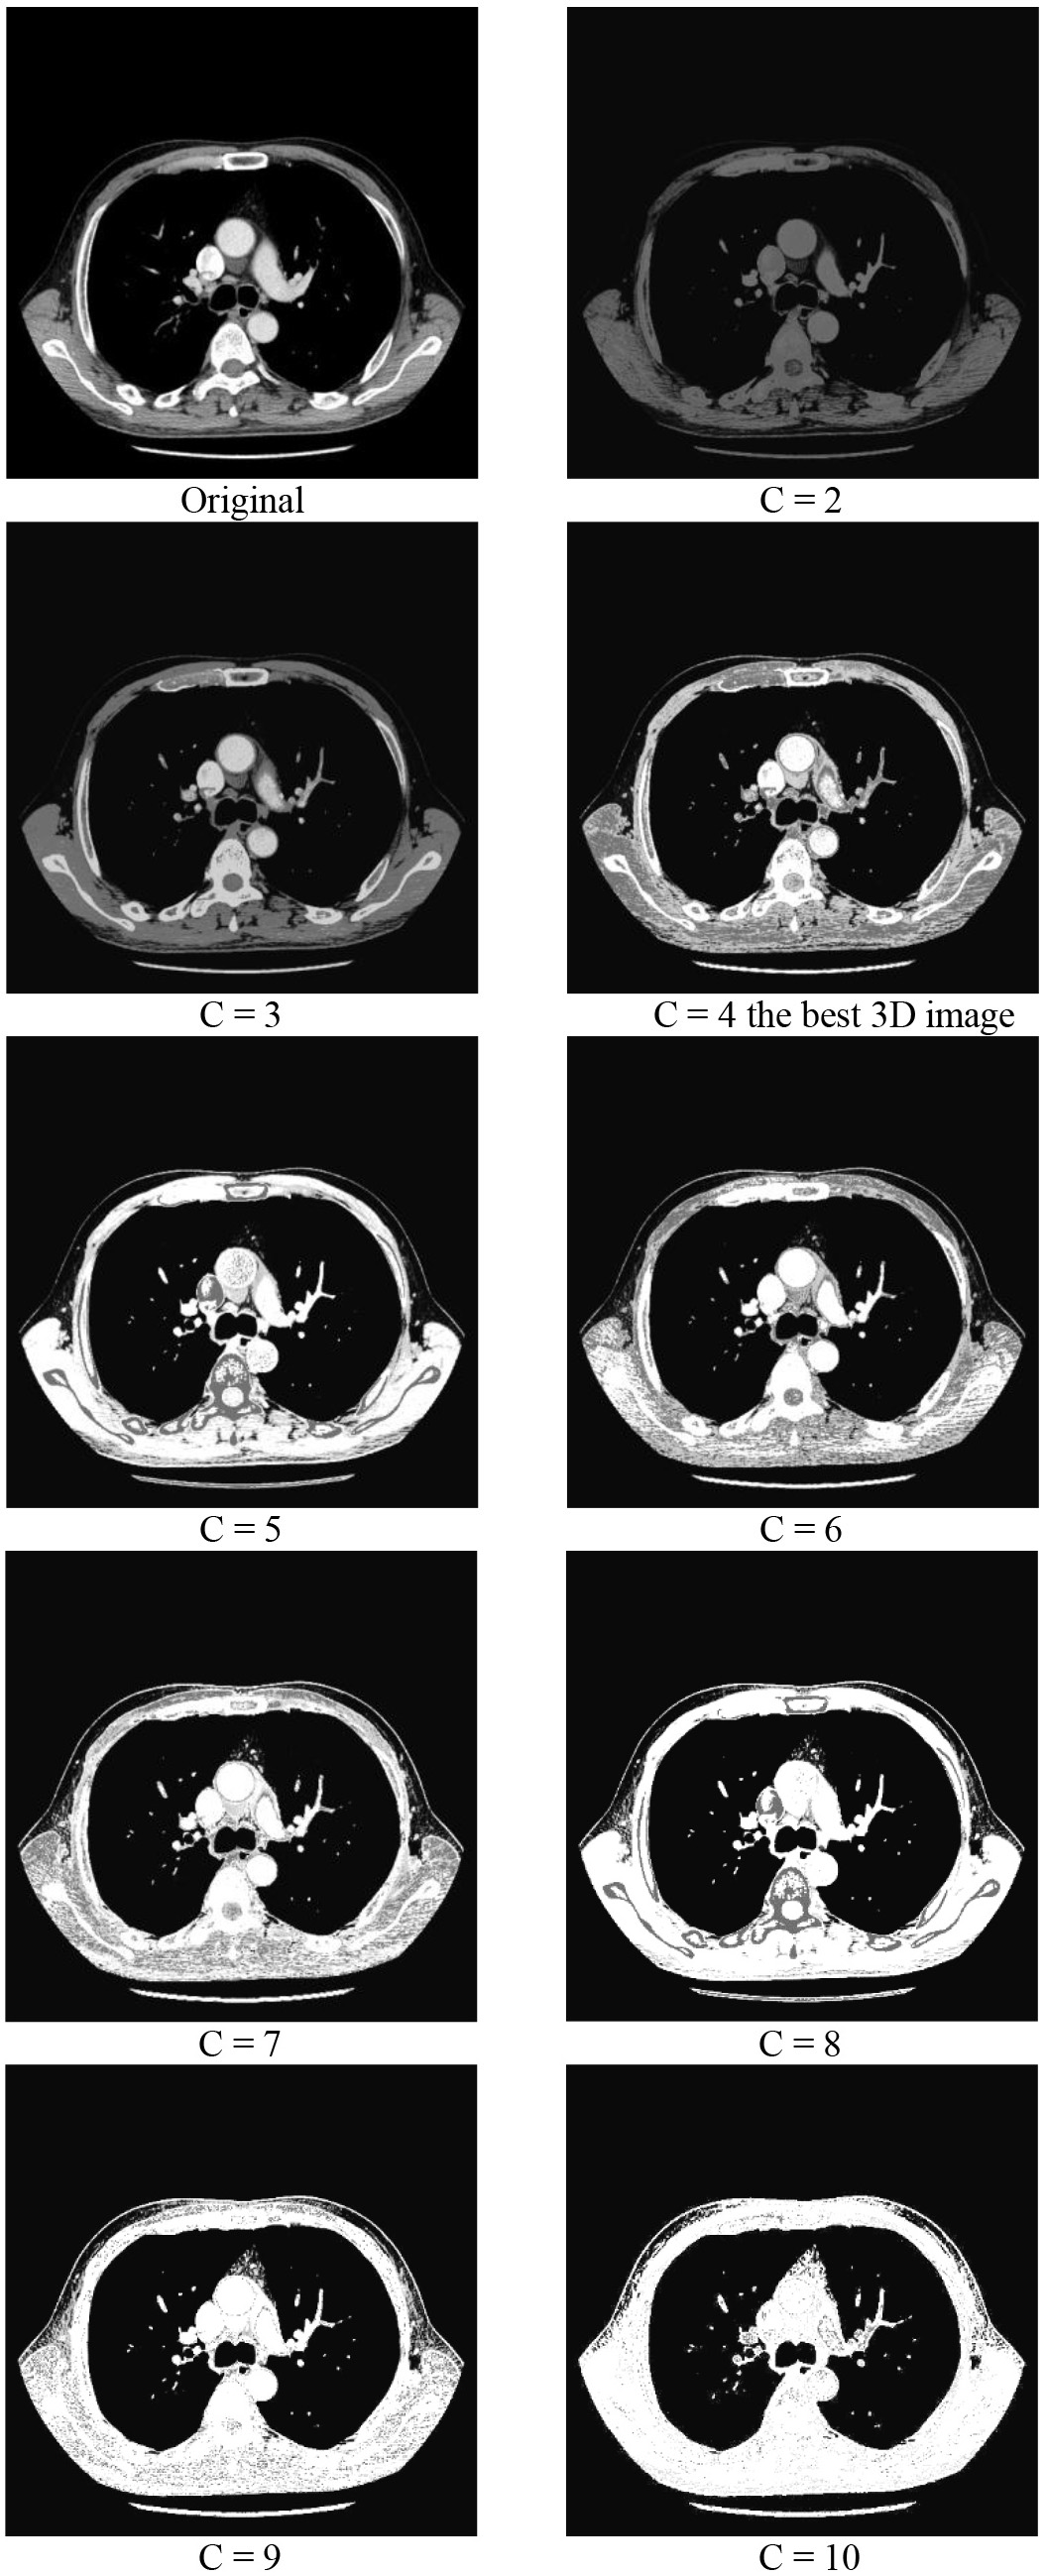
Figure 5 shows the selection process of 2D optimal sections for four typical lung cancer tissues by the PE index function; Fig. 6 refers to the Xie-Beni index. The index function has obvious most value from the figure, the best image is inconsistent to the optimal value of the validity index by the Xie-Bine index and has a small different by the PE index. This further demonstrates that we can distinguish the optimal 2D image from a series of candidate images by using the proper validity indexes.
Figure 5.
Selection of the optimal 2D section for musculoskeletal tissues using PE index function in the OP-3D-XCT method.
Figure 6.
Selection of the optimal 2D section for viscera tissues usingXie-Beni index function in the OP-3D-XCT method.
Figures 2 through 4 show that different numbers of clusters for different 2D images correspond to fuzzy partitions of differing quality. Cluster validity indexes can identify the optimal number of clusters, and thus can provide the basis for the reconstruction of higher quality 3D images.
3.3The reconstructed 3D image
Figure 7 shows the reconstructed 3D image by the OP-3D-XCT method, clearly representing the structure of a human chest. Additionally, the shape distribution of the four types of typical lung cancer and the difference between surrounding tissues can be accurately observed. For comparison, the reconstructed images of the four types of typical lung cancer by direct use of 3D volume reconstruction without optimized 2D sections are shown in Fig. 8. These 3D images contain many irrelevant tissues and trail, so the region of interest cannot be observed clearly. Consequently, the reconstructed 3D images are not optimal images.
Figure 7.
Reconstructed 3D images of four types of typical lung cancer by OP-3D-XCT.
3.4Evaluation of the proposed method
The proposed method was evaluated in terms of time resolution and spatial resolution. The time resolution was evaluated by the absolute runtime of a frame of a 3D image; the runtime was measured by the “tic” and “toc” functions in the Matlab toolbox. The spatial resolution can be evaluated by the relative error of all
(7)
where
To obtain the real gray values of all pixels, the anatomic parts were measured and recorded in the process of operating on the patient. However, only partial tissues could be observed; therefore, the comparison was performed on these observable tissues that correspond to partial pixels in each section.
Table 2 shows that the OP-3D-XCT method can improve time resolution and speed up the 3D reconstruction process by more than an order of magnitude. Please note that the computational complexity of f-FCM is independent of the number of clusters and is only related to the 256 gray levels. By comparison, the runtime of the FCM algorithm is directly proportional to the number of pixels; the more pixels the segmented images have, the longer the runtime of the segmenting process.
Table 2
Time resolution between FCM and
| C | C | C | C | |
|---|---|---|---|---|
| FCM | 3.57 s | 6.38 s | 15.7 s | 19.3 s |
| 0.74 s | 0.74 s | 0.74 s | 0.74 s |
Table 3
Spatial resolution of optimal and non-optimal methods
| SQ | AD | LA | SM | |
|---|---|---|---|---|
| Optimal method | 0.811 | 0.837 | 0.732 | 0.663 |
| Non-optimal method | 0.797 | 0.823 | 0.725 | 0.654 |
Figure 8.
Reconstructed 3D images of four types of typical lung cancer by the direct use of 3D volume reconstruction algorithms without optimal 2D possessing.
Table 3 shows that the OP-3D-XCT method can improve the spatial resolution, and offers advantages over the existing non-optimal method in four common types of lung cancer tissues. The average spatial resolution can be raised by an increment of over 8.6%.
4.Conclusion
This study reports a new 3D reconstruction method based on two different reformulations.
(1) Several cluster validity indexes based on fuzzy clustering were used to partition an XCT image. These indexes can provide the optimal segmentations of each 2D image section.
(2) A fast-FCM algorithm, instead of the existing FCM algorithm, was applied to speed up the 2D image segmenting process. The runtime of the 3D reconstruction process can be reduced by at least an order of magnitude.
Full experimental analysis of the visually observed lung cancer tissues demonstrates that the proposed method offers advantages over existing methods. These research results can be a basis of further research on 3D reconstruction, and can introduce certain practical experiences and techniques for future medical imaging research. While the results are promising, the validity indexes need further evaluation and development to obtain more robust 3D reconstruction results.
Conflict of interest
None to report.
Acknowledgments
This work was supported by the National Science Foundation of China under Grant No. 61774014, 60772080 and the National Program of International S&T Cooperation (2013DFA11040).
References
[1] | Beltran MA, Paganin DM, Siu KK, et al., Interface-specific x-ray phase retrieval tomography of complex biological organs. Physics in Medicine and Biology. (2011) : 56: (23): 7353-7369. |
[2] | Davison CA, Chapman SE, Sasser TA, et al., Multimodal Optical, X-Ray CT, and SPECT Imaging of a Mouse Model of Breast Cancer Lung Metastasis. Current Molecular Medicine. (2013) : 13: (3): 368-376. |
[3] | Frerichs I, Hinz J, Herrmann P, et al., Detection of local lung air content by electrical impedance tomography compared with electron beam CT. Journal of Applied Physiology. (2002) : 93: (2): 660-666. |
[4] | Zhao YZ, Brun E, Coan P, et al., High-resolution, low-dose phase contrast X-ray tomography for 3D diagnosis of human breast cancers. Proceedings of the National Academy of Sciences of the United States of America. (2012) : 109: (45): 18290-18294. |
[5] | Rueth NM, Andrade RS. Is VATS lobectomy better: perioperatively, biologically and oncologically? Annals of Thoracic Surgery. (2010) : 89: (6): S2107-S2111. |
[6] | Thun MJ, Hannan LM, Adams-Campbell LL, et al., Lung Cancer Occurrence in Never-Smokers: An Analysis of 13 Cohorts and 22 Cancer Registry Studies. PLoS Medicine. (2008) : 5: (9): e185. |
[7] | Hamilton W, Peters TJ, Round A, Sharp D. What are the clinical features of lung cancer before the diagnosis is made? A population based case-control study. Thorax (BMJ Publishing Group). (2005) .12: 60: (12): 1059-1065. |
[8] | Thun MJ, Henley SJ, Burns D, et al., Lung cancer death rates in life long nonsmokers. J. Natl Cancer Inst. (2006) : 98: : p691.. |
[9] | Sun S, Schiller J, Gazdar AF. Lung cancer in never-smokers: A different disease. Nat Rev Cancer. (2007) : 7: : p778-90.. |
[10] | Valavanidis A, Fiotakis K, Vlachogianni T. Airborne particulate matter and human health: toxicological assessment and importance of size and composition of particles for oxidative damage and carcinogenic mechanisms. J Environ Sci Health C Environ Carcinog Ecotoxicol Rev. (2008) ; Oct-Dec: 26: (4): 339-62. |
[11] | Morandi U, Casali C, Rossi G. Bronchial typical carcinoid tumors. Seminars in Thoracic and Cardiovascular Surgery. (2006) : 18: (3): 191-198. |
[12] | Aviel-Ronen S, Blackhall FH, Shepherd FA, Tsao MS. K-ras mutations in non-small-cell lung carcinoma: a review. Clinical Lung Cancer (Cancer Information Group). (2006) .7: 8: (1): 30-38. |
[13] | Son JW, Kang HK, Chae MH, et al., Polymorphisms in the caspase-8 gene and the risk of lung cancer. Cancer Genetics and Cytogenetics. (2006) .9: 169: (2): 121-127. |
[14] | Xu R, Wunsch D. Survey of clustering algorithm. IEEE. Trans.Neural Network. (2005) : 16: (3): 645-678. |
[15] | Gao B, Wang J. Multi-Objective Fuzzy Clustering for Synthetic Aperture Radar Imagery. IEEE Geoscience and Remote Sensing Letters. (2015) : (11): 2341-2345. |
[16] | Ferrell B, Koczywas M, Grannis F, Harrington A. Palliative care in lung cancer. Surgical Clinics of North America. (2011) : 91: (2): 403-417. |
[17] | Fuld AD, Dragnev KH, Rigas JR. Pemetrexed in advanced non-small-cell lung cancer. Expert Opin Pharmacother. (2010) : 11: (8): 1387-402. |
[18] | Kelley AS, Meier DE. Palliative care – a shifting paradigm. New England Journal of Medicine. (2010) : 363: (8): 781-2. |
[19] | Jemal A, Tiwari RC, Murray T, Ghafoor A, Samuels A, Ward El, Feuer EJ, Thun M. Cancer statistics. CA Cancer J Clin. (2004) : 54: (1): p8-29.. |
[20] | Proctor RN. The history of the discovery of the cigarette-lung cancer link: evidentiary traditions, corporate denial, global toll. Tobacco Control. (2012) : 21: (2): 87-91. |


