
A novel lung cancer detection algorithm for CADs based on SSP and Level Set
Abstract
The fuzzy degree of lung nodule boundary is the most important cue to judge the lung cancer in CT images. Based on this feature, the paper proposes a novel lung cancer detection method for CT images based on the super-pixels and the level set segmentation methods. In the proposed methods, the super-pixels method is used to segment the lung region and the suspected lung cancer lesion region in the CT image. The super-pixels method and a level set method are used to segment the suspected lung cancer lesion region simultaneously. Finally, the cancer is determined by the difference between results of the two segmentation methods. Experimental results show that the proposed algorithm has a high accuracy for lung cancer detection in CT images. For gross glass nodule, pleural nodule, the vascular nodules and solitary nodules, the sensitivity of the detection algorithm are respectively 91.3%, 96.3%, 80.9% and 82.3%.
1.Introduction
Lung cancer has become the most lethal threat to human health, which mainly caused by smoking and air pollution, and has taken 1.6 million people lives [1]. Lung cancer is remediable at the early stage which only occupies less than 25% of the total diagnosed cases. Most of patients have incurable locally advanced or metastatic disease, their 5-year survival approximates one fourteenth of the early stage ones [2]. Thus, early pulmonary malignant nodule detection is crucial for prolonging the patient life even than recovery.
Computed Tomography (CT) is a significant diagnostic method for detecting the early pulmonary malignant nodule. It has good sensitivity and signal to noise ratio to reduce the rate of misdiagnosis. All the slices of a CT scan have to be checked and screened to detect the nodules, and radiologists label the findings as benign or as a malignant candidate. The repeating manual work expands the finite attention and puts a constant pressure on them to analyze mass data and decide immediately based on the analysis.
Many Computer-Aided Diagnosis systems (CADs) are designed and implemented to reduce the burden faced to the radiologists. The general detecting process of CADs is divided into three steps: 1) segmenting the lung region from the chest CT image; 2) detecting the suspected lesions in the lung region; 3) diagnosing the detected lesions using our algorithm.
We can simply group the existing approaches for accurate lung region and small lesions segmentation into three categories: threshold based methods, model based methods, and supervised voxel classification methods. In the above methods, the multilevel threshold based approaches [2, 3, 4, 5, 16, 17, 18, 19, 20] usually get better performances than active contour algorithm [6] and supervised voxel classification methods [7]. Equally, it has an obvious disadvantage for segmenting the fuzzy lesion which tends to be the probable modality of malignant nodule such as GGO (Ground Glass Opacity). The problem as the important task of the early indeterminate nodules detection attracts the attentions from global researcher during the last two decades.
An optimal threshold approach is firstly proposed for lung segmentation by Hu et al. [8] in 2001. Tseng and Huang [9] propose an adaptive threshold based three-stages framework for Automatic Lung Segmentation. Elbaz et al. [10] base on the framework, and add the average filter to get the better performance. Armato and Sensakovic [11] tracks the boundary to segment lung profiles. Otsu is utilized to automatically segment pulmonary parenchyma in [12]. The work segments parts of the lung, but the erosion operation which is used to fill to holes in the lung image always loss image information.
Pulmonary nodules can be broadly divided into two categories [15]: Solid Pulmonary Nodule (SPN) and GGO. Many methods for the lung parenchyma and pulmonary nodules detection have been studied, such as threshold rule based conversion methods [16, 17, 18, 19, 20], morphology algorithm [21], genetic algorithm, model based methods [22, 23, 24], classifier based methods [25] and the enhanced filtering methods [26, 27, 28]. Li et al. use an improved CV Level-Set algorithm for segmenting lung nodules based on SVM (support vector machine) classifier [25]. Wang et al. [20] adopt a Level-Set model to extract the lung nodule based on assuming the shape of the pulmonary nodules as sphere-like contour regions. Stember [27] proves lots of pulmonary nodules are not approximately regular, for instance sphere-like.
In summary, the accuracy of CADs is limited by the results of lung region segmentation and pulmonary nodules detection. We pour our attention to solving the above problems, and our contributions consist of two following viewpoints:
(1) We utilize SSP (SLIC Super-pixels) method to segmenting lung region from the chest CT image. Comparing with the existing methods for lung region, the more pulmonary parenchyma is reserved to ensure the information integrity of all the suspected nodules.
(2) The fuzzy degree of the indeterminate pulmonary nodules is computed by using the ratio between the outer and inner boundary which is obtained from SSP and Level-Set.
We describe the related works of three steps respectively, and Section 2 introduces our data we used in the paper. Section 3 expounds the methods for segmenting lung region and diagnosing the benign or malignant pulmonary nodules. The experiment results of our approach are shown and discussed in Section 4. The final section summarized the conclusions.
2.Data
The experimental uses a set of lung CT image data provided by Shanghai Chest Hospital, which included 104 groups the lung CT images of the patients. The size of lung nodules in CT images is 3 mm to 50 mm, including solid nodule and GGO. The locations of the nodules are uncertain, some are independent, and some are close to the lung wall or other biological tissue.
3.Methods
3.1Lung region segmentation and suspected lesions detection
Lung region segmentation which is the most important stage for the overall system has a crucial influence on the subsequent stages. It uses to be an essential preprocessing to segment the pulmonary field from the chest CT [14].
SLIC (Simple Linear Iterative Clustering) super pixels is utilized to segment lung field considering the CT image-forming process in our proposed method. Figure 1 illustrate the result of SLIC which consists of many segmented super-pixels. We randomly select a slice of image (24
Figure 1.
The process of the pulmonary segmentation: (a) Result of the SLIC super-pixel for the pulmonary CT; (b) Result of SLIC super-pixel based pulmonary segmentation.
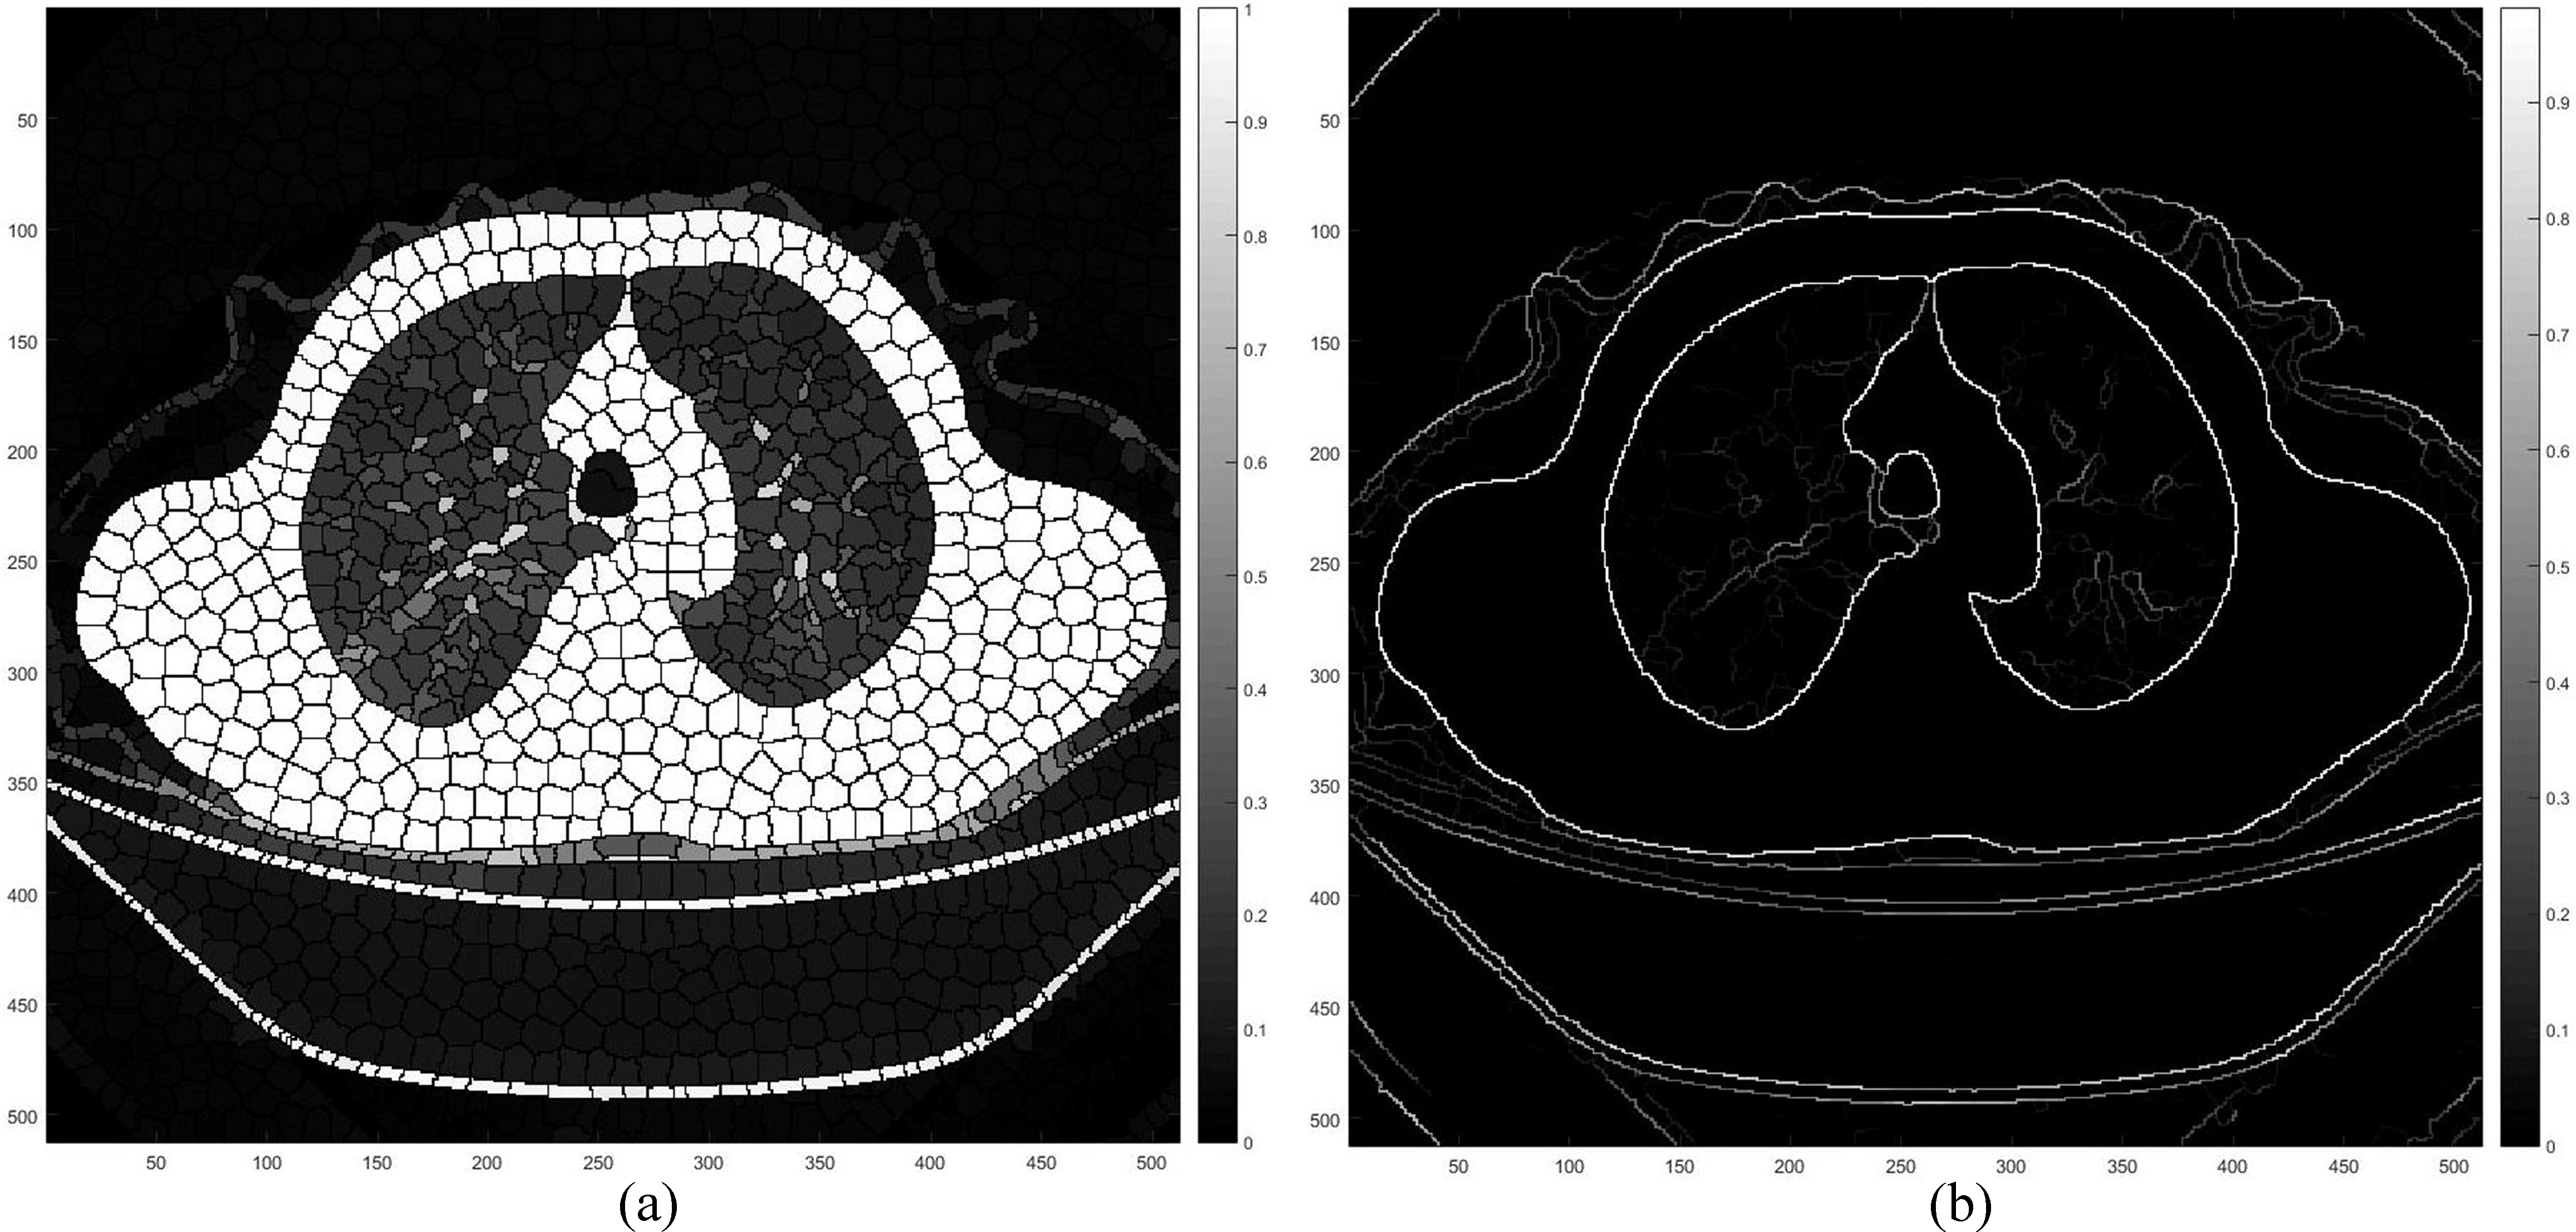
Figure 2.
The process of merging the SLIC super-pixels: (a) the labeled slice of the given CT image; (b) the cluster labels before merging; (c) the labels after merging; (d) and (e) the sketch for (b) and (c).
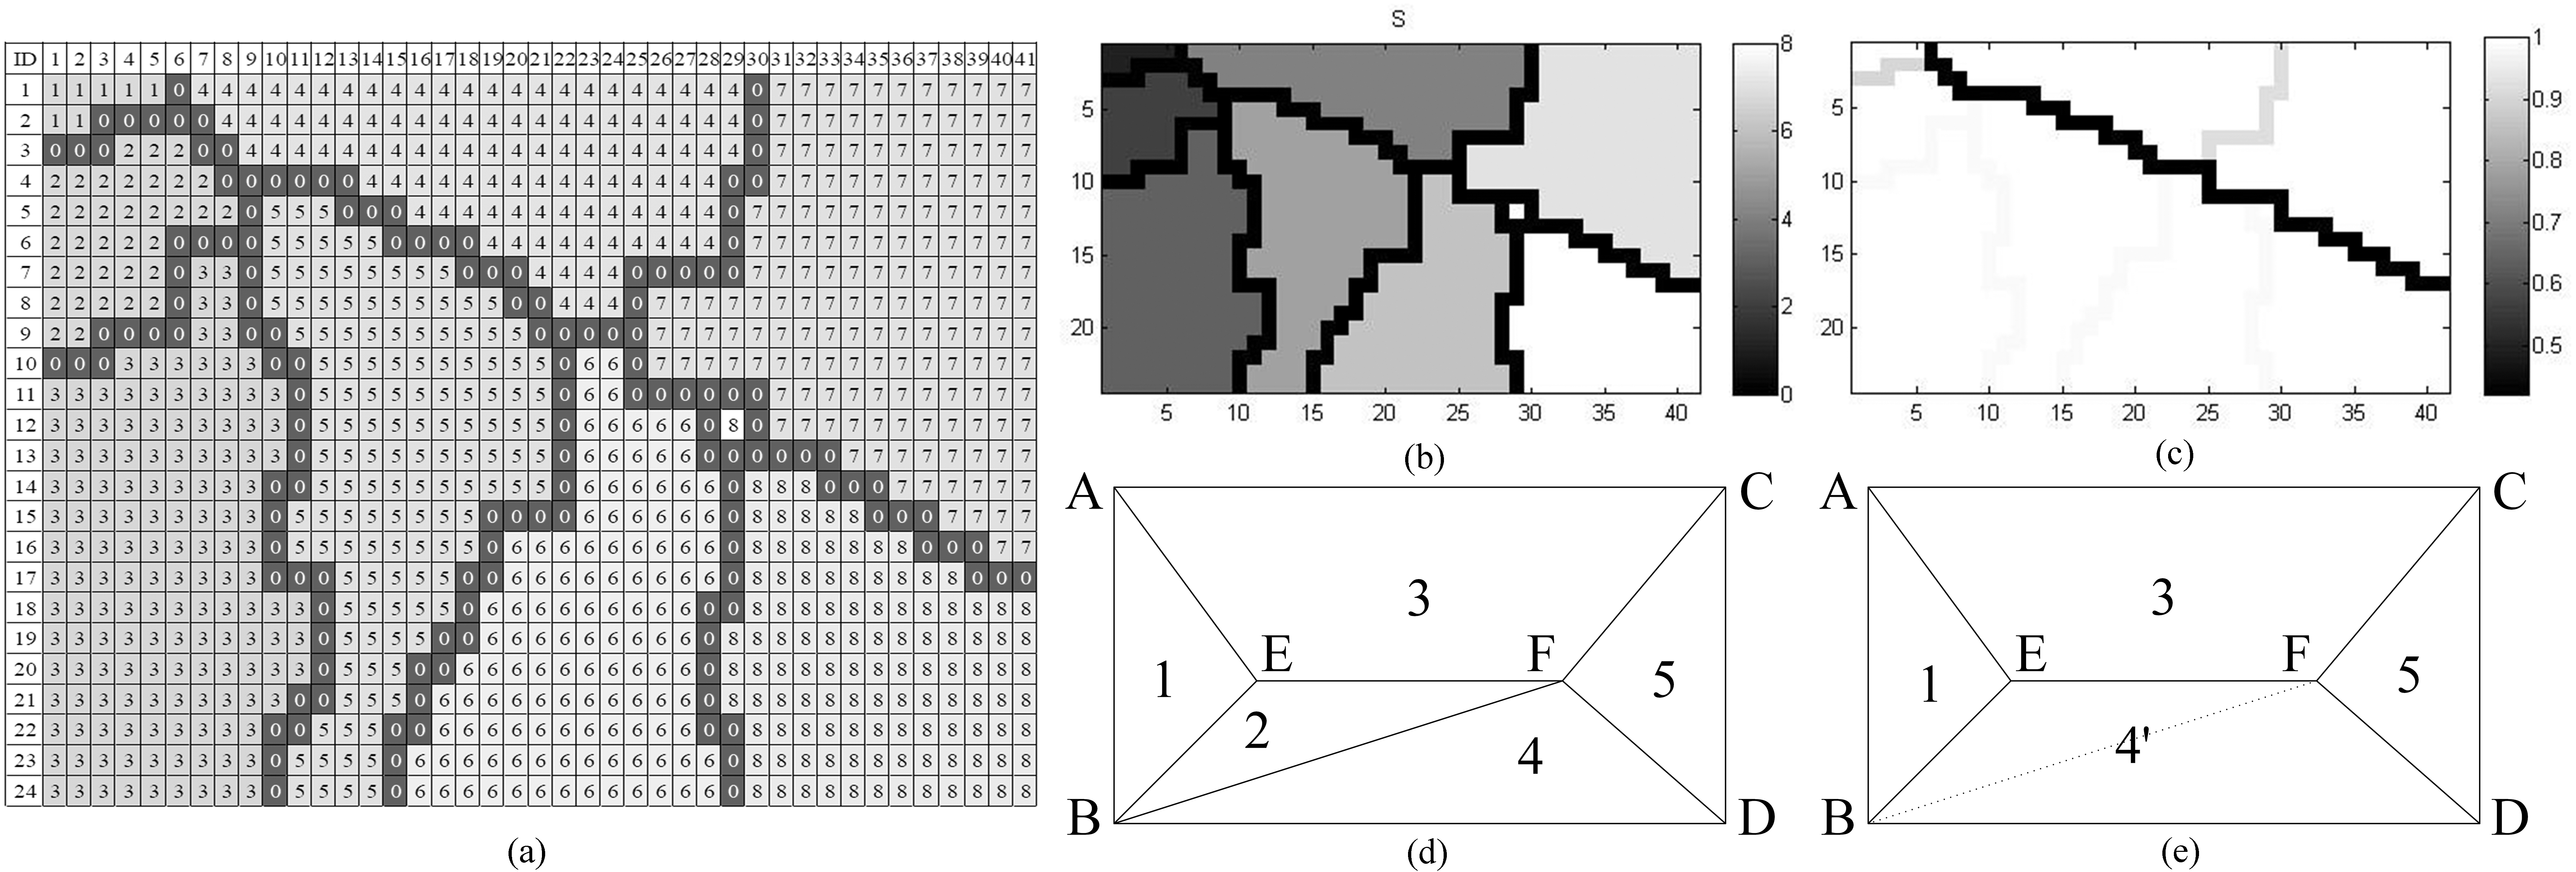
The cluster edges of the pixels between the super-pixels is labeled by number 0 (Red flag in Fig. 2a), and the other numbers of the pixels denote that it belongs to the respective super-pixels. For each pixel, it could be clustered with their neighbors which have the similar gray values. The similarity relationship of the super-pixels is calculated, and the result is formed as a similarity matrix. The matrix is utilized to decide whether or not merging the super-pixels into one by thresholding its elements. There is the strong possibility that the newborn curves of super-pixel will be the contour of the lung parenchyma, but sometimes the edge is a weak or even disconnection.
To overcoming this drawback, we introduce UCM (Ultra-metric Contour Map) to obtain the ground truth edges. An iterative procedure of merging super pixels, depicted in Fig. 2d and e, is to assist that all the super pixels merges its similar neighbor as much as possible. We employ energy function to define the strength of each curve. For any curve,
(1)
where
(2)
where
Figure 3.
The extension of the initial segmentation energy matrix.
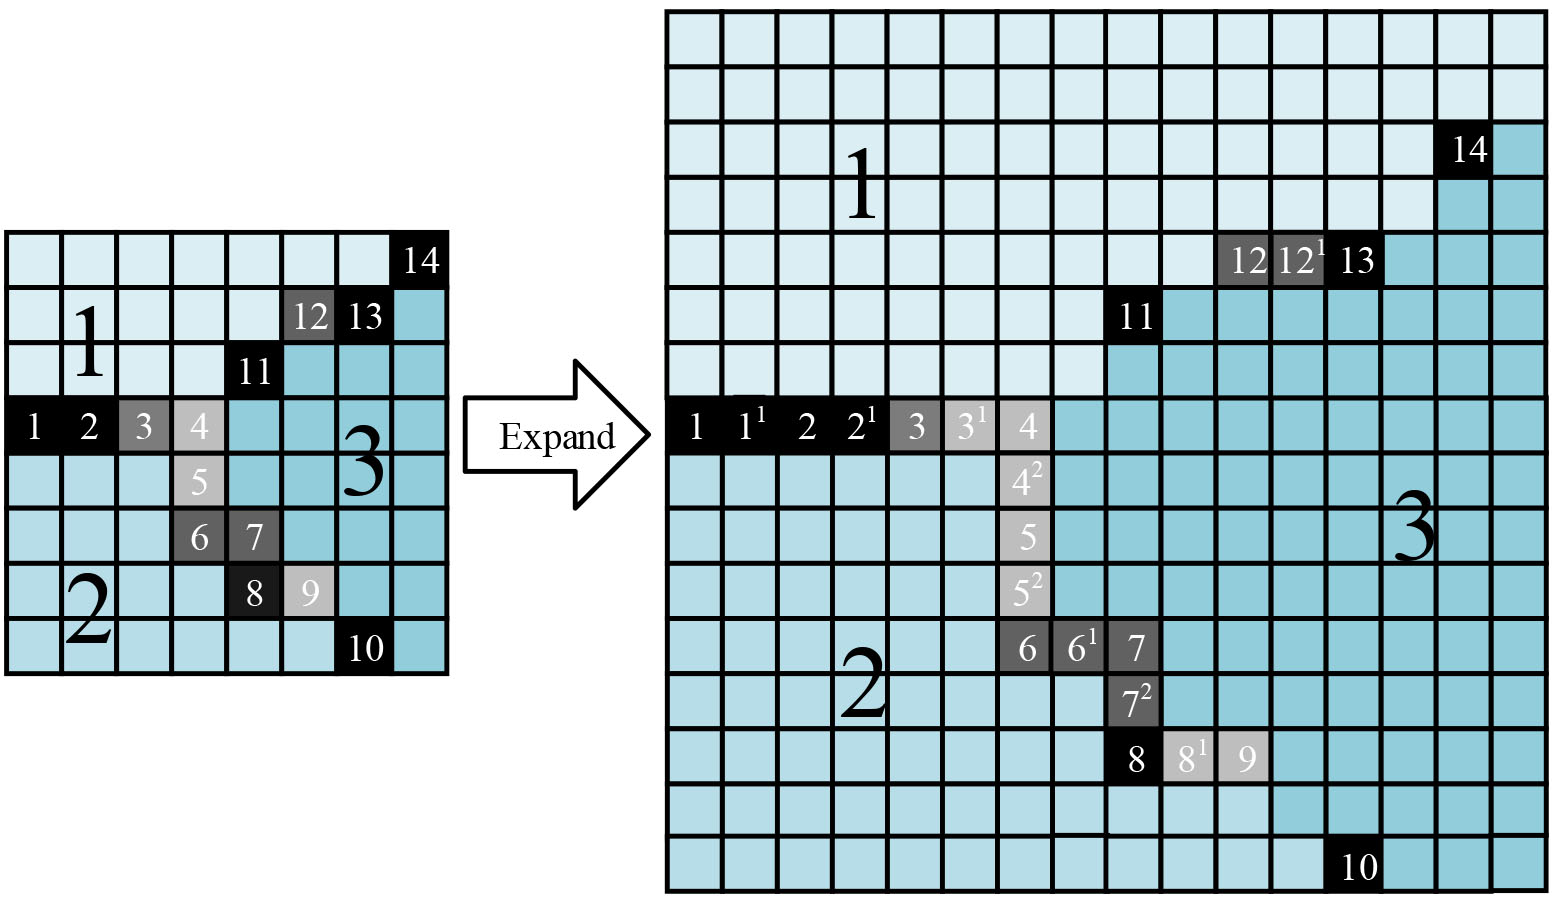
For each element of the initial matrix, the extension is defined by:
(3)
The initial UCM matrix is generated with size of the extended matrix
3.2Lung cancer diagnosis method
Inspired by the malignant nodule morphology, we utilize the characteristics of morphology in cancer forming and growing stage to detect the lung cancer. The first key point is to draw out the rapidly and disorderly changing shape of the growth part of the cancer from a fuzzy image. In this paper, a method is proposed using the level set (a interface tracking and shape modeling technique in medical image processing) and the super-pixels contour extraction, and the area ratio of the two to detect suspected nodular lesions is the third light spot.
The evolution of the dynamic profile with the level set [27] is shown in Fig. 5. Figure 5a illustrates the dynamic contour, and Fig. 5b shows the corresponding level set surface.
Figure 4.
The process of Level-Set method and its contour propagation.
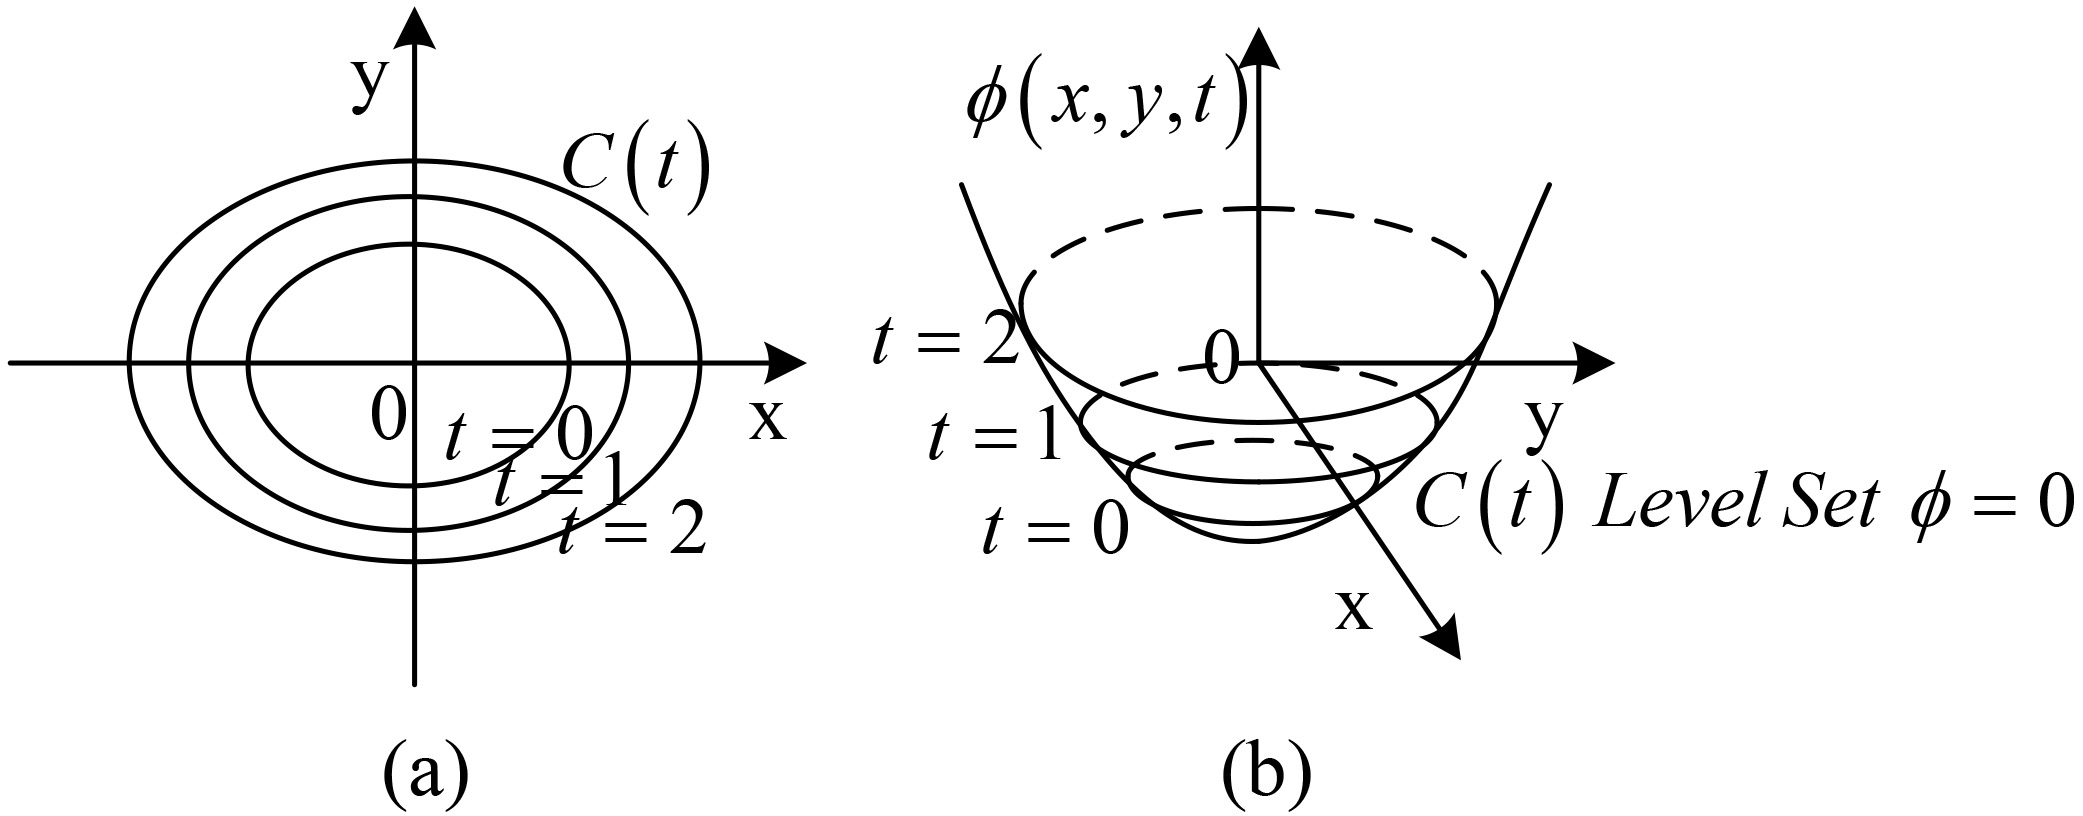
Figure 5.
The evolution of dynamic contour C in normal direction.
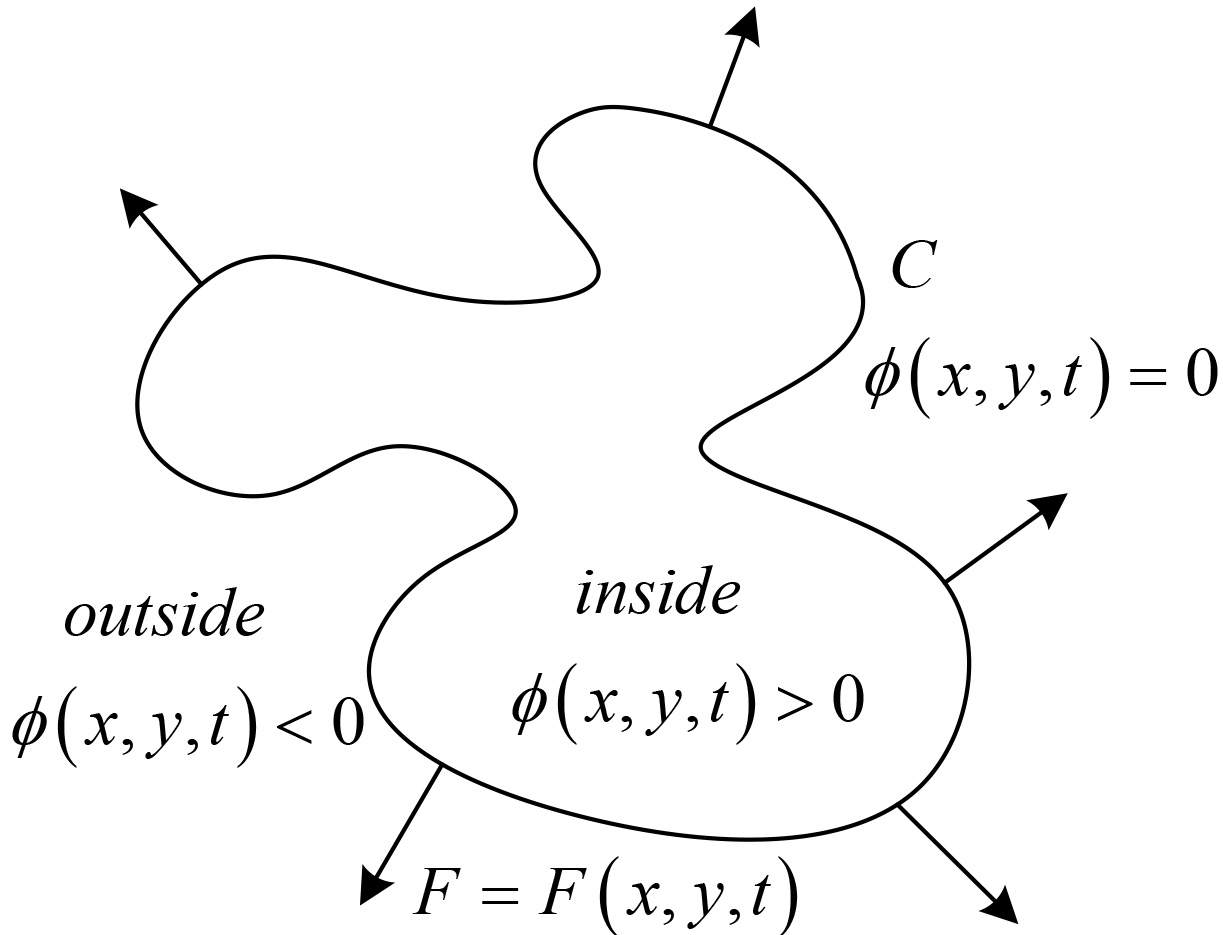
The procedure of image segmentation in level set method can be descripted as follow:
In level set methods, the zero-level of a Lipschitz function
(4)
The CV model, proposed by Chan & Vese, is an image segmentation model using the average value of the dynamic contour based on level set method [34] to generate energy function in Eq. (4), where
(5)
Figure 6 shows the visualization results of level set segmentation for a suspected lung cancer lesion in Section 3.1 and the level of each pixel in the segmentation results. The blue curve indicates the foreground contour, the change of the horizontal value around the foreground edge can be seen from the results. Around the contour, there is “well” or zone of a very small level vale between the foreground and background by the level set segmentation, which is a buffer representing a fuzzy part of the tissue and organ in the lung. So, in order to extract the buffer and extend foreground, the most important is getting the foreground contour according to the level set and getting the well area with low level values. But the depth of the well area are likely to be very thin or not even connected, so SLIC super pixel image segmentation algorithm in Section 3.1 is used to find out the correct contour. The third line of Fig. 6 show the extraction results, and as is shown, the extended foreground region is the fuzzy part correctly containing all the tissues and organs in the region of the suspected lung cancer.
Figure 6.
The segmentation result by using Level-Set (inner) and SSP (outer).
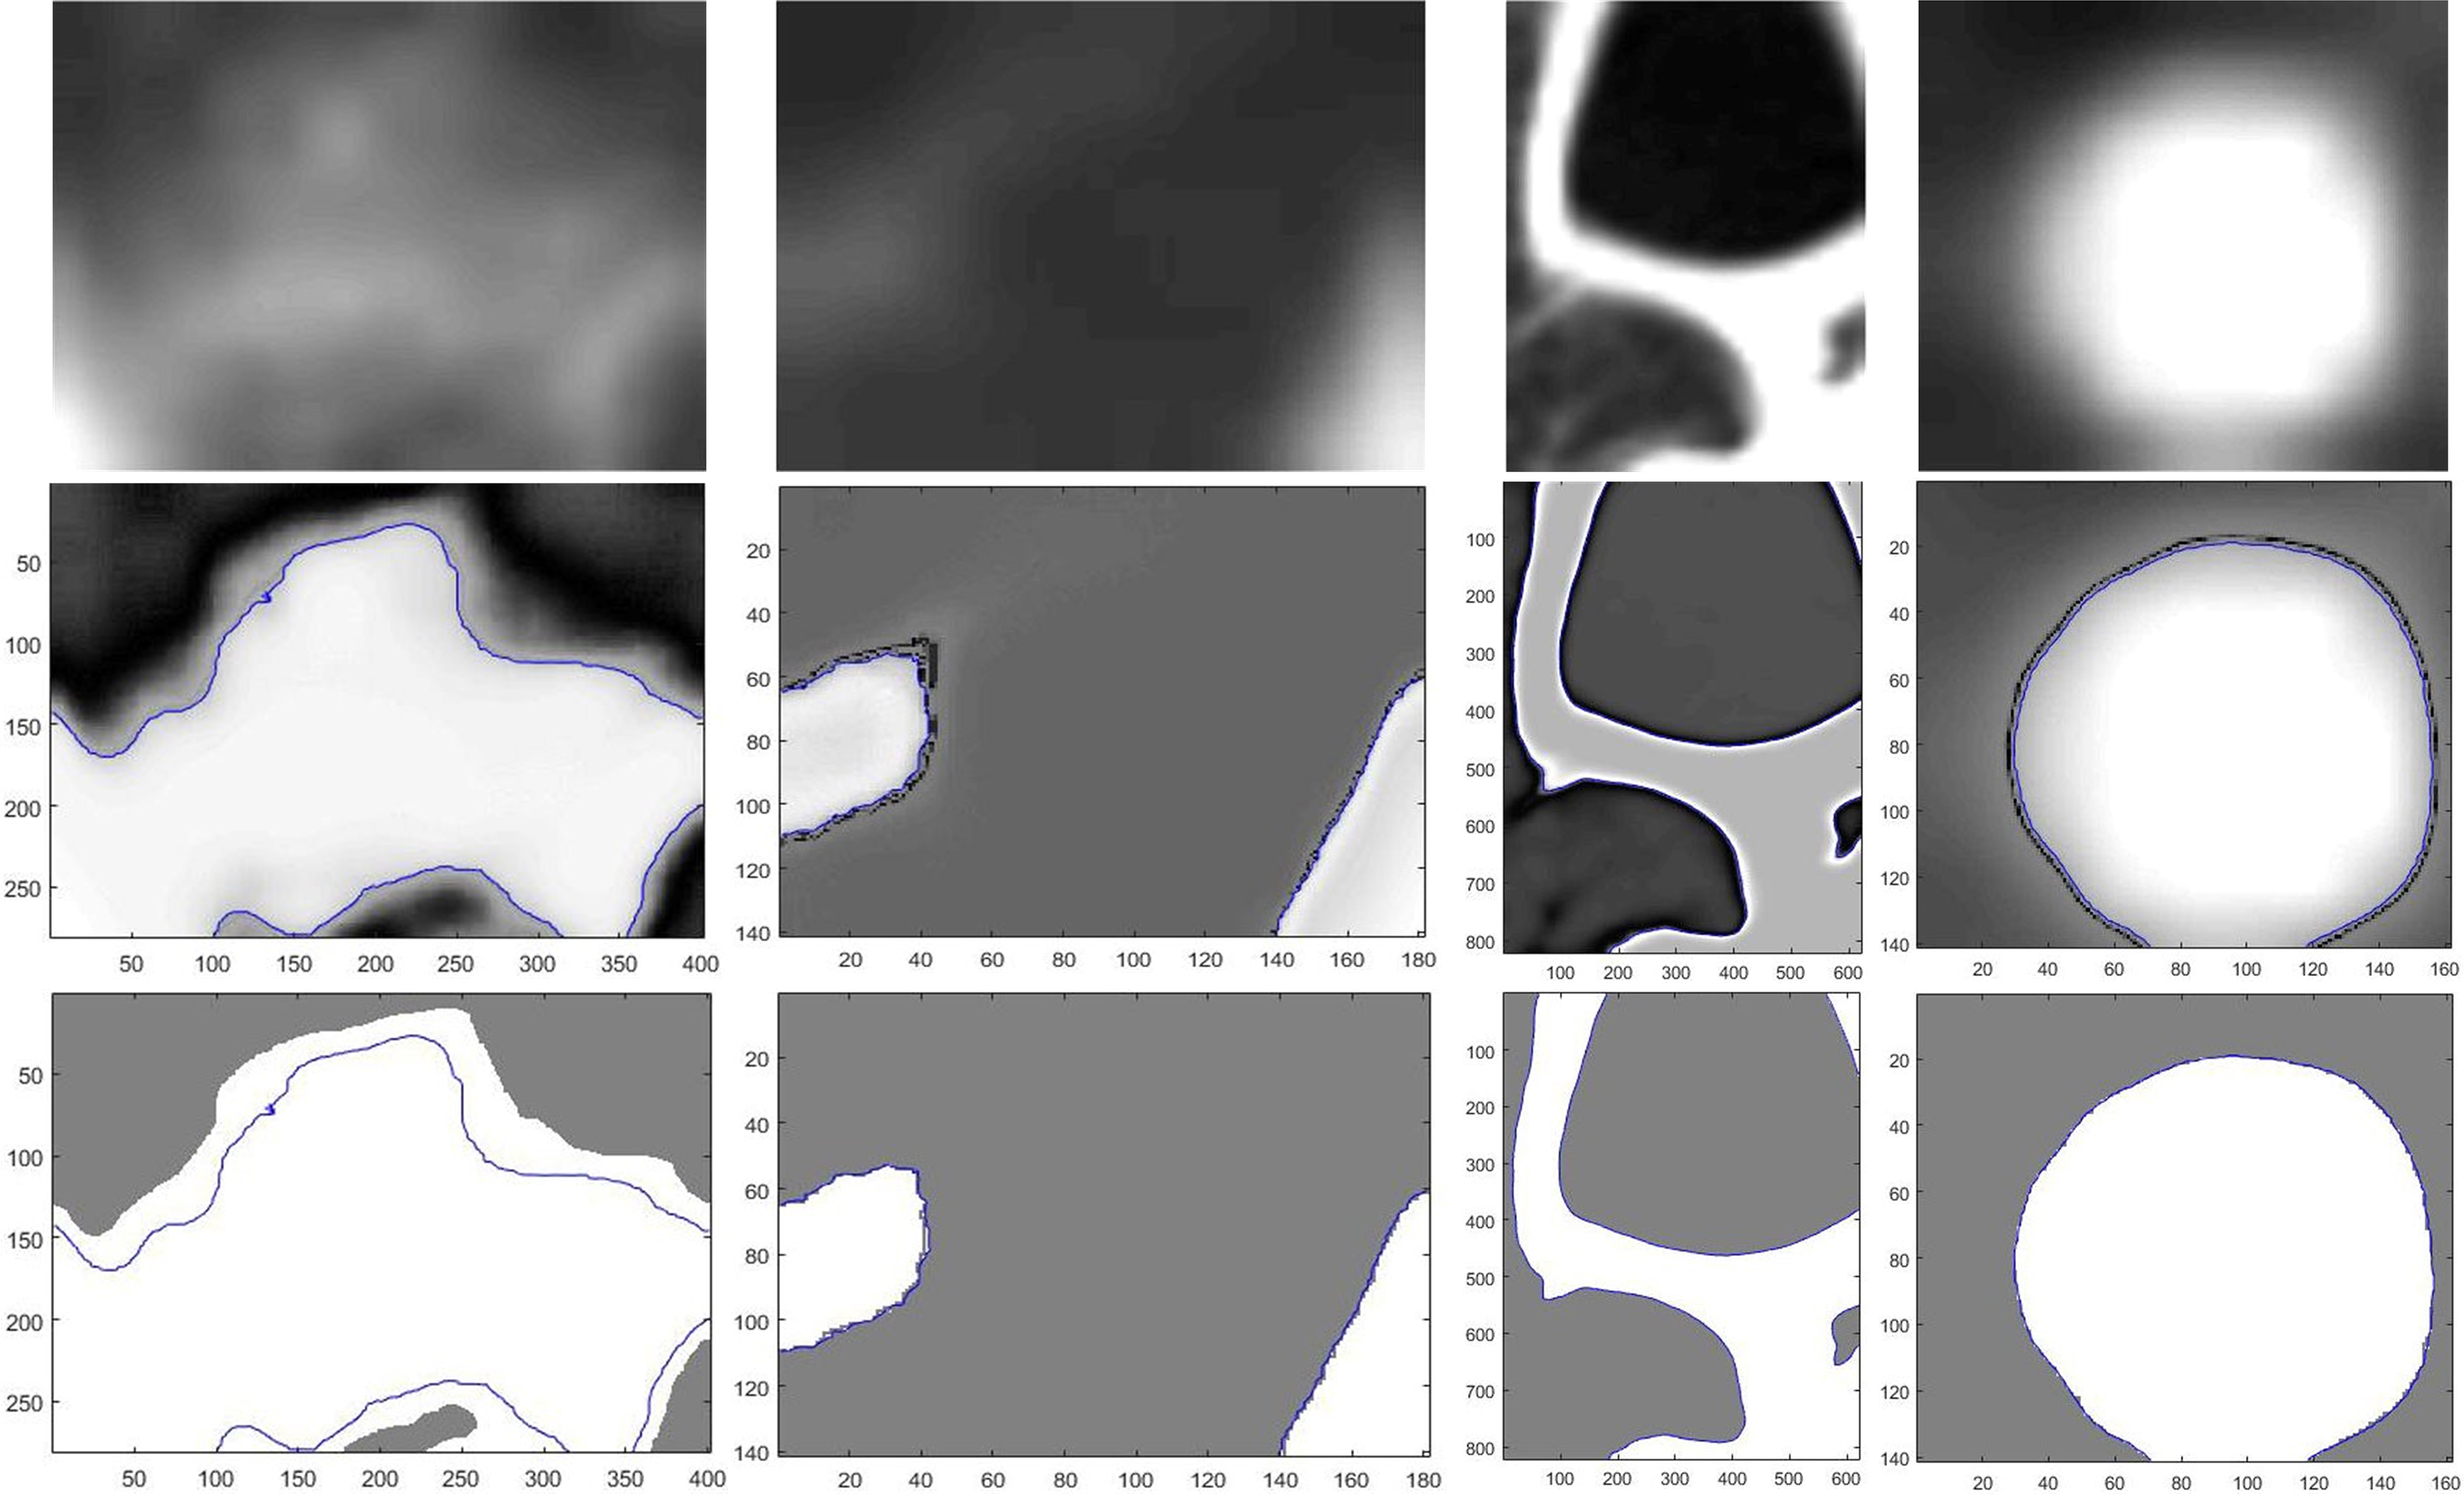
Figure 7.
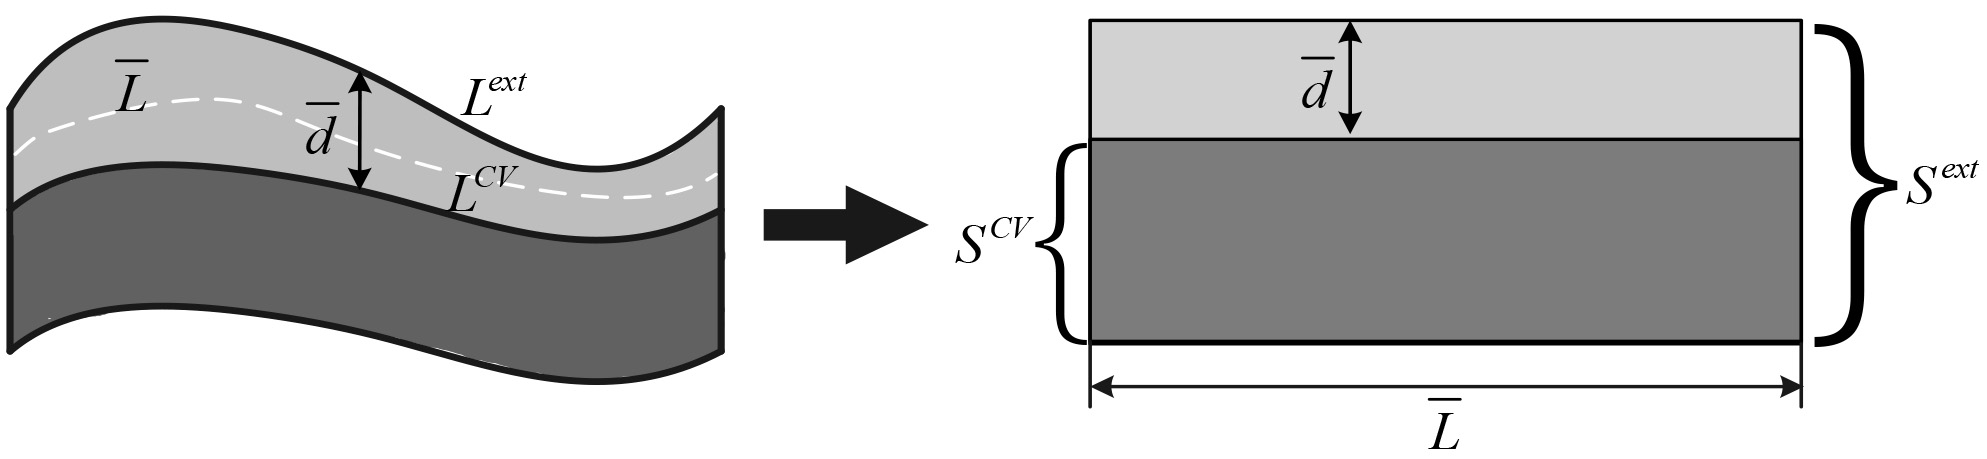
The schematic diagram for calculating the average depth.
Finally, the extended foreground region and the foreground region obtained by the level set segmentation are used to diagnose the suspected lung cancer, with the active and chaotic growing biological characteristics of the malignant pulmonary nodules considered. In CT image, the growing part corresponds to the buffer zone and the grown part to the foreground region from the level set. The first picture in Fig. 6 represents a malignant lung nodule. As is shown, the thicker the depth of the buffer zone, the more likely the suspected lung cancer lesions to be diagnosed as lung cancer.
Based on above consideration, the possibility of suspected lung cancer lesions converting into lung cancer can be detected by calculating the width of this buffer. There is usually a difference in the area between the extended foreground and the foreground from the level set, and the difference is bigger when the foreground edge is fuzzier or the length generating area extension is longer. So the average thickness of the buffer zone can be estimated by the area growth of the unit length of the growth zone. Equation 6 is utilized to calculate the average depth of the buffer area:
(6)
where
4.Results
The most important of the segmentation process is to ensure the consistency between the correct ROI region and the region of the actual segmentation. For the lung cancer detection issue, usually lung cancer has the complex location and shape. The second row of Fig. 8 shows the lung segmentation results, and the marks in the third row figures indicate that the suspected nodular lesions in the lungs obtained by the corresponding segmentation results.
In Fig. 8, we utilize SSP to extract the suspected nodular lesions and label them with the red rectangles. In this experiment, all the slices are randomly selected form the dataset. We adopt Dice’s coefficients to compute the overlaps between binary lung-cancer images to evaluate the accuracy of our lung segmentation results. Dice’s coefficients is always adopted for evaluating the results of image segmentation and use 0, 1 to denote no overlap and completely overlap, respectively.
(7)
where
Table 1
The comparison with the accuracy between Dice’s and ours
| Slice no. | Dice’s measure (%) | Ours (%) |
|---|---|---|
| 1th | 89.6 | 100 |
| 2th | 96.5 | 100 |
| 3th | 91.3 | 100 |
| 4th | 90.2 | 100 |
Table 2
The final result of our proposed method
| Cancer style | The actual number of nodules |
|
| Sensitivity (%) |
|---|---|---|---|---|
| GGO | 23 | 21 | 2 | 91.3 |
| Juxta-pleural nodule | 54 | 52 | 2 | 96.3 |
| Juxta-vascular nodule | 21 | 17 | 4 | 80.9 |
| SPN | 96 | 79 | 17 | 82.3 |
Figure 8.
The results of the lung region segmentation and the candidates extraction: the rows from top to bottom are the original images, the segmented lung regions and the suspected nodular lesion respectively.
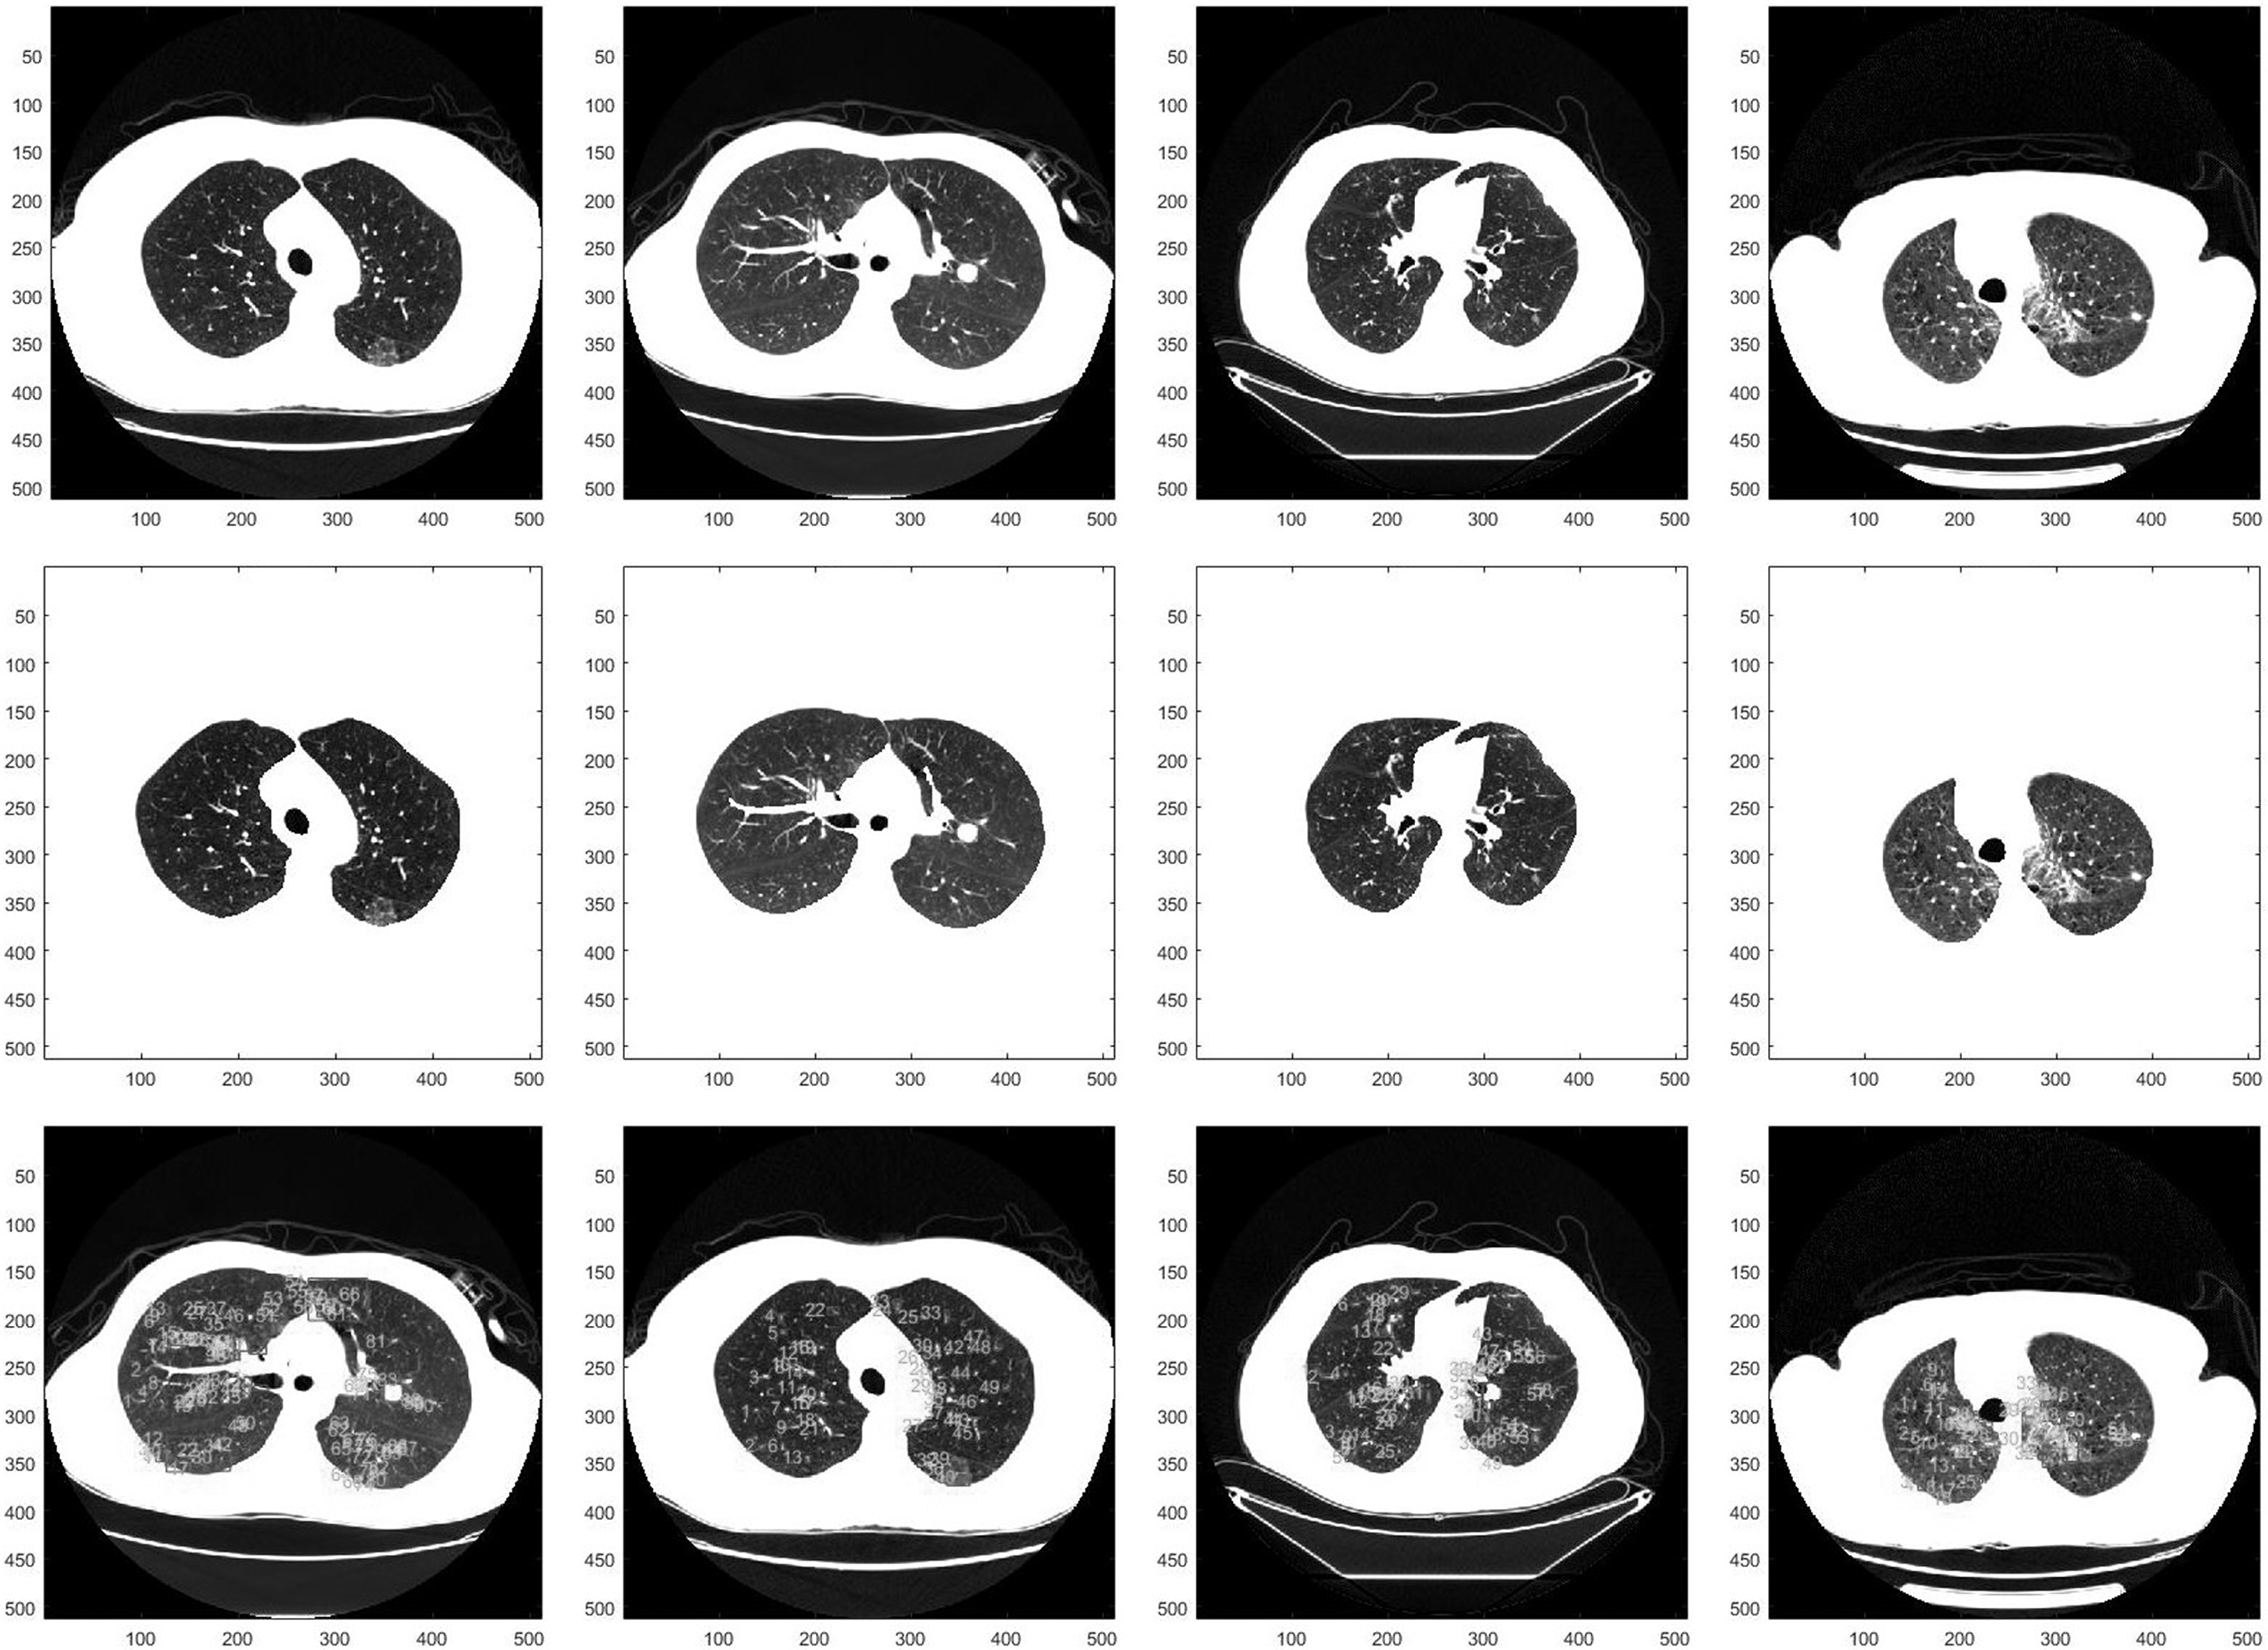
Figure 9.
The distribution of accuracy for the 600 suspected nodules detected from the dataset.
In this paper,
(8)
Figure 10 illustrates the recommended results of the suspected nodular lesion region. The threshold for distinguishing malignant or benign is an empirical value which is gained from the statistics result of the dataset. The yellow rectangle denotes the region of lung cancer that is estimated by our algorithm.
Figure 10.
The lung cancer diagnosis result: the rows from top to bottom are the original images, the depth of the fuzzy regions of the images and the recommended regions respectively.
In addition, we use our algorithm to diagnose each potential lung cancer in our data set, and compute the accuracy of each result. The performance of our algorithm are present in Table 2. Because the size of GGO or the early lung cancer is too small, the doctors’ clinical experience requires to be combined with our results, in order to achieve exact diagnosis. As shown in Table 2, our algorithm can achieve an accuracy rate of more than 89.5%, for detecting the early stage lung cancer containing GGO.
5.Conclusion
In the paper, a novel method for automatically diagnosis the malignant nodules is proposed. The simple and effective three-stage approaches segment the lung region, detect the suspected nodules and diagnosis the malignancy of the lung candidates respectively. In the army of experiments, it is proved that the proposed method can achieve our desired purposes.
The result of lung region segmentation reserves the pulmonary parenchyma well. In the detection of various pulmonary nodules, the proposed method performs better than the state-of-the-art approaches. The experiment results shows that the sensitivity of detection achieves 91.3% for the gross glass nodules, 96.3% for the pleural nodules, 80.9% for the vascular nodules and 82.3% for the solitary nodules.
Conflict of interest
None to report.
Acknowledgments
This work is sponsored by Liaoning Science and Technology Soft Project No. 2015401039 and Liaoning Key Laboratory of Science and Technology Projects No. LZ2014015.
References
[1] | World Health Organization [Internet]. Cancer Fact sheet N deg297. (2014) ; Feb [updated 2015 Feb]; Available from: http//www.who.int/mediacentre/factsheets/fs297/en/. |
[2] | Lassen B, Kuhnigk JM, Schmidt M, Krass S, Peitgen HO. Lung and lung lobe segmentation methods at Fraunhofer MEVIS. Fourth International Workshop on Pulmonary Image Analysis. (2011) Sep; 18: : 185–99. |
[3] | Rikxoort EMV, Ginneken BV. Automatic segmentation of the lungs and lobes from thoracic CT scans. Fourth International Workshop on Pulmonary Image Analysis. (2011) : 261–8. |
[4] | Weinheimer O, Achenbach T, Heussel CP, Düber C. Automatic lung segmentation in MDCT Images. The Fourth International Workshop on Pulmonary Image Analysis. (2011) : 241–56. |
[5] | Lo P, Goldin J, Oria D, Banola A, Brown M. Historic automated lung segmentation method: performance on LOLA11 data set. The Fourth International Workshop on Pulmonary image Analysis. (2011) : 257–60. |
[6] | Sun S, McLennan G, Hoffman EA, Beichel R. Model-based segmentation of pathological lungs in volumetric CT data. The Third International Workshop on Pulmonary Image Analysis. (2010) : 31–40. |
[7] | Montillo A. Context selective decision forest with applications to lung segmentation in CT. The Fourth International Workshop on Pulmonary Image Analysis. (2011) : 201–12. |
[8] | Hu S, Hoffman EA, Reinhardt JM. Automatic lung segmentation for accurate quantitation of volumetric x-ray CT images. IEEE Transaction on Medical Imaging. (2001) Feb; 20: (6): 490–498. |
[9] | Tseng LY, Huang LC. An Adaptive Thresholding Method for Automatic Lung Segmentation in CT Images. AFRICON, 2009. AFRICON ’09. (2009) Sept; 23: : 1–5. |
[10] | Eibaz A, Farag AA, Falk R, Rocco RL. A unified approach for detection, visualization, and identification of lung abnormalities in chest spiral CT scans. International Congress Series. (2003) : 1256: : 998–1004. |
[11] | Armato SGIII, Sensakovic WF. Automated lung segmentation for thoracic CT: Impact on computer-aided diagnosis. Academic Radiology. (2004) Nov: 1011–1021. |
[12] | Chen ZX, Sun XW, Nie SD. An efficient method of automatic pulmonary parenchyma segmentation in ct images. Proceedings of the 29th IEEE International Conference. (2007) : 23–26; Lyon, France. |
[13] | Leader JK, Bin Z, Rogers RM, Sciurba FC, Andrew P, Chapman BE, et al. Automated lung segmentation in X-ray computed tomography: development and evaluation of a heuristic threshold-based scheme. Academic Radiology. (2003) : 10: (11): 1224–1236. |
[14] | Wei GQ, Fan L, Qian JZ. Automatic detection of nodules attached to vessels in lung CT by volume projection analysis. Medical Image Computing and Computer-Assisted Intervention – MICCAI 2002. Springer Berlin Heidelberg. 2002: : 746–752. |
[15] | Enquobahrie AA, Reeves AP, Yankelevitz DF, Henschke CI. Automated detection of pulmonary nodules from whole lung helical CT scans: performance comparison for isolated and attached nodules. Medical Imaging 2004. (2004) : 791–800. |
[16] | Zhao AB, Ginsberg MS, Lefkowitz RA, Jiang L, Cooper C, Schwartz LH. Application of the LDM algorithm to identify small lung nodules on low-dose MSCT scans. Proc Spie. (2004) : 5370: : 818–823. |
[17] | Filho AODC, Sampaio WBD, Silva AC, Paiva ACD, Nunes RA, Gattass M. Automatic detection of solitary lung nodules using quality threshold clustering, genetic algorithm and diversity index. Artificial Intelligence in Medicine, (2014) March: 60: (3): 165–177. |
[18] | Saien S, Pilevar AH, Moghaddam HA. Refinement of lung nodule candidates based on local geometric shape analysis and Laplacian of Gaussian kernels. Computers in Biology & Medicine. (2014) : 54: : 188–198. |
[19] | Jo HH, Hong H, Jin MG. Pulmonary nodule registration in serial CT scans using global rib matching and nodule template matching. Computers in Biology & Medicine. (2014) Feb: 45: (1): 87–97. |
[20] | Wang B, Tian X, Wang Q, Yang Y, Xie HZ, Zhang SY, et al. Pulmonary nodule detection in CT images based on shape constraint CV model. Medical Physics. (2015) : 42: (3): 1241–1254. |
[21] | Ye XJ, Lin XY, Dehmeshki J, Slabaugh G, Beddoe G. Shape-based computer-aided detection of lung nodules in thoracic CT images. IEEE Transaction on Biomedical Engineering. (2009) : 56: (7): 1810–1820. |
[22] | Li B, Zhang J, Tian LF, Tan L, Xiang SJ, Ou SX. Intelligent Recognition of Lung Nodule Combining Rule-based and C-SVM Classifiers. International Journal of Computational Intelligence Systems. (2012) : 5: (1): 76–92. |
[23] | Wiemker R, Rogalla P, Zwartkruis A, Blaffert T. Computer aided lung nodule detection on high resolution CT data. Proceedings SPIE. (2002) May: 4684: : 677–688. |
[24] | Paik DS, Beaulieu CF, Rubin GD, Acar B, Jeffrey RB, Yee J, et al. Surface normal overlap: a computer-aided detection algorithm with application to colonic polyps and lung nodules in helical CT. IEEE Transaction on Medical Imaging. (2004) : 23: (6): 661–675. |
[25] | Chang S, Emoto H, Metaxas DN, Axel L. Pulmonary micro nodule detection from 3-D chest CT. Lecture Notes in Computer Science. (2004) : 3217: (1): 821–828. |
[26] | Li Q, Doi K. New selective enhancement filter and its application for significant improvement of nodule detection on computed tomography. Proc SPIE. (2004) : 5370: : 1–9. |
[27] | Stember JN. The Normal Mode Analysis Shape Detection Method for Automated Shape Determination of Lung Nodules. Journal of digital imaging. (2015) : 28: (2): 224-230. |
[28] | Achanta R, Shaji A, Smith K, Lucchi A, Fua P, Süsstrunk S, et al. SLIC superpixels. Epfl. (2010) . |
[29] | Achanta R, Shaji A, Smith K, Lucchi A, Fua P, Süsstrunk S, et al. SLIC Superpixels Compared to State-of-the-Art Superpixel Methods. IEEE Transactions on Pattern Analysis & Machine Intelligence. (2012) : 34: (11): 2274–2282. |
[30] | Osher S, Paragios N. Geometric level set methods in imaging, vision, and graphics. (2003) New York: Springer. |
[31] | Chan TF, Vese LA. Active contours without edges. IEEE transactions on Image processing A Publication of the IEEE Signal Processing Society. (2001) : 10: (2): 266–277. |
[32] | Rousson M, Deriche R. A Variational Framework for Active and Adaptative Segmentation of Vector Valued Images. Proceedings of 2002 Workshop on Motion and Video Computing. (2002) Dec: 56–61; Washington D.C., USA: IEEE Press. |
[33] | Xu C, Prince JL. Snakes, Shapes, and Gradient Vector Flow. IEEE Transactions on Image Processing. (1998) : 7: (3): 359–369. |
[34] | Chuang CH, Lie WN. A Downstream Algorithm Based on Extended Gradient Vector Flow Field for Object Segmentation. IEEE Transactions on Image Processing. (2004) : 13: (10): 1379–1392. |


