
Grouped fuzzy SVM with EM-based partition of sample space for clustered microcalcification detection
Abstract
BACKGROUND:
Detection of clustered microcalcification (MC) from mammograms plays essential roles in computer-aided diagnosis for early stage breast cancer.
OBJECTIVE:
To tackle problems associated with the diversity of data structures of MC lesions and the variability of normal breast tissues, multi-pattern sample space learning is required.
METHODS:
In this paper, a novel grouped fuzzy Support Vector Machine (SVM) algorithm with sample space partition based on Expectation-Maximization (EM) (called G-FSVM) is proposed for clustered MC detection. The diversified pattern of training data is partitioned into several groups based on EM algorithm. Then a series of fuzzy SVM are integrated for classification with each group of samples from the MC lesions and normal breast tissues.
RESULTS:
From DDSM database, a total of 1,064 suspicious regions are selected from 239 mammography, and the measurement of Accuracy, True Positive Rate (TPR), False Positive Rate (FPR) and EVL
CONCLUSION:
The proposed method incorporates the merits of fuzzy SVM and multi-pattern sample space learning, decomposing the MC detection problem into serial simple two-class classification. Experimental results from synthetic data and DDSM database demonstrate that our integrated classification framework reduces the false positive rate significantly while maintaining the true positive rate.

1.Introduction
Breast cancer is one of the most common causes of death among middle-aged women, with incidence increasingly on the rise during recent years. Mammography is the most widely used diagnostic technique for the early detection of breast cancer [1] because it is a low-cost, low-radiation-dose procedure with sufficient sensitivity to detect early-stage breast cancer. The most frequent markers of breast cancer are clustered MC [2], which appears in 30–50% of mammographic-diagnosed cases and shows a high correlation with breast cancer [3]. Therefore, the detection of MC in mammography is the most effective way of defeating breast cancer [4].
Over the past dozen years, researchers have developed classifiers for better detection of MC, such as Artificial Neural Networks (ANN) [5, 6] and Support Vector Machines (SVM) [7, 8, 9]. Dehghan showed that SVM with polynomial kernel and SVM with Gaussian RBF kernel achieve a higher true positive detection rate than Neural Networks (NN) [5]. Having evaluated the SVM, Kernel Fisher Discriminant (KFD), Relevance Vector Machine (RVM), Feedforward Neural Network (FNN), and Committee Machines, Wei concluded that the kernel-based method (SVM, KFD, and RVM) yielded the best performance [9]. However, because of the diversity features of the MC regions and the variability of normal breast tissues, single kernel SVM is still unable to provide a satisfactory accuracy rate.
To characterize this feature, researchers proposed to incorporate feature subspace learning algorithms into the classifiers. Li designed a combinational SVM [10] with the polynomial SVM to MC and the linear SVM to non-MC pixels, respectively, which achieved a significant reduction in false positive detection while simultaneously preserving the true positive detection rate. Zhang proposed an SVM-based approach by embedding General Tensor Discriminant Analysis (GTDA) of feature subspace learning [11]. Chang presented a Multiple Kernel Support Vector Machine with Grouped Features [12] to discern the inhomogeneous features in both MC lesions and normal breast tissues of suspicious regions, which reduced the false positive rate significantly and maintained the true positive rate. Zhang showed that the approach based on hybrid subspace fusion for MC detection [13] could obtain satisfactory sensitivity results as well as reduce the false positive rate.
In addition, two difficulties and challenges still exist when SVM is applied to the clustered MC detection problem. The first challenge is the complicated structural information of sample space, both in MC lesions and normal breast tissues space. Like many real-world problems, large amounts of samples imply that different classes may have different underlying data structures that exhibit different data distribution [14]. It has been shown that the structural information of data may contain useful prior domain knowledge for training a classifier [15]. Therefore, an ideal classifier should consider the structural information of the corresponding class and have a good discrimination ability of the within class diversities [16]. However, the traditional SVM-based classifiers mainly characterize the difference between different classes, which do not sufficiently consider the diversity within the classes [17]. Due to the fact that both MC lesions (positive class) and normal breast tissues (negative class) are inhomogeneous, we propose that single Probability Density Functions (PDF) based classification cannot fully characterize the diversified sub-patterns within classes, which requires multi-pattern sample space learning to both MC lesions and normal breast tissues space.
The second main challenge is the inability of the state-of-the-art methods to characterize different contributions of different samples for the classification. Oftentimes, some training samples are more important than others in a given classification task, i.e., the effects of the training points are different [18]. However, in traditional SVM, each training sample is treated as equally weighted, which makes the classifier very sensitive to outliers or noises in the training periods [19].
To address the above problems, a novel grouped fuzzy SVM algorithm with an EM-based partition of sample space called G-FSVM is proposed in this paper. To obtain the diversity of data structures and extract the structural information embedded within classes, the sample space of both MC lesions and normal breast tissues are considered as Gaussian Mixture Model (GMM), and each component of GMM represents a cluster of one objective class. GMM was chosen as the mixture model for the following reasons [20]: (1) It is reasonable from the center limit theorem. (2) It is convenient in calculation with Expectation-Maximization (EM) algorithm. (3) Any mixture model can be approximated to GMM theoretically by increasing the number of the model. Then, we estimate the parameter of GMM with EM algorithm and partition the sample space into several sub spaces. Specifically, the partition of sample space based on EM preserves the diversity structural information of the sample space, which provides as much information as possible for the classifier of sub space. Each subset of samples of MC lesions and normal breast tissues are combined to train a suitable sub classifier. Furthermore, to address the second problem, we quantify the contribution of different samples and employ fuzzy SVM as the sub classifier of the final integrated classification. The fuzzy membership is defined by the probability of the samples belonging to the subset of sample space by EM estimation, which can denote the importance of the sample to the sub classifier. Taking these two factors into consideration, G-FSVM is presented to successfully characterize the diversified sub-patterns and the different importance of each sample, which cast the difficult two-class problem into a set of simple two-class classification problems.
The proposed G-FSVM differs in two ways from our previous method named Clustered Group Support Vector Machine (GC-SVM) [21]. One of the differences lies in the sample subspace learning algorithm. The partition of sample space in GC-SVM is completed with K-means clustering, which is strictly limited to distance computation, whereas the partition of sample space in G-FSVM is completed with EM algorithm for GMM based on probability computation [22]. Therefore, sample space characterization is based on statistics instead of geometrics, which is more stable in the diversity data structures. Another difference between these two methods is the choice of sub classifiers. In GC-SVM, traditional SVM is employed as the sub classifiers; however, in G-FSVM, the sub classifiers are fuzzy SVM, which takes full use of the different importance of each sample and has better discriminatory power.
Experimental results in both synthetic data and real clustered MC detection show that G-FSVM can significantly reduce the false positive rate while simultaneously maintaining the true positive rate for clustered MC detection as compared with the different kernel SVMs and our previous method GC-SVM.
The rest of the paper is organized as follows. Section 2 presents the EM-based partition of sample space and the integrated classification framework with fuzzy SVM. Section 3 describes the experimental results of both synthetic data and clustered MC detection. Finally, the paper is concluded in Section 4.
2.Methods
In this section, G-FSVM method for clustered MC detection from mammography is presented to deal with the diversity of underlying data structures in both MC lesions (positive class) and normal breast tissues (negative classes). Firstly, the sample spaces are modeled as GMM, and each Gaussian component represents a subspace of the MC lesions or the normal breast tissues. Secondly, EM algorithm is employed to estimate the parameters and the contributions of each Gaussian distribution. In this way, the training samples are divided into different groups, every sample in the specified group is attached the same label, and fuzzy membership values are simultaneously defined based on the probability of the samples belonging to the group. Finally, a series of fuzzy SVM sub-classifiers are integrated for MC detection.
2.1EM-based sample space partition
Suppose the training set has
(1)
where
(2)
For GMMs, the goal is to maximize the following log-likelihood:
(3)
Unfortunately, maximizing the log likelihood Eq. (3) directly is often difficult because the log of the sum can potentially couple all of the parameters of the model [23]. However, if the estimation problem is reformulated in terms of so called latent or hidden variables
(4)
the log of the sum can be simplified and the maximization problem can be solved by many optimization algorithms [24]. As the latent variables cannot be observed directly, EM algorithm iteratively refines the maximum likelihood estimation by first calculating the expectation of the posterior of the latent variables
Figure 1.
Framework of EM algorithm.
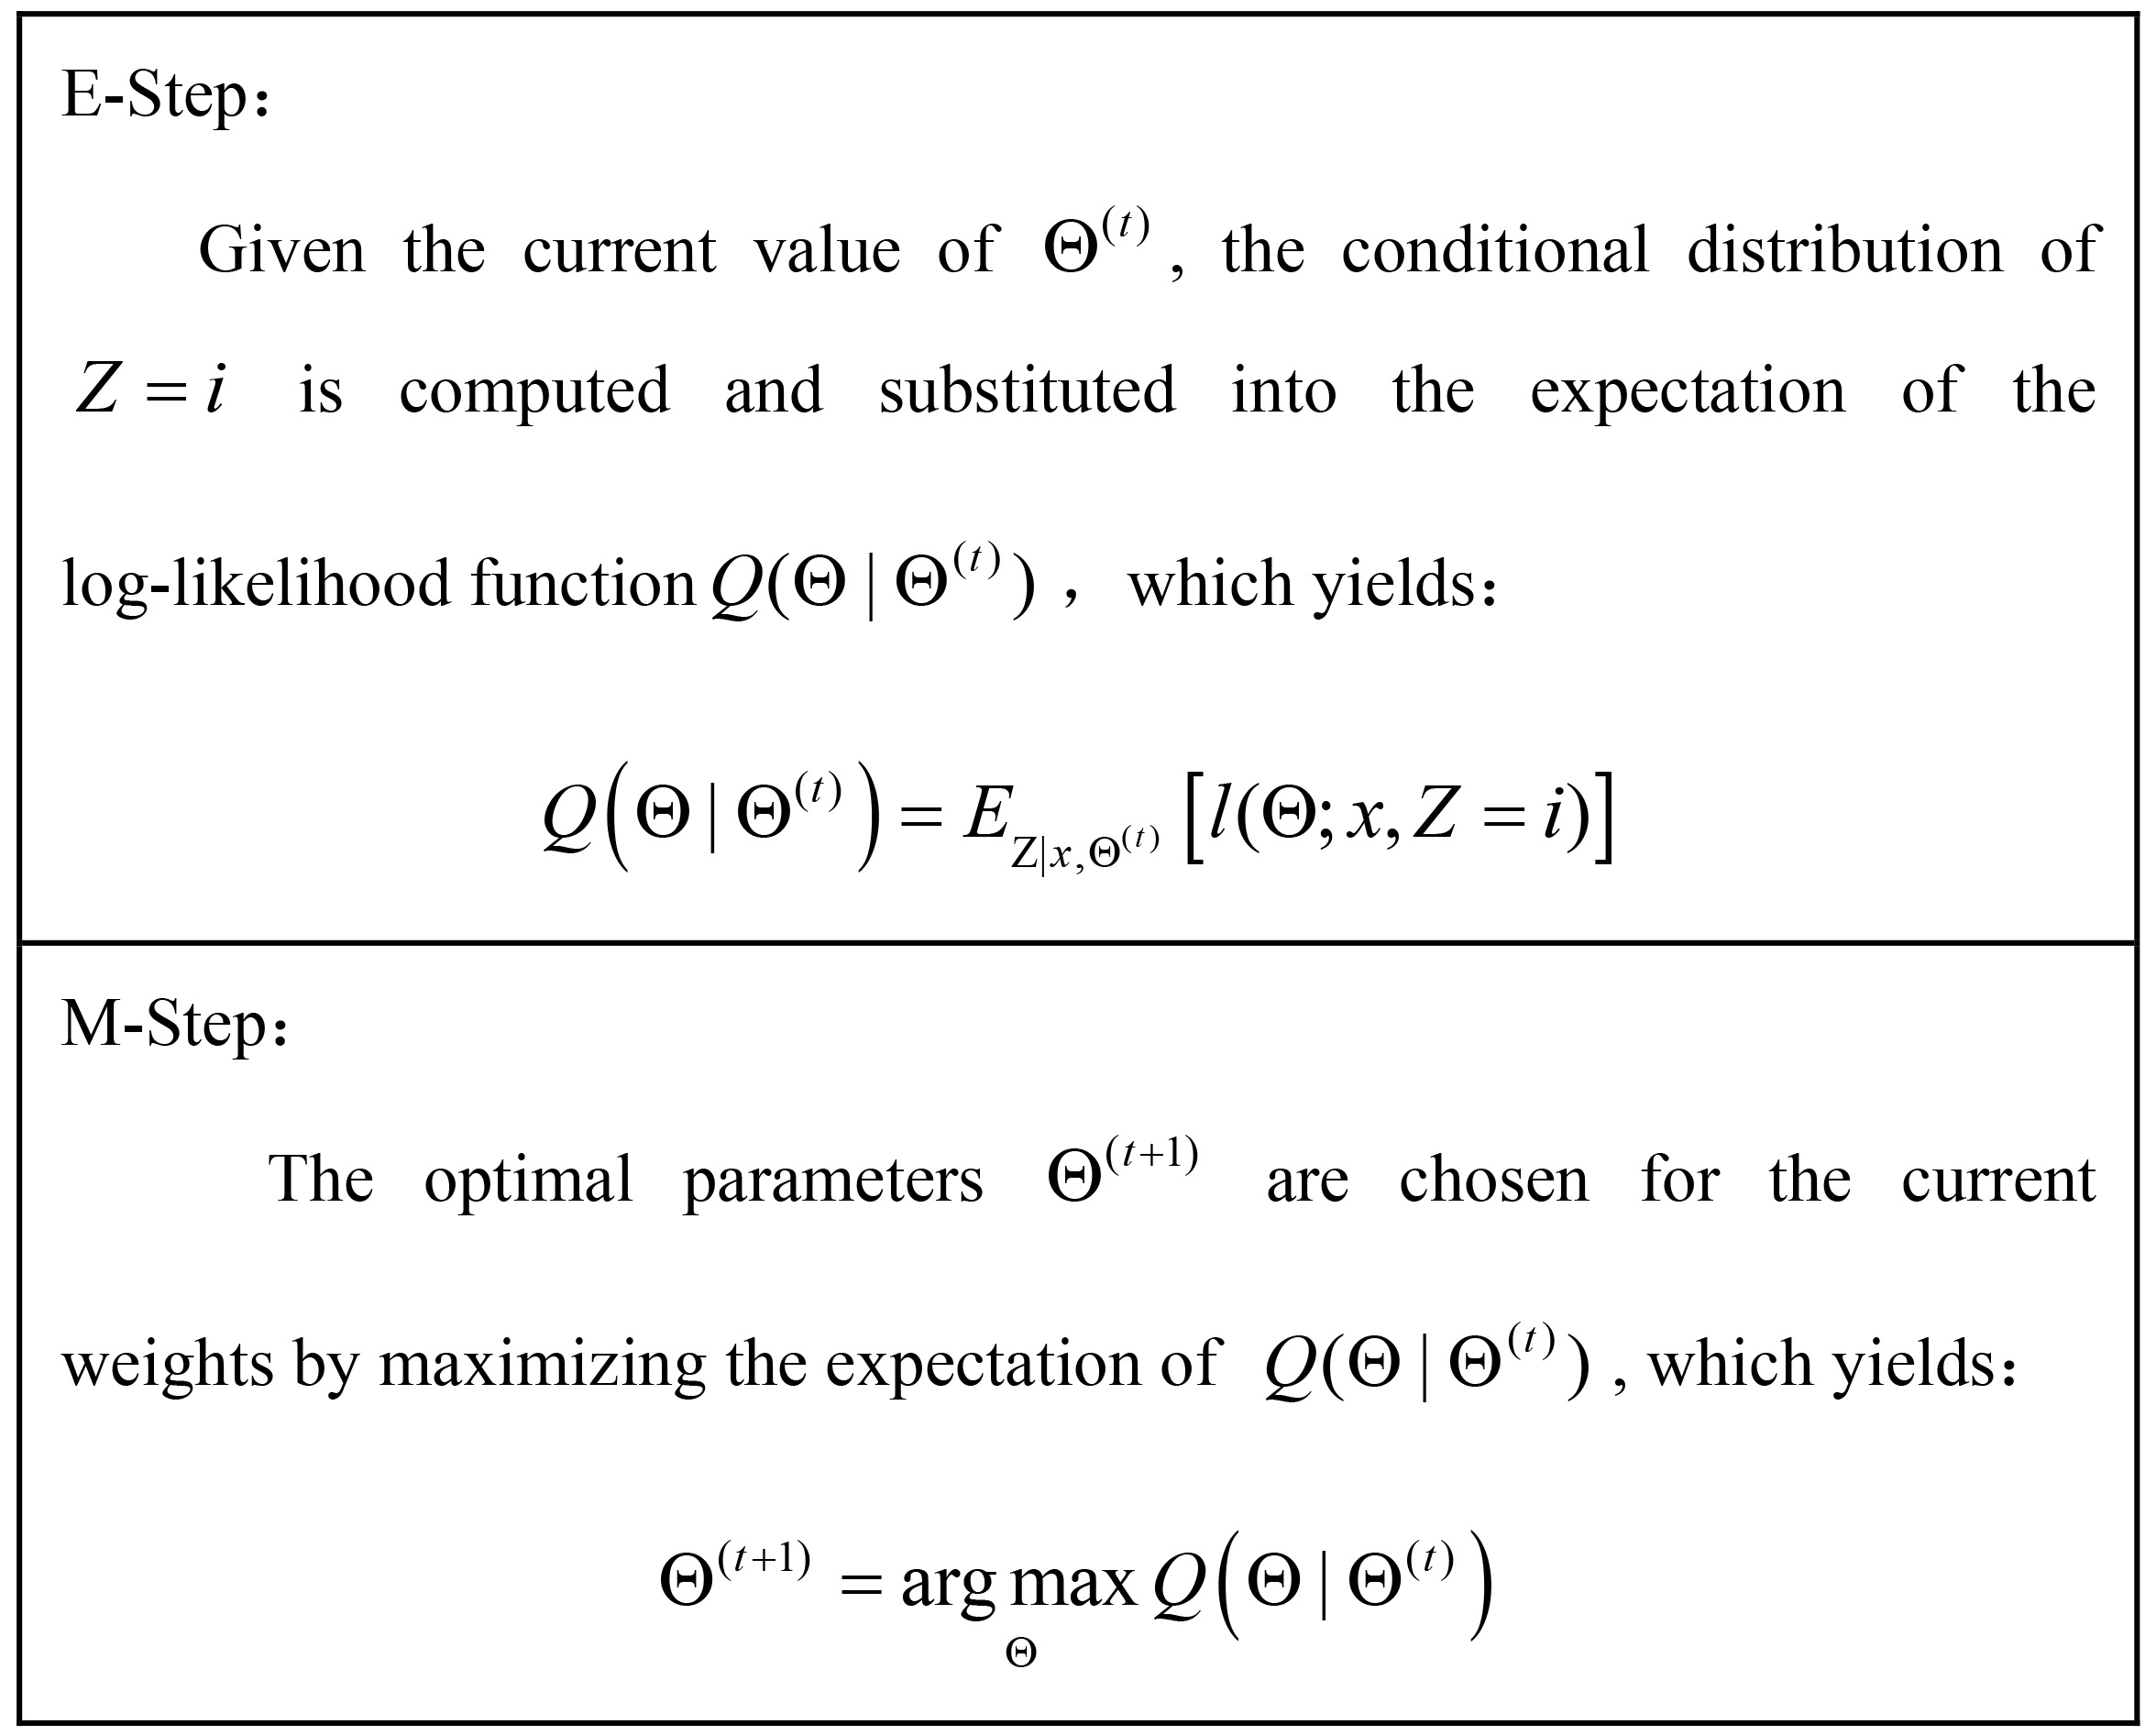
Under fairly mild regularity conditions, EM can be shown to converge to a local maximum of the likelihood. Although these conditions do not always hold in practice, EM iteration has been widely used for maximum likelihood estimation for mixture models with good results [25]. It should be noted that the initial mean vector are randomly selected, the initial variance matrix is taken as whole data covariance matrix and the initial weights are set equally. The expectation and maximization steps are repeated until the convergence of
With the estimated parameter
The component number
(5)
where
2.2Grouped fuzzy SVM with partition of sample space
To clearly demonstrate our method G-FSVM, we present training process and testing process respectively.
In the training process, a model trained with integrated fuzzy SVM is proposed. Before formally describing the frame of the fuzzy SVM with partition of sample space, we first present and illustrate the idea of sample space partition in Fig. 3. Suppose that the samples of MC lesions (positive) and normal breast tissues (negative) are partitioned to
Figure 2.
Partition of training sample space.
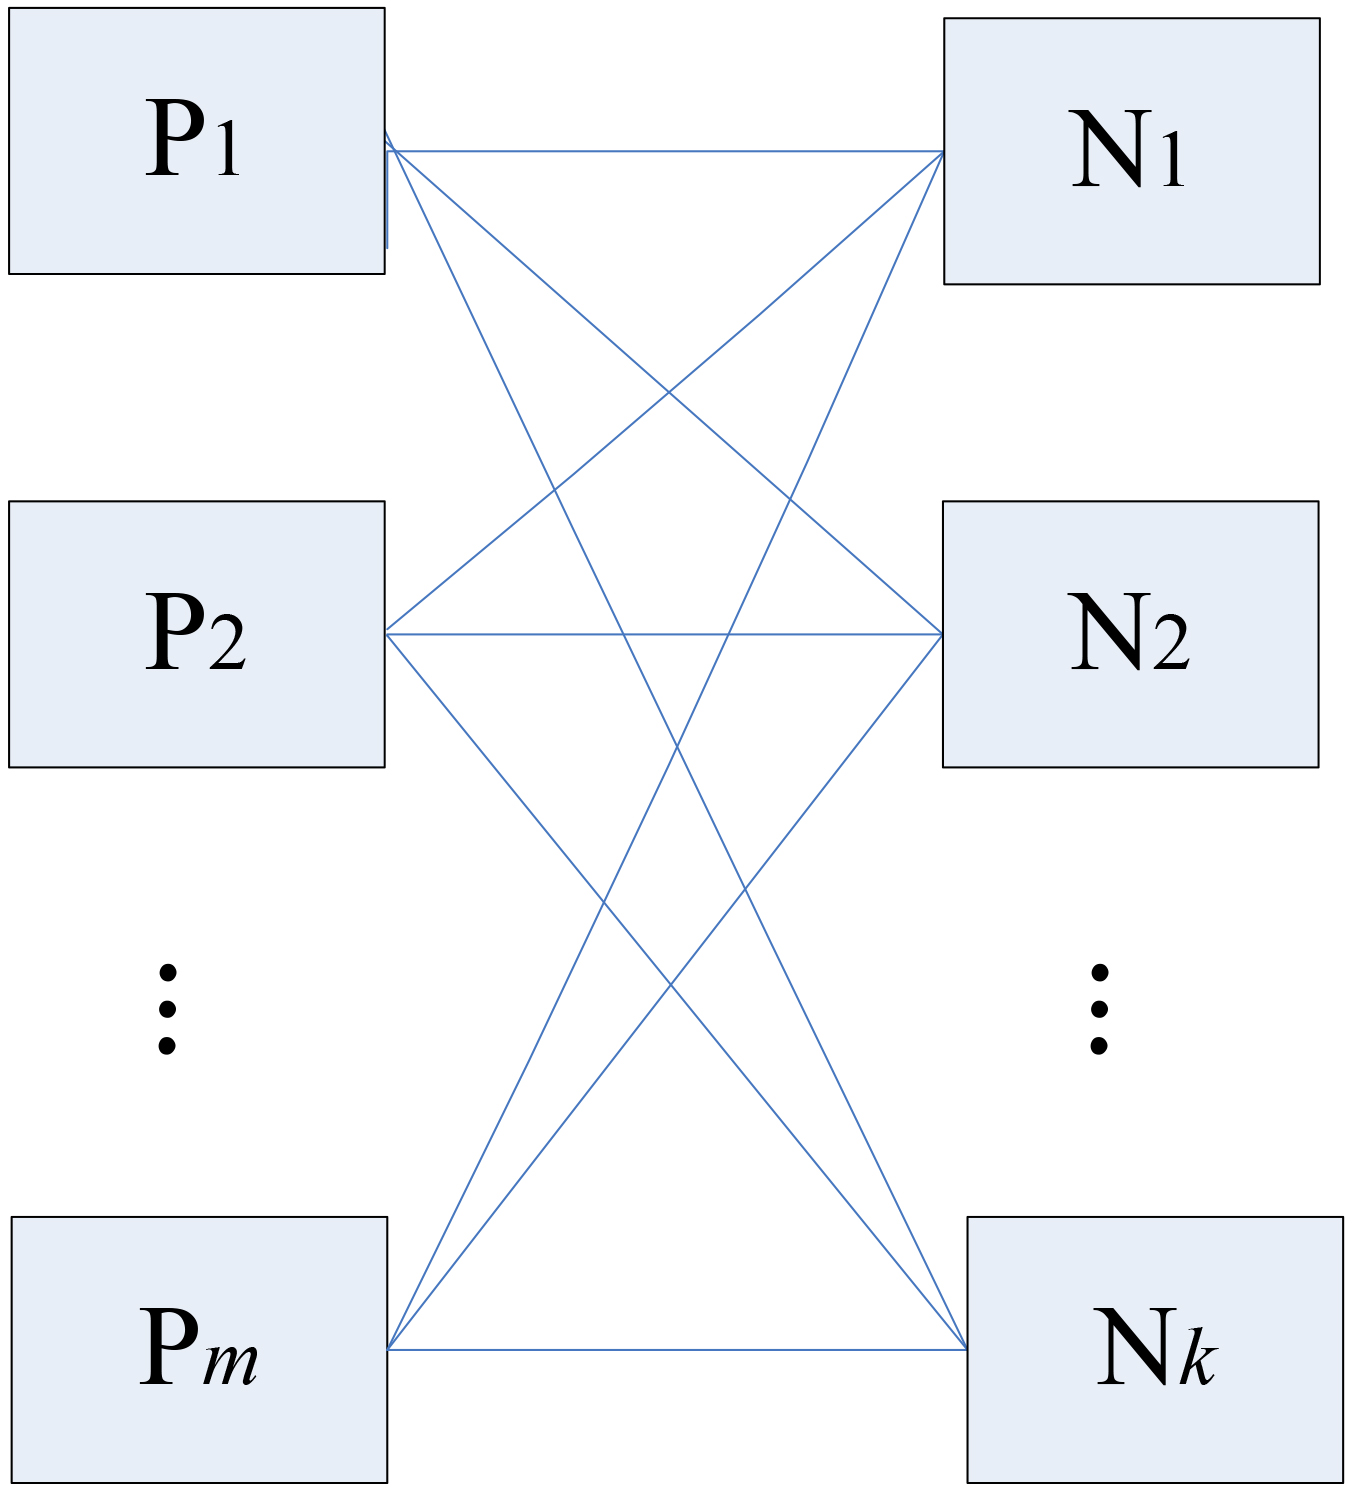
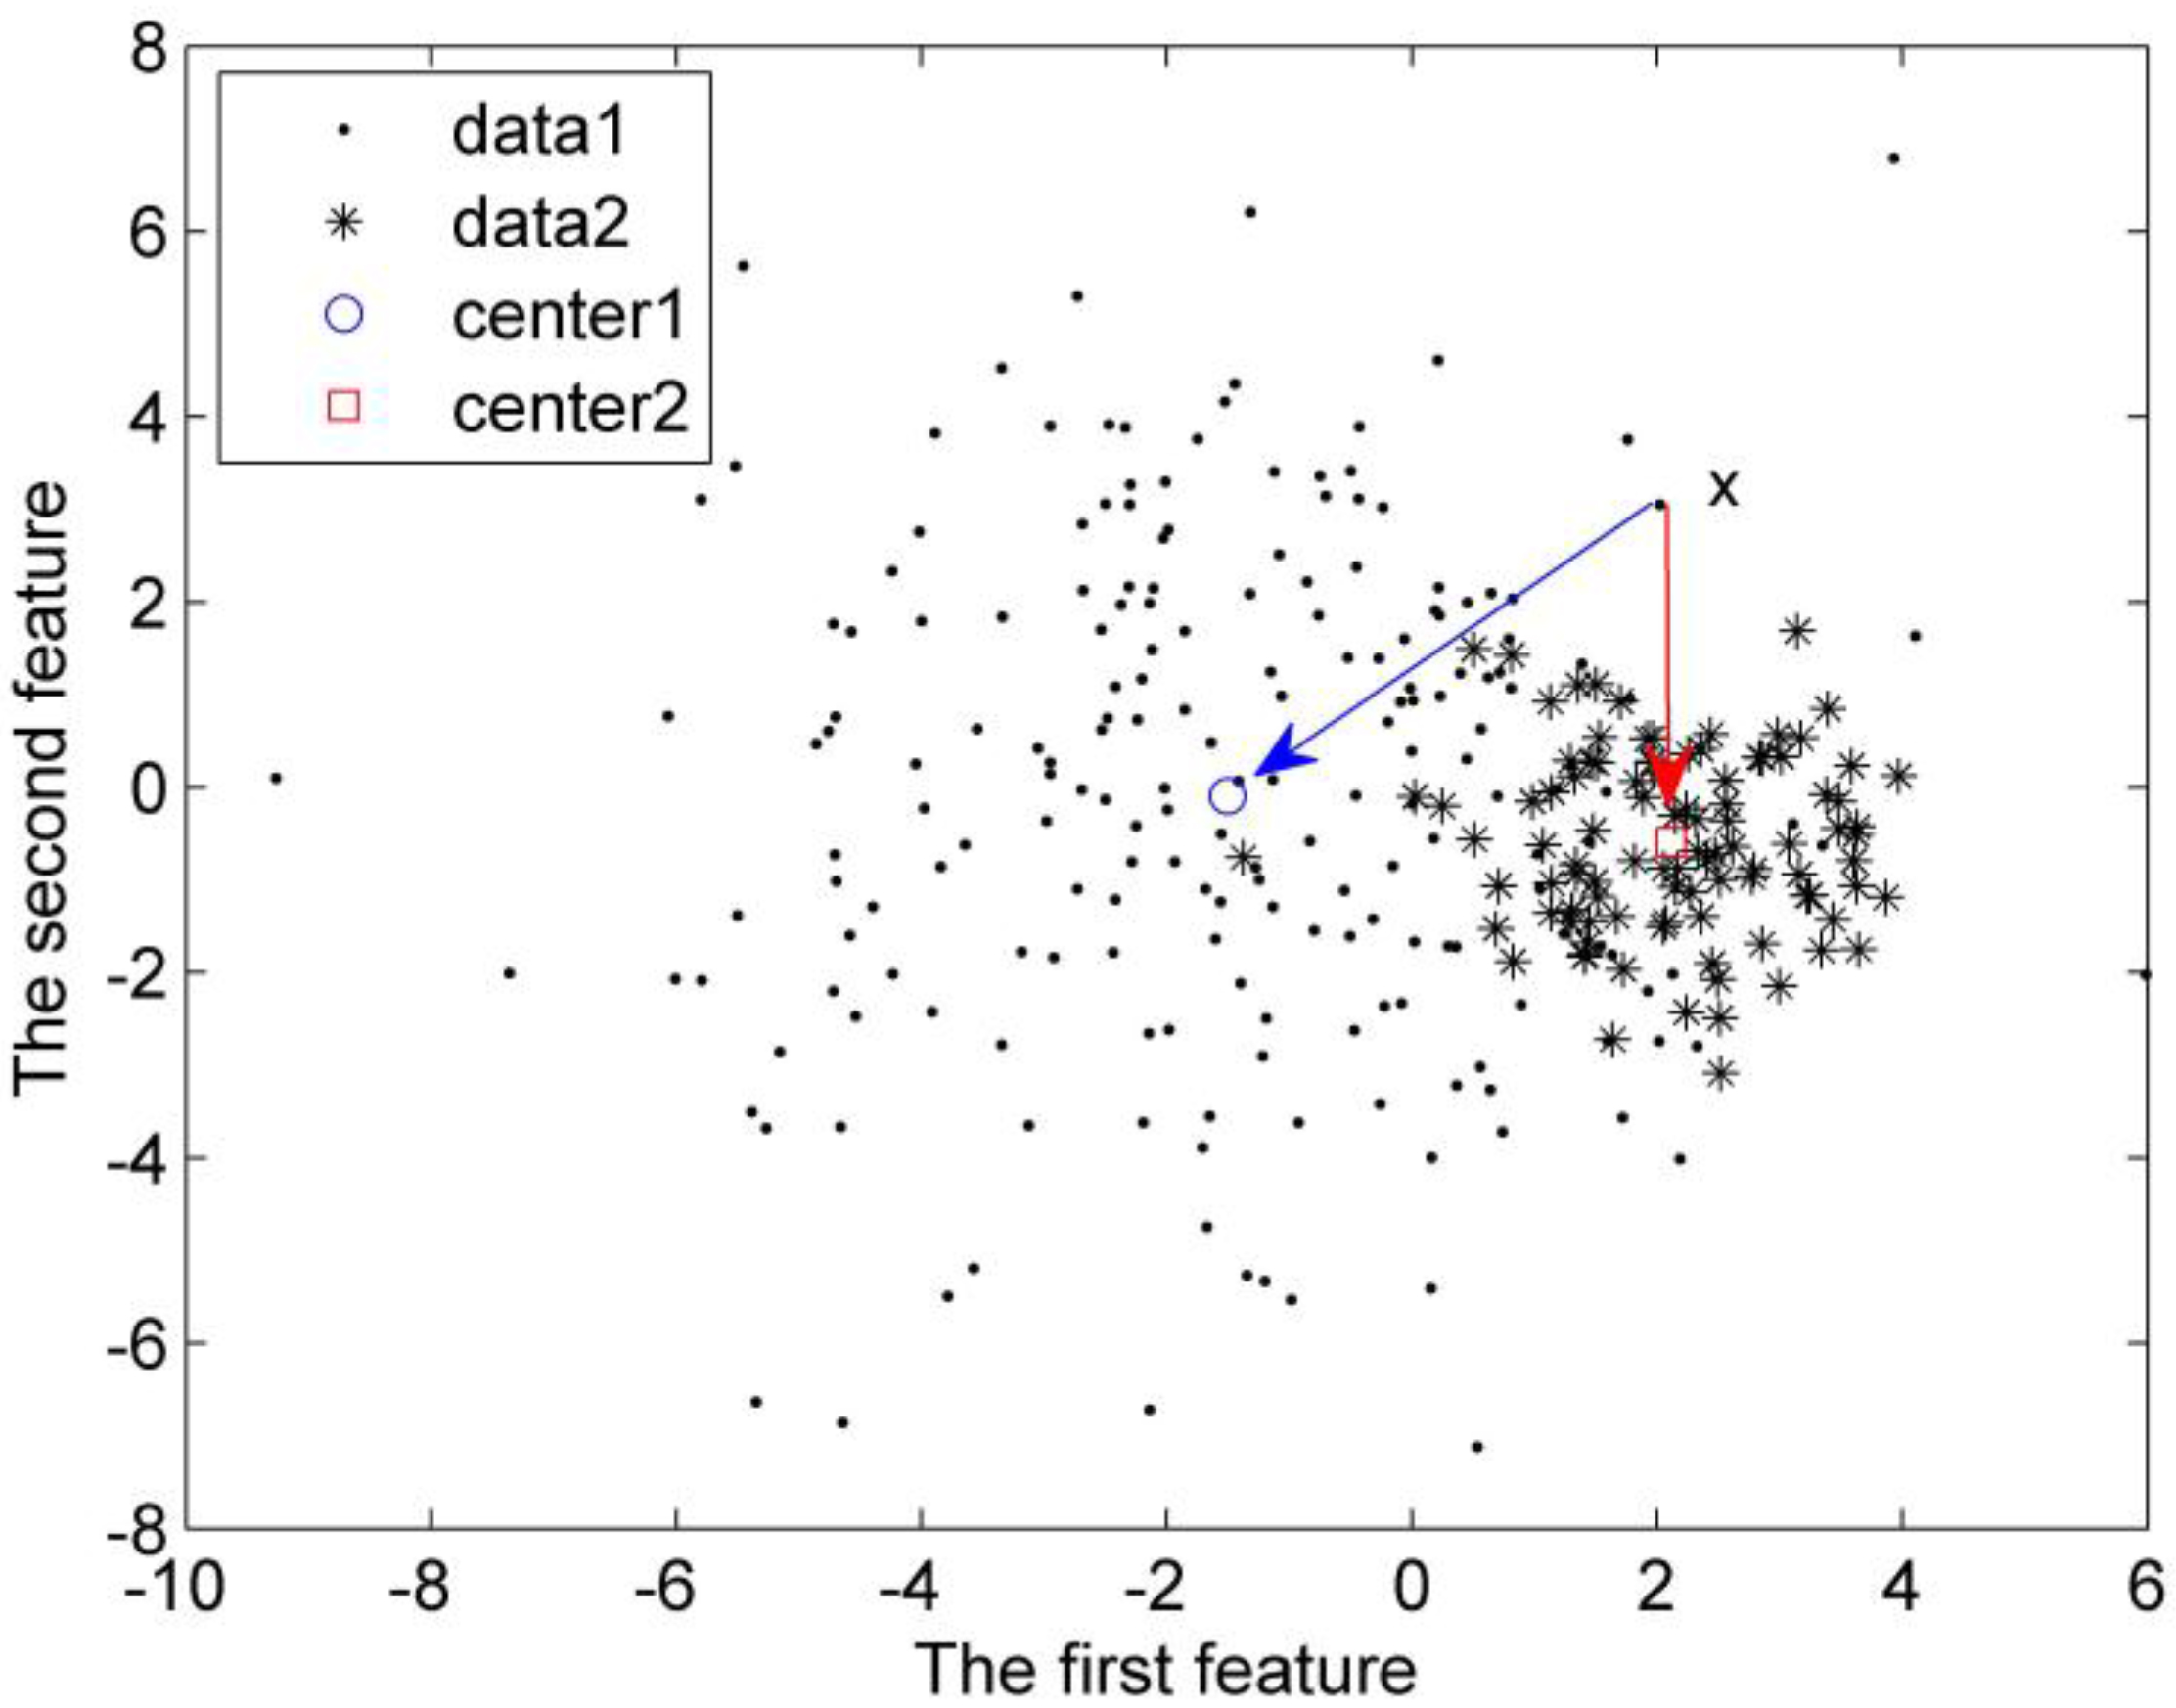
Figure 3.
Distance influenced by the dispersion of the sample sets.
Let
(6)
where
Based on the partition of sample space with EM, the subsets are given with its mean vector and variance matrix as:
where
(7)
By combining the samples with the subsets of
(8)
where
The sub classifier
(9)
It is noted that after the partition of sample space, sub classifier
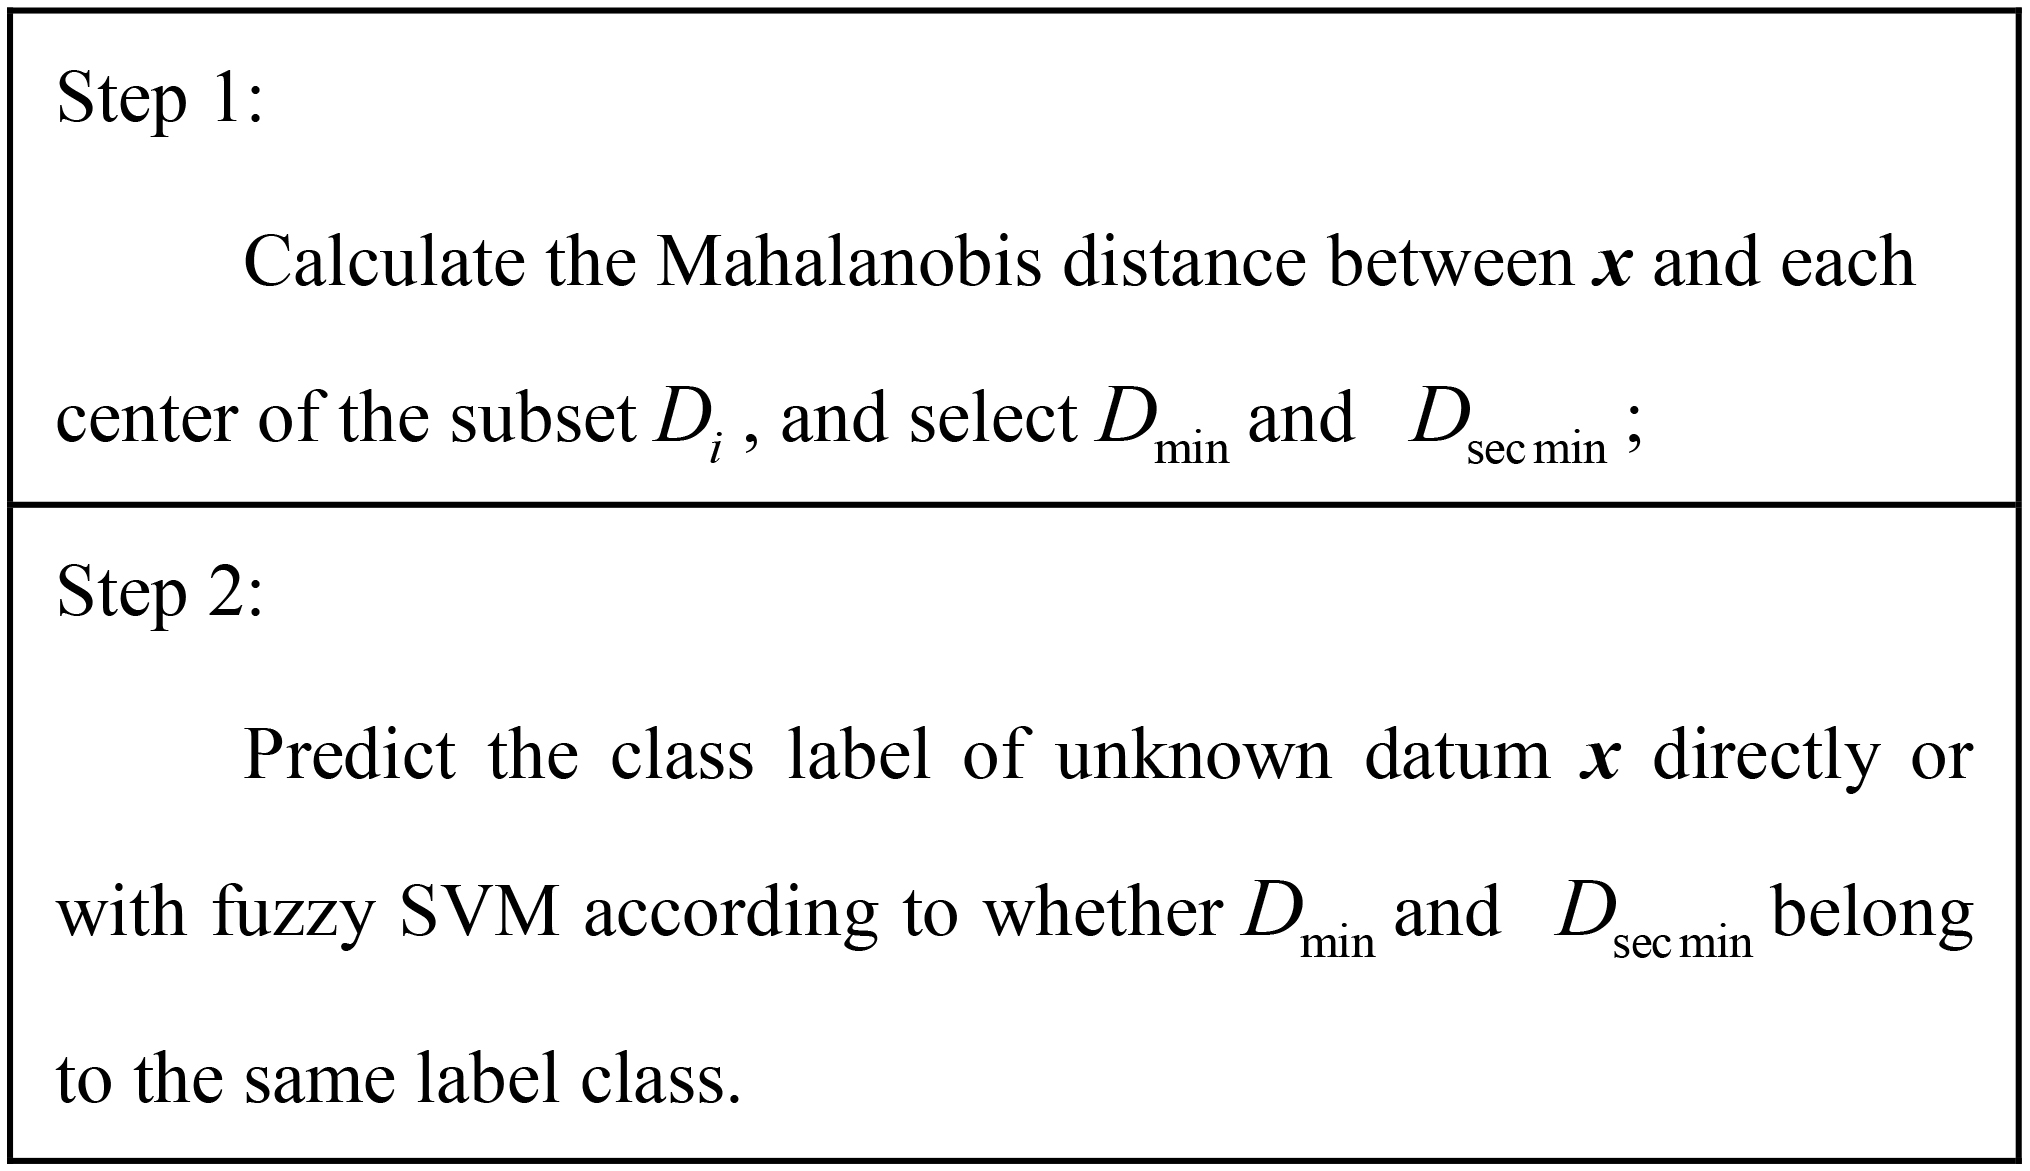
In the testing process, we need to predict the label of the under detection mammographic image sample x. The distance between x and each center of the subset
The calculated Mahalanobis distance between x and each center of the
(10)
(11)
When
Figure 4.
Prediction algorithm.
3.Results
In this section, we compare our proposed G-FSVM with our previous method GC-SVM and traditional SVM with different kernels on both synthetic data sets and real clustered MC detection.
3.1Synthetic data classification
To objectively estimate the performance of the proposed G-FSVM, we first test it in synthetic datasets. In our experiment, the first synthetic dataset consists of 400 random samples (vectors), and half of them are positive, with the rest being negative. Both the positive and negative samples are divided into two groups. They are all subject to Gaussian distribution. The positive class has its vectors distributed around the centers (
There are a total of 600 samples for the second synthetic dataset. Half of these samples are positive samples, and the rest are negative ones. They are divided into three groups, respectively. Each group of the samples is subject to Gaussian distribution. The centers for the positive samples are (0, 5), (
In this paper, EVL
Table 1
Performance of different methods on the first synthetic dataset
| Methods | Acc | TPR | FPR | EVL |
|---|---|---|---|---|
| Linear SVM | 0.86 | 0.90 | 0.18 | 0.82 |
| Polynomial SVM | 0.87 | 0.95 | 0.20 | 0.85 |
| Gaussian SVM | 0.89 | 0.97 | 0.20 | 0.88 |
| GC-SVM | 0.91 | 0.97 | 0.15 | 0.89 |
| G-FSVM | 0.93 | 1 | 0.15 | 0.92 |
Table 1 lists the Accuracy, TPR, FPR and EVL of each kernel form of SVM, GC-SVM and G-FSVM.
Figure 5.
Distribution of the first synthetic dataset.
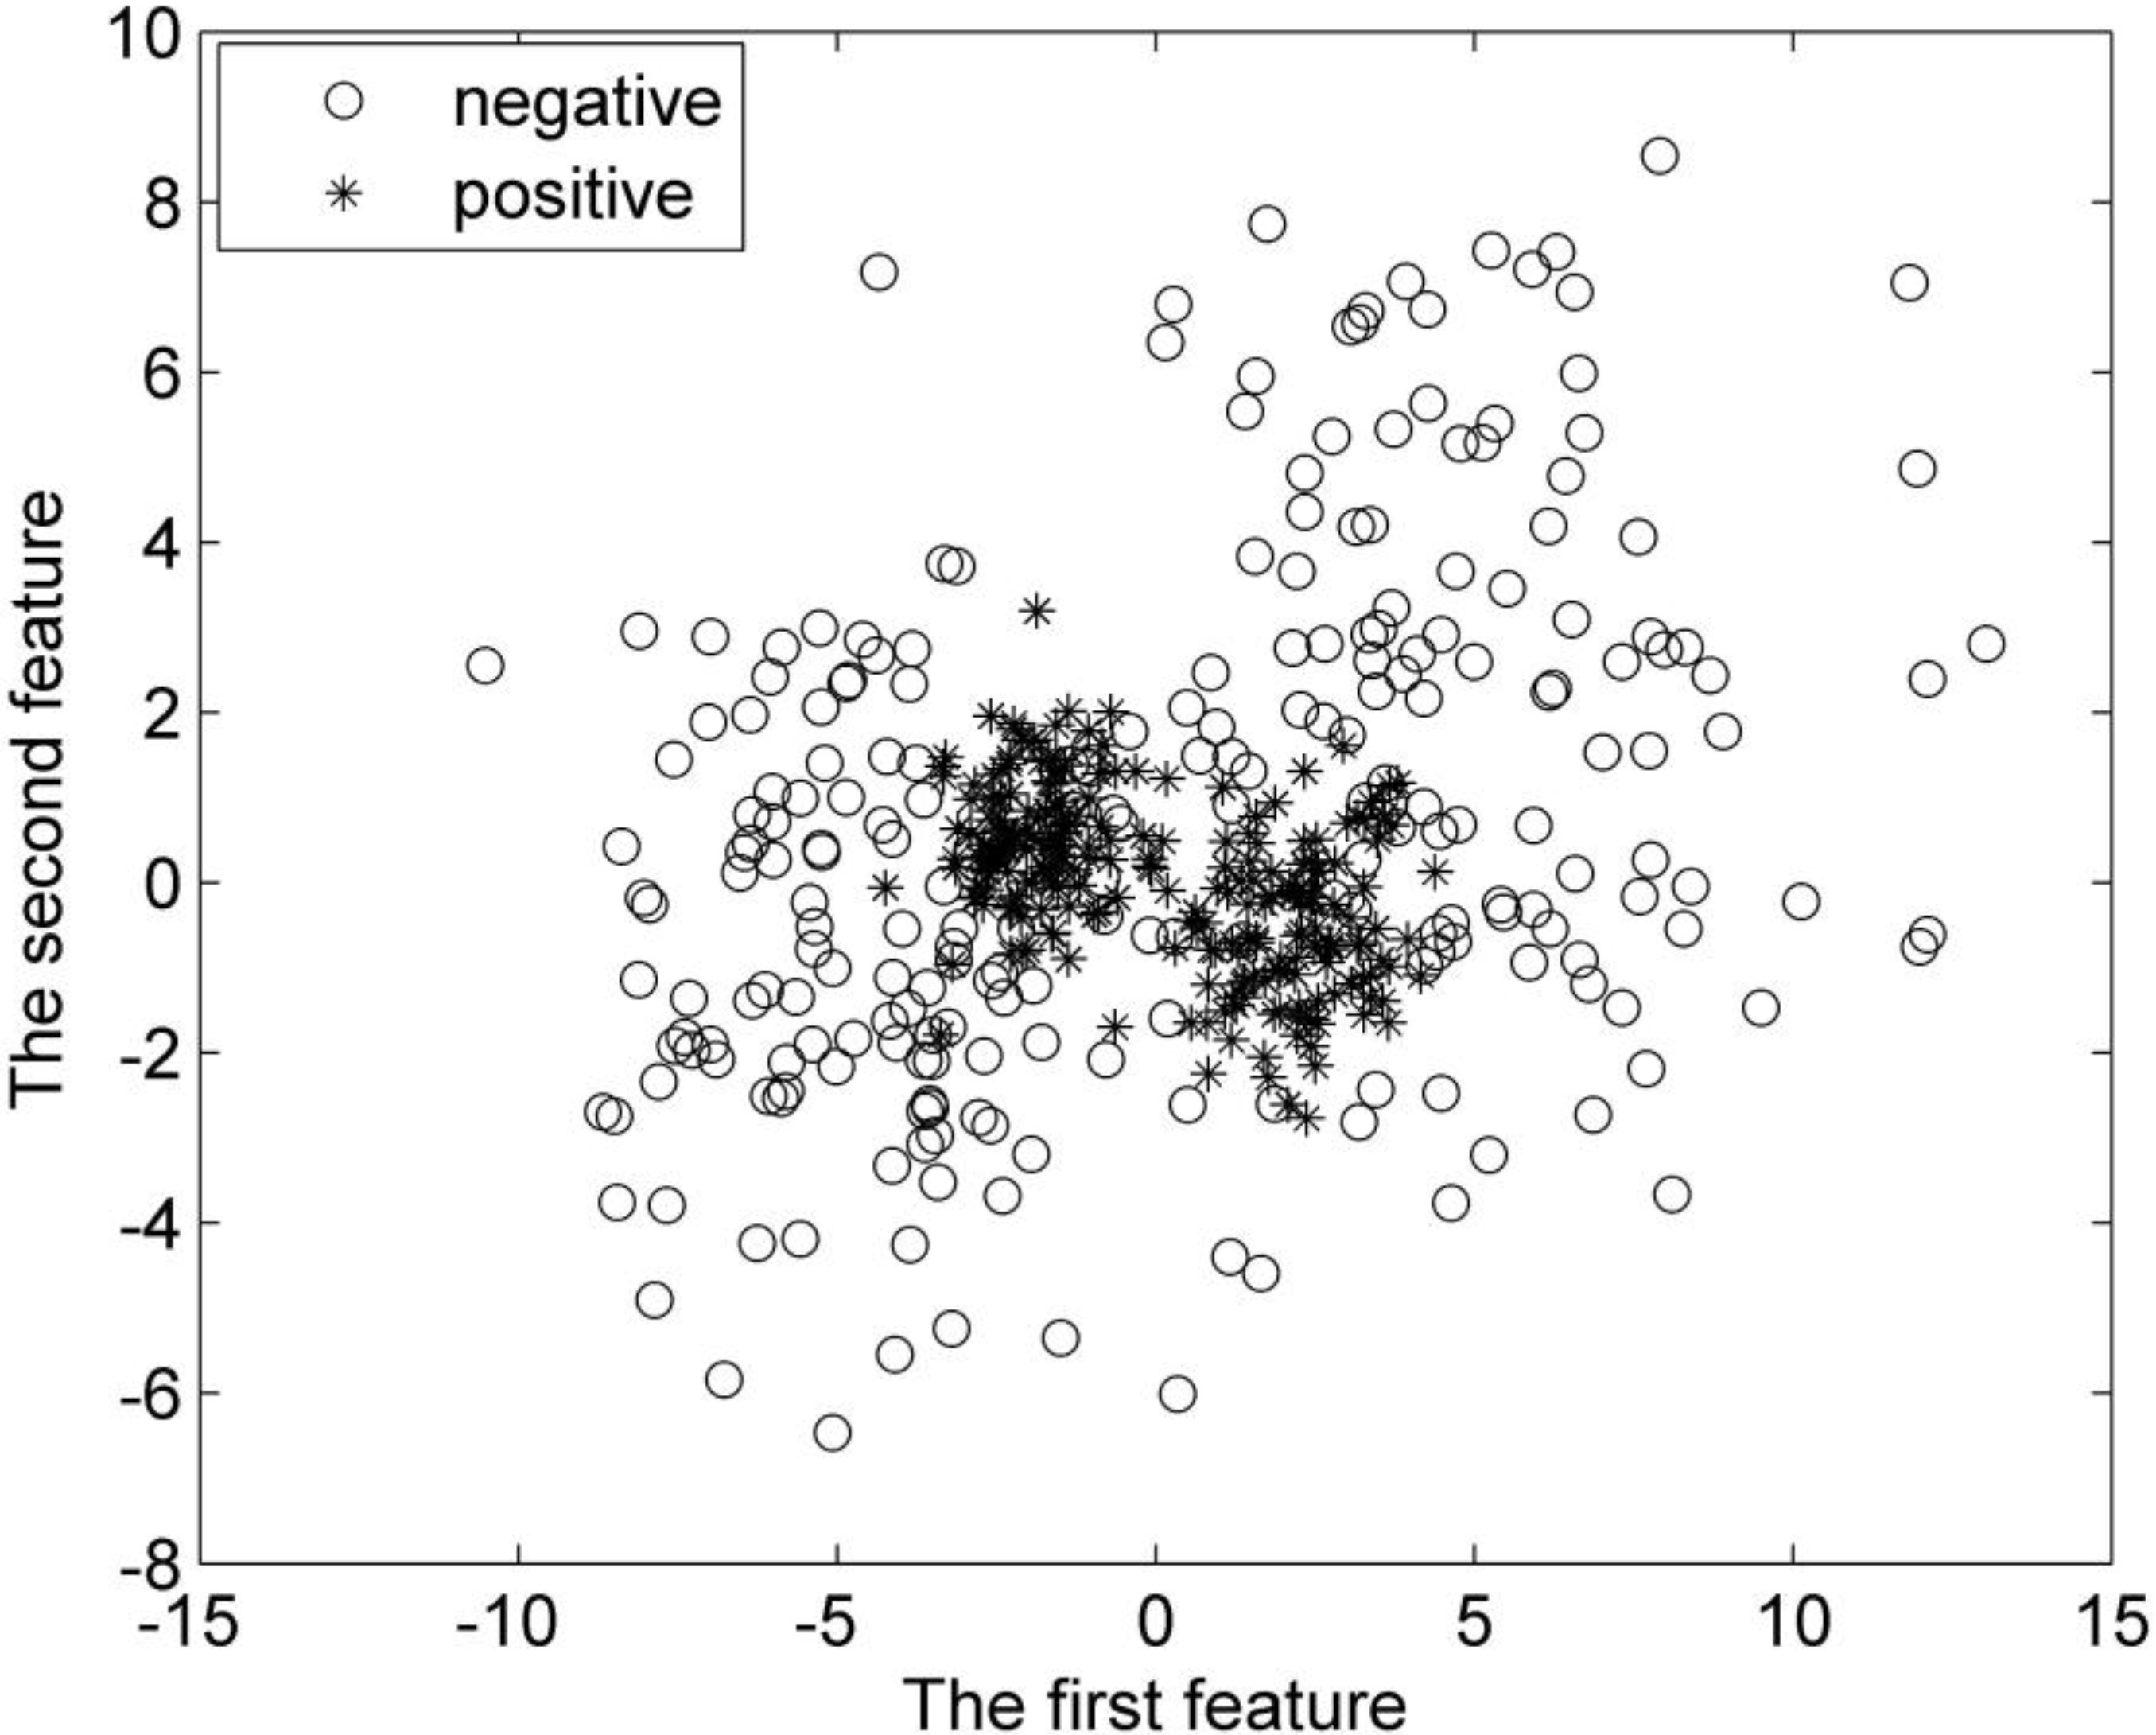
Figure 6.
Distribution of the second synthetic dataset.
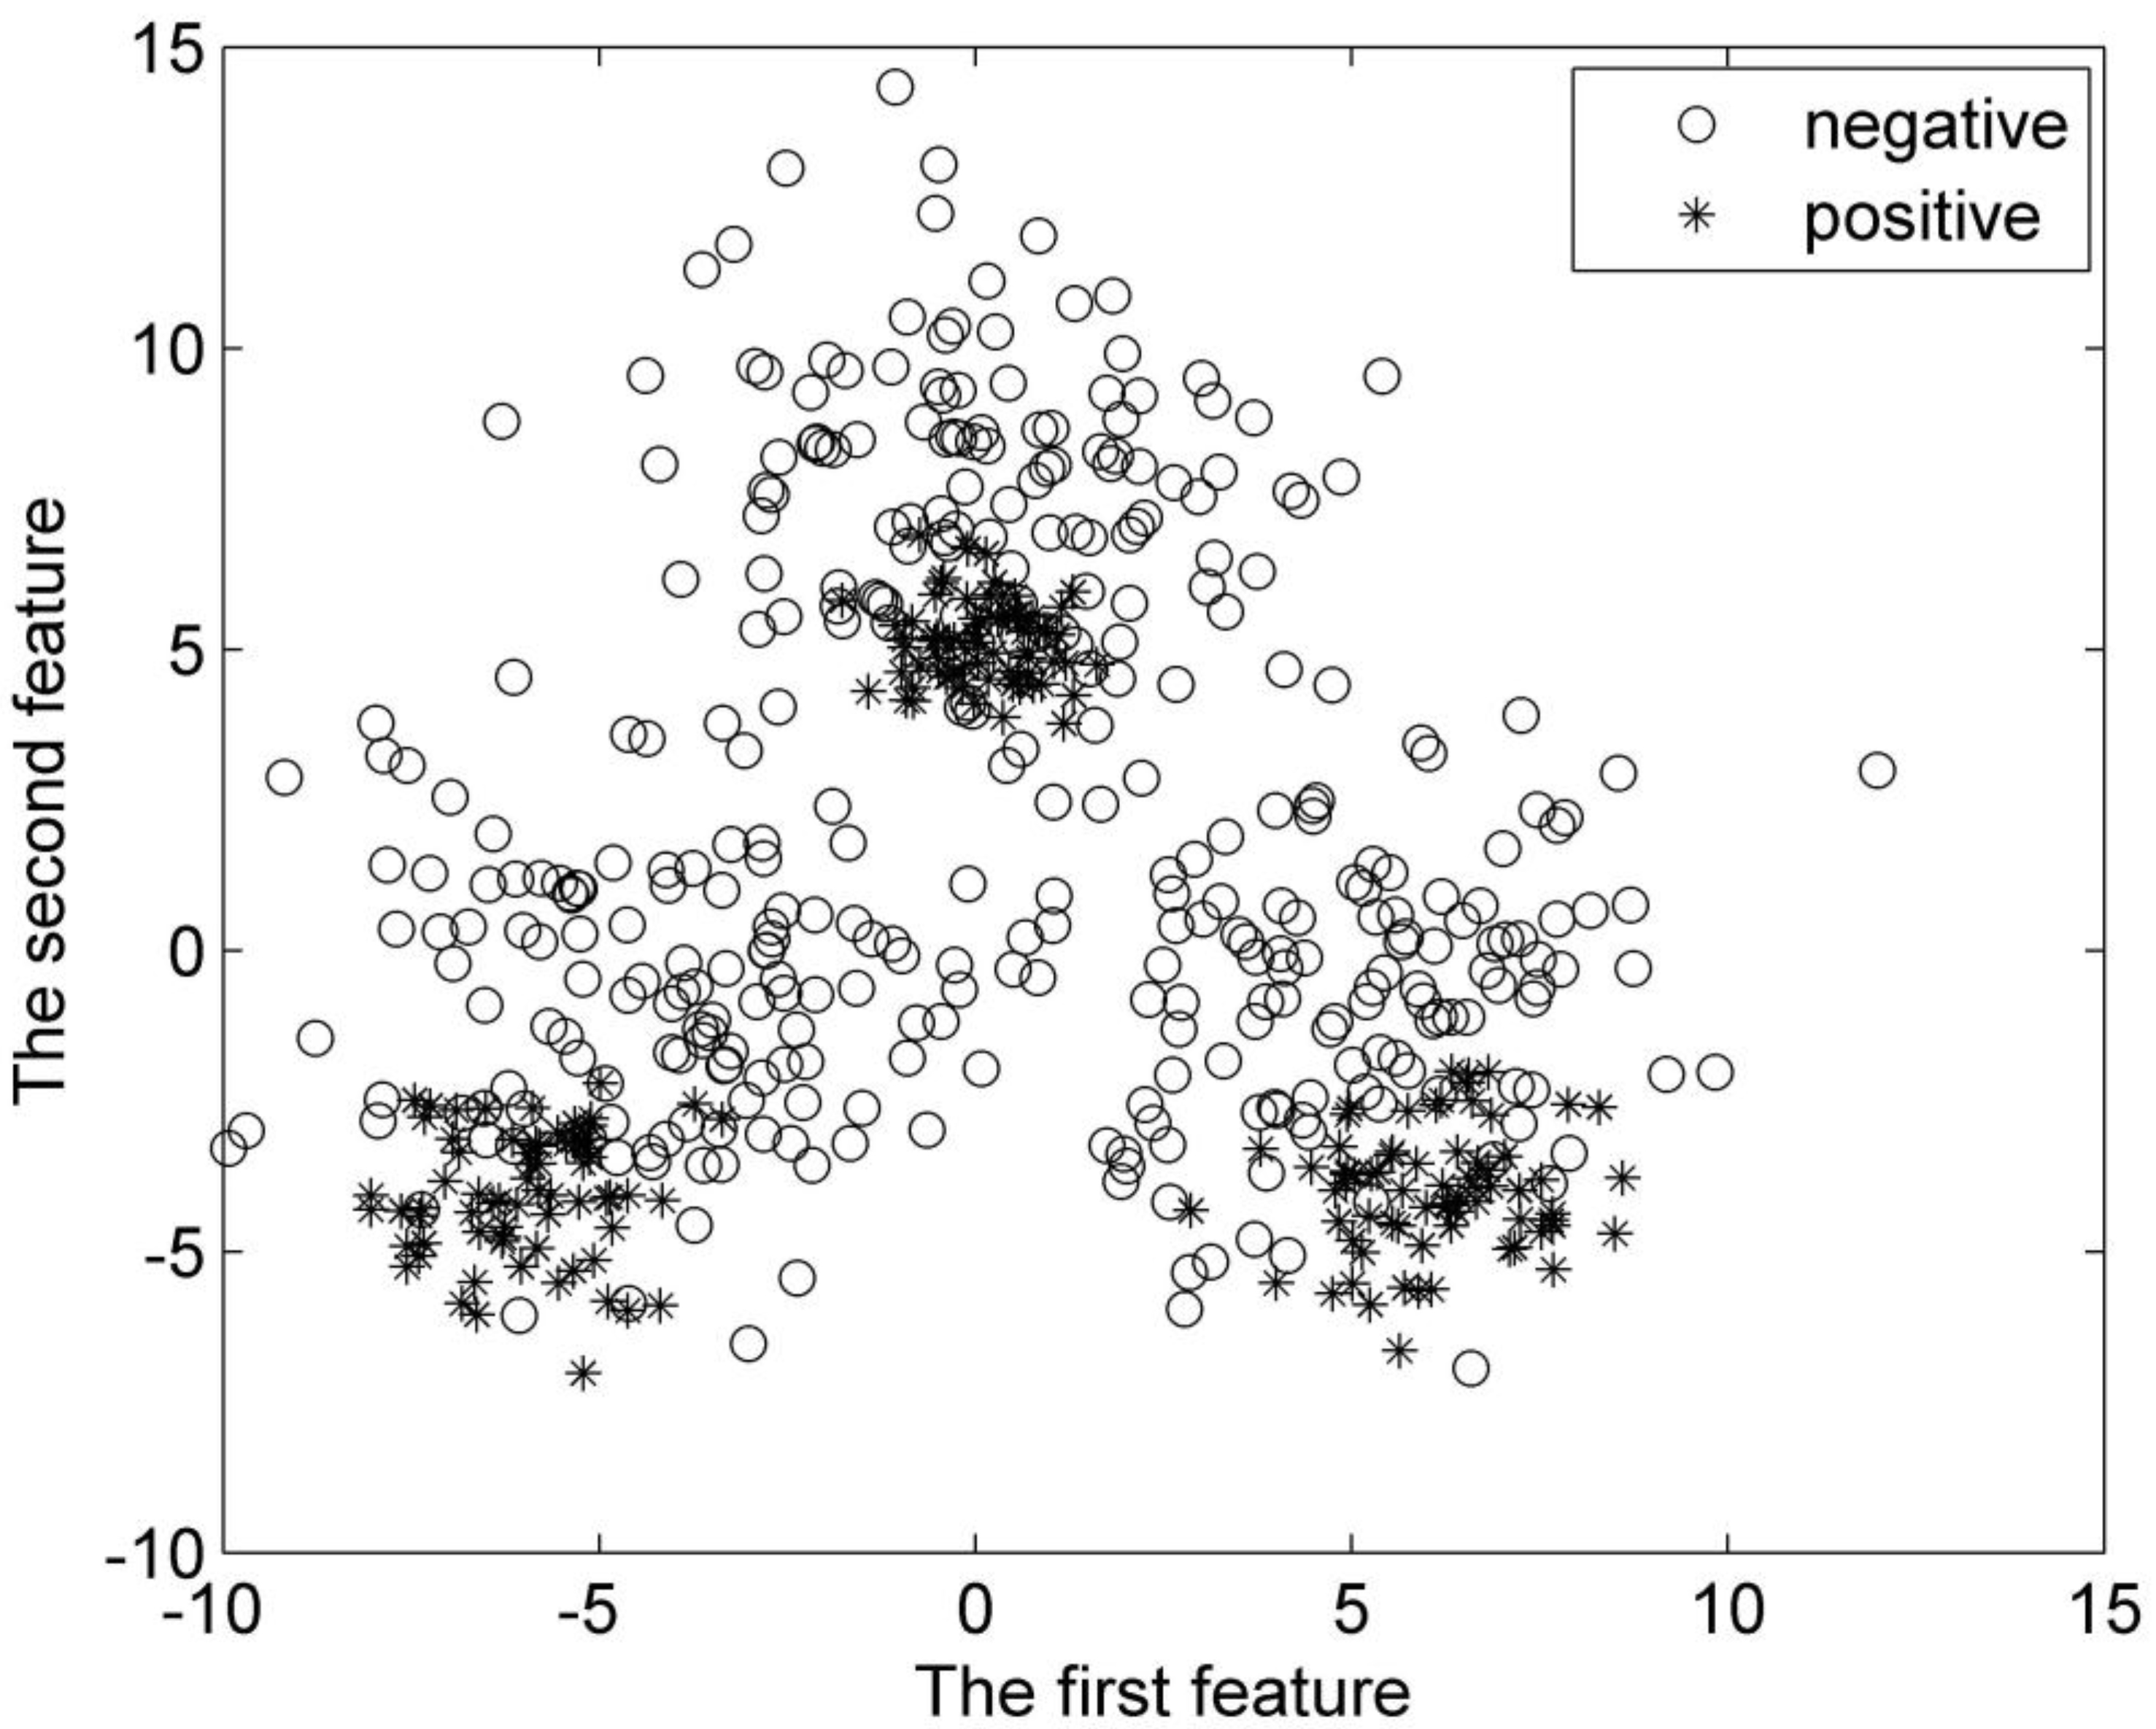
Table 2
Performance of different methods on the second synthetic dataset
| Methods | Acc | TPR | FPR | EVL |
|---|---|---|---|---|
| Linear SVM | 0.85 | 0.96 | 0.27 | 0.82 |
| Polynomial SVM | 0.85 | 0.98 | 0.28 | 0.83 |
| Gaussian SVM | 0.87 | 1 | 0.27 | 0.85 |
| GC-SVM | 0.87 | 0.98 | 0.23 | 0.86 |
| G-FSVM | 0.89 | 1 | 0.22 | 0.89 |
Table 2 lists the Accuracy, TPR, FPR and EVL of each kernel form of SVM, GC-SVM and G-FSVM.
Table 3
Feature values used in G-FSVM
| Feature species | Feature (dimension) |
|---|---|
| Gray feature | 1. Contrast |
| 2. Mean gray | |
| 3. Variance | |
| 4. Third (four)-order | |
| 5. Average gradient | |
| 6. Moment invariants | |
| Geometry feature | 1. Circularity |
| 2. Degree of contraction | |
| 3. Spherical | |
| 4. Fourier descriptors | |
| Texture feature | 1. Mean energy diagram |
| 2. Contrast | |
| 3. Variance of the energy map | |
| 4. Entropy | |
| 5. Energy |
Table 3 lists 63 typical low-level features which were calculated for each region, such as gray values, geometry and texture features, and so on.
Tables 1 and 2 show that: (1) The accuracy of the G-FSVM is better than those of the SVM with different kernels and GC-SVM, up to 2–4 percent. (2) The TPR of the G-FSVM is comparable with or better than those of other methods. (3) The GC-SVM and G-FSVM have a lower FPR than the different kernel SVMs. At 1 TPR, G-FSVM has a 0.15 and 0.22 FRP, which is about 5 percent less than those of SVM with different kernels. (4) G-FSVM has a higher EVL than the others, up to 3 percent more than GC-SVM. From these, it can be concluded that our proposed G-FSVM outperforms the different traditional SVMs and GC-SVM for the EVL measurement.
Furthermore, the proposed method is less sensitive to the parameter selection than the SVM with different kernels. The results of the G-FSVM and GC-SVM presented above is computed by the linear kernels, and nearly the same performance can be calculated by the Gaussian and polynomial kernel.
3.2Clustered microcalcification detection
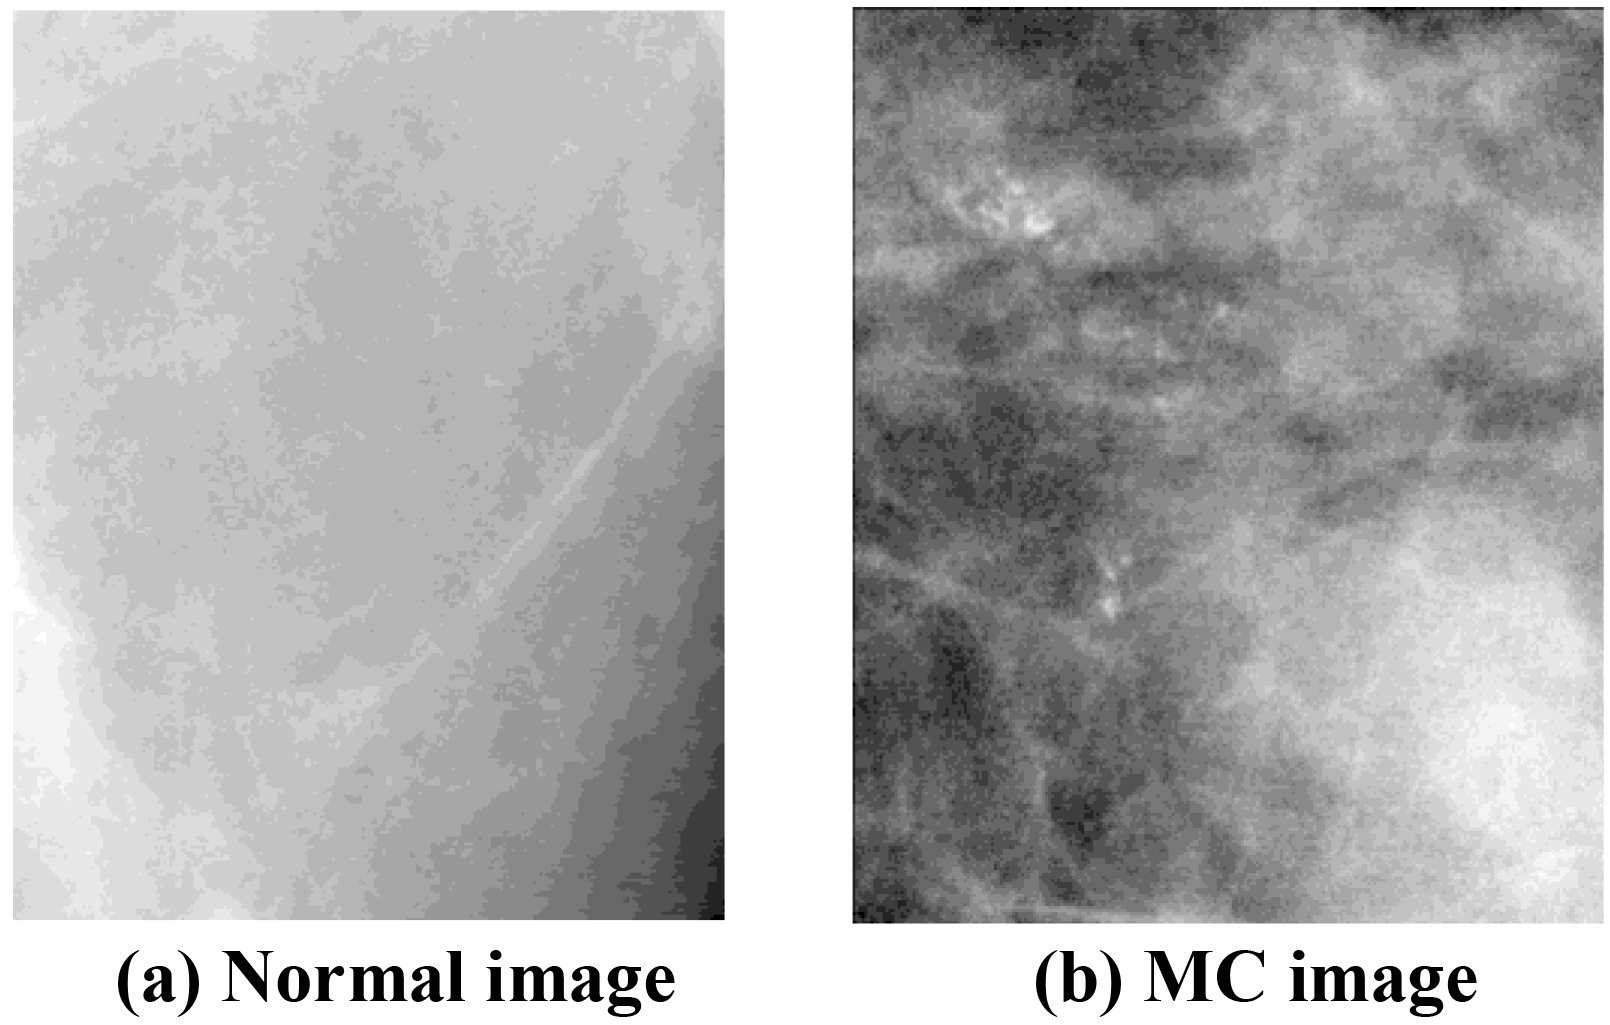
The clustered MC detection data used in this paper comes from the DDSM dataset provided by the U.S. South Florida State University [30]. Suspicious regions of MC were detected by a segmentation algorithm that is described in [31]. The region sizes are variable, from 36*36 to 256*256, based on the detected size of the suspicious regions. Altogether 1,064 suspicious regions were selected from 239 mammography (with 496 positive samples and 568 negative samples). Examples of typical images are displayed in Fig. 7. Then, 63 typical low-level features were calculated for each region, such as gray values, geometry and texture features, and so on, which are grouped and listed in Table 3.
It should be noted that: (1) In EM algorithm, the initial covariance is taken as the sample covariance, and the initial means are estimated by fuzzy c-means method as usual. Additionally, the Gaussian component number of the MC lesions and normal breast tissues samples both are 3, calculated by Eq. (5). (2) The performance of the clustered MC detection data is the average results of five cross-validations.
Table 4 shows that: (1) G-FSVM has the highest accuracy (0.82). (2) The TPR of the G-FSVM is comparable to other methods. (3) The FPR of G-FSVM was nearly 10 percentage points less than GC-SVM, which is much less than those of the different kernel SVMs. (4) As for the EVL measurement, G-FSVM has better performance than all of the other aforementioned methods. It performed up to 4 percent better than our previous method GC-SVM and even better than SVM with different kernels. From Table 4, it can be similarly concluded that our proposed G-FSVM performed superiorly on the clustered MC detection problem for the EVL measurement, which reduced the false positive rate significantly while simultaneously maintaining the true positive rate.
Table 4
Performance of different methods on clustered MC detection
| Methods | Acc | TPR | FPR | EVL |
|---|---|---|---|---|
| Linear SVM | 0.74 | 0.78 | 0.29 | 0.64 |
| Polynomial SVM | 0.75 | 0.79 | 0.29 | 0.67 |
| Gaussian SVM | 0.75 | 0.78 | 0.27 | 0.67 |
| GC-SVM | 0.77 | 0.78 | 0.23 | 0.68 |
| G-FSVM | 0.82 | 0.78 | 0.14 | 0.72 |
Table 4 lists the performance comparisons of some different kernel forms of SVM, GC-SVM and G-FSVM on clustered MC detection.
Figure 7.
Breast tissue images.
4.Conclusion
This paper presents a novel integrated classification framework to detect clustered MC called grouped Fuzzy SVM with EM-based partition of sample space (G-FSVM). The design of G-FSVM is aimed at the diversity of data structures of MC lesions and the variability of normal breast tissues. Specifically, the sample of the training space is considered to be generated from a GMM, with EM algorithm the training input sets of the MC lesions and normal breast tissues are partitioned into several groups, respectively. The partition of sample space based on EM maintains the structural diversity information of the sample space, which provides as much information as possible for the sub space classifier. After partition, each groups of the samples of MC lesions and normal breast tissues is combined to train a suitable sub classifier, and the MC detection problem is decomposed into serial simple two-class classification sub problems, which successfully characterizes the diversified sub-patterns of the sample space. Furthermore, to quantify the contribution of different samples, fuzzy SVM are employed as sub classifier of the final integrated classification. The fuzzy membership is defined by the probability of the samples belonging to the subset of sample space by EM estimation, which can denote the importance of the sample to the sub classifier. In this way, different samples with the proper levels of contribution are trained to the integrated fuzzy SVM to make the classification more effective. The experimental results show that our integrated classification framework achieves a significant reduction in the false positive detection rate while also preserving the true positive detection rate as compared to the different kernel SVMs and the GC-SVM for the detection of clustered MC problem.
In future work, it would be interesting to integrate the grouped features to our proposed algorithm for clustered MC detection, which may obtain more useful prior knowledge both from inhomogeneous feature space and structural diversity sample space. We will also hope that G-FSVM can be applied to many real-world applications.
Conflict of interest
None to report.
Acknowledgments
This work was supported by the Scientific Research Program Funded by Shaanxi Provincial Education Department (Program No.15JK1738); by the Science Research Project of Northwest University (Natural Science Foundation, Program No.13NW36).
References
[1] | Huang YJ, Chan DY, Cheng DC, Ho YJ, Tsai PP, Shen WC, et al. Automated feature set selection and its application to MCC identification in digital mammograms for breast cancer detection. Sensors. (2013) ; 13: (4): 4855-75. |
[2] | Arodź T, Kurdziel M, Popiela TJ, Sevrec EO, Yuen DA. Detection of clustered microcalcifications in small field digital mammography. Comput Meth Prog Bio. (2006) ; 81: (1): 56-65. |
[3] | Kopans DB. Breast Imaging. 3rd ed. Lippincott Williams & Wilkins; (2006) . |
[4] | Cheng HD, Cai X, Chen X, Hu L, Lou X. Computer-aided detection and classification of microcalcifications in mammograms: a survey. Pattern Recogn. (2003) ; 36: (12): 2967-91. |
[5] | Dehghan F, Abrishami-Moghaddam H. Comparison of SVM and neural network classifiers in automatic detection of clustered microcalcifications in digitized mammograms. Proceedings of 2008 International Conference on Machine Learning and Cybernetics; 2008 July 12-15; (2008) . p. 756-61. |
[6] | Ren J, Wang D, Jiang J. Effective recognition of MCCs in mammograms using an improved neural classifier. Eng Appl Artif Intel. (2011) ; 24: (4): 638-45. |
[7] | Rangayyan RM, Ayres FJ, Desautels JEL. A review of computer-aided diagnosis of breast cancer: Toward the detection of subtle signs. J Franklin I. (2007) ; 344: (3-4): 312-48. |
[8] | Zhang E, Wang F, Li Y, Bai X. Automatic detection of microcalcifications using mathematical morphology and a support vector machine. Bio-Med Mater Eng. (2014) ; 24: (1): 53-9. |
[9] | Wei L, Yang Y, Nishikawab RM. Microcalcification classification assisted by content-based image retrieval for breast cancer diagnosis. Pattern Recogn. (2009) ; 42: (6): 1126-32. |
[10] | Li Y, Jiang J. Combination of SVM knowledge for microcalcification detection in digital mammograms. Proceedings of the 5th International Conference on Intelligent Data Engineering and Automated Learning-IDEAL. 2004 Aug. 25-27; UK: Exeter; (2004) . p. 359-65. |
[11] | Zhang X, Wang M, Yu F. A SVM approach for MCs detection by embedding GTDA subspace learning. Advances in Electronic Engineering, Communication and Management. Springer Berlin Heidelberg; (2012) . p. 89-94. |
[12] | Chang TT, Liu HW, Wang Y, Feng J. Clustered microcalcification detection based on a multiple kernel support vector machine with grouped features. Proceedings of the 19th International Conference on Pattern Recognition. IEEE. 2008 Dec. 8-11; (2008) . p. 1-4. |
[13] | Zhang X. Hybrid subspace fusion for microcalcification clusters detection. J Fiber Bioeng Inform. (2015) ; 8: (1): 161-9. |
[14] | Xue H, Chen S, Yang Q. Structural regularized support vector machine: a framework for structural large margin classifier. IEEE T Neural Networ. (2011) ; 22: (4): 573-87. |
[15] | Qi Z, Tian Y, Shi Y. Structural twin support vector machine for classification. Knowl-Based Syst. (2013) ; 43: : 74-81. |
[16] | Pan X, Luo Y, Xu Y. K-nearest neighbor based structural twin support vector machine. Knowl-Based Syst. (2015) ; 88: : 34-44. |
[17] | Yeung DS, Wang D, Ng WWY, Tsang EEC, Wang X. Structured large margin machines: sensitive to data distributions. Mac Learn. (2007) ; 68: (2): 171-200. |
[18] | Lin CF, Wang SD. Fuzzy support vector machines. IEEE T Neural Networ. (2002) ; 13: (2): 464-71. |
[19] | Wang Y, Wang S, Lai KK. A new fuzzy support vector machine to evaluate credit risk. IEEE T Fuzzy Syst. (2005) ; 13: (6): 820-31. |
[20] | Bansal P, Kant A, Kumar S, Sharda A, Gupta S. Improved hybrid model of HMM/GMM for speech recognition. Ithea. (2008) ; 69-74. |
[21] | Wang H, Guo P, Feng J, Ren Y. Classification based on clustered group SVM. Proceedings of 2010 Chinese Conference on Pattern Recognition. IEEE, 2010 Oct. 21-23; China: ChongQing; (2010) . p. 1-5. |
[22] | Abbas OA. Comparisons between data clustering algorithms. Int Arab J Inf Techn. (2008) ; 5: (3): 320-5. |
[23] | McLachlan G, Peel D. Finite mixture models. 1st ed. Wiley Series in Probability and Statistics; (2000) . |
[24] | Zhao Q, Hautamäki V, Kärkkäinen I, Fränti P. Random swap EM algorithm for Gaussian mixture models. Pattern Recogn Let. (2012) ; 33: : 2120-6. |
[25] | Fraley C, Raftery AE. Model-based clustering, discriminant analysis, and density estimation. J Am Stat Assoc. (2011) ; 97: (458): 611-31. |
[26] | Akaike H. A new look at the statistical model identification. IEEE T Automat Contr. (1974) ; 19: (6): 716-23. |
[27] | Chawla NV, Bowyer KW, Hall LO, Kegelmeyer WP. SMOTE: synthetic minority over-sampling technique. J Artif Intell Res. (2002) ; 16: (3): 321-57. |
[28] | Zhang X, Xiao XL, Xu GY. Fuzzy support vector machine based on affinity among samples (in Chinese). J Software. (2006) ; 17: (5): 951-8. |
[29] | Duda RO, Hart PE, Stork DG. Pattern classification. 2nd ed. New York: John Wiley & Sons; (2001) . |
[30] | |
[31] | Wang Y. A computer aided detection system based on SVM. [Dissertation] Xidian University; (2008) . |


