
Paroxysmal atrial fibrillation recognition based on multi-scale Rényi entropy of ECG
Abstract
BACKGROUND:
Atrial fibrillation (AF) is a common type of arrhythmia disease, which has a high morbidity and can lead to some serious complications. The ability to detect and in turn prevent AF is extremely significant to the patient and clinician.
OBJECTIVE:
Using ECG to detect AF and develop a robust and effective algorithm is the primary objective of this study.
METHODS:
Some studies show that after AF occurs, the regulatory mechanism of vagus nerve and sympathetic nerve will change. Each R-R interval will be absolutely unequal. After studying the physiological mechanism of AF, we will calculate the Rényi entropy of the wavelet coefficients of heart rate variability (HRV) in order to measure the complexity of PAF signals, as well as extract the multi-scale features of paroxysmal atrial fibrillation (PAF).
RESULTS:
The data used in this study is obtained from MIT-BIH PAF Prediction Challenge Database and the correct rate in classifying PAF patients from normal persons is 92.48%.
CONCLUSIONS:
The results of this experiment proved that AF could be detected by using this method and, in turn, provide opinions for clinical diagnosis.
1.Introduction
Atrial fibrillation (AF) is a common type of arrhythmia diseases. It has high morbidity rates with the ability to induce strokes, thrombus, and many other serious complications [1]. Nearly half of the individuals that suffer from AF suffer from paroxysmal atrial fibrillation (PAF) and after repeated occurrence of AF, these patients always turn to persistent atrial fibrillation. Studies show that the change in vagus nerve may be an important factor related to the onset and termination of PAF. Therefore, the analysis of heart rate variability (HRV) signals [2] has been regarded as a non-invasive, but effective method of reflecting the status of autonomic nervous systems.
The main methods used in HRV analysis are time-domain, frequency domain, and non-linear [3, 4, 5, 6, 7]. The time-domain method proposes limitations on the fluctuation of heart rate. The frequency-domain method is solely based on a steady model; therefore it cannot show important detailed characteristics of HRV. In recent years, wavelet transform and empirical mode decomposition (EMD) have been widely used. They analyze signal’s time-frequency characteristics [6, 7, 18]. Wavelet transform can decompose the signal into different frequency bands by convolving a signal with a wavelet basis function, leading to good time-frequency localization ability. The 0.04
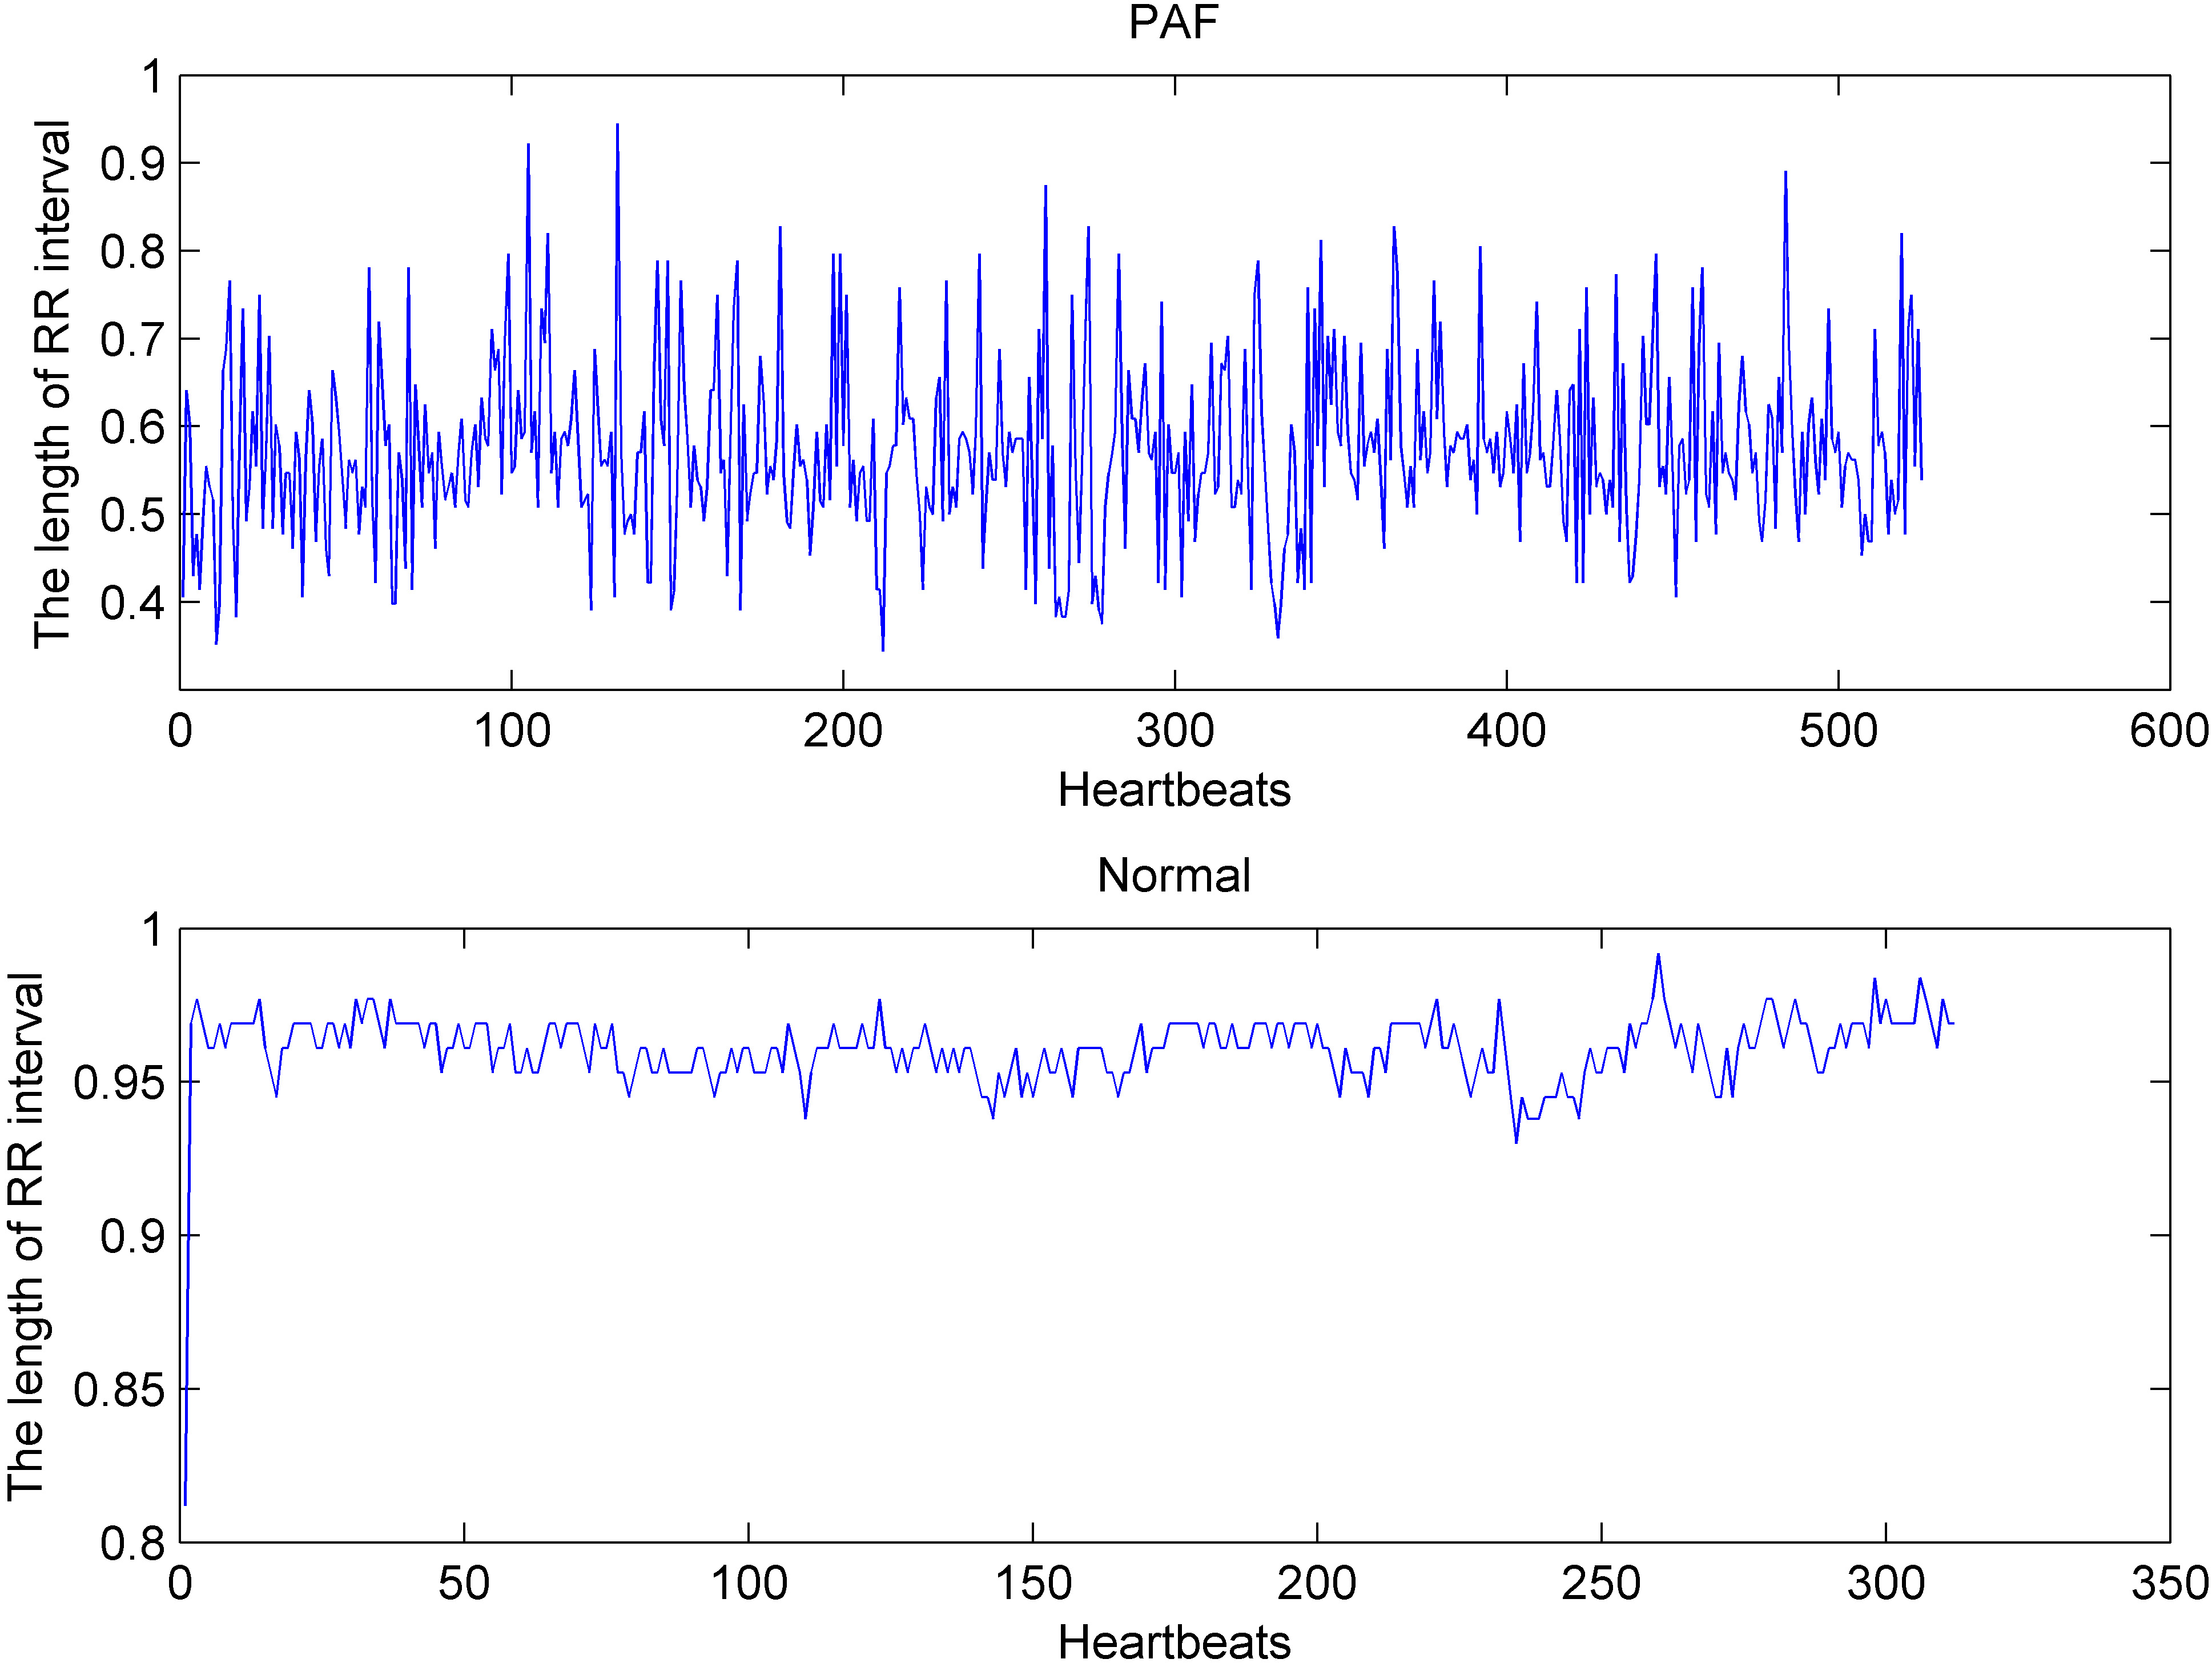
The HRV signal of healthy people can show slight fluctuations, but HRV signals are nonlinear and not stationary. The two figures shown are the p08c signal and the n08c signal from the MIT-BIH PAF Prediction Challenge Database. As shown in Fig. 1, the fluctuations will become violent and chaotic when PAF occurs. Nowadays, the chaotic theory is being widely used. Rudolf Clausius developed entropy, which has been used to signal the analysis area to characterize the complexity of a system or signal [16]. The analysis of fractal structure and complexity of HRV signals based on entropy [5, 9, 12] and other nonlinear methods have been extremely popular throughout the world. Wavelet transform methods lacked the analysis of the chaos of HRV signals. The nonlinear analysis lacked detailed information because it could only show chaos on the whole level; therefore, we considered proposing a method combining both of them.
Figure 1.
HRV signals of PAF patients and normal people.
2.Method
Wavelet transform has been widely used in the analysis of HRV signals since Vetterli first applied it in filter [17]. Therefore, we have the ability to obtain different frequency signals by using wavelet transform. Entropy can describe the chaos levels of a signal as well as measure the level of complexity in the nonlinear dynamics area [9, 12]. Zero entropy denotes that the system is well regulated, while infinity entropy means that the system is completely chaotic. The Rényi entropy [10] is a generalized form of Shannon and other kinds of entropy, but the Rényi entropy often has a better performance than any of them. Based on the physiological characteristics of PAF signal, in order to extract features of HRV signal we proposed a multi-scale Rényi entropy by combining both the wavelet transform and Rényi entropy methods. After this, in order to detect and determine PAF signals with health signals, as well as signals that are far away from PAF, we used the support vector machine (SVM) method.
2.1Multi-scale Rényi entropy
Because the wavelet analysis relies on multi-scale analysis, it reflect the potential information of HRV signals much better when combined with Rényi entropy calculation. The procedures of the proposed method are listed below:
• First, make m-scale discrete wavelet transform on HRV signals. The discrete wavelet function
(1)
Where
Thus, the discrete wavelet coefficients
(2)
Where
If the wavelet coefficient vector on scale
(3)
Then
• Mixing the wavelet coefficient on scale j, the Rényi entropy of order
(4)
(5)
• Here the Rényi entropy is a generalized form of Shannon and other kinds of entropy. Rényi entropy with different parameter
2.2Implement method
In this paper, we proposed a multi-scale Rényi entropy method for feature extraction of HRV signals and then applied it on PAF recognition and classification. In order to obtain HRV signals, we first have to complete preprocessing on the original ECG signals to remove the noises. Then to accurately specify PAF, we extract the different characteristics of HRV signals using Rényi entropy. Last, a classifier will be trained with the train dataset to classify the test dataset by the feature of signals. The proposed method is described in Fig. 2:
Figure 2.
Algorithm flow chart.
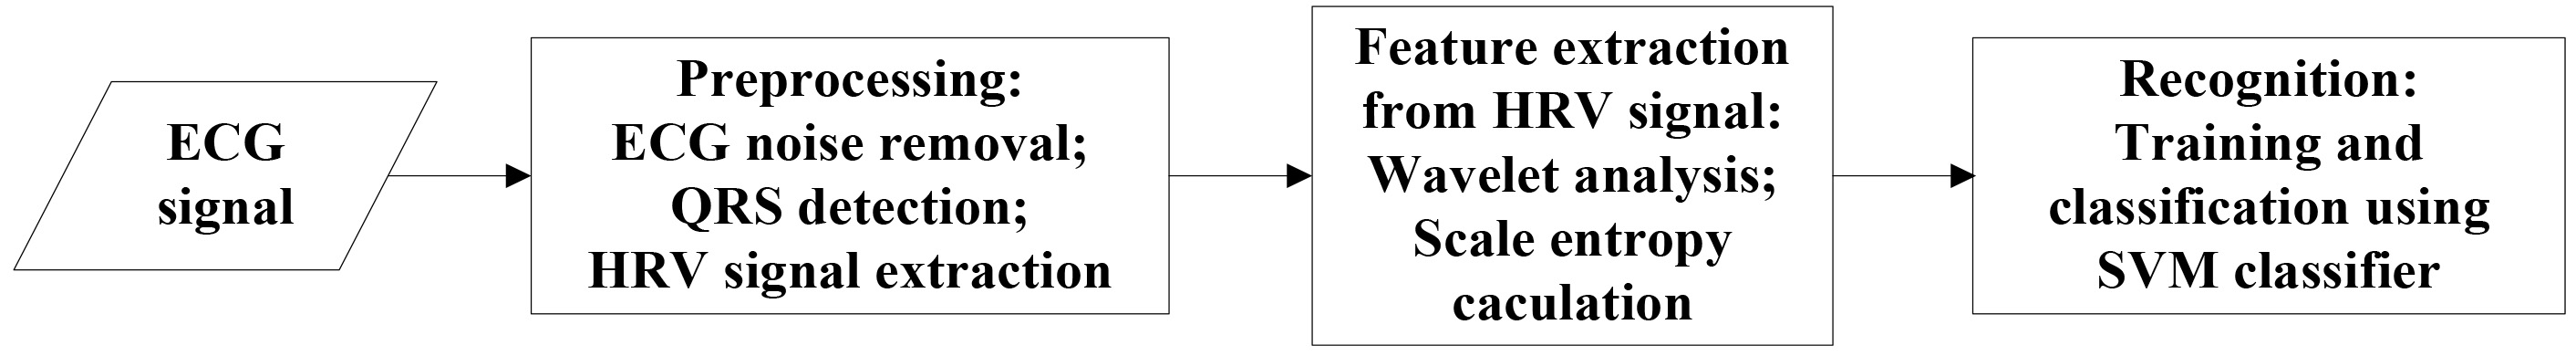
1. Data Preprocessing: Power line interference, electrical interference, and baseline wander noises often interfered with the original ECG signal noises. First of all, a 5
2. Feature extraction: First, select the best wavelet function to decompose signal based on the characteristics of HRV. Then choose order q and calculate the Rényi entropy of each scale as figure 1.1 mentioned. By doing this, we were able to obtain the feature vectors for classification.
3. Recognition of PAF: Use SVM to classify selected features of PAF signals into two groups with normal and far PAF signals. The kernel function is a Radial Basis Function.
3.Results and discussion
In this paper, to verify our method we used the MIT-BIH PAF Prediction Challenge Database. The entire dataset includes 50 normal ECG signals, 25 normal PAF signals, and 25 signals that are far away from PAF. In order to classify as a signal far away from PAF, the sample must not have any PAF occurring within 45 minutes before and after sampling signals. A normal signal is marked with the letter n (n08). A signal coming from a patient begins with the letter p and ends with the letter c. An odd middle digit indicates that the signal is far away from PAF. On the contrary, the signal is a PAF signal if it is even. All signals are five minutes long and the sampling frequency is 128 Hz.
First, as described above, a 5
Three statistics were calculated to show the results of the classification: correct rate, sensitivity, and specificity [15].
(6)
(7)
(8)
The five-fold-cross-validation method was employed 100 times per classification in order to avoid excessive fitting and improve upon the credibility of the classification results. As mentioned previously, in order to get a better classification results, the most appropriate
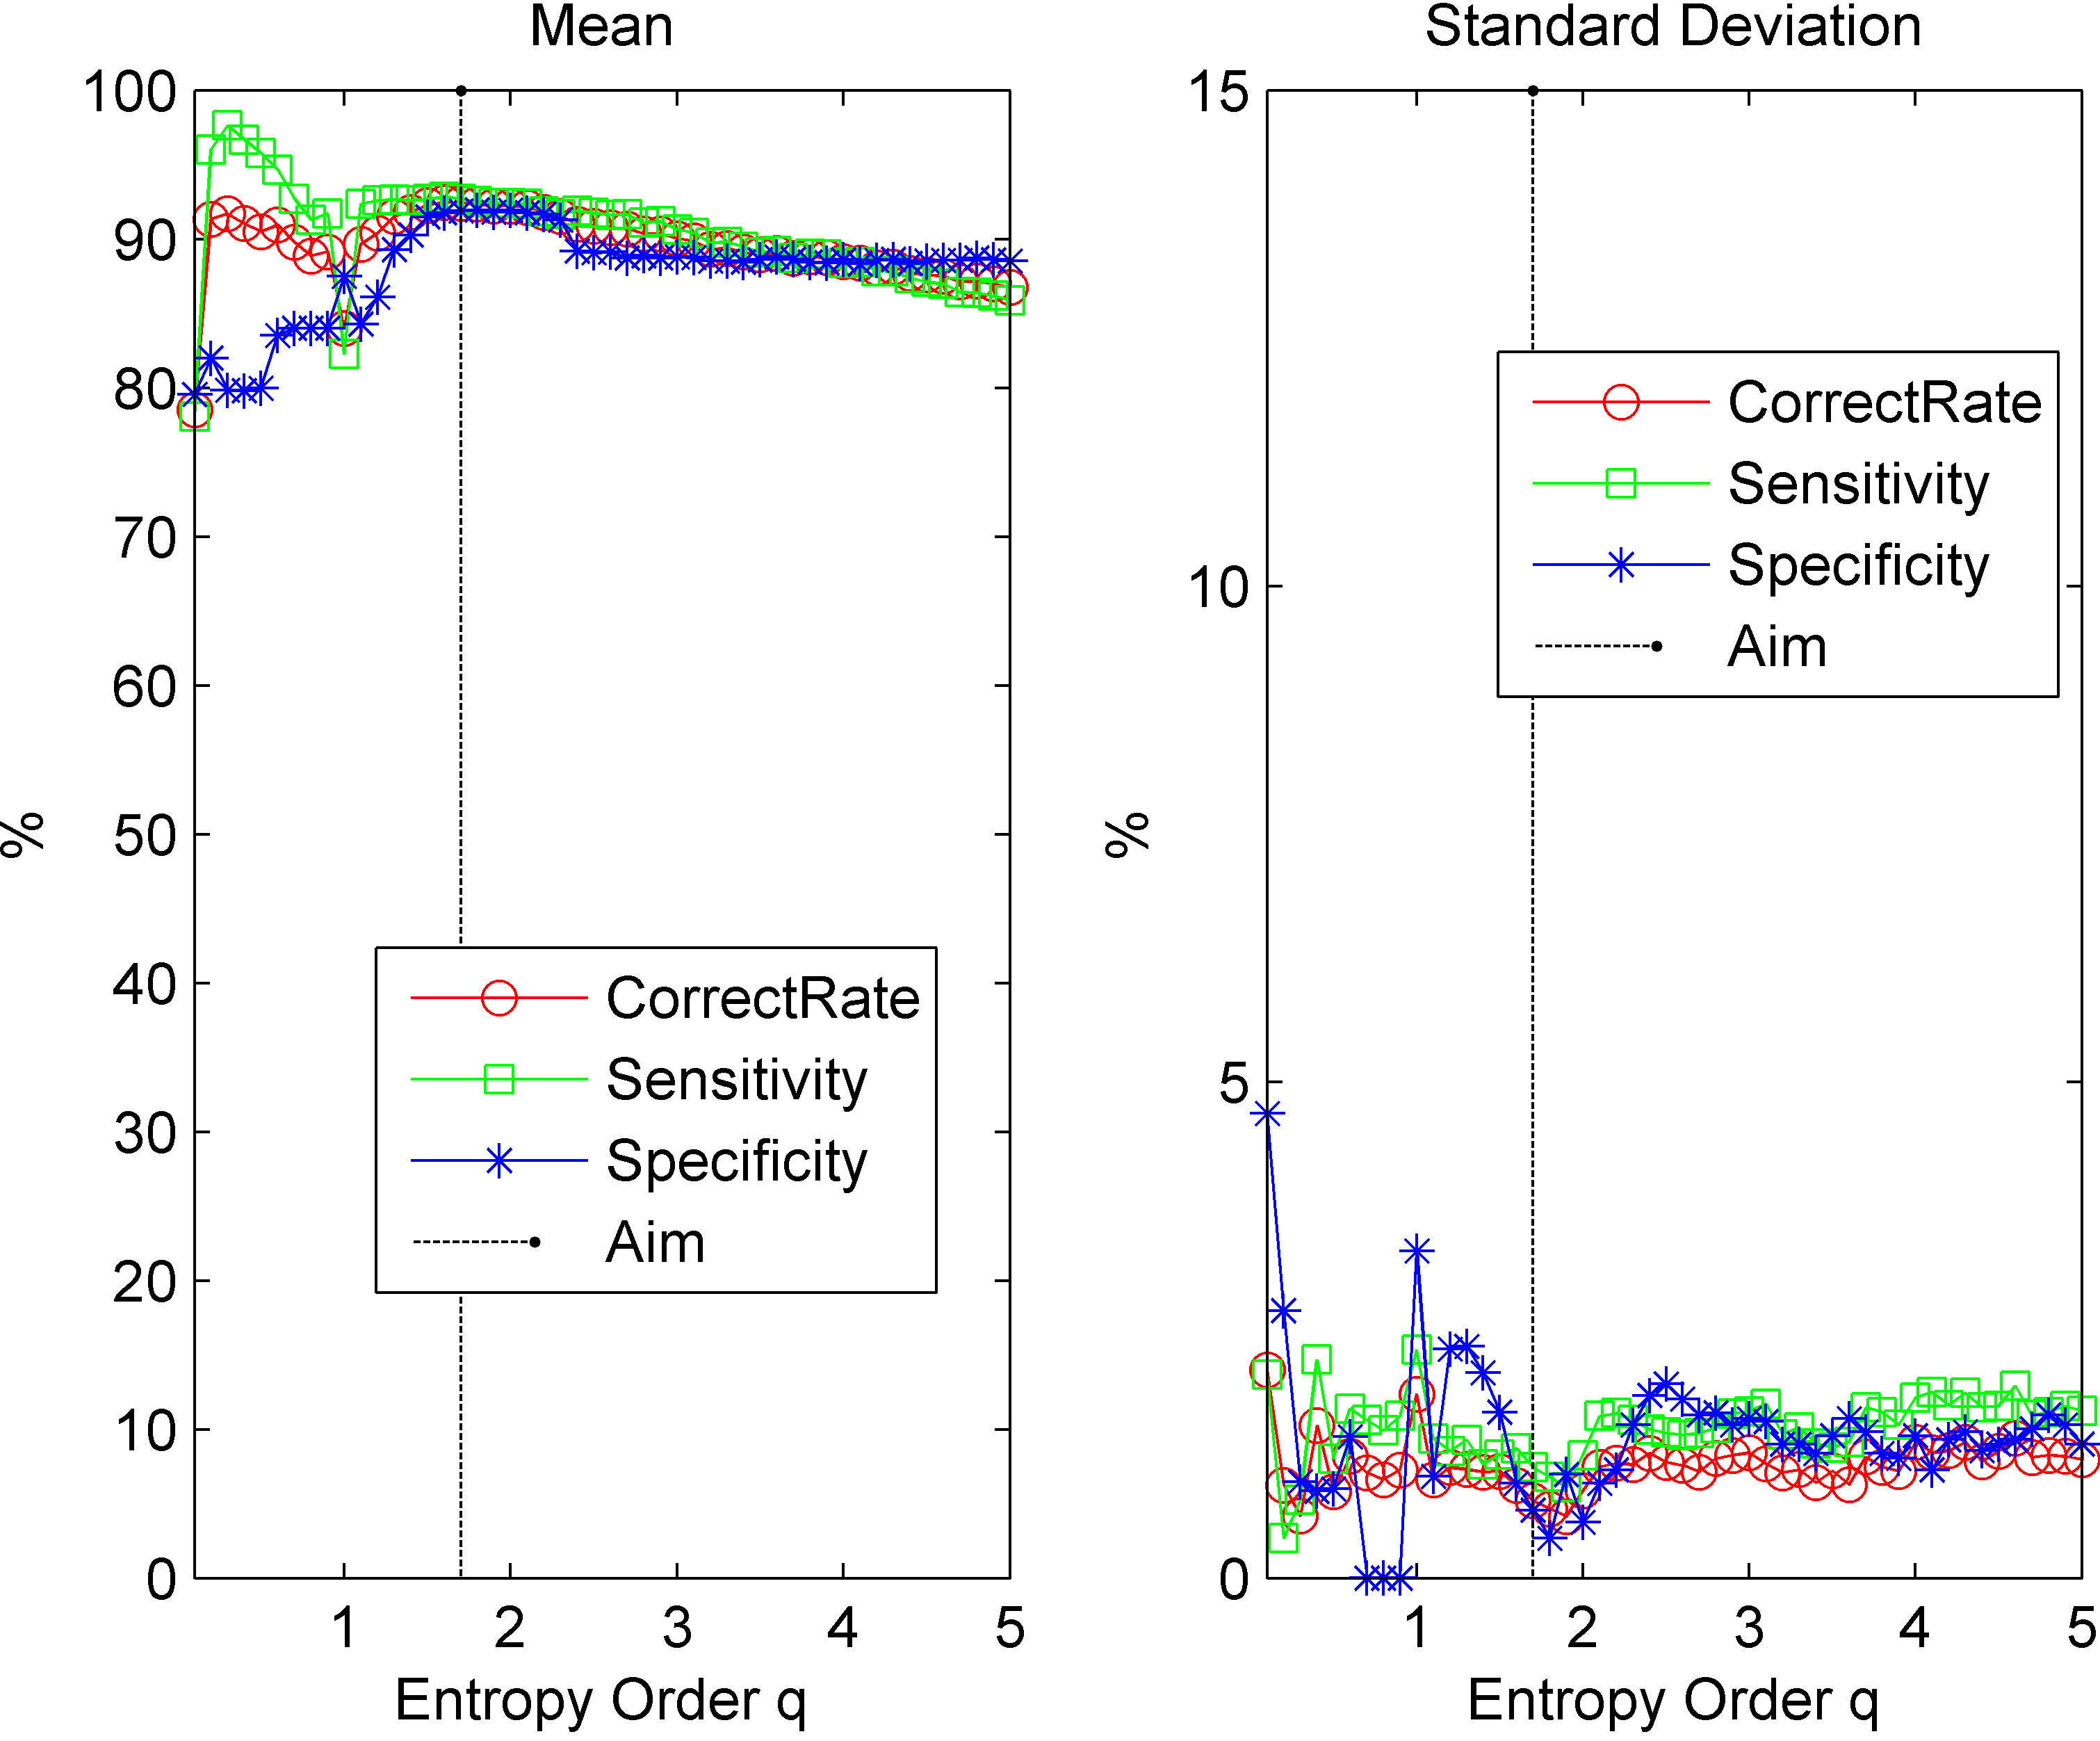
Figure 3 shows the results of the first experiment where a classification of 50 normal HRV signals and 25 PAF signals was conducted. The left chart indicates the average values of the correct rate, sensitivity, and specificity of the classification. The right chart indicates the standard deviation of these values. Figure 3 suggests that the results were quite steady when
With the parameter set at
Table 1
Comparing the features (the entropy of each scale) of Normal signal and PAF signal
| Level | Normal | PAF | T-test (p-value) |
|---|---|---|---|
| L1 | 7.3338e-06 | ||
| L2 | 2.6657e-06 | ||
| L3 | 3.0438e-05 | ||
| L4 | 5.5874e-05 | ||
| L5 | 0.0047 | ||
| L6 | 0.0036 | ||
| L7 | 0.0026 | ||
| L8 | 0.0051 |
Figure 3.
Classification results of PAF and normal signals.
In Table 1, the P value reflects the otherness of the entropy in the same scale between two samples.
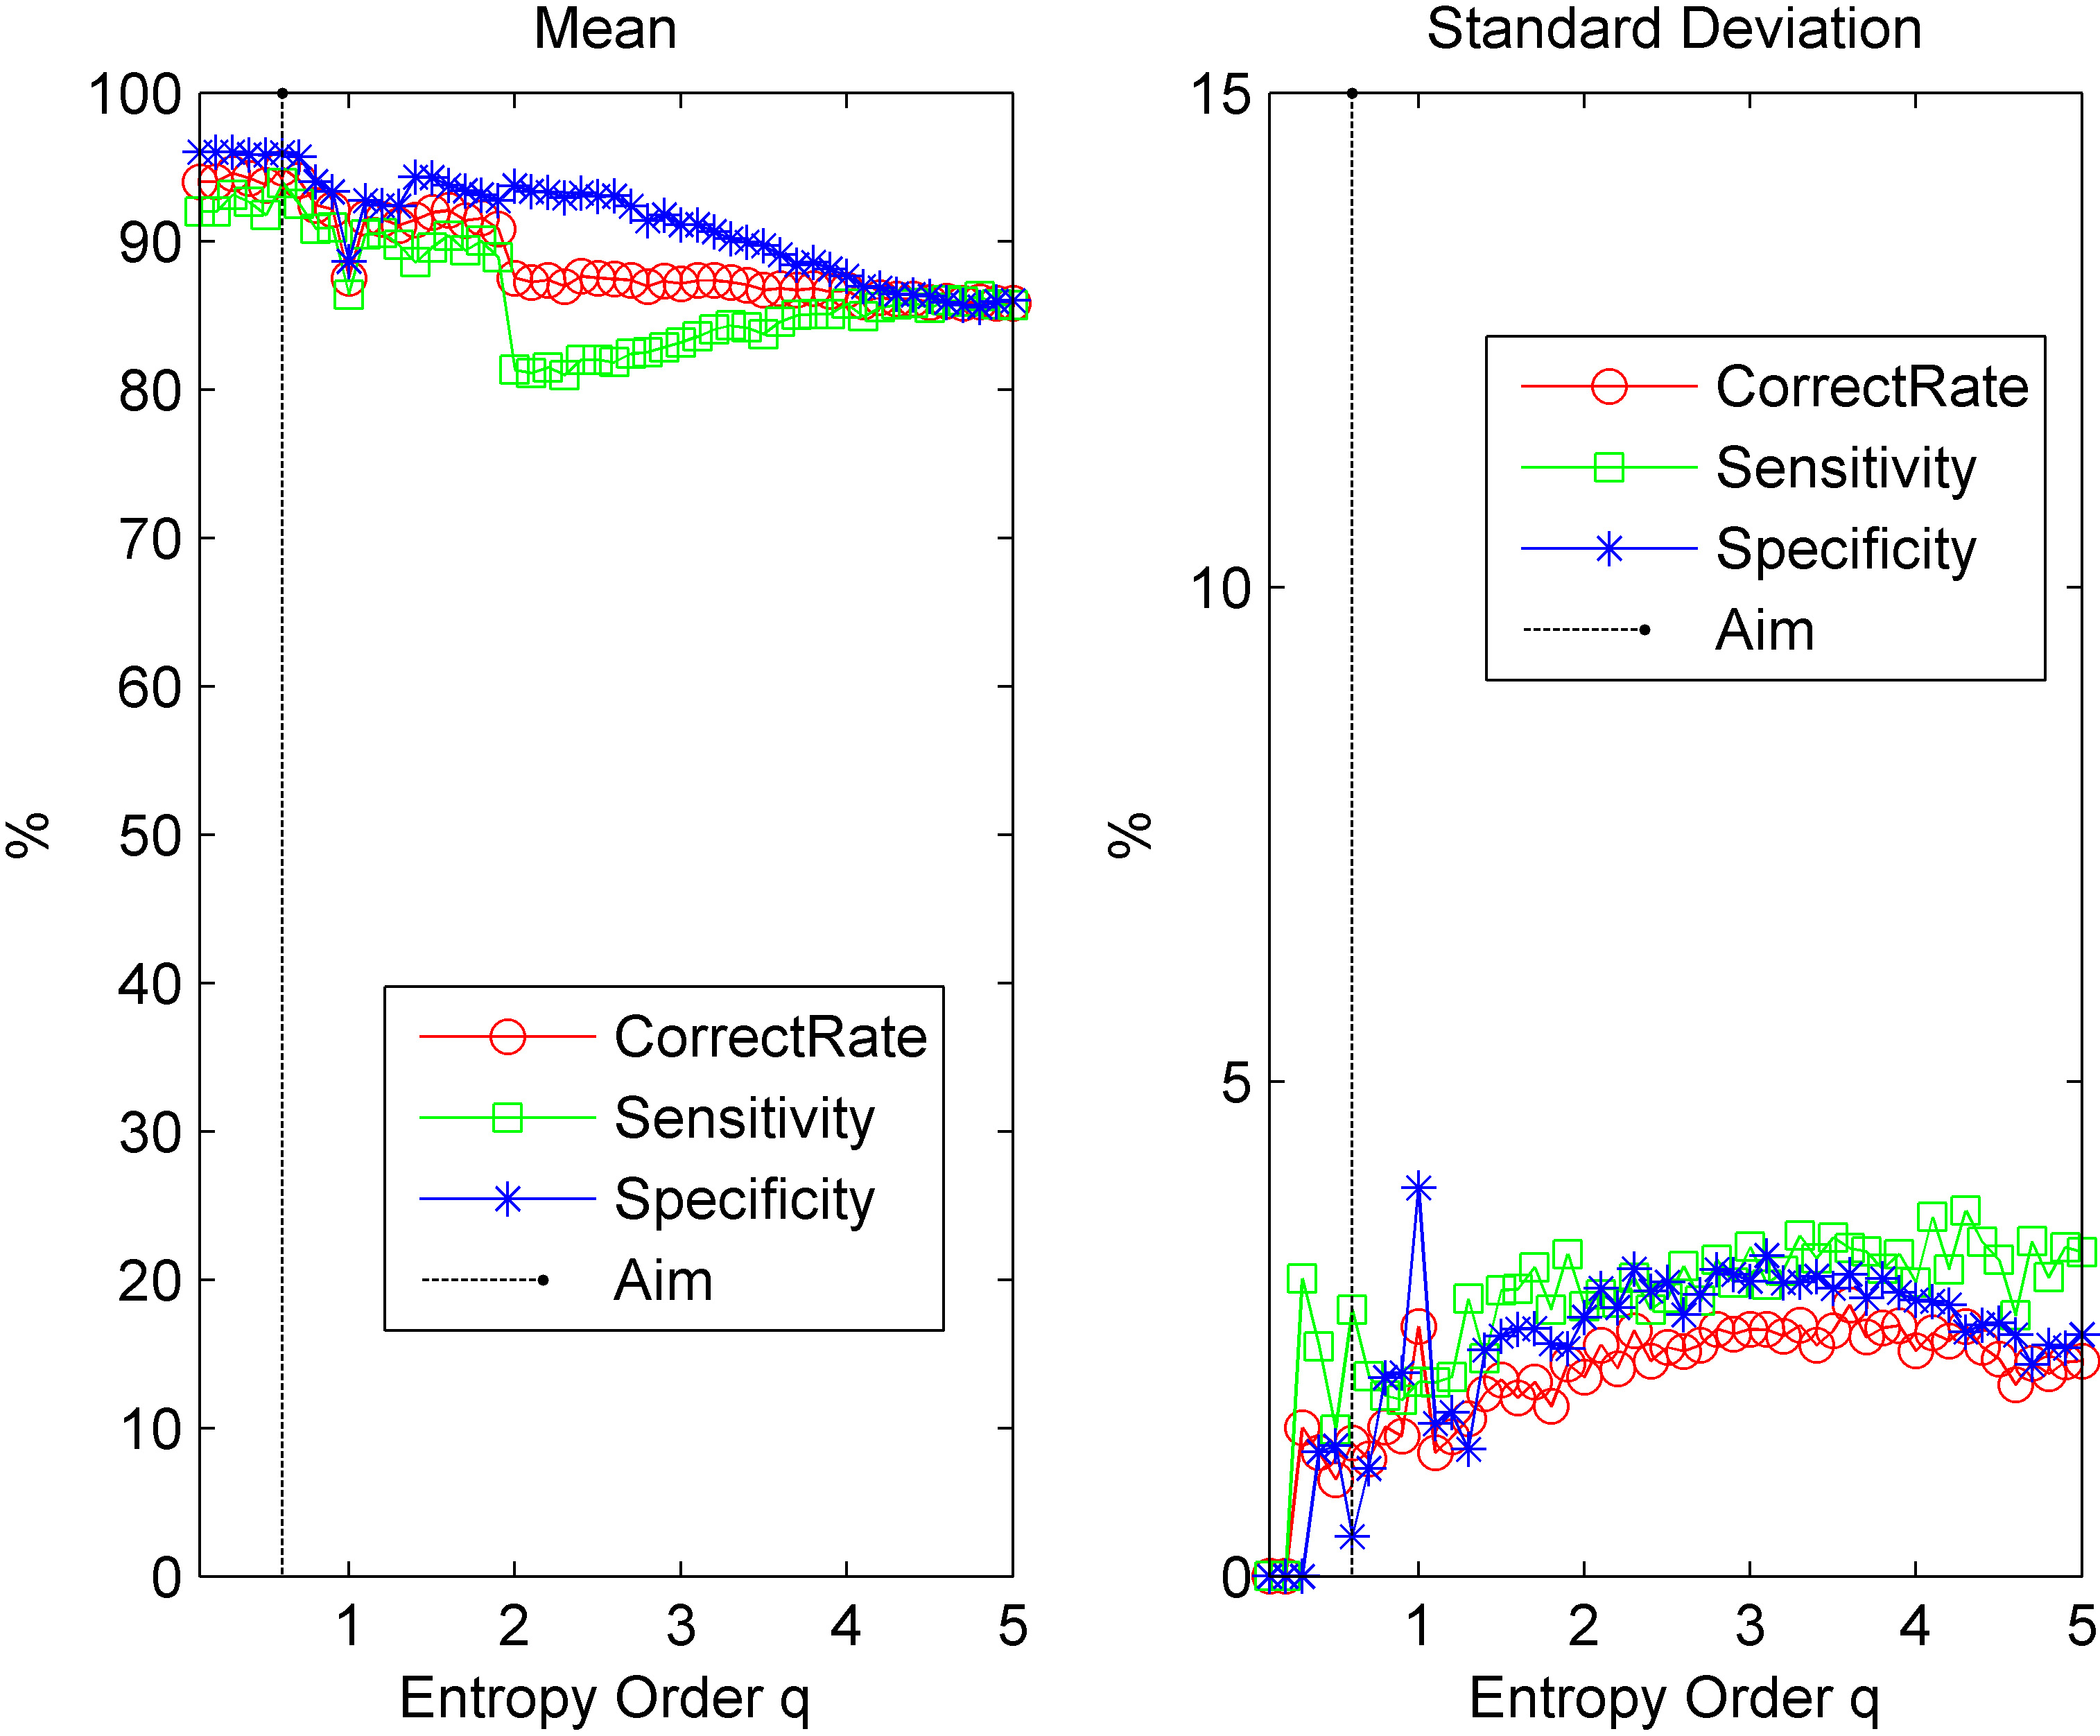
Then, the same experiment of 25 PAF signals and 25 signals far away from PAF was completed. The left chart in Fig. 4 indicates the mean values of the correct rate, sensitivity, and specificity of the classification and the right chart indicates is the standard deviation of these values. In Fig. 4 we can find that when
Table 2
Comparing the features (the entropy of each scale) of Far away from PAF signals and PAF signals
| Level | Far away from PAF | PAF | T-test (p-value) |
|---|---|---|---|
| L1 | 17.3134 | 19.7883 | 2.8482e-08 |
| L2 | 15.9941 | 18.3143 | 2.6428e-08 |
| L3 | 14.4490 | 16.8167 | 2.9309e-08 |
| L4 | 13.6736 | 15.8650 | 1.5506e-07 |
| L5 | 12.9384 | 14.8009 | 8.1806e-07 |
| L6 | 12.3516 | 14.3659 | 8.7663e-07 |
| L7 | 11.6949 | 14.0699 | 4.7931e-09 |
| L8 | 11.4185 | 13.9405 | 1.1491e-08 |
Figure 4.
Classification results of PAF and signals far away from PAF.
In this experiment, the two-sided student’s t test was also used to ensure that the results were reliable. In Table 2, the value of parameter was set to 0.6. L1-L8 represents eight scale of wavelet decomposition.
The P value in Table 2 shows the otherness of the entropy in the same scale between the two samples. It shows that in every scale, the entropy value of PAF signal is much higher than the far away from PAF value. It also related with the complexity of vagus activity.
4.Conclusions
In this paper, we obtained satisfying results by combined the wavelet analysis with nonlinear entropy in order to propose a feature extraction algorithm for PAF recognition. The disadvantages of traditional time-frequency analysis can be overcome by calculating the Rényi entropy of different scales. Considering the physiological characteristics of PAF, the Multi-scale Rényi entropy combines the multi resolution and local feature ability of Wavelet Transform with the entropy in information theory. By doing this, the characteristics of vagus nerve activity will be quantified. With our experimental approach, we were able to successfully classify the PAF signals with normal or far away signals. The results presented throughout this paper show that the application of this method is successful in real-time monitoring of AF patients, as well as prediction and diagnosis of PAF.
Conflict of interest
None to report.
Acknowledgments
This work is supported by the Funding for Basic Research in Beijing Institute of Technology.
References
[1] | Wolf PA, Abbott RD, Kannel WB. Atrial fibrillation as an independent risk factor for stroke: the Framingham Study. Stroke; a journal of cerebral circulation. (1991) ; 22: (8): 983-8. |
[2] | Omerbegovic M. Analysis of Heart Rate Variability and Clinical Implications. Medical Archives. (2009) ; 63: (2): 102-5. |
[3] | Evrengül H, Tanriverdi H, Dursunoglu D, et al. Time and frequency domain analyses of heart rate variability in patients with epilepsy. Epilepsy Research. (2005) ; 63: (2–3): 131-139. |
[4] | Bilgin S, Çolak OH, Koklukaya E, et al. Efficient solution for frequency band decomposition problem using wavelet packet in HRV. Digital Signal Processing. (2008) ; 18: (6): 892-899. |
[5] | Shin DG, Yoo CS, Yi SH, et al. Prediction of paroxysmal atrial fibrillation using nonlinear analysis of the R-R interval dynamics before the spontaneous onset of atrial fibrillation. Circulation Journal. (2006) ; 70: (70): 94-99. |
[6] | Zhang AH, Kou MC, Diao C, et al. Quality Assessment of ECG Signal Based on Wavelet Energy Ratio and Wavelet Energy Entropy. Applied Mechanics & Materials. (2014) ; 530-531: : 577-580. |
[7] | İşler Y, Kuntalp M. Combining classical HRV indices with wavelet entropy measures improves to performance in diagnosing congestive heart failure. Computers in Biology & Medicine. (2007) ; 37: (10): 1502-1510. |
[8] | Asl BM, Setarehdan SK, Mohebbi M. Support vector machine-based arrhythmia classification using reduced features of heart rate variability signal. Artificial Intelligence in Medicine. (2008) ; 44: (1): 51-64. |
[9] | Bian CH, Qianli MA, Junfeng SI, et al. Sign series entropy analysis of short-term heart rate variability. Chinese Science Bulletin. (2009) ; 54: (24): 4610-4615. |
[10] | Kulish V, Sourin A, Sourina O. Human electroencephalograms seen as fractal time series: Mathematical analysis and visualization. Computers in Biology & Medicine. (2006) ; 36: (3): 291-302. |
[11] | Wu GQ, Arzeno NM, Shen LL, et al. Chaotic signatures of heart rate variability and its power spectrum in health, aging and heart failure. Plos One. (2009) ; 4: (2): e4323-e4323. |
[12] | Masè M, Faes L, Antolini R, et al. Quantification of synchronization during atrial fibrillation by Shannon entropy: validation in patients and computer model of atrial arrhythmias. Physiological Measurement. (2005) ; 26: (6): 911-23. |
[13] | Balocchi R, Menicucci D, Santarcangelo E, et al. Deriving the respiratory sinus arrhythmia from the heartbeat time series using empirical mode decomposition. Chaos Solitons & Fractals. (2004) ; 20: (1): 171-177. |
[14] | Pan J, Tompkins WJ. A Real-Time QRS Detection Algorithm. IEEE Transactions on Biomedical Engineering. (1985) ; BME-32: (3): 230-236. |
[15] | Yeh YC, Che WC, Lin HJ. Analyzing ECG for cardiac arrhythmia using cluster analysis. Expert Systems with Applications. (2012) ; 39: (1): 1000-1010. |
[16] | Cropper WH. Rudolf Clausius and the road to entropy. American Journal of Physics. (1986) ; 54: (12): 1068-1074. |
[17] | Vetterli M, Herley C. Wavelets and filter banks: theory and design. IEEE Transactions on Signal Processing. (1992) ; 40: (9): 2207-2232. |
[18] | Xin Y, Chen Y, Hao W. ECG Baseline Wander Correction Based on Mean-median Filter and Empirical Mode Decomposition. Bio-medical Materials and Engineering. (2014) ; 24: (1): 365-71. |


