
A method and system to simulate human electrophysiological activity
Abstract
Accurate electrophysiological diagnosis relies on high precision and well calibrated instruments. A method to simulate the human electrophysiological activity is proposed and a simulation system is developed, as a calibration tool for electrophysiological inspectors. The system performance is tested by calibrating the amplitude and the latency of a commercial visual electrophysiological instrument. Several typical simulating signals are tested. The minimum amplitude of the simulating signal can be lower than 1
1.Introduction
Electrophysiology is widely used in clinic diagnosis and therapy evaluation [1, 2, 3]. It relies on precise instruments as well as accurate diagnositic criteria derived from statistical data. In weak electrophysiological signal detection,the amplitude may be lower than several micro volts. In this case, the measurement result is extremely susceptible to the instrument status, parameter settings or electromagnetic interference. Routine calibration of instruments is quite important for those clinical laboratories to improve the accuracy of clinical diagnosis and keep consistency of measurement results in long term. Besides, it is the prerequisite to achieve mutual recognition of medical examination result between different laboratories. Visual electrophysiology is a typical clinical electrophysiological method, used for the diagnosis of human visual diseases [4, 5]. The International Society for Clinical Electrophysiology of Vision (ISCEV) have published a series of standards and guidelines on clinical procedure and instrument calibration [6, 7, 8, 9, 10]. It is requested that visual electrophysiological inspectors should be calibrated periodically for long-term reproducibility. Thus a method which is capable of evaluating the accuracy of the amplitude and the latency is needed. Torok proposed a method to calibrate the electrophysiological instruments by using sinusoidal signals with amplitude higher than 10
The human visual electrophysiological system was taken as a model to investigate how to simulate the human electrophysiological activity. A method is proposed in this paper to simulate the human visual electrophysiological responses to light stimulus. A simulation system is developed, which consists of a photoelectric detector, a pulse shaping module and a low amplitude signal generator. It mimics the human visual system by detecting flash stimulus or pattern stimulus and generates simulating electrophysiological signals with a specific time delay. A commercial visual electrophysiological inspector is employed to test the system performance. Results are analyzed and the metrological traceability is demonstrated.
2.Method
In visual electrophysiology, flash and pattern are used as visual stimulus in electro-oculogram (ERG) and visual evoked potential (VEP) examinations. Electrophysiological signal is generated after the flash ends or the pattern reverses with a short time delay. The latency is defined as the delay between a peak/valley of the electrophysiological signal and the visual stimulus. Usually the lantecy varies from several microseconds to decades of microseconds.
Figure 1 shows the principle of the method to simulate the visual electrophysiology. In order to simulate the electrophysiological response of human eyes to visual stimulus, a photoelectric detector is used to detect the flash and pattern stimulus. The light signal is converted into a photocurrent signal, amplified and processed by a pulse shaping module. A standard square pulse is generated by the pulse shaping module and used to trigger the signal generator. The signal generator then output a simulating electrophysiological signal.
Figure 1.
The principle of the method to simulate visual electrophysiology.
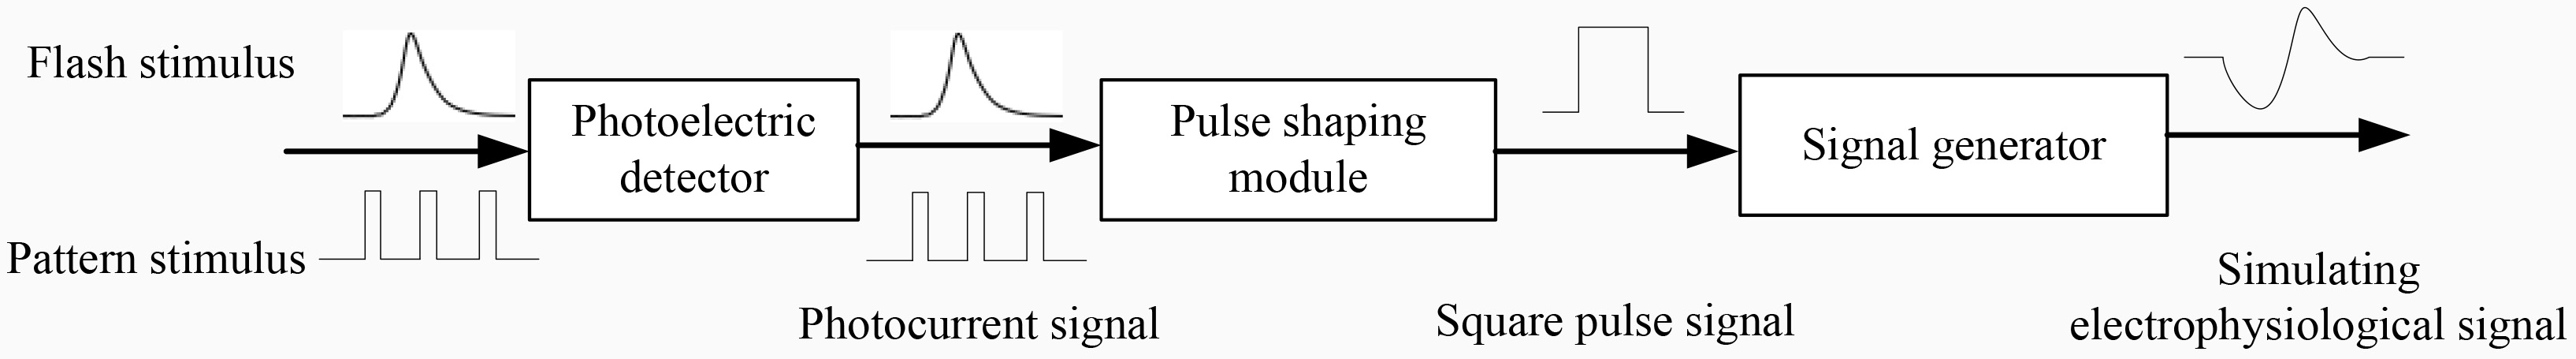
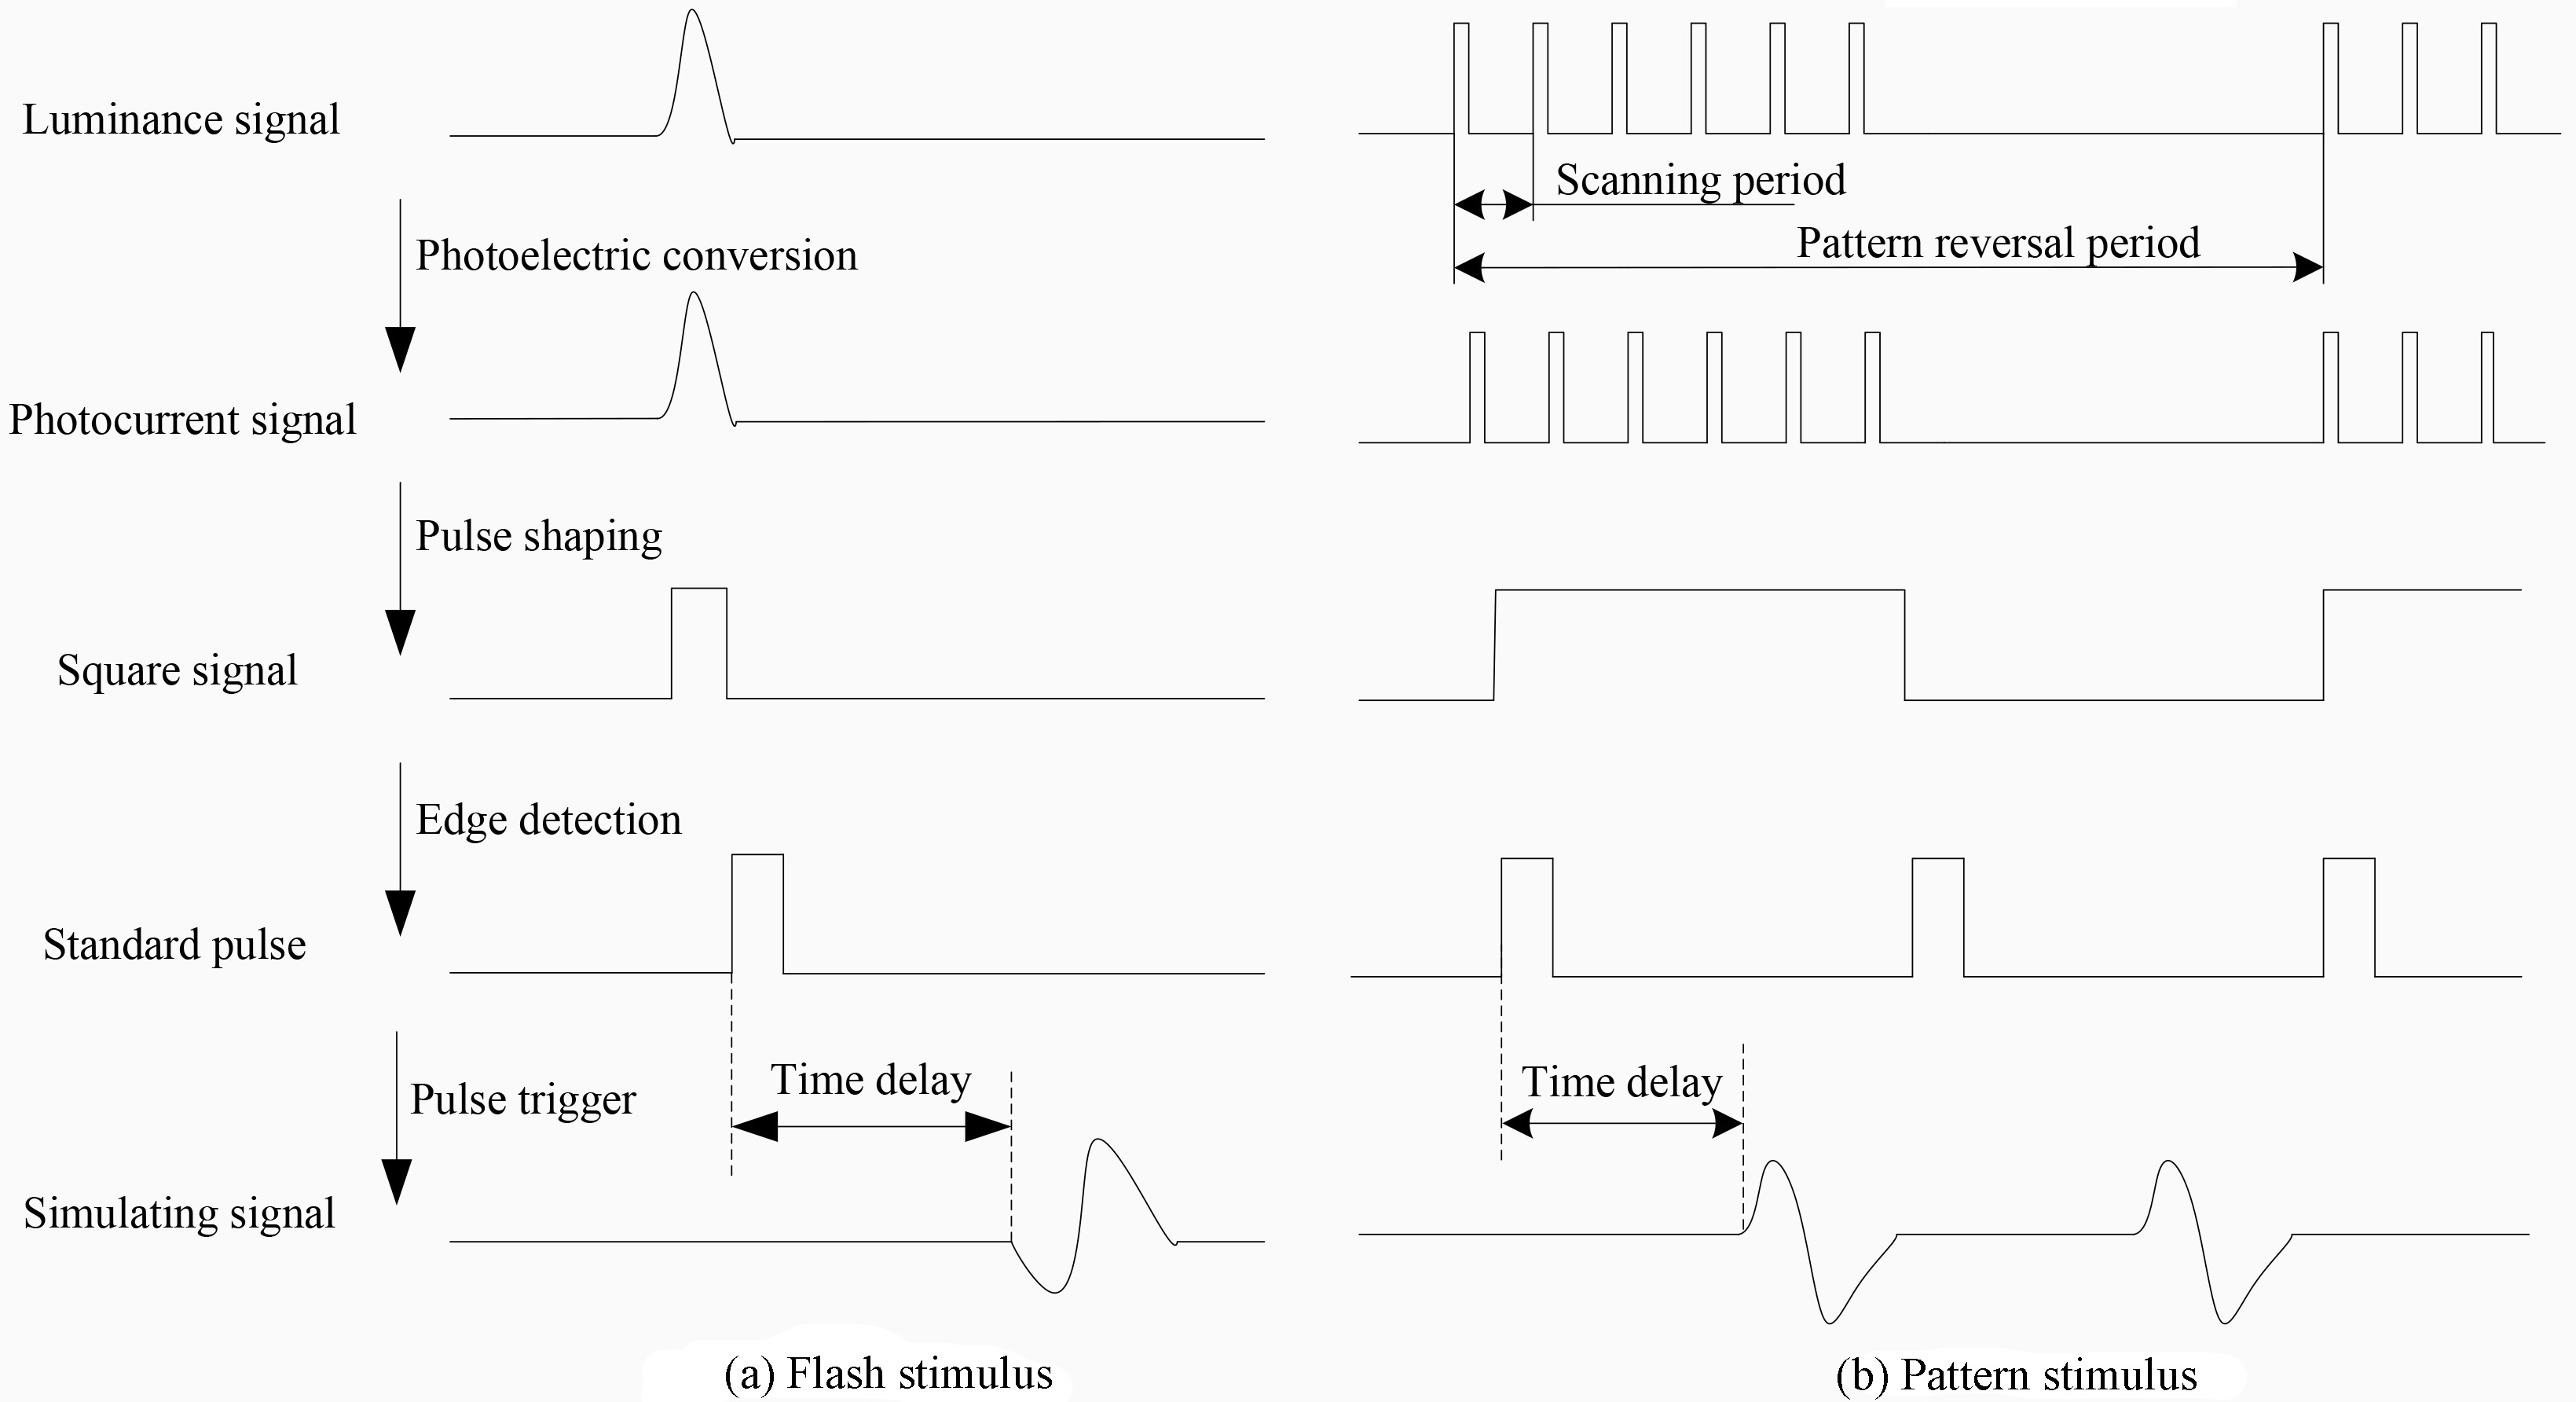
Figure 2 shows the signal processing flow chart of the simulation system. Figure 2a shows the flow chart of the response to a Xenon flash stimulus. The luminance signal of the flash is converted into a photocurrent signal. It is amplified and truncated into a square signal. On its falling dge, a standard square pulse with fixed amplitude and width is generated and used to trigger the signal generator to output a simulating visual electrophysiological signal. The signal processing is similar when LED is used as the flash source. Figure 2b shows the flow chart of the response to a pattern stimulus generated by a CRT display. A bright element of the pattern consists of a train of short pulses spaced with the scanning period of the electron beam in the CRT. When the pulse train is detected, it is incorporated into one single square wave. Standard pulses are generated on every rising and falling edges of the square wave, and they are used to trigger the signal generator.
Figure 2.
The signal processing flow chart of the simulation system.
Simulating electrophysiological signals with different waveforms and parameters are compiled and stored in the signal generator. Key parameters of the waveforms including the peak value, the valley value and the latency are defined according to clinical statistics in literatures [15, 16, 17]. The waveforms are generated in a way of simulating clinical human electrophysiological signals in frequency domain. First, sawtooth waves are obtained by directly connecting these peak and valley points. Then they are filtered by a digital low pass filter in order to mimic the frequency characteristics of clinical electrophysiological signals. The baseline of these wave forms are adjusted to zero. The data used to define the simulating signals is preloaded into the signal generator. The signal generator consists of a programmable logic unit, a display and control unit, a series of 20-bit digital-to-analog converters (DAC) and signal attenuators. The DAC output high amplitude signals and then they are attenuated to wanted amplitude by the signal attenuators.
3.The simulation system
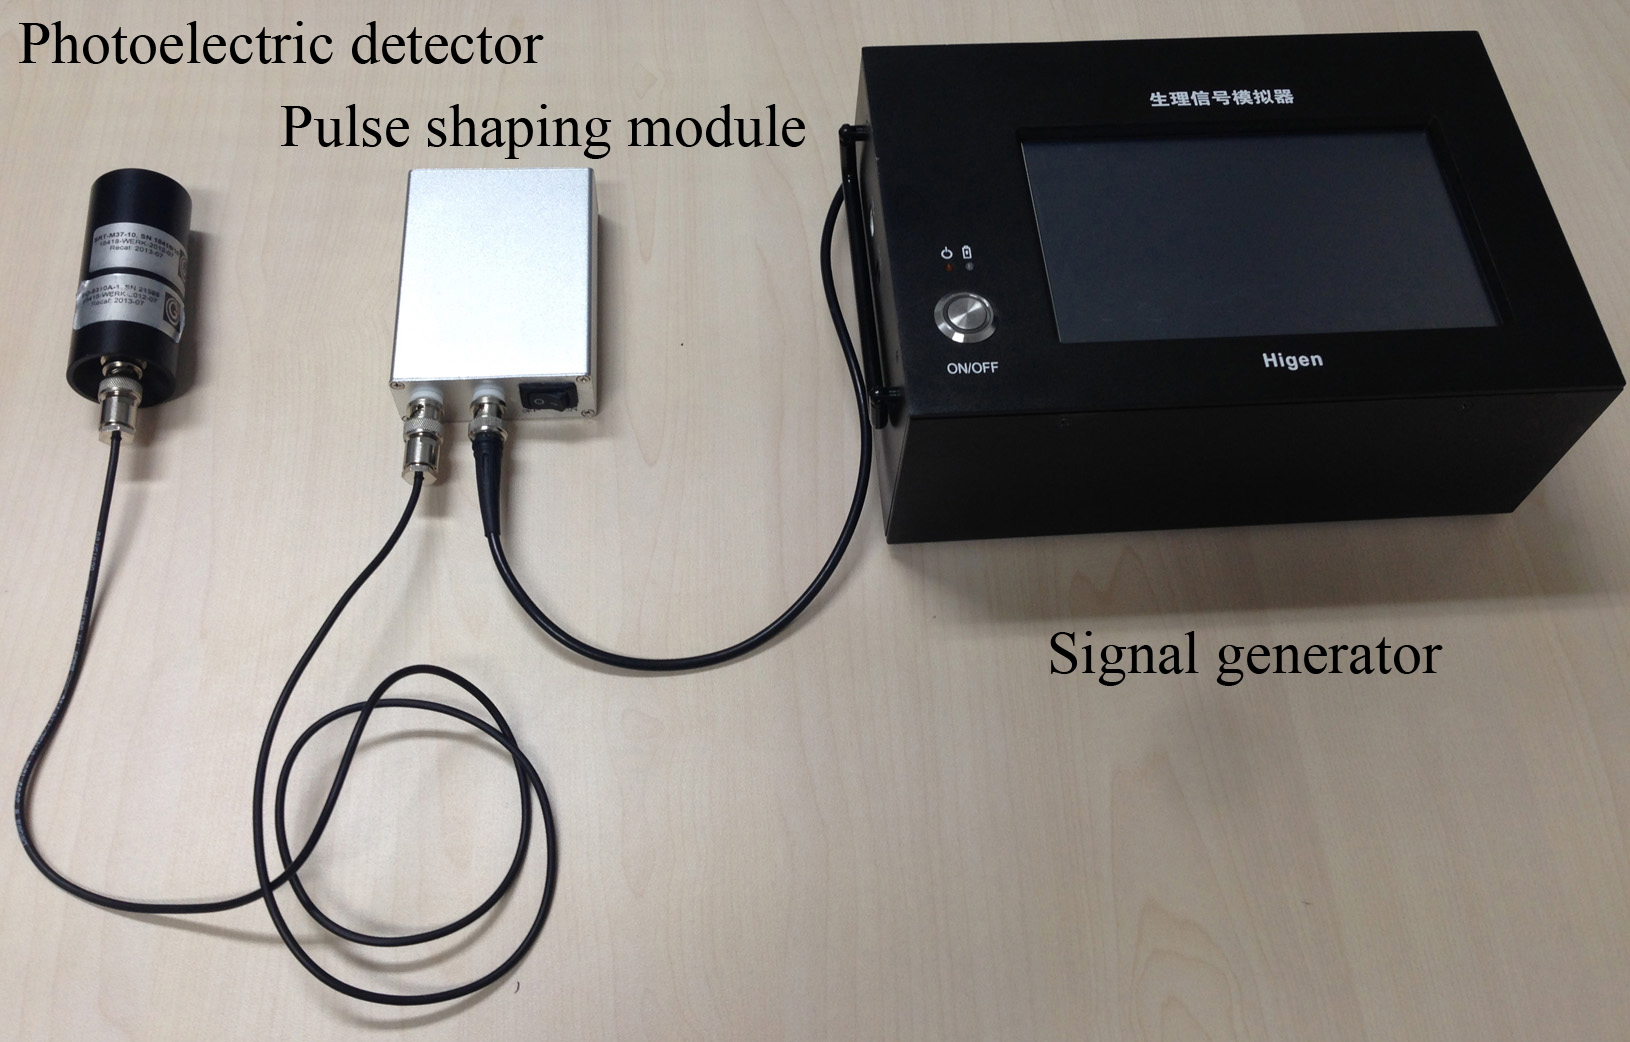
Figure 3 shows the photo of the simulation system of human visual electrophysiology. The simulation system can generate different simulating signals, whose amplitude range is 1
The signal amplitude and frequency of the simulation system are calibrated and traced to the national primary standards of electric voltage and time. The amplitude error is less than
The performance of the simulation system was tested by calibrating a commercial visual electrophysiological inspector (LKC Technologies, UTAS) with several different simulating signals including the flash ERG, the pattern ERG and the pattern VEP.
4.Experiments and results
4.1Flash ERG
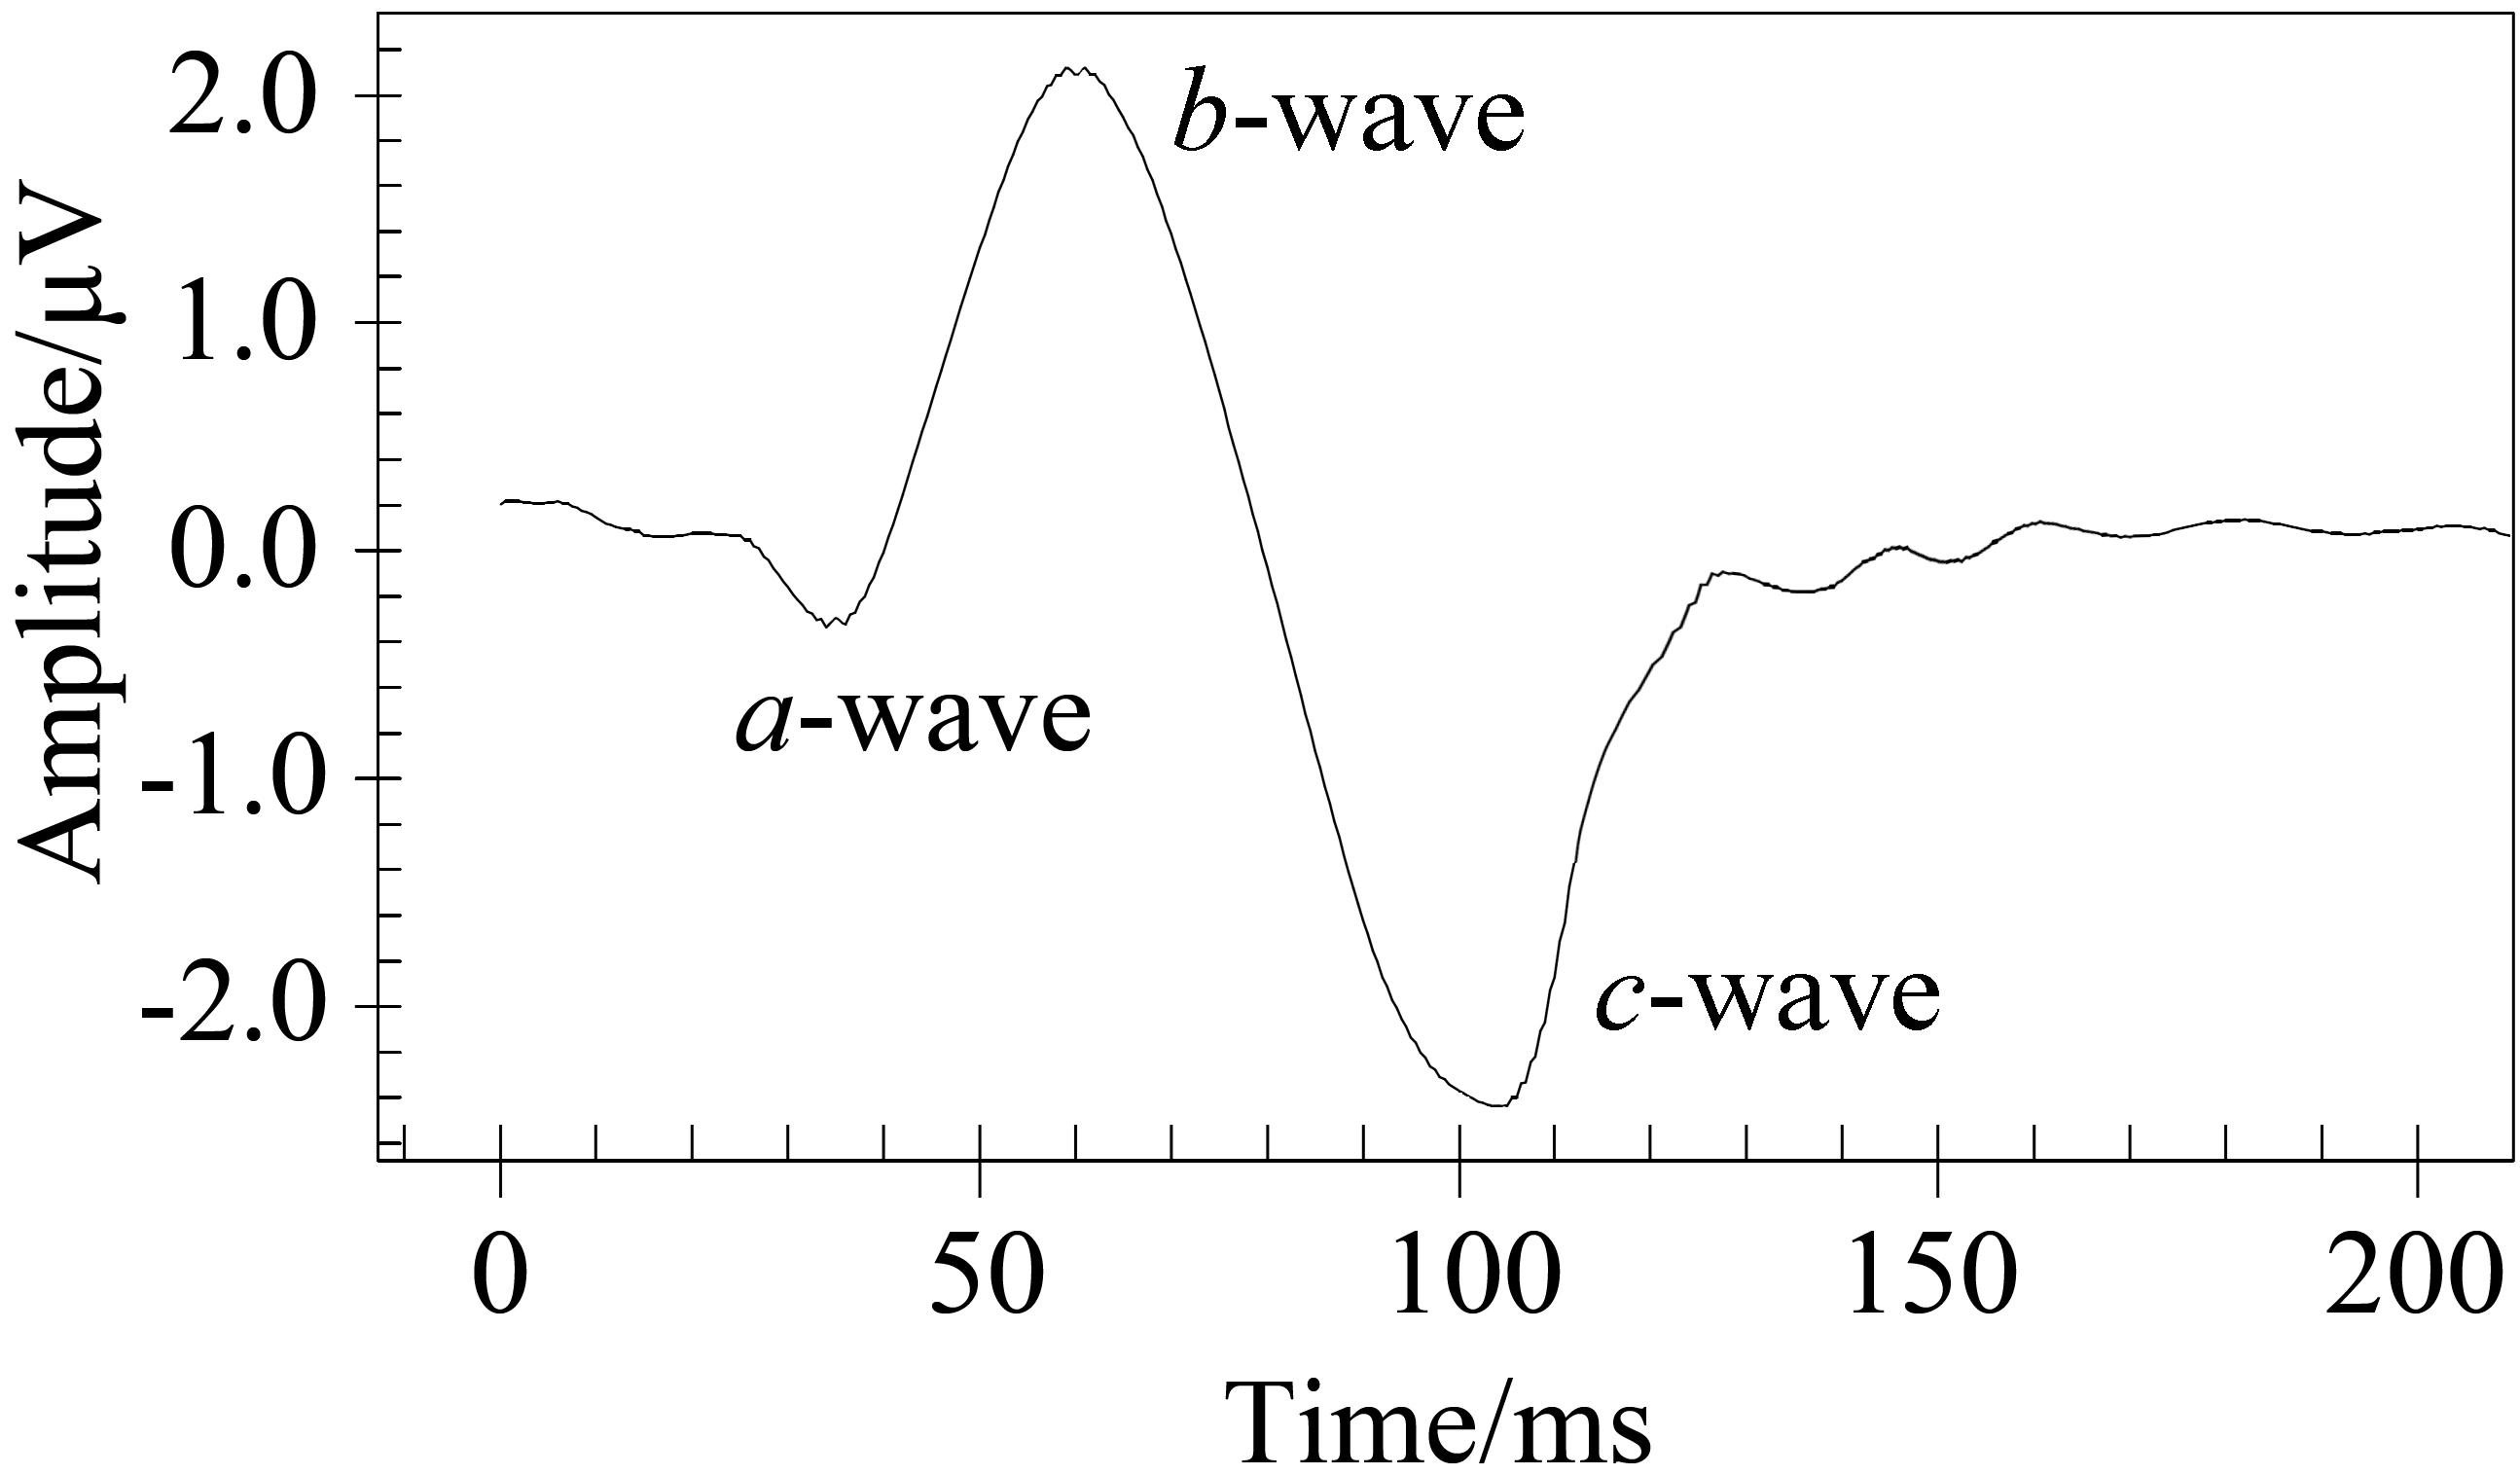
The visual electrophysiological inspector was set to work at flash ERG examination mode. The simulation system was set to output a dark-adapted 3.0 ERG simulating signal [8]. The photoelectric detector was mounted in front of the Ganzfeld stimulator to detect the flash. The waveform measured by the inspector is shown in Fig. 5. The amplitudes and the latencies of the peaks and the valleys were measured, repeated 3 times and averaged. Results were listed in Table 1.
Table 1
Calibration result of the flash ERG simulating signal
| Parameter | Standard value | Measurement value | Average value | Error | Measurement uncertainty ( | |||||||||
|---|---|---|---|---|---|---|---|---|---|---|---|---|---|---|
| | .5 | .4 | .4 | .5 | | .4 | 8 | .1 | 1 | .2 | ||||
| 120 | .0 | 113 | .7 | 113 | .5 | 113 | .9 | 113 | .7 | .3 | 1 | .4 | ||
| 12 | .0 | 12 | .0 | 12 | .0 | 12 | .0 | 12 | .0 | 0 | .0 | 0 | .1 | |
| 21 | .0 | 20 | .5 | 20 | .5 | 20 | .5 | 20 | .5 | .5 | 0 | .1 | ||
Figure 3.
The photo of the simulation system.
The calibration point
(1)
The standard deviation of the average value is:
(2)
The resolution of the inspector
(3)
The standard uncertainty component introduced in by the simulation system is:
(4)
In which
(5)
The expanded uncertainty is
Table 2
Calibration result of the pattern ERG simulating signal
| Parameter | Standard value | Measurement value | Average value | Error | Measurement uncertainty ( | |||||||||
|---|---|---|---|---|---|---|---|---|---|---|---|---|---|---|
| | .7 | .4 | .4 | .5 | | .4 | 0 | .3 | 0 | .1 | ||||
| 3 | .2 | 2 | .7 | 2 | .4 | 2 | .4 | 2 | .5 | .7 | 0 | .2 | ||
| .8 | .6 | .4 | .2 | .4 | 0 | .4 | 0 | .3 | ||||||
| 30 | .0 | 29 | .0 | 28 | .5 | 29 | .5 | 29 | .0 | .0 | 0 | .7 | ||
| 56 | .5 | 56 | .5 | 56 | .0 | 56 | .0 | 56 | .2 | .3 | 0 | .4 | ||
| 101 | .5 | 100 | .5 | 100 | .0 | 101 | .0 | 100 | .2 | .3 | 0 | .4 | ||
Figure 4.
Waveform of the flash ERG simulating signal.
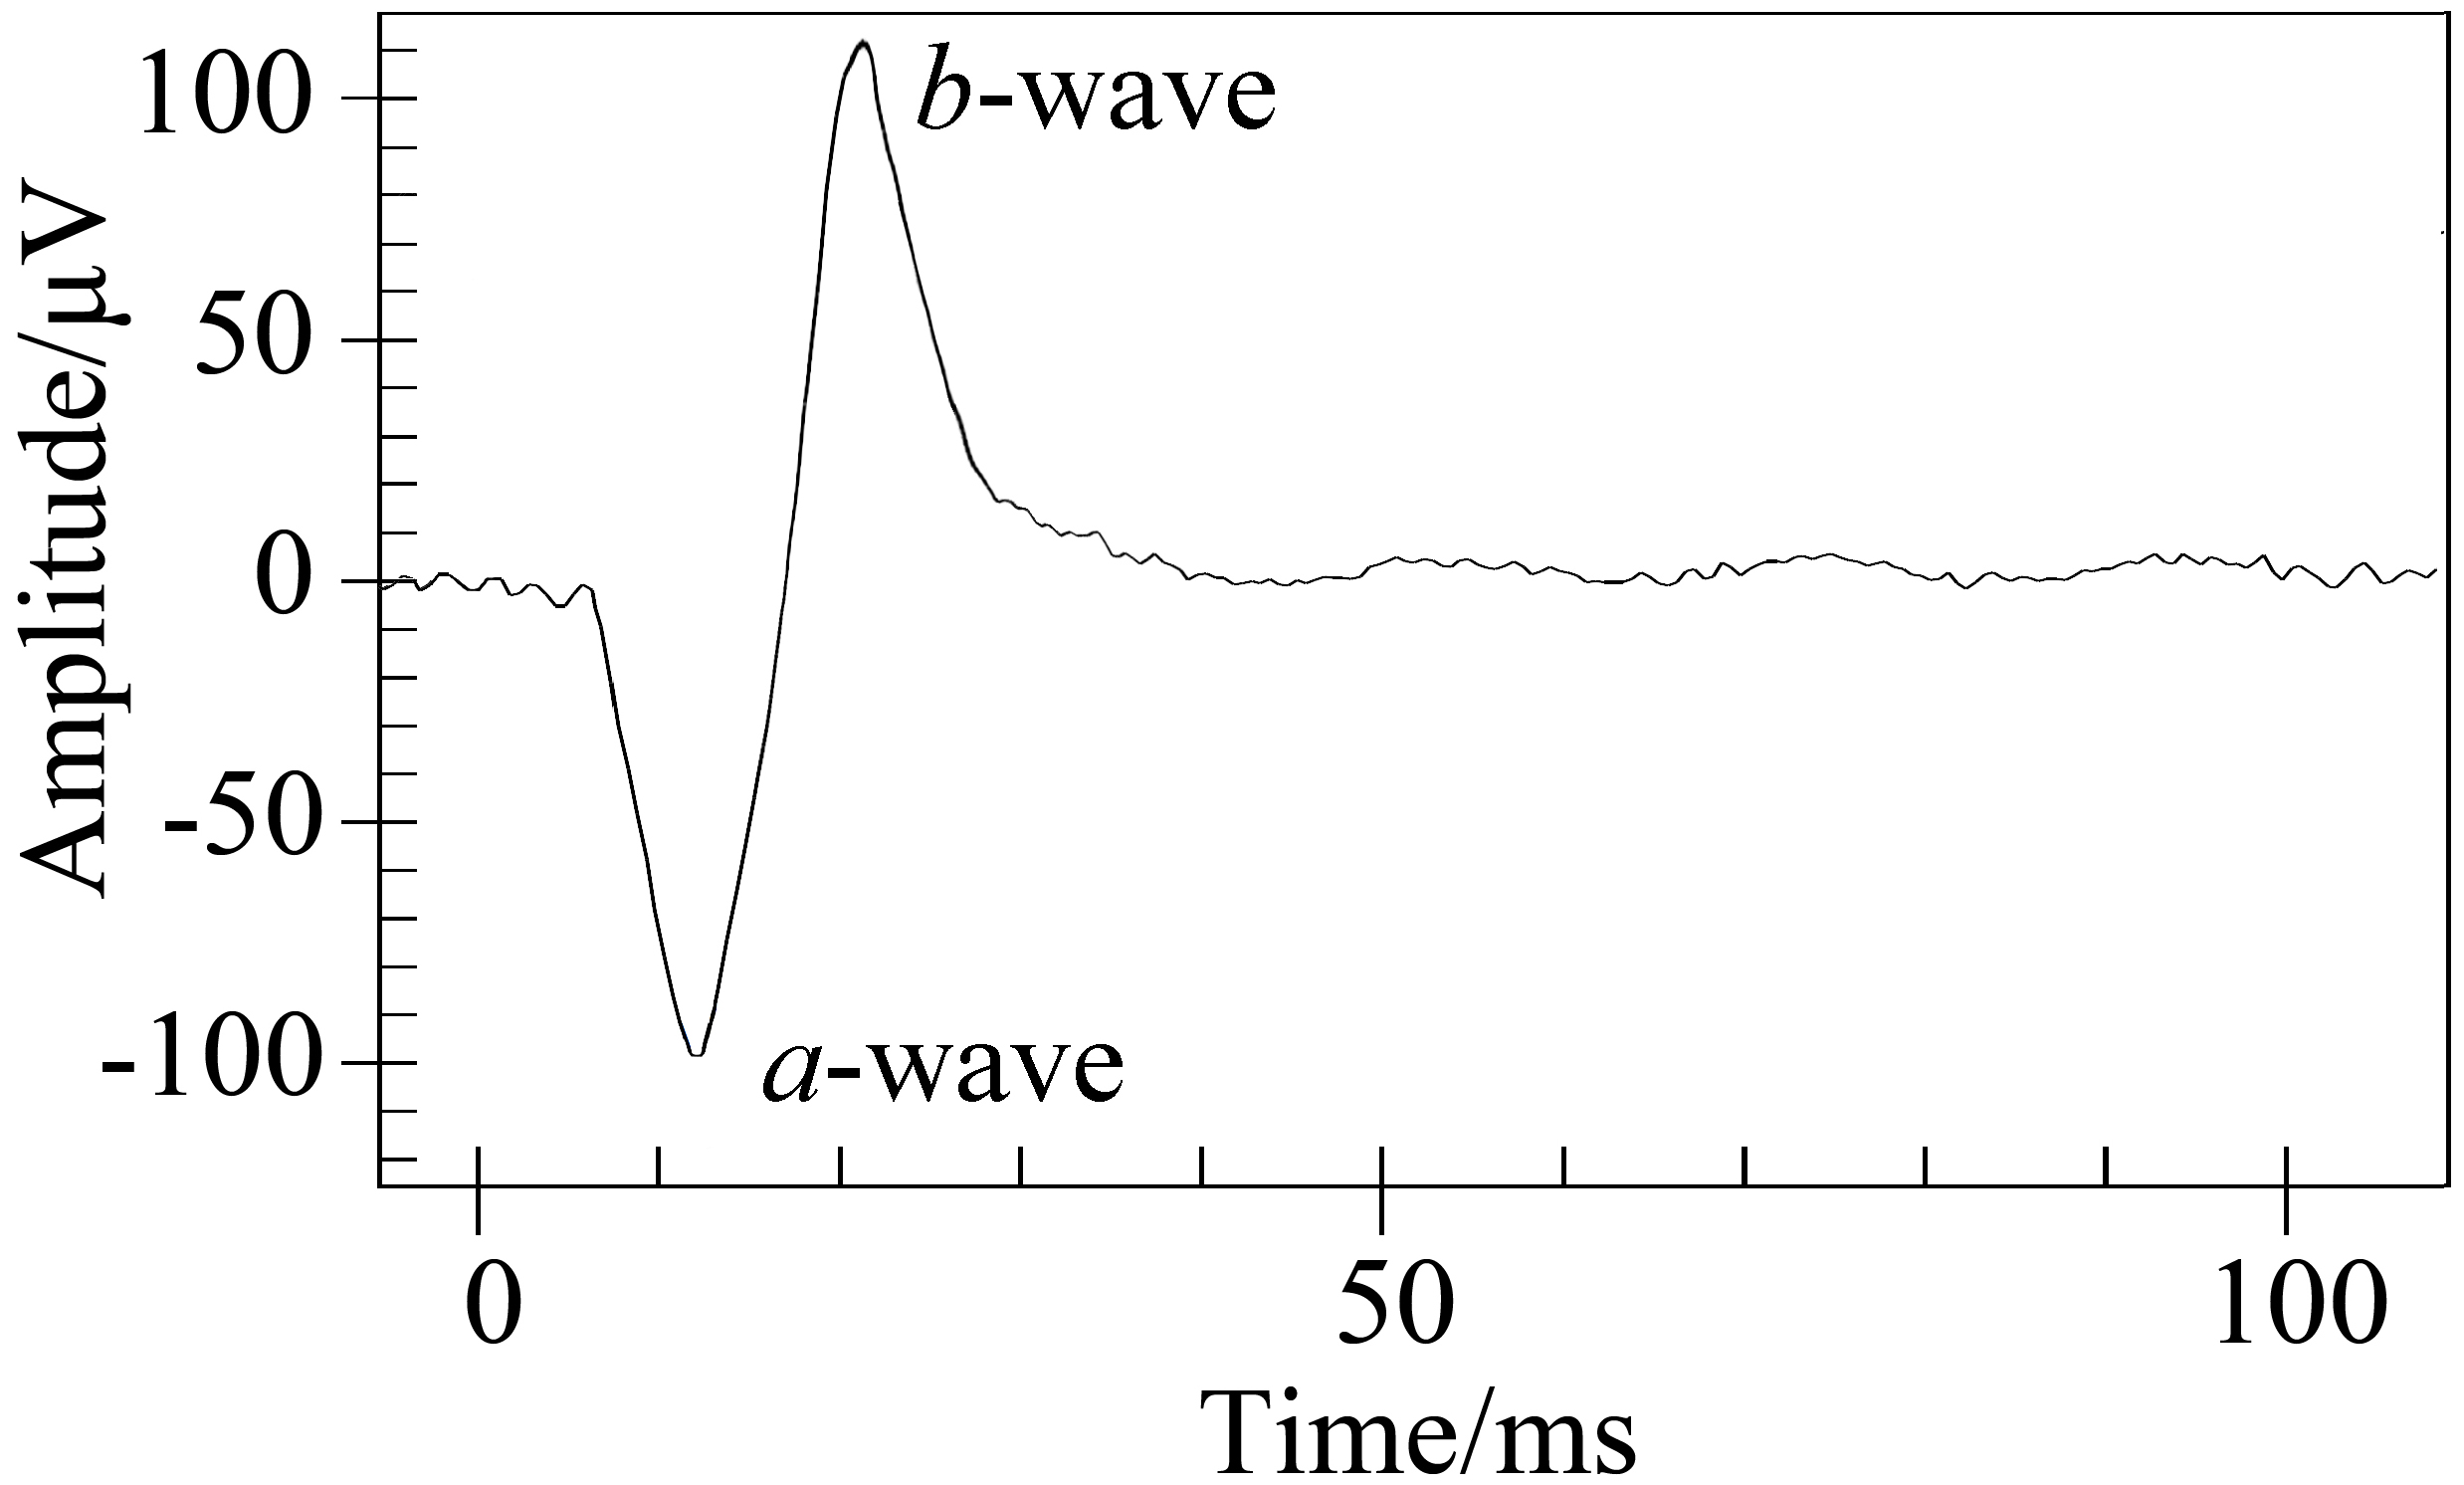
Figure 5.
Waveform of the pattern ERG simulating signal.
4.2Pattern ERG
The calibrated visual electrophysiological inspector was set to work at pattern ERG examination mode. The pattern was reversed 64 times and a synchronous averaging technique was used to enhance the signal-to-noise ratio (SNR). The simulation system was set to output a transient pattern ERG simulating signal [7]. The pattern reversal rate was 2 Hz. The pattern contrast was about 90%. The photoelectric detector was placed in front of the CRT display to detect the pattern reversal. The waveform measured by the inspector was shown in Fig. 5. The amplitudes and the latencies of the peaks and the valleys were measured, repeated 3 times and averaged. Results were listed in Table 2.
Table 3
Calibration result of the VEP simulating signal
| Parameter | Standard value | Measurement value | Average value | Error | Measurement uncertainty ( | |||||||||
|---|---|---|---|---|---|---|---|---|---|---|---|---|---|---|
| | .5 | .4 | .4 | .3 | | .4 | 0 | .0 | 0 | .1 | ||||
| 8 | .5 | 8 | .7 | 8 | .5 | 7 | .2 | 8 | .5 | 0 | .1 | 0 | .5 | |
| .6 | .9 | .6 | .3 | .6 | .1 | 0 | .4 | |||||||
| 71 | .4 | 71 | .0 | 69 | .5 | 69 | .5 | 70 | .0 | 0 | .2 | 1 | .0 | |
| 101 | .0 | 100 | .5 | 100 | .0 | 99 | .5 | 100 | .0 | 0 | .2 | 0 | .7 | |
| 130 | .0 | 129 | .5 | 128 | .0 | 128 | .0 | 128 | .5 | 0 | .2 | 1 | .0 | |
Figure 6.
Waveform of the VEP simulating signal.
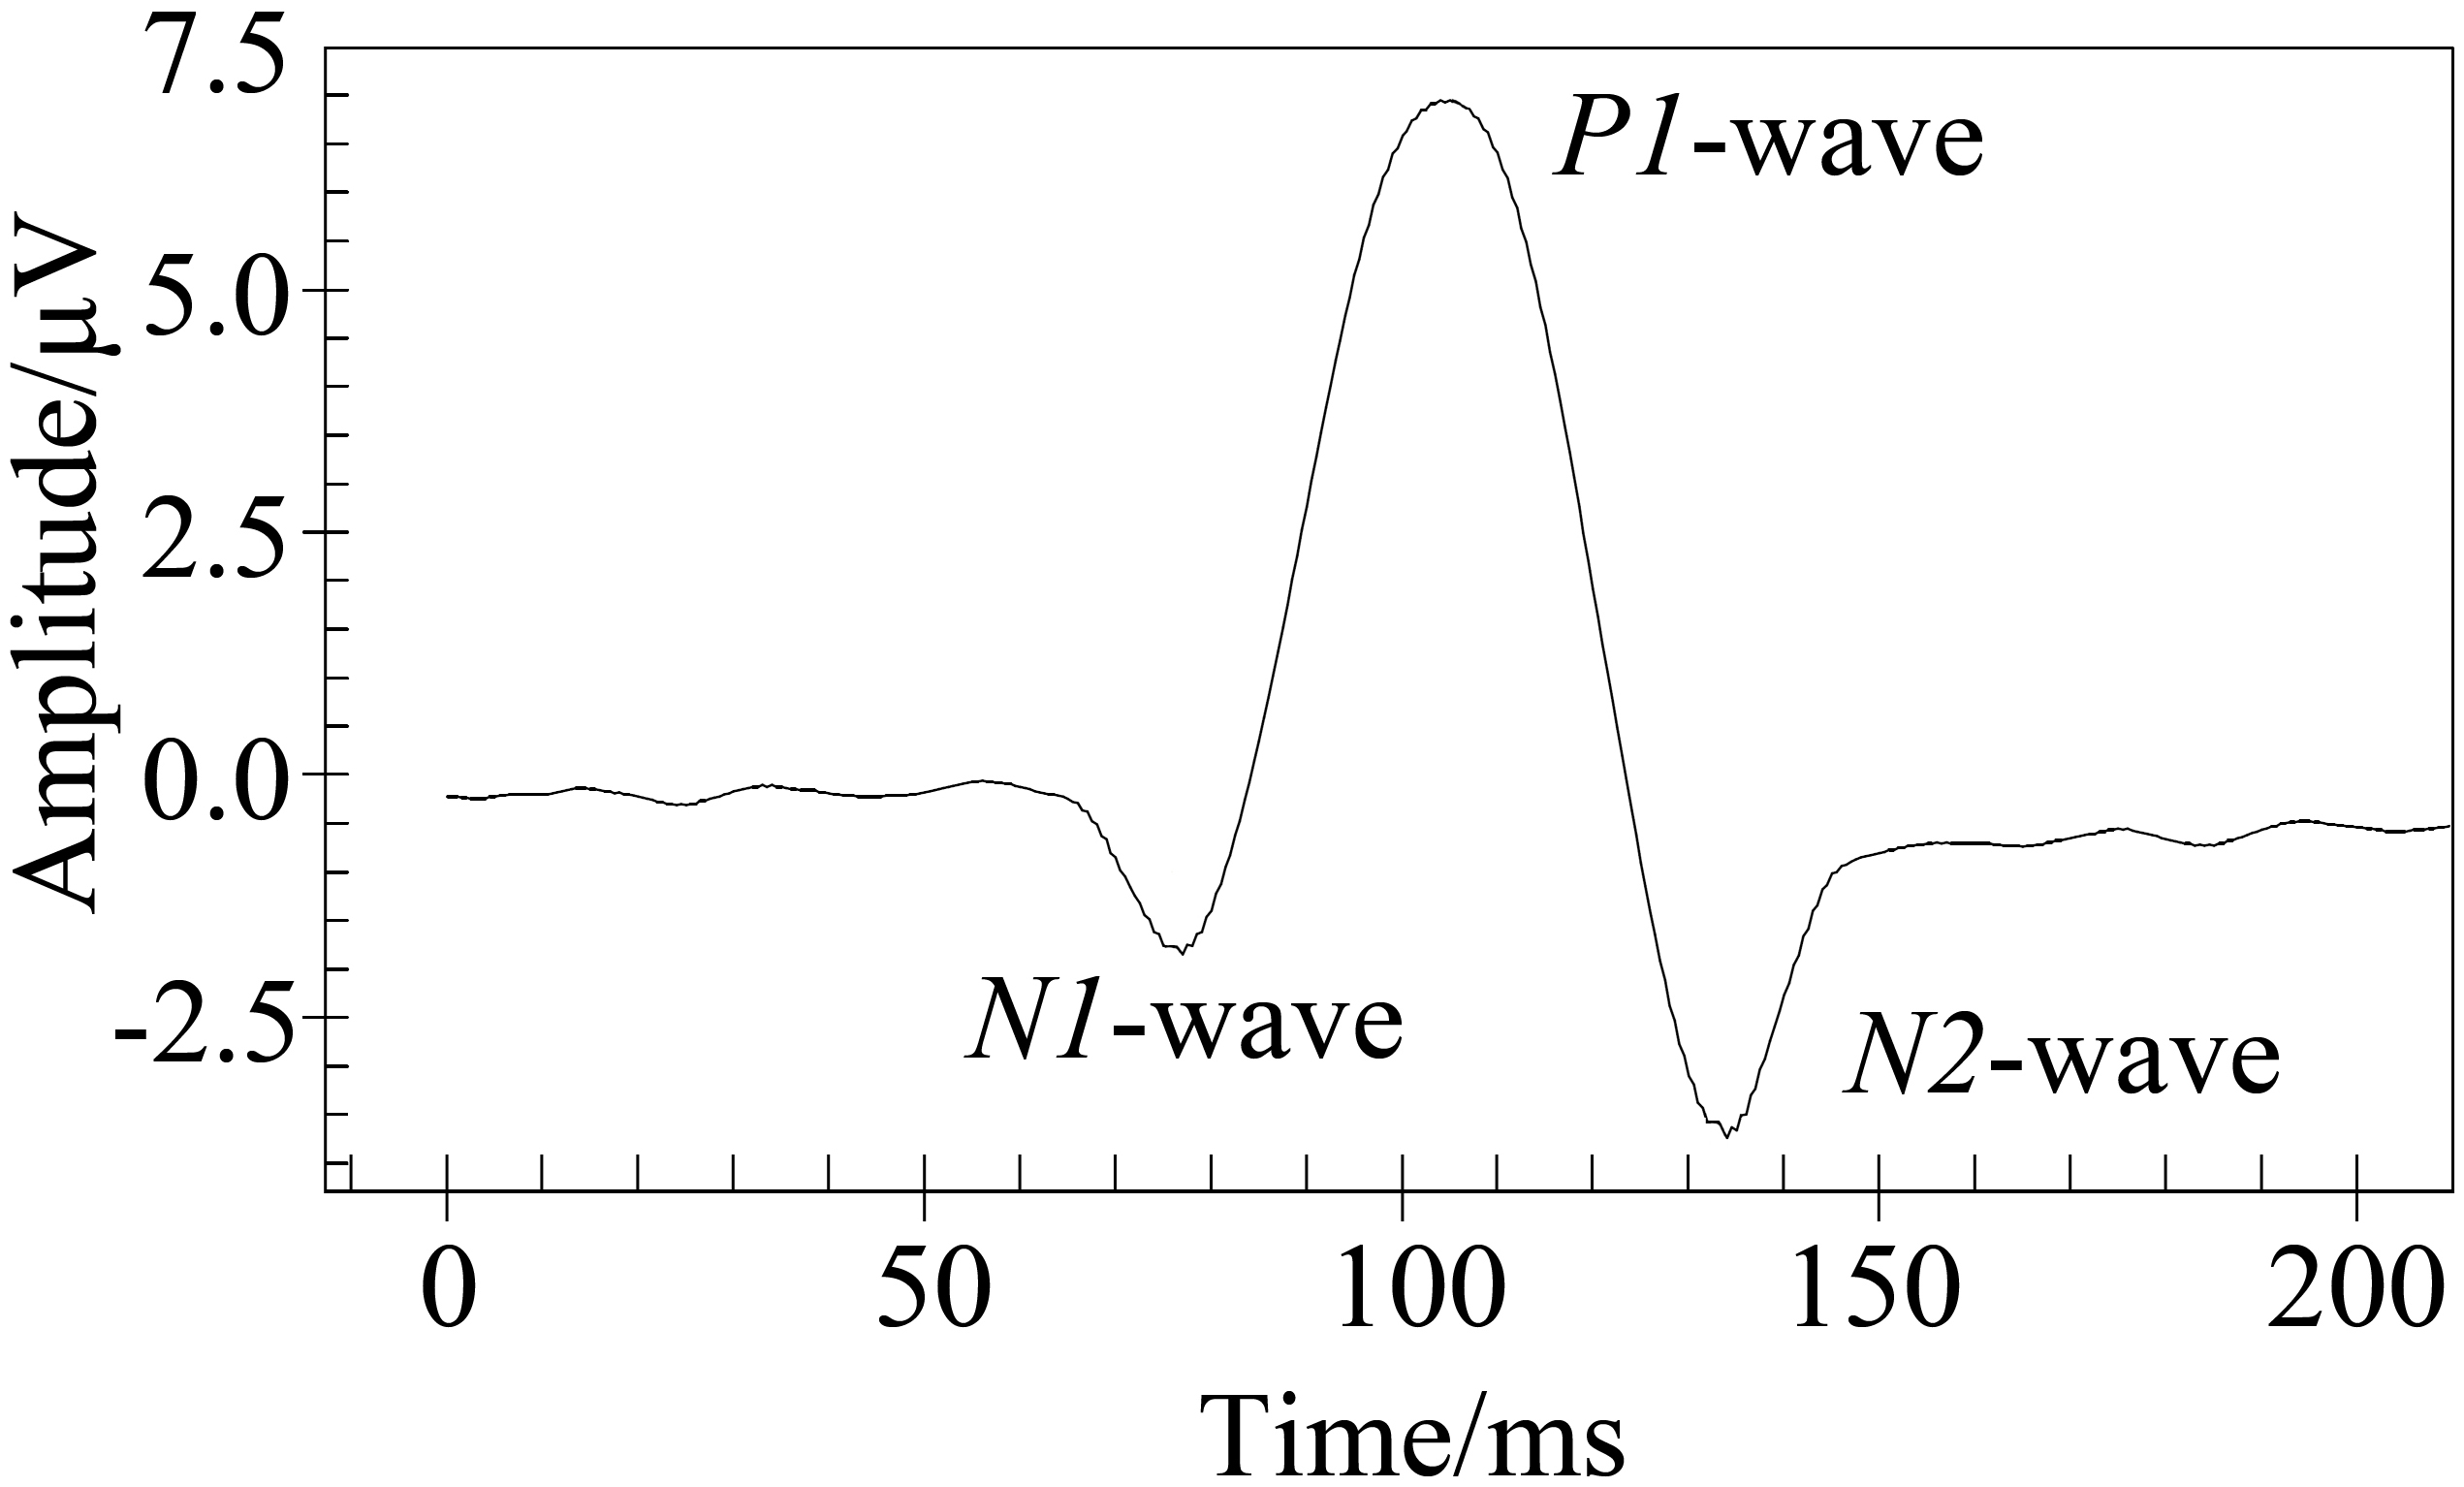
Figure 7.
Results of sinusoidal signals measured directly.
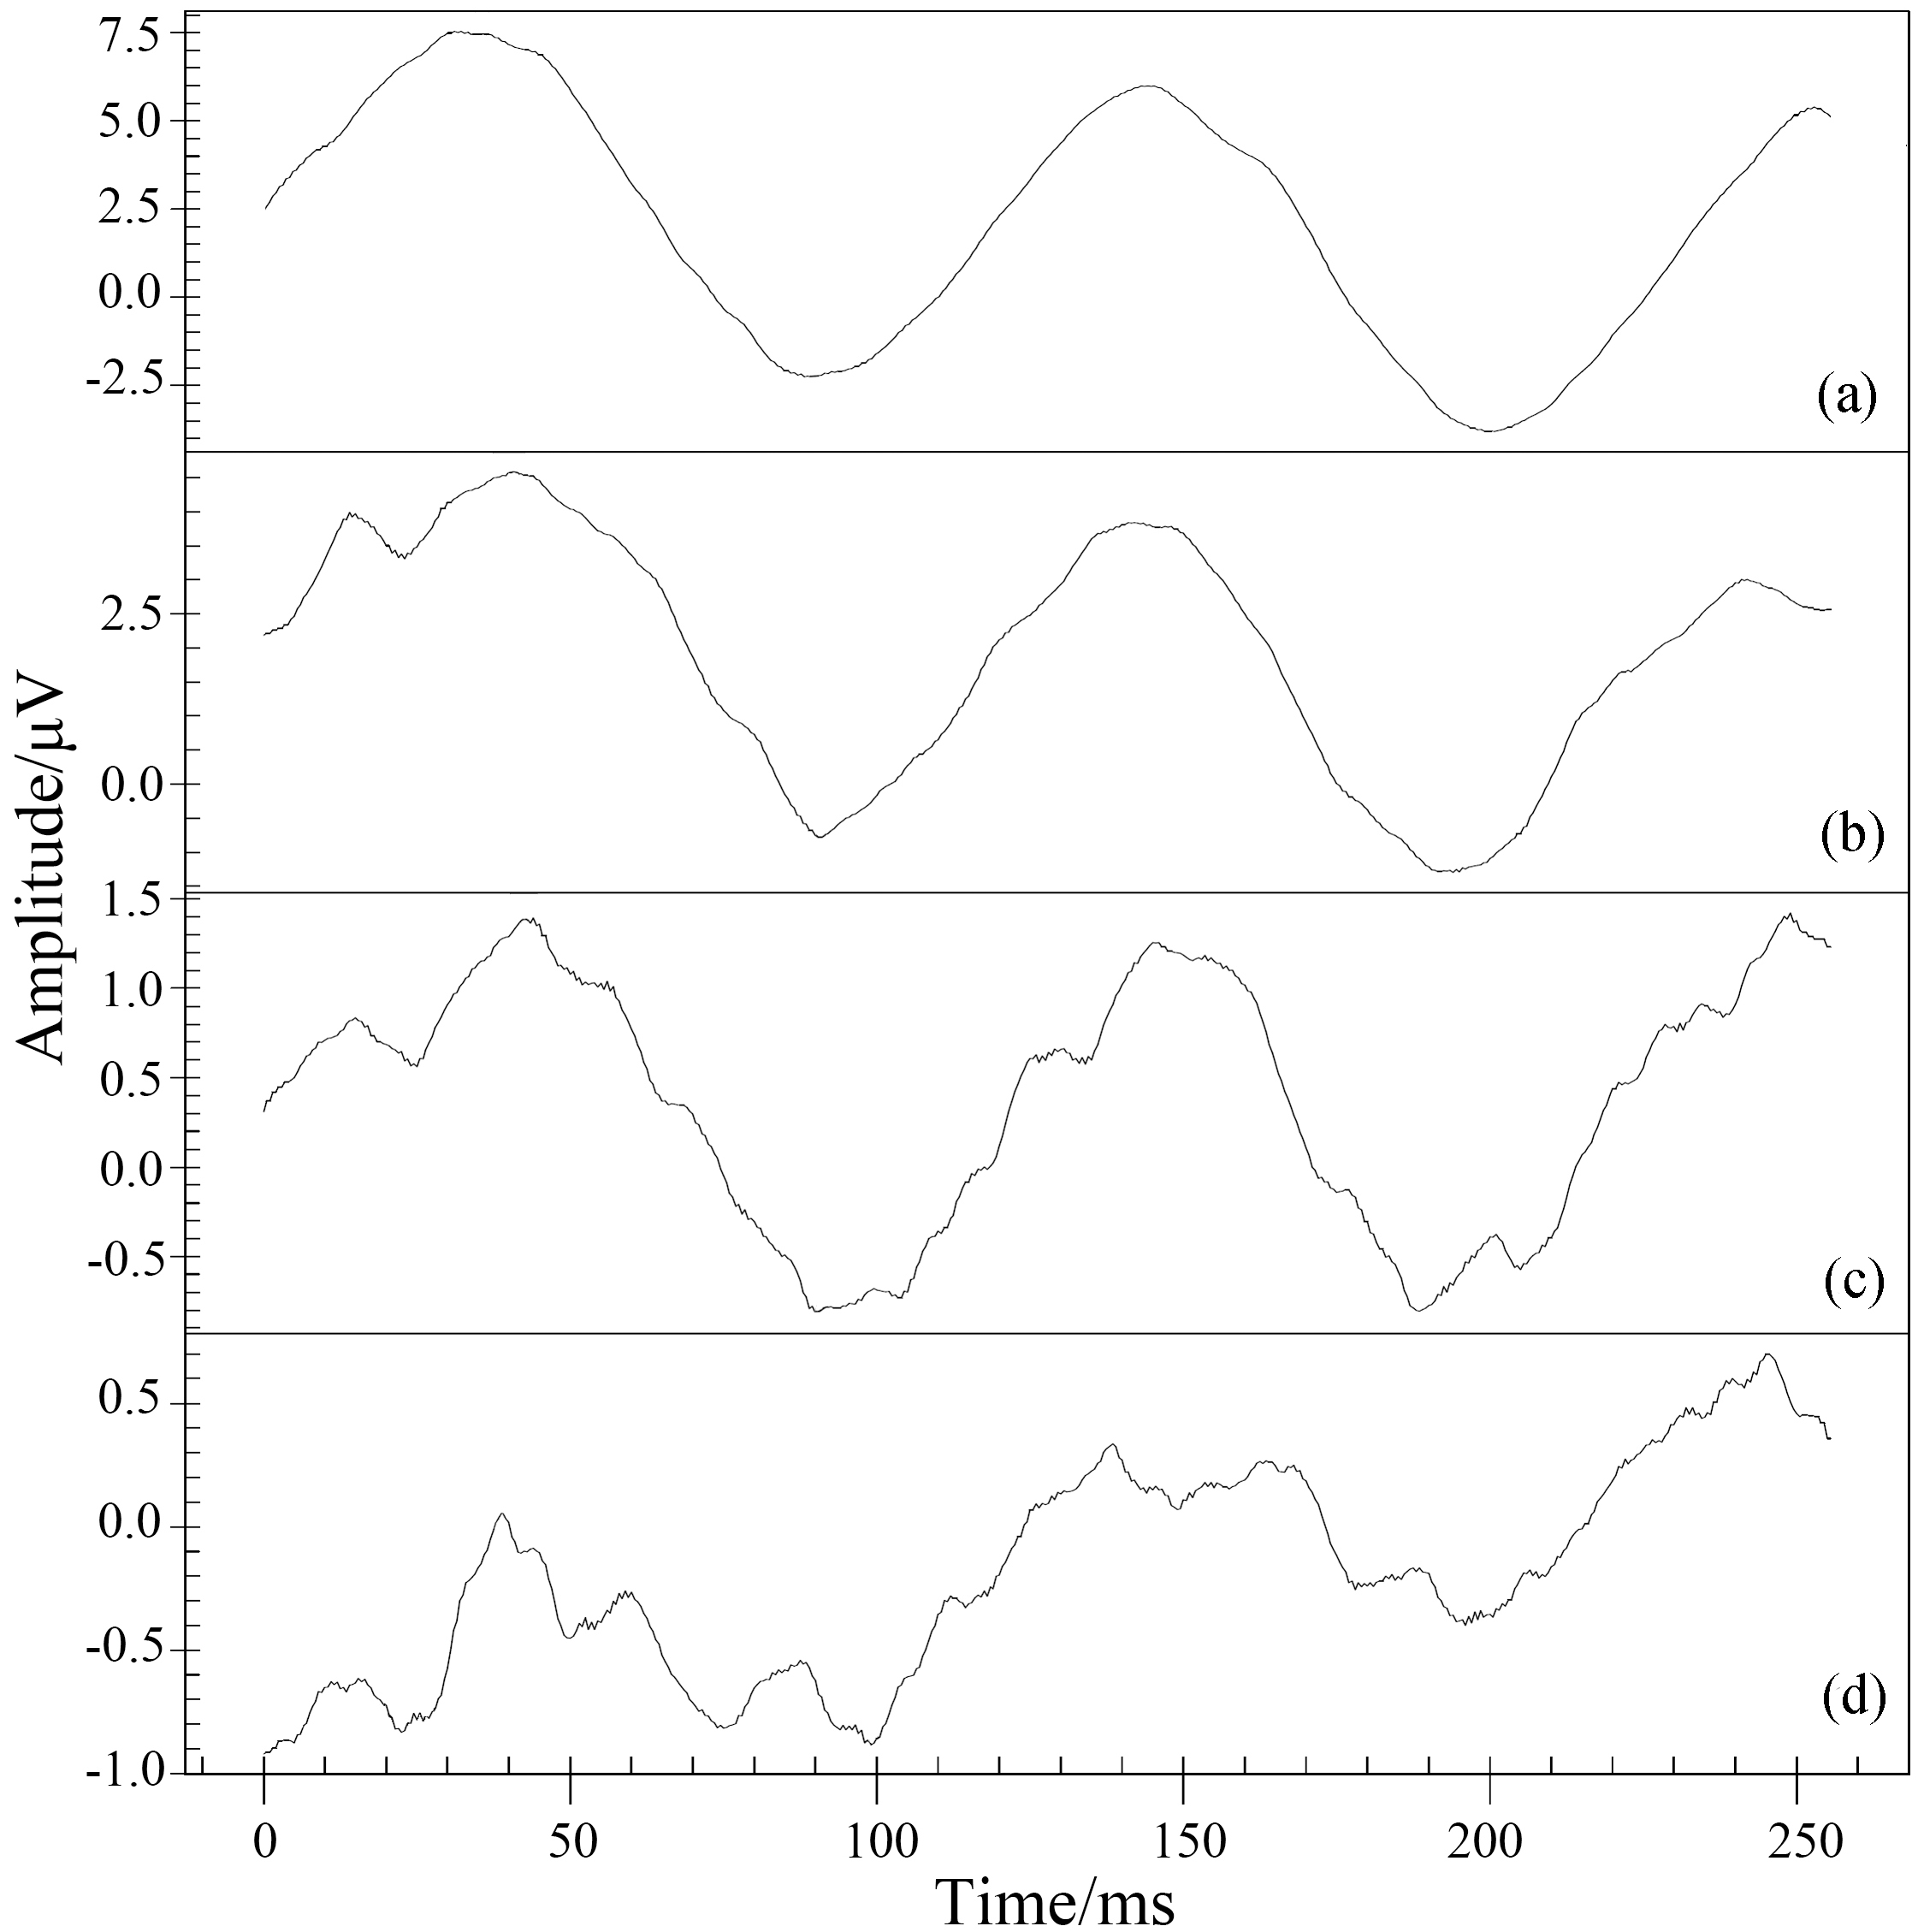
Figure 8.
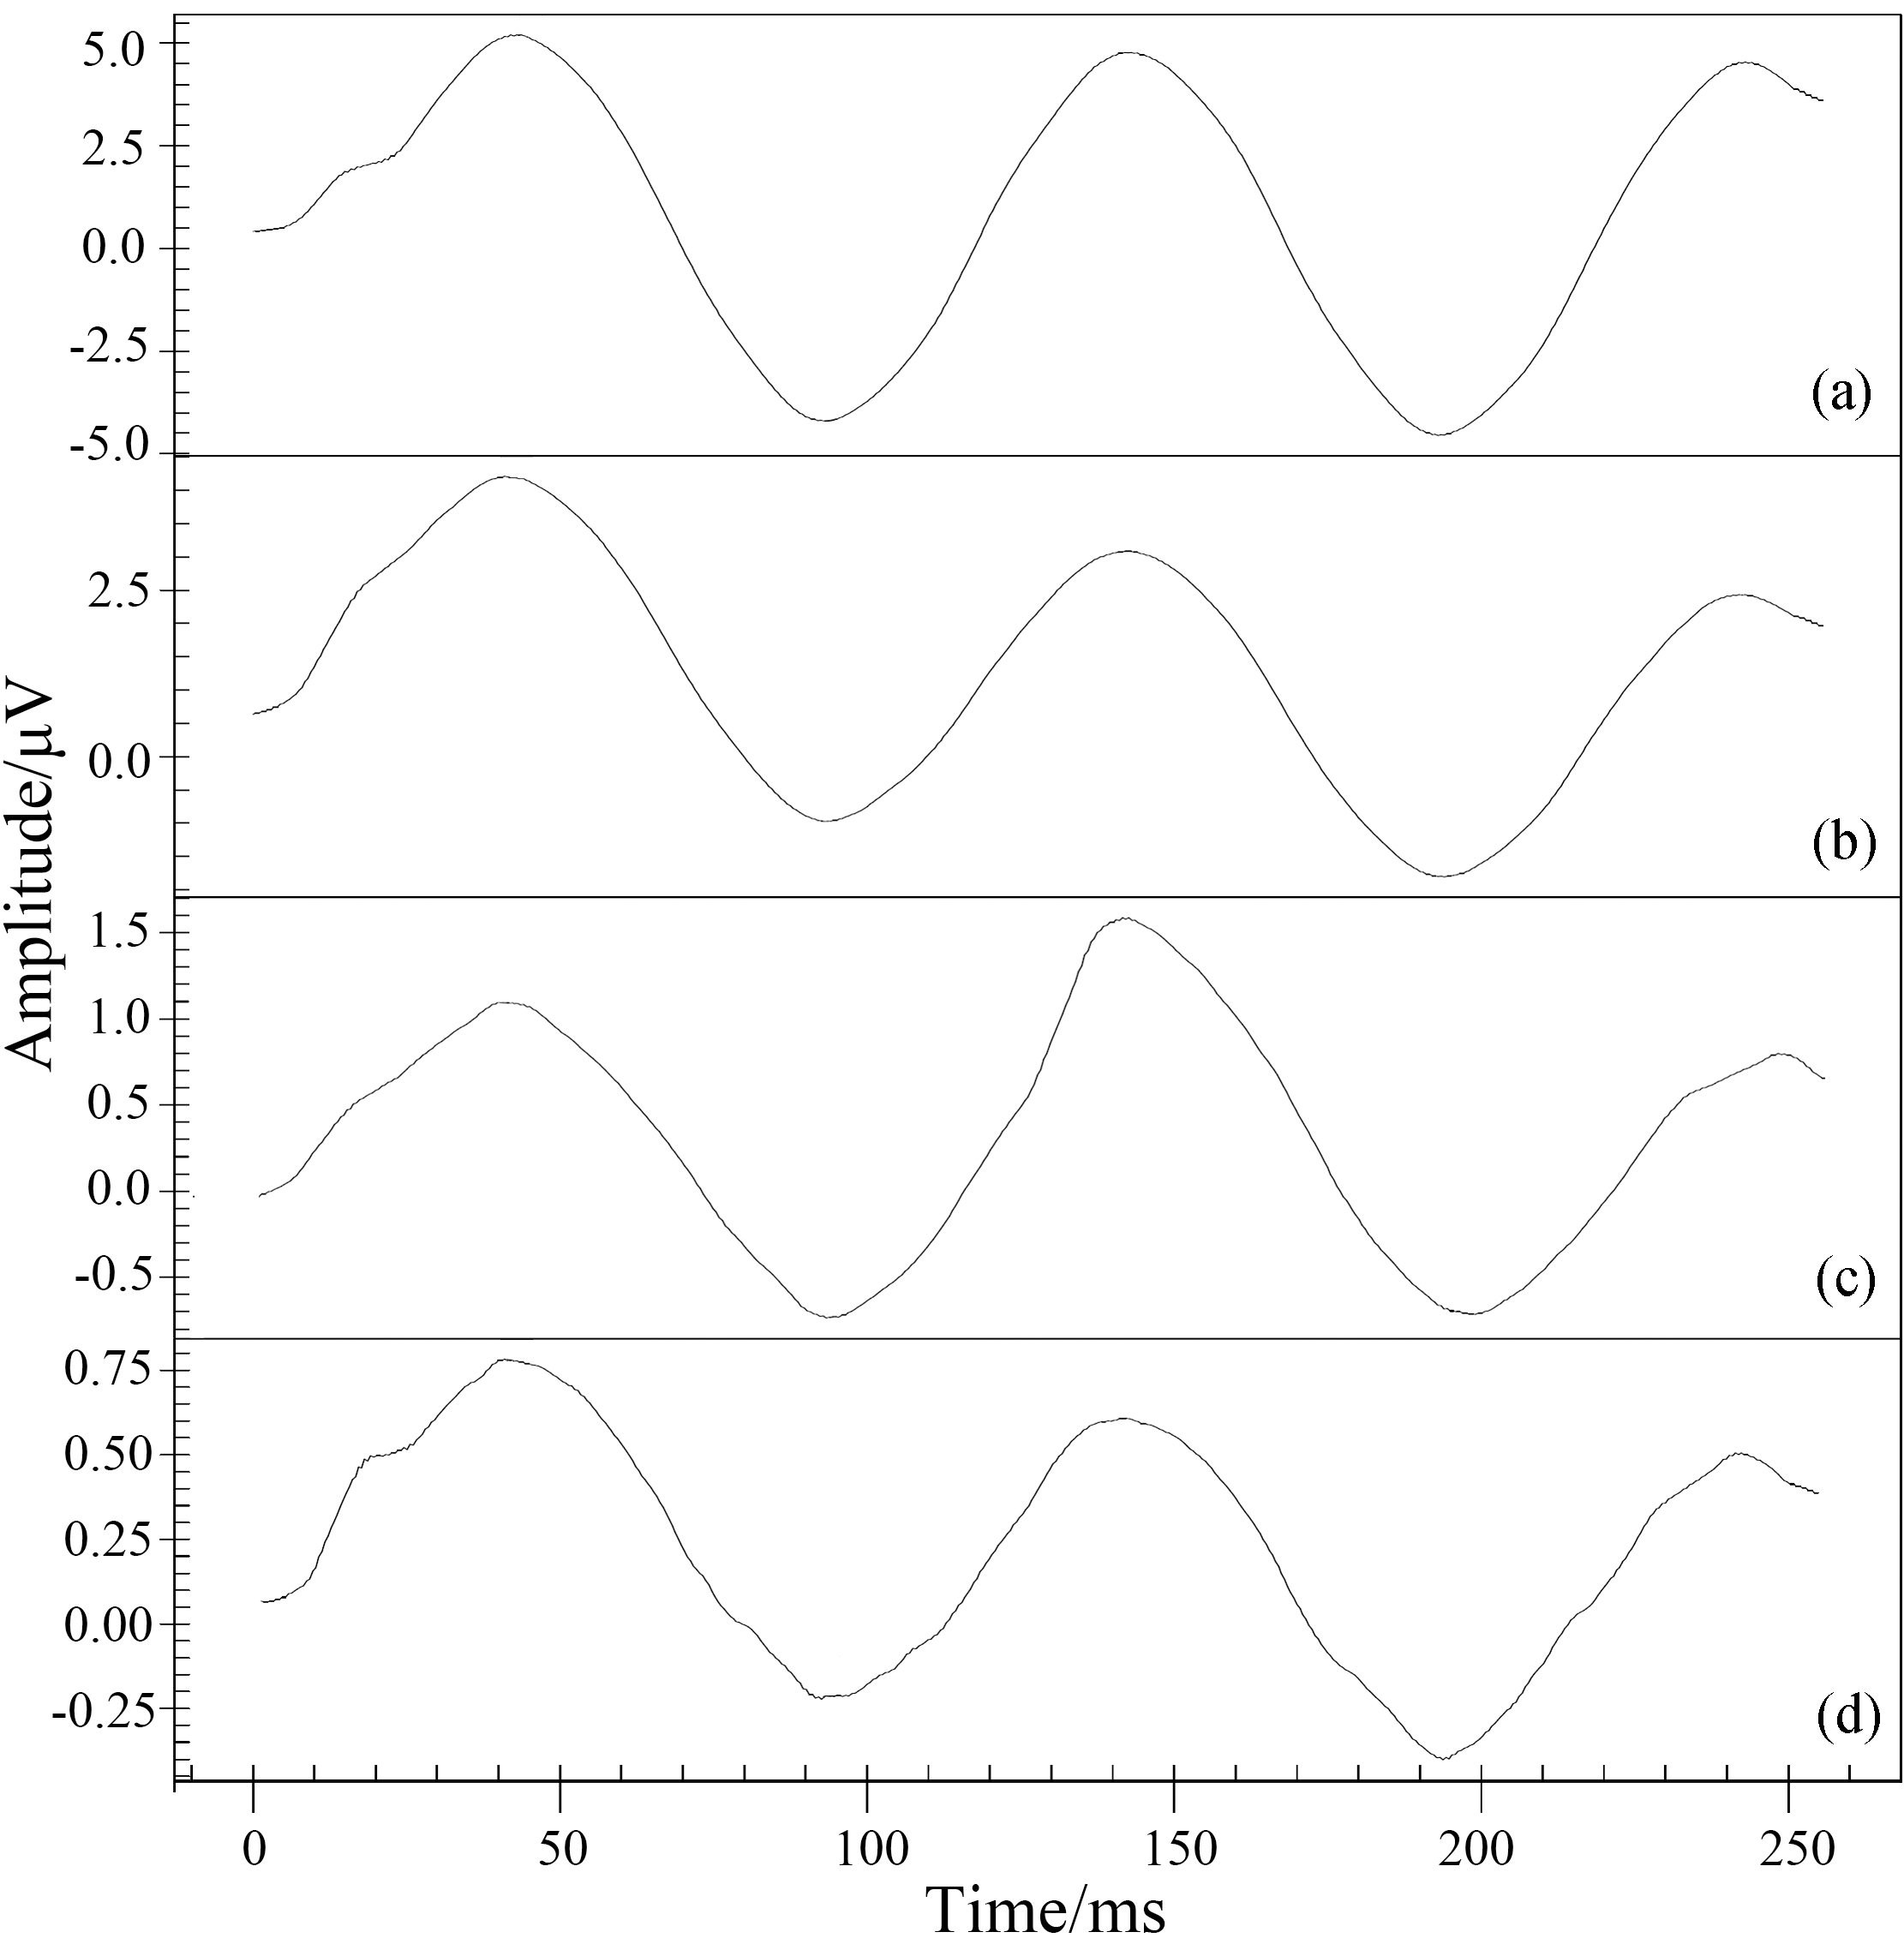
Results of sinusoidal signals with synchronous averaging.
4.3Pattern VEP
The calibrated visual electrophysiological inspector was set to work at VEP examination mode. Pattern is reversed 64 times and synchronous averaging technique is used to enhance the signal-to-noise ratio (SNR). The simulation system was set to output the pattern-reversal VEP simulating signal [9]. The pattern reversal rate was 1 Hz. The pattern contrast was about 90%. The waveform measured by the inspector is shown in Fig. 6. The amplitudes and the latencies of the peaks and the valleys were measured, repeated 3 times and averaged. Results were listed in Table 3.
4.4Low amplitude signal detection
In order to test the detetable limit of low amplitude signal, sinusoidal signals were generated and measured at two modes, with and without synchronous averaging. The synchronous averaging technique is commonly used in detecting weak electrophysiological signal, such as the transient pattern ERG and the pattern-reversal VEP. Figure 7 showed the results of sinusoidal signals measured directly. The peak-to-peak values of the signals were 10
5.Conclusions
A method to simulate the human electrophysiological response to visual stimulus is proposed. A simulation system is developed, which is metrologically traced to the national primary standards of time and voltage. The system performance is tested by calibrating the amplitude and the latency of a commercial visual electrophysiological inspector with several typical simulating signals. It is demonstrated by experimental results that the simulation system is capable of simulating the human visual electrophysiological responses to both visual stimulus and pattern stimulus. The amplitude of the simulating signal is 1
Conflict of interest
None to report.
Acknowledgments
This research is supported by the National Key Research and Development Program of China (2016YFF0201001).
References
[1] | Klein GJ, Prystowsky EN. Clinical Electrophysiology Review. McGraw-Hill Professional, (2013) . |
[2] | Wilber DJ, Singh JP. Advances in Clinical Electrophysiology: 2015 in Review. JACC: Clin Electr (2016) ; 2: (1): 124-127. |
[3] | Aust NZ. Electrophysiology: a review of signal origins and applications to investigating glaucoma. J Ophthalmol (1998) ; 26: (1): 71-85. |
[4] | Brecelj J. Visual electrophysiology in the clinical evaluation of optic neuritis, chiasmal tumours, achiasmia, and ocular albinism: an overview. Doc Ophthalmol (2014) ; 129: (2): 71-84. |
[5] | Bodis-Wollner I. Visual electrophysiology in Parkinson’s disease: PERG, VEP and visual P300. Clin Electroencephalogram (1997) ; 28: (3): 143-7. |
[6] | Brown M, Marmor M, Zrenner E, Brigell M, Bach M. ISCEV Standard for Clinical Electro-oculography (EOG). Doc Ophthalmol (2006) ; 113: : 205-12. |
[7] | Holder GE, Brigell MG, Hawlina M, Meigen T, Bach M, et al. ISCEV standard for clinical pattern electroretinography. Doc Ophthalmol (2007) ; 114: : 111-6. |
[8] | McCulloch DL, Marmor MF, Brigell MG, Hamilton R, Holder GE, Tzekov R, et al. ISCEV Standard for full-field clinical electroretinography. Doc Ophthalmol (2015) ; 130: : 1-12. |
[9] | Odom JV, Bach M, Brigell M, Holder GE, McCulloch DL, Tormene AP, et al. ISCEV standard for clinical visual evoked potentials. Doc Ophthalmol (2010) ; 120: : 111-9. |
[10] | Brigell M, Bach M, Barber C, Moskowitz A, Robson J. Guidelines for calibration of stimulus and recording parameters used in clinical electrophysiology of vision. Doc Ophthalmol (2003) ; 107: : 185-93. |
[11] | Hagan RP, Quinn KJ, Milner L, et al. Reproducibility Of Visual Electrophysiology Recordings Between Laboratories: The Importance Of Regular Calibration. Invest Ophthalmol & Vis Sci (2012) ; 53: (14): 5707. |
[12] | Rosenblum AE, Orte DL, Reed LL, et al. Reproducibility of Intraoperative Visual Evoked Potentials: A Review of 141 Cases Undergoing Prone Spinal Procedures. American Journal of Electroneurodiagnostic Technology (2010) ; 50: : 79-100. |
[13] | Ding X, Dong W, Liu WL, et al. Measurement errors of flash parameters in visual electrophysiology. J Appl Optics (2014) ; 35: (6): 1048-1053. |
[14] | Torok B. Calibration device for ERG, PERG, mfERG, EOG and VEP recording equipment. Abstracts of the 44th; Symposium of ISCEV. 2006 Jun 11-15; Fontevraud, France. Doc Ophthalmol (2006) ; 112: : 127-8. |
[15] | Song WQ, Tan Q, Xia ZH. Spatial characteristics of flash electroretinogram in normal subjects. Intl J Ophthal (2007) ; 7: (2): 438-41. |
[16] | Shen AP, Wu LZ, Wu DZ. Simultaneous recording of pattern electroretinogram and visual evoked potential in aging macular degeneration. Eye Sci (1988) ; 4: (4): 220-4. |
[17] | Long XG, Zhang CQ, Huang JG, Sun XL, Song CL. Pattern reversal visual evoked potentials in normal subjects. J Dalian Med Univ (1991) ; 13: (2): 14-8. |

