
Computer-aided detection for the automated evaluation of pulmonary embolism
Abstract
BACKGROUND:
There are few quantitative studies that directly evaluate methods of determining pulmonary embolism (PE). New computer-aided detection (CAD) methods for measuring PE may help in defining the relationship of PE to right heart failure (RHF).
OBJECTIVES:
We used CAD to investigate the severity of PE and explored whether the severity of PE was associated with RHF.
METHODS:
A fully automatic calculation conducted by CAD was made of the embolism area/lumen area, which was used to evaluate the severity of the PE. The vascular obstruction index (VOI) was also used to evaluate PE, using the Mastora and Qanadli scores. Paired
RESULTS:
There was no significant difference between the PE evaluated by Mastora compared with the measurement by CAD (
CONCLUSION:
We found strong correlation between RHF and the severity of PE evaluated by CAD, and the method was found to be simple and reliable.
1.Introduction
Pulmonary embolism (PE) is the third most common cardiovascular disorder, and is fatal in up to 30% of patients [1, 2, 3]. Delayed diagnosis of PE can lead to a higher risk of death [4]. Timely and accurate diagnosis is imperative for patients with suspected PE.
Spiral CT has greatly improved the diagnostic methods for PE and diagnostic accuracy has increased along with these improvements. In routine clinical practice, CT angiography is mainly used as a noninvasive method for depicting endoluminal clots. CT pulmonary angiography (CTPA) closely resembles pulmonary artery angiography (which is considered to be the gold standard for diagnosis), and in many institutions it has become the preferred method for detecting, and excluding, PE due to its noninvasiveness, availability, and accuracy [5]. Many parameters from CTPA were used to predict adverse outcomes in patients with PE. One of the most commonly used parameters to evaluate right heart failure (RHF) is the ratio of right ventricular diameter (RVD)/left ventricular diameter (LVD) [6] RHF is one of the most crucial prognostic factors for PE [7].
Some semi-quantitative methods can measure the location and degree of vascular obstruction, which can be used to evaluate the severity of PE. The most commonly used methods include the Mastora score and Qanadli score, which are known as the vascular obstruction index (VOI) [8, 9], and are measured on transverse images by a radiologist. However, these methods are inconvenient to perform, and different observers can obtain varying results. Recent studies have shown a strong correlation between the severity of PE as evaluated by Mastora or Qanadli scores and the RHF [10].
Recently, some studies have demonstrated the potential of automated computer aided detection (CAD) to evaluate PE. CAD has been shown to correctly identify several PEs that were missed previously, and to help increase the inexperienced reader’s ability to detect emboli [11, 12]. CAD can be an aid for inexperienced practitioners, and can improve consistency and diagnostic confidence in observers [13, 14]. Some researchers [11] have pointed out that using CAD can shorten reading times.
Our study investigates whether PE severity can be automatically assessed using CAD with a differential geometric approach, and compares the CAD assessment with Mastora and Quanadli scores to determine the inter-observer differencse between Mastora, Qanadli, and CAD in the interpretation of CTPA. We also explored if the severity of PE was associated with RHF at our hospital with 2750 beds.
2.Materials and methods
2.1Subject information
Subjects were eligible to participate in the study if they had a suspected PE between January 2014 to January 2016. All subjects in the trial gave written informed consent. Exclusion criteria included: 1) obvious abnormal lung lesions, other than embolism; 2) pleural effusion, or 3) image noise that prevented image analysis. This study has been performed with approval from the Chinese Clinical trials registry center (Registration No: ChiCTR-OCH-14004935), and has been approved by a local ethics committee.
2.2Scanning of CTPA
Subjects were scanned at full inspiration, with a 64-slice multidetector row CT (Philips Gemini TF 64 PET/CT). The scan covered the thoracic inlet to diaphragmatic crura. Images were obtained using 120 kV and 200 mA. 100 ml of nonionic contrast medium was injected at a rate of 4
2.3Vascular obstruction index
All CTPA images were analyzed using the pulmonary vascular and mediastinal settings on a 3D-enabled workstation. CTPA images were evaluated respectively by two radiologists (Li and Deng), who were blind to each other’s results. PE was quantified using the VOI calculated by the Mastora and Qanadli scoring systems.
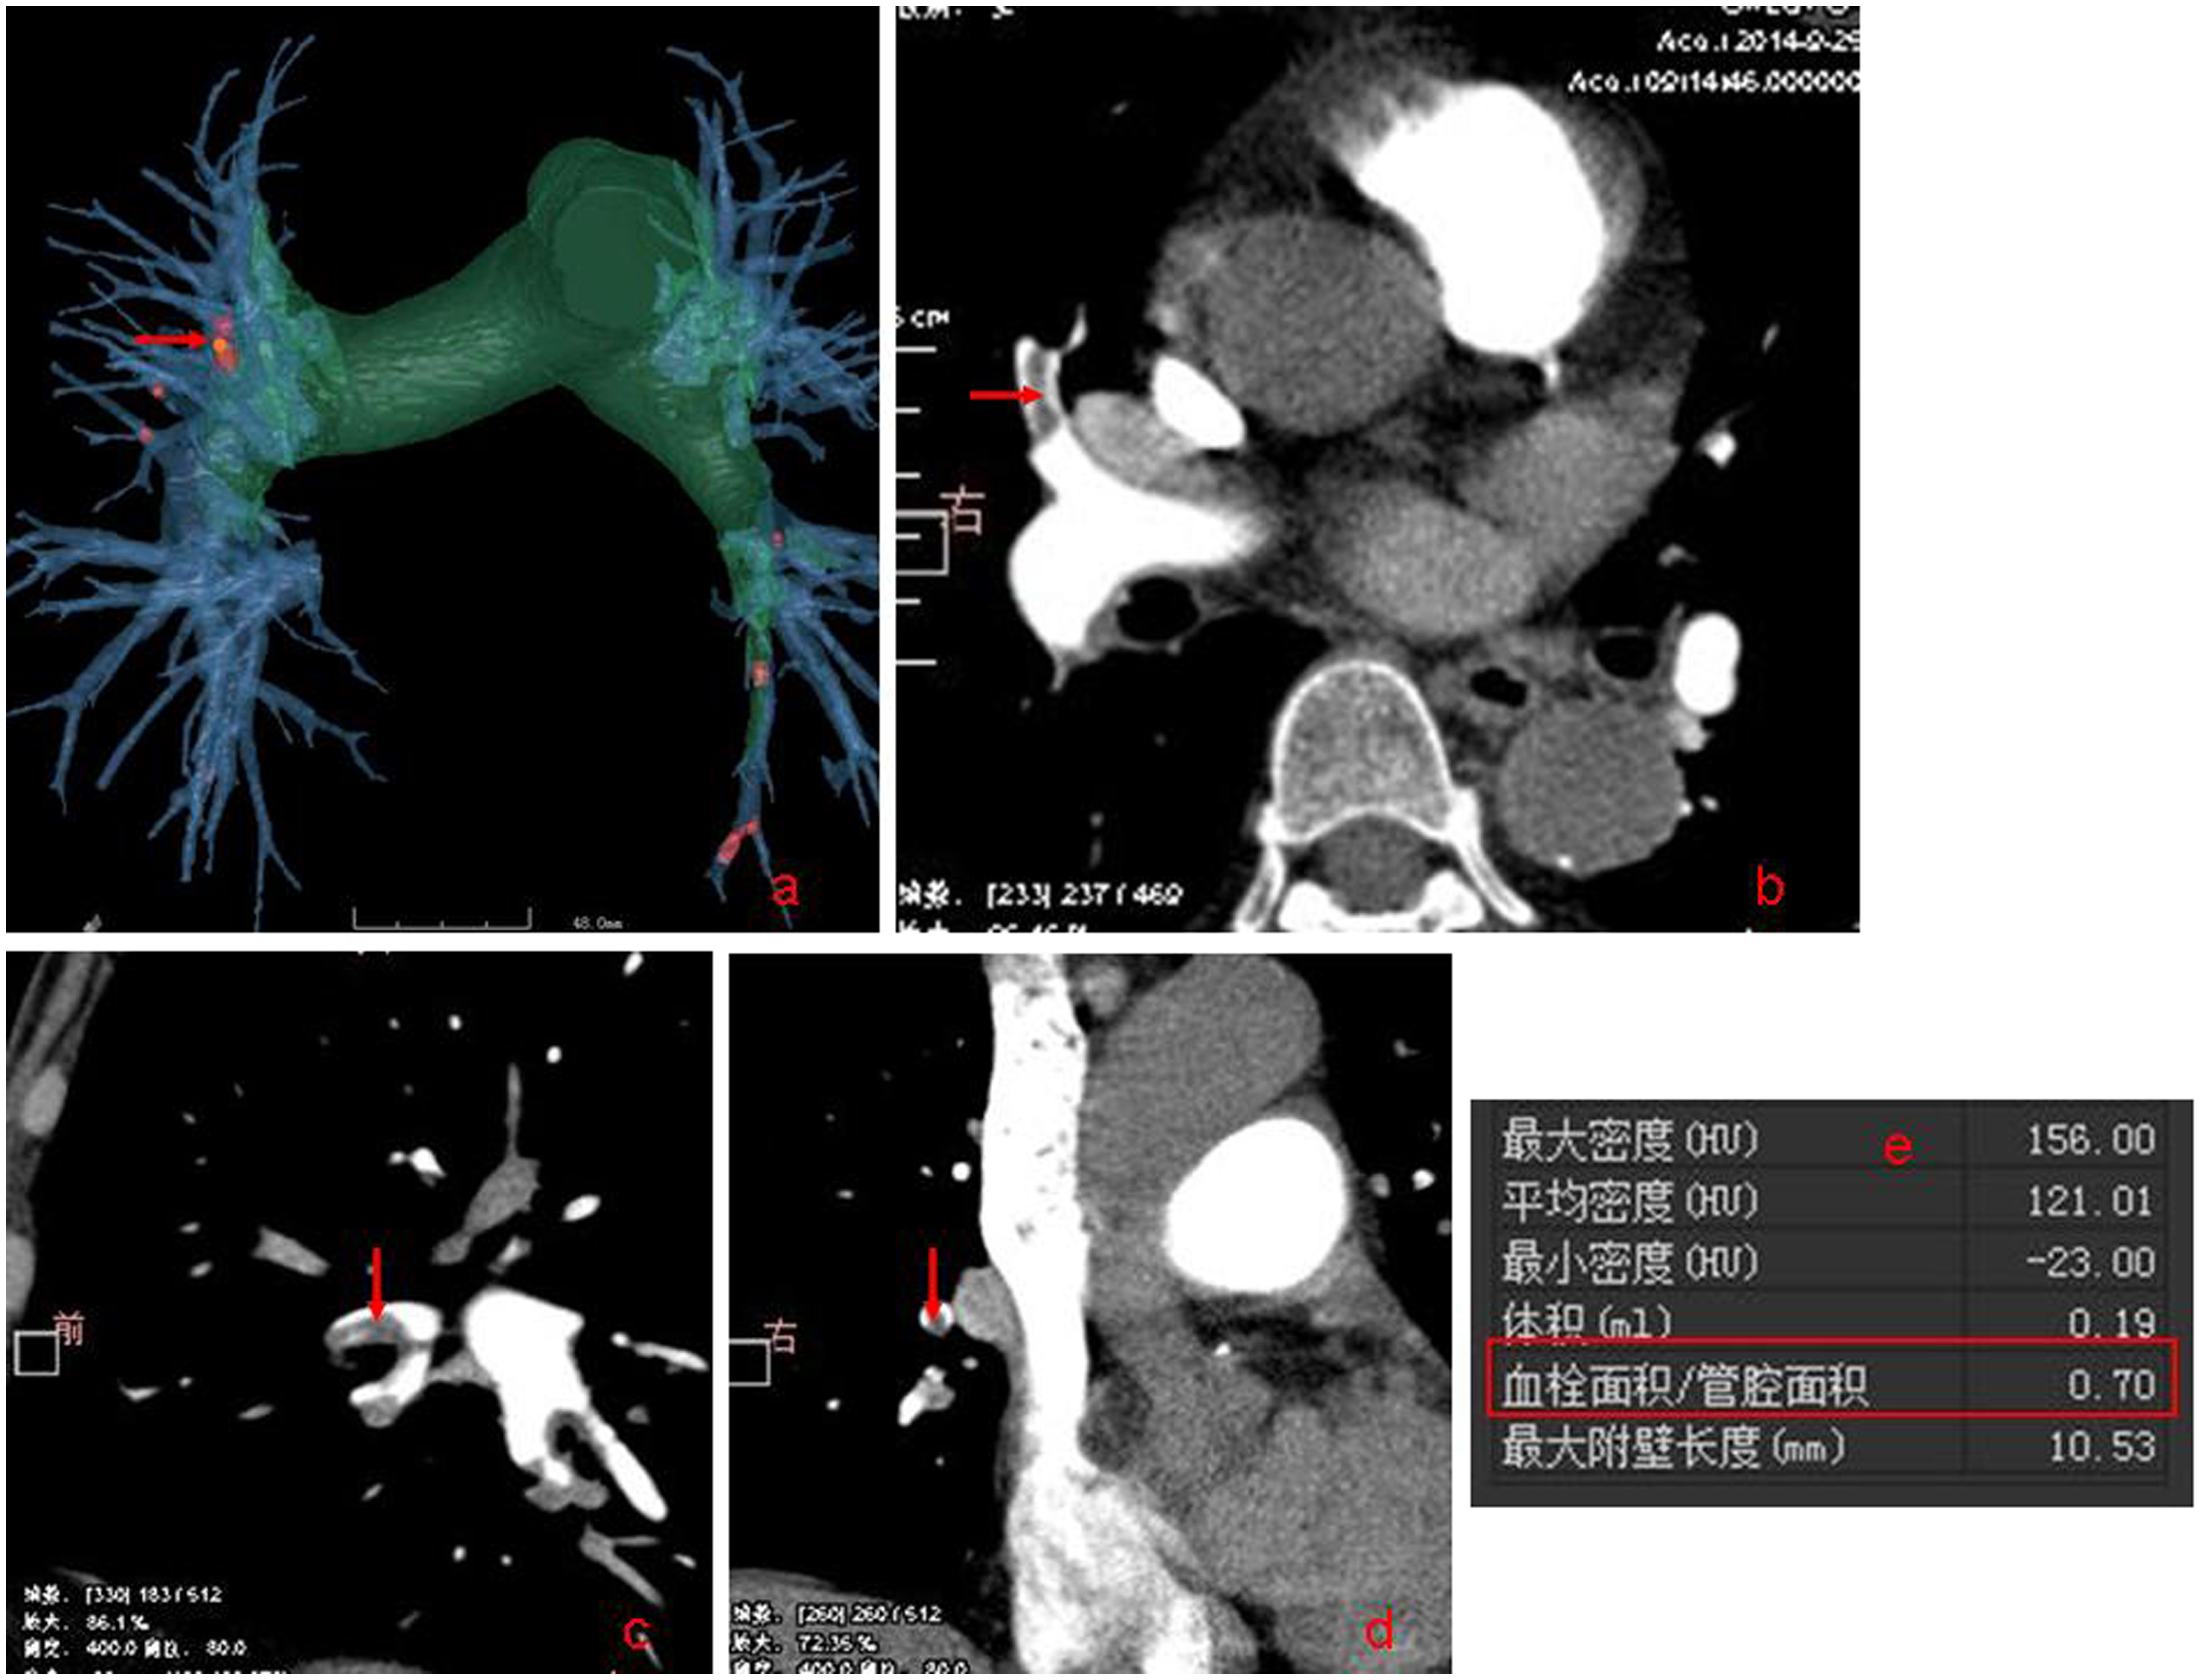
Figure 1.
Fully automatic identified pulmonary embolism and automatic calculated embolism area/ lumen area (red box).
The Mastora score was based on visual analysis, using a 5-point scale (5 for 100%; 4 for 75
Qanadli score was also based on visual analysis of each artery of interest. The pulmonary arterial tree of the lung has 10 segmental arteries. An embolus in the segmental artery resulted in a score of 1. Thus, the maximal obstruction score was 40[2
2.4A new fully automatic method of CAD
Five basic steps were included in the scheme, and were based on the vascular tree segmentation algorithm and fully automatic identification of embolism. First, the skeleton extraction algorithm for 3D segmentation of pulmonary vascular was performed. Then, all pulmonary vascular skeletons were automatically extracted and shown as a vascular tree. Next, PE was automatically identified, using the multi-scale method to identify low-density areas in the vessel and dynamic adjusting threshold. If in the vessel there was a different density region, then this region was established as a PE (Fig. 1). After this, a fully automatic calculation was made of the embolism area/lumen area (Fig. 1). Then, all the values were automatically exported into an Excel spreadsheet. Detailed descriptions of these computerized schemes have been reported elsewhere [12]. If the computerized schemes failed to accurately identify the vascular tree, these CT datasets from further quantitative analysis of the embolism area/lumen area were excluded.
2.5Quantification of the severity of RHF
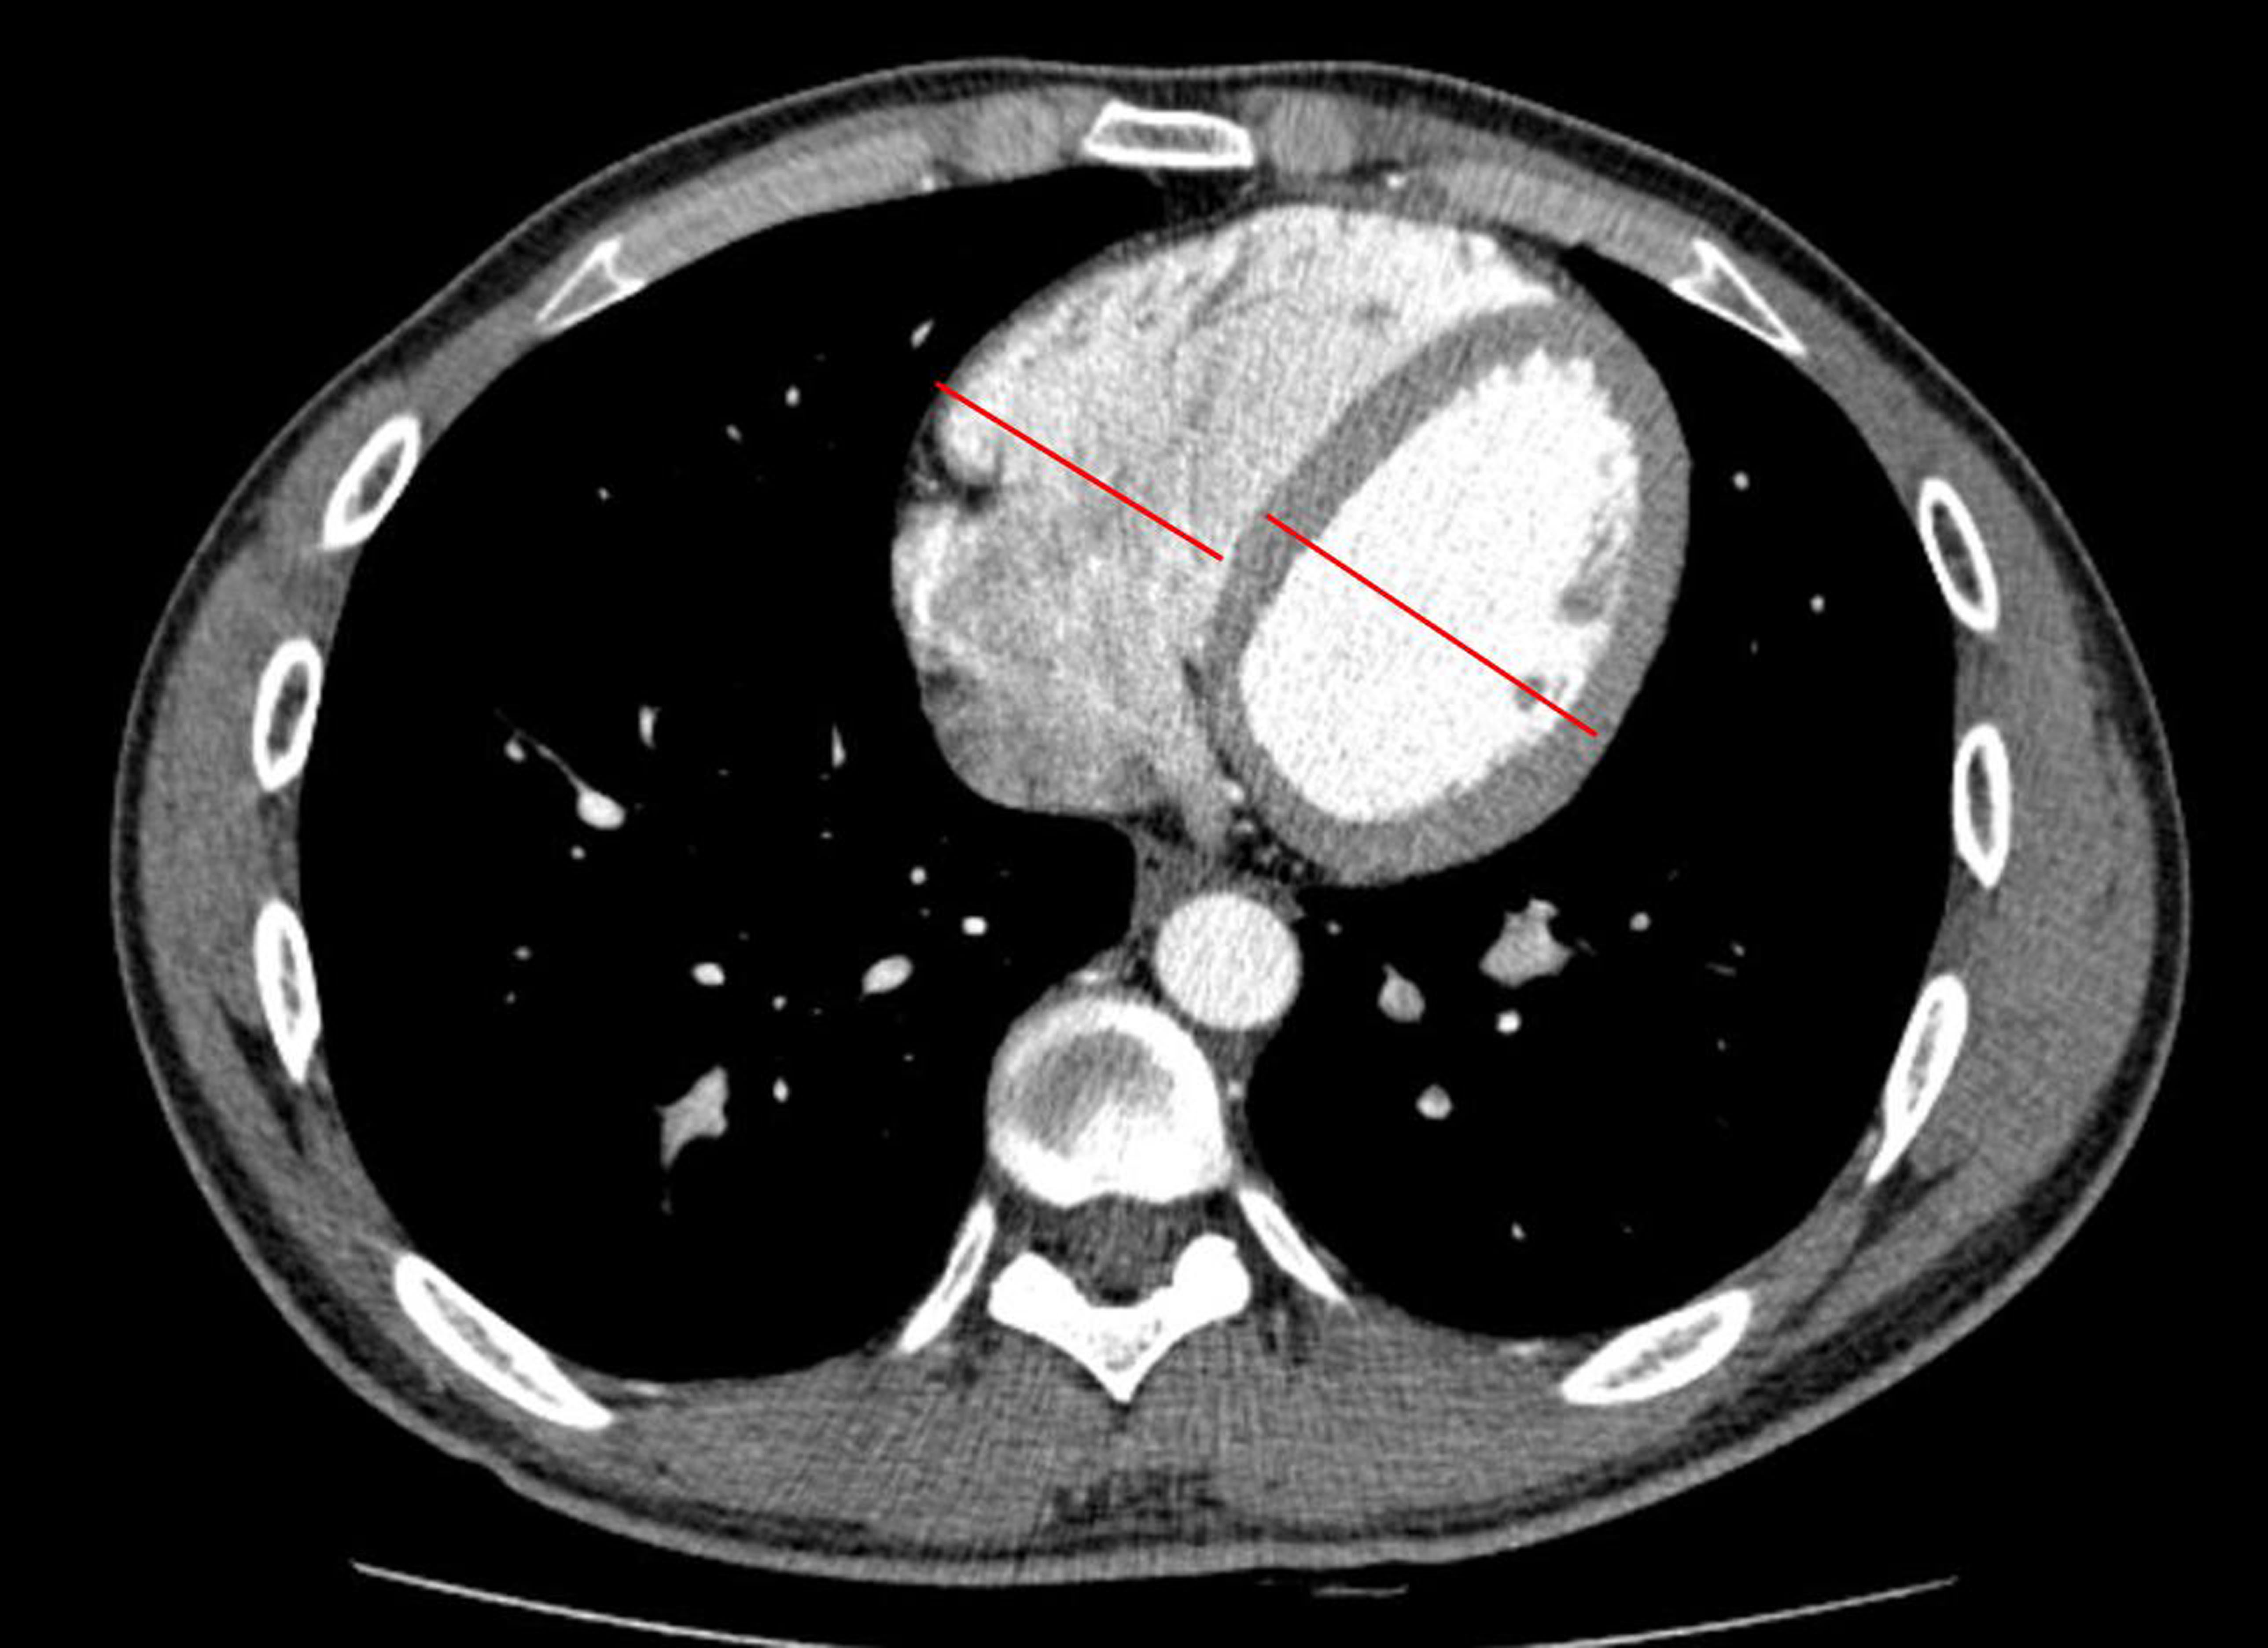
The severity of RHF was quantified using a computerized scheme. The quantification parameter was the RVD/LVD ratio as measured on a transverse CT image. The RVD/LVD ratio was used to indicate the severity of RHF in this study (Fig. 2.) The RVD/LVD ratio was calculated to measure the maximum short axis of RVD and LVD in the axial section.
Figure 2.
The method of measuring the widest diameter of the right ventricle and the left ventricle on the axial section.
2.6Statistical analysis
A paired
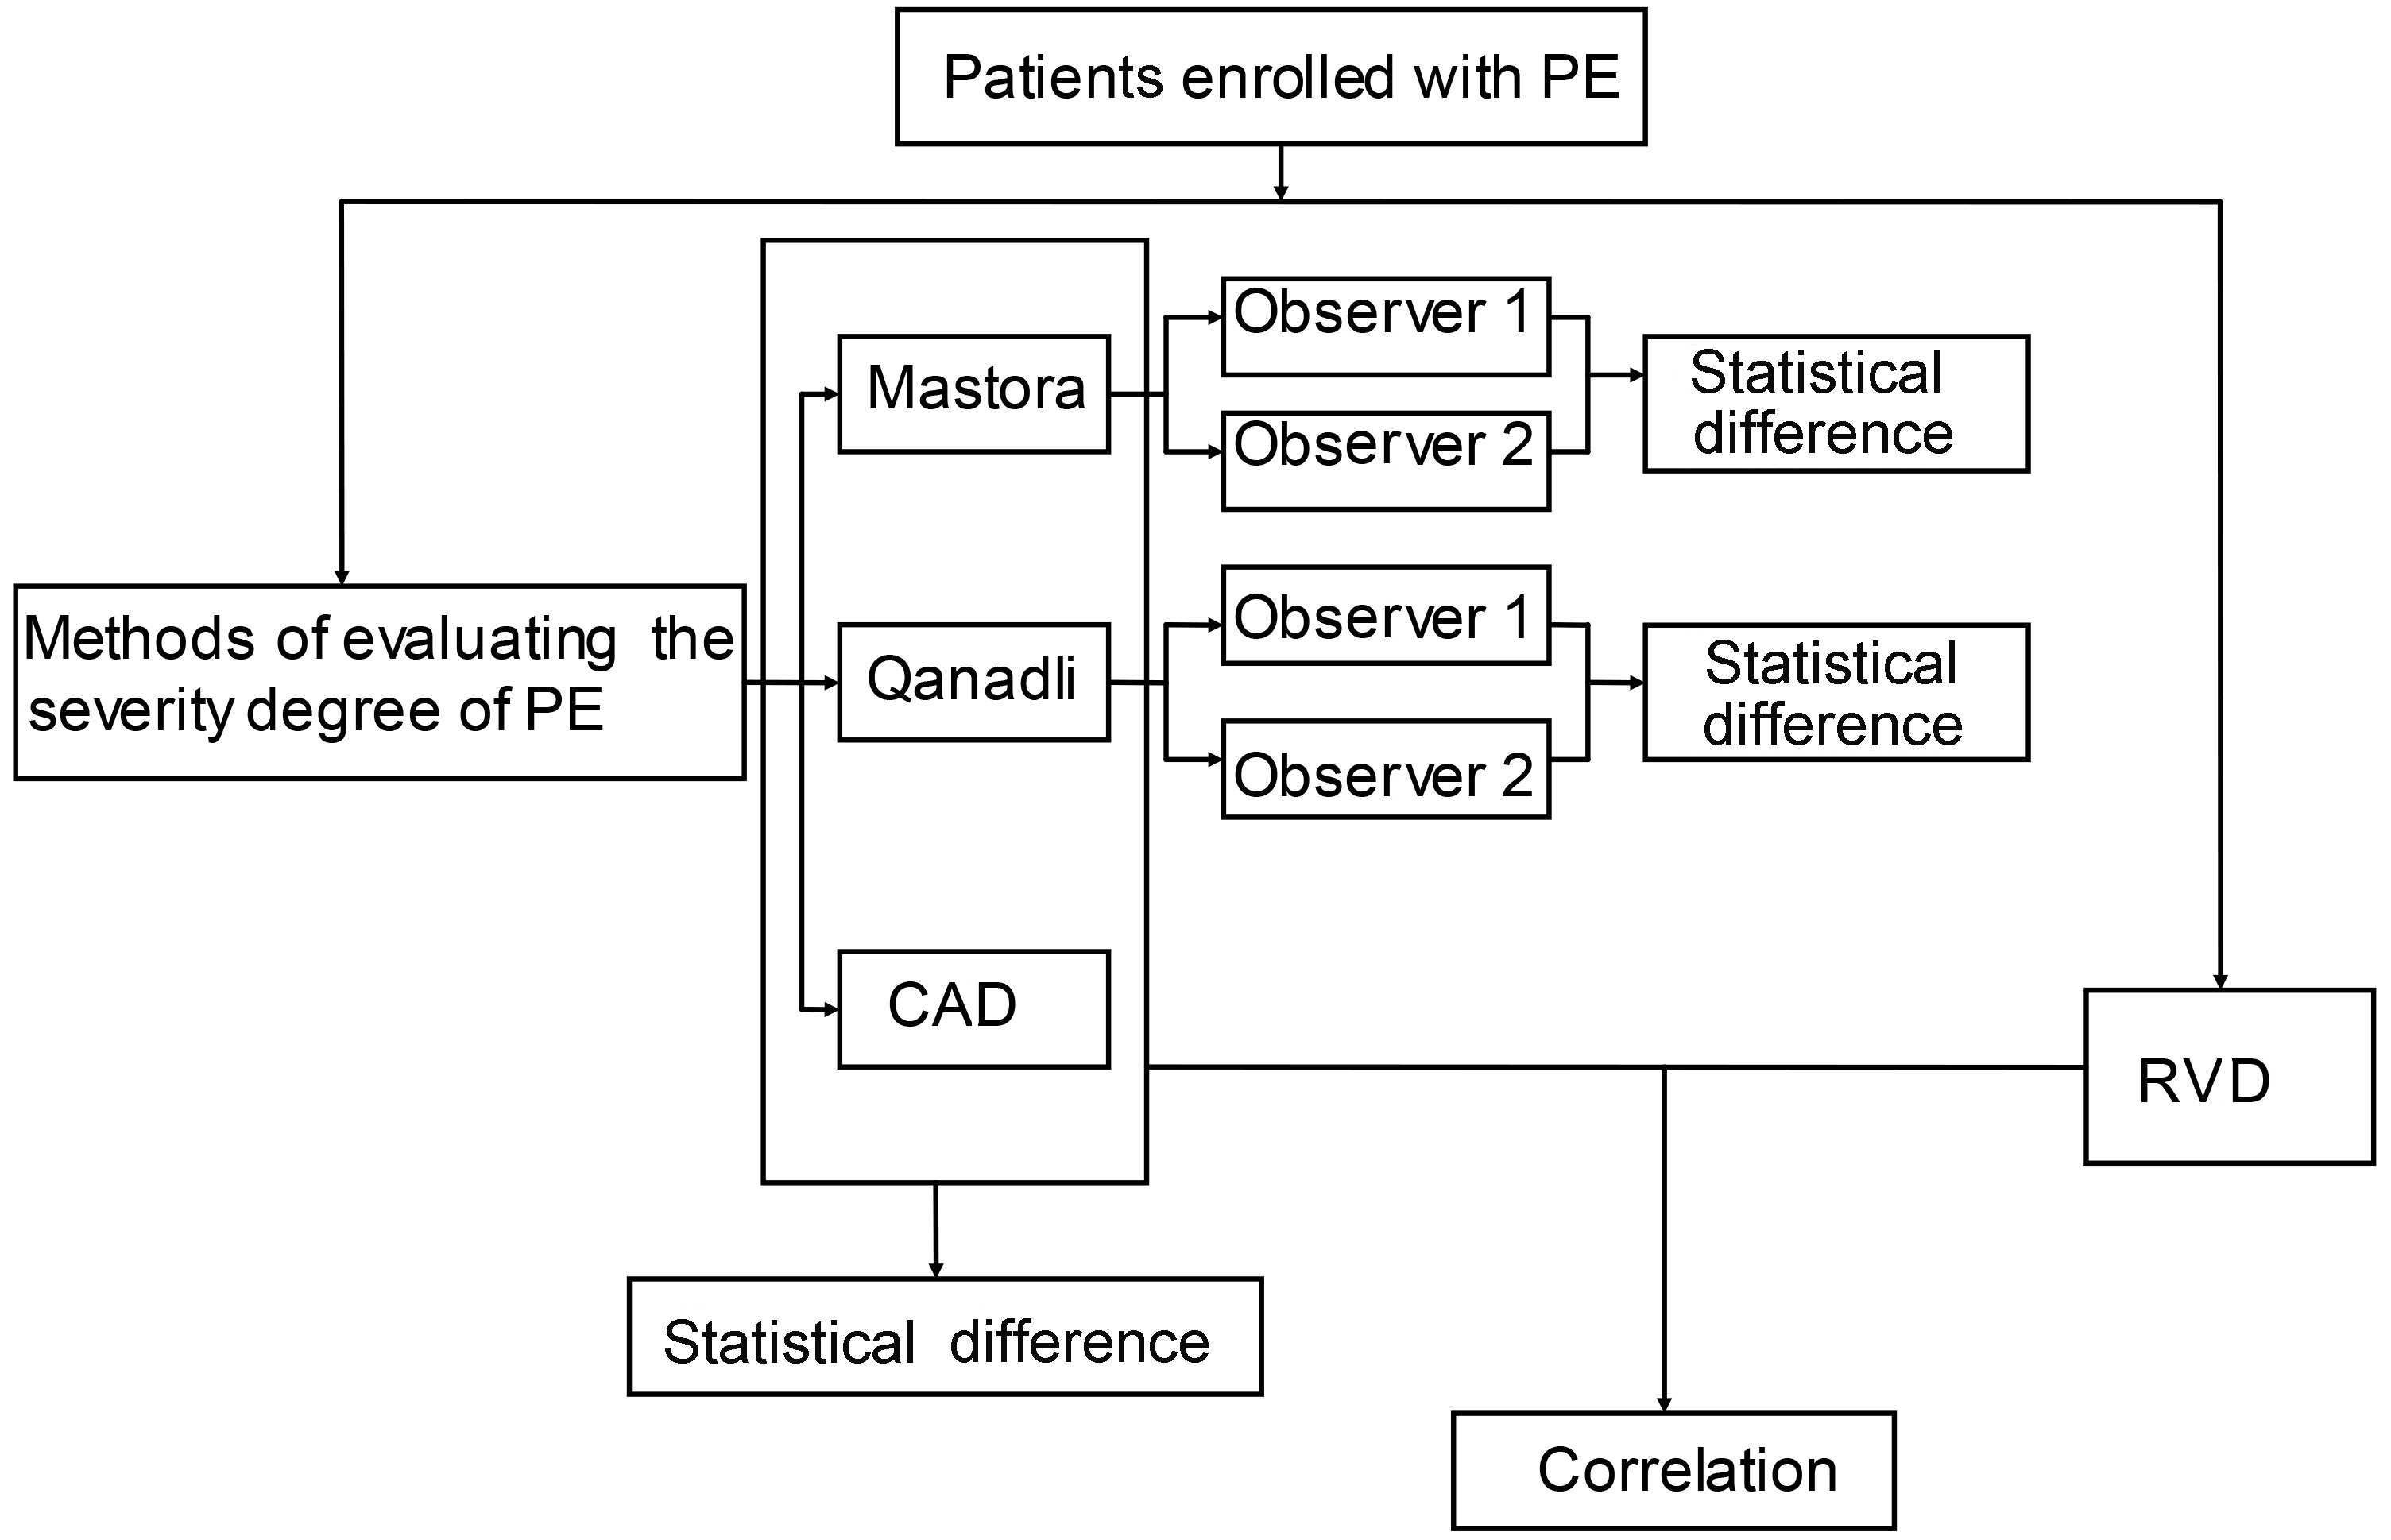
2.7Study design
The study design is shown in the flow diagram illustrated in Fig. 3.
3.Results
3.1Characteristics of the study subjects
Five hundred and fifty-seven subjects were enrolled in the study. The mean age was 59
3.2Evaluating the severity of PE with VOI by Mastora and Qanadli scores
The VOIs of every cross section of pulmonary artery were evaluated by observer 1 and observer 2 using both the Mastora and Qanadli score systems. There was no significant difference between observer 1 and observer 2 in the Mastora score (
3.3Automatic evaluation of the severity of PE with embolism area/lumen area by CAD
CAD can help detect intravascular emboli, especially for peripheral PE. Paired
Table 1
The statistical difference of the severity of PE evaluated by different methods or observers
| t value | P | ||
|---|---|---|---|
| Observer 1 | VS Observer 2 (Mastora) | 1.356 | 0.083 |
| Observer 1 | VS Observer 2 (Qanadli) | 1.224 | 0.095 |
| CAD | VS Mastora | 0.364 | 0.720 |
| CAD | VS Qanadli | 0.617 | |
| Mastora | VS Qanadli | 2.211 | 0.042 |
Figure 3.
Flow diagram of study design.
3.4Time cost
The average time cost for the two radiologists to read and determine the VOI of PE was 15.29 m
3.5Evaluating the relationship of PE to RHF
The correlation of the severity of PE and RHF was evaluated using Spearman’s rank correlation analysis. The severity of PE evaluated by Mastora, Qanadli, and CAD had significant positive correlation with RHF; all are shown in Table 2.
Table 2
The mean severity of PE and correlations with RHF
| Methods | Mean severity of PE | RHF | |
|---|---|---|---|
| R | P | ||
| CAD | 0.277 | 0.80 | 0.00 |
| Mastora | 0.207 | 0.75 | 0.01 |
| Qanadli | 0.255 | 0.69 | 0.02 |
4.Discussion
In this study, we developed a computerized scheme to automatically identify PE and evaluate the severity of obstruction. We found no significant difference between the severity estimated by the new CAD system and the severity estimated by the Mastora or Qanadli scoring systems (
In this study, we quantified the severity of PE, and estimated the results using VOI through Mastora and Qanadli scoring which have been widely used to assess PE. Earlier studies have shown variations in VOIs determined by different radiologists [13]. In many clinical settings, medical residents must quickly and accurately provide initial interpretation of CTPA examinations in order to diagnose or exclude PE. These rapid evaluations often influence decisions regarding anticoagulant therapy and hospitalization. However, there was sometimes discordance between the findings of residents and the final findings of experienced radiologists. Often a large amount of time is spent identifying PE and calculating VOI, which can lead to delays in clinical treatment. To address this, we adopted a new computer-automated measurement method to identify PE. This new method was accurate and the time cost was much less than visual determination of Mastora or Qanadli scores. Our results were similar to other recent reports [14].
PE often increased right ventricular pressure, and increased the mortality of patients with pulmonary hypertension [15]. The relationship between the right ventricular pressure and the severity of PE has been reported elsewhere [10]. Researchers have shown that quantifying the right ventricular pressure overload and the severity of PE is needed to identify signs of right heart failure (RHF) on spiral CT scans and to measure RHF severity. Quantification of the RVD/LVD ratio [16] is a reproducible identification parameter for RHF. This can predict adverse clinical events and short-term mortality of patients with PE.
It has been found that the VOI of PE measured by Qanadli score strongly correlates to RHF [10], which was consistent with our conclusion. Patients with PE had expanded RHF as VOI increased. This expansion in RHF may be related to increases of pressure in the right ventricle. To our knowledge, the relationship between RHF and the severity of PE measured by automatic CAD has not been studied previously. Therefore, in our study, we evaluated the correlation of the severity of PE and RHF using Spearman’s rank correlation analysis, and found a strong correlation between them.
As mentioned above, previous quantitative assessments of PE have been performed. The scheme we used in this study has a number of advantages over these previous studies: First, the objective of this research was to evaluate a new scoring system and to determine its speed and accuracy in routine clinical practice. Second, the CT angiograms were read by two radiologists and evaluation was performed showing no statistical difference between observers in the assessment of pulmonary vascular obstruction on CT angiograms. Lastly, we included the analysis of cardiac chambers on CT angiograms, which also carry important prognostic and therapeutic implications.
There are several limitations of our study. It was based on the evaluation of a population of patients with massive PE without underlying cardiopulmonary disease. We excluded patients with suboptimal CT scans who represent a non-negligible proportion of patients referred for CT angiography of the pulmonary circulation. Further evaluation of our method is necessary.
Conclusion
In conclusion, we propose a fully-automated computer approach to identify PE that has several advantages including simplicity, reliability, and convenience of use in routine clinical practice. We also found a strong correlation between RHF and the severity of PE. Our findings showed that the severity of PE can be measured, which may reflect the expansion of RHF. Therefore, CAD is a satisfactory method to use, as it is able to effectively and objectively quantify PE.
Conflict of interest
None to report.
Acknowledgments
This study was funded by the Ministry of Health project 201402013 and the First Affiliated Hospital of Xi’an Jiaotong University fund 2014YK27.
References
[1] | Goldhaber SZ, Bounameaux H. Pulmonary embolism and deep vein thrombosis. Lancet (2012) ; 3791835–1846.: |
[2] | Pena E, Dennie C. Acute and chronic pulmonary embolism: an indepth review for radiologists through the use of frequently asked questions. Semin Ultrasound CT MR (2012) ; 33: : 500--521. |
[3] | Sadigh G, Kelly AM, Cronin P. Challenges, controversies, and hot topics in pulmonary embolism imaging. AJR Am J Roentgenol (2011) ; 196: : 497--515. |
[4] | Kumamaru KK, Hunsaker AR, Kumamaru H, George E, Bedayat A, Rybicki FJ. Correlation between early direct communicationof positive CT pulmonary angiography findings and improved clinical outcomes. Chest (2013) ; 144: : 1546--1554. |
[5] | Konstantinides SV, Torbicki A, Agnelli G, Danchin N, Fitzmaurice D, Galie N, et al. 2014 ESC guidelines on the diagnosis and management of acute pulmonary embolism. Eur Heart J (2014) ; 35: : 3033--3069. |
[6] | Araoz PA, Gotway MB, Harrington JR, Harmsen WS, Mandrekar JN. Pulmonary embolism: prognostic CT findings. Radiology (2007) ; 242: : 889--897. |
[7] | Sanchez O, Trinquart L, Colombet I, Durieux P, Huisman MV, Chatellier G, et al. Prognostic value of right ventricular dysfunction in patients with haemodynamically stable pulmonary embolism: a systematic review. Eur Heart J (2008) ; 29: : 1569--1577. |
[8] | Qanadli SD, Hajjam M, Vieillard-Baron A, Joseph T, Mesurolle B, Oliva VL, et al. New CT index to quantify arterial obstruction in pulmonary embolism: comparison with angiographic index and echocardiography. AJR Am J Roentgenol (2001) ; 176: : 1415--1420. |
[9] | Mastora I, Remy-Jardin M, Masson P, Galland E, Delannoy V, Bauchart JJ, et al. Severity of acute pulmonary embolism: evaluation of a new spiral CT angiographic score in correlation with echocardiographic data. Eur Radiol (2003) ; 13: : 29--35. |
[10] | Shiina Y, Funabashi N, Fujikawa A, Lee K, Sekine T, Uehara M, evaluation of chronic pulmonary thromboemboli by multislice CT compared with pulsed Tissue Doppler Imaging and its relationship with brain natriuretic peptide. International Journal of Cardiology (2008) ; 130: : 505--512. |
[11] | Wittenberg R, Berger FH, Peters JF, Weber M, van Hoorn F, Beenen LF, et al. Acute pulmonary embolism: effect of a computer-assisted detection prototype on diagnosis – an observer study. Radiology (2012) ; 262: : 305--313. |
[12] | Kligerman SJ, Lahiji K, Galvin JR, Stokum C, White CS. Missed pulmonary emboli on CT angiography: assessment with pulmonary embolism computer-aided detection. AJR Am J Roentgenol (2014) ; 202: : 65--73. |
[13] | Bettmann MA, Baginski SG, White RD, Woodard PK, Abbara S, Atalay MK, et al. ACR Appropriateness Criteria acute chest pain–suspected pulmonary embolism. J Thorac Imaging (2012) ; 27: : 28--31. |
[14] | Lahiji K, Kligerman S, Jeudy J, White C. Improved accuracy of pulmonary embolism computer-aided detection using iterative reconstruction compared with filtered back projection. AJR Am J Roentgenol (2014) ; 203: : 763--771. |
[15] | Pu J, Fuhrman C, Good WF, Sciurba FC, Gur D. A differential geometric approach to automated segmentation of human airway tree. IEEE Trans Med Imaging (2011) ; 30: : 266-278. |
[16] | Shaham D, Heffez R, Bogot NR, Libson E, Brezis M. CT pulmonary angiography for the detection of pulmonary embolism: interobserver agreement between on-call radiology residents and specialists (CTPA interobserver agreement). Clinical Imaging (2006) ; 30: : 266--270. |


