
Validity of CAVI measurements for diagnosing hypertension in middle-aged and elderly patients and correlations of these measurements with relevant factors
Abstract
BACKGROUND:
The high risk of hypertension in middle-aged and elderly people has led to the development of the cardio-ankle vascular index (CAVI), a novel predictor of cardiovascular events.
OBJECTIVE:
This paper aimed to determine how reliably hypertension can be diagnosed in middle-aged and elderly people by measuring CAVI.
METHODS:
One hundred and ninety-five subjects (69 males/126 females; mean age of 56.06
RESULTS:
The CAVI was positively correlated with age, SBP, PP and PPI in the hypertension group (
CONCLUSION:
Compared with normal blood pressure measurements, CAVI measurements are relatively reliable for predicting hypertension in those over the age of 60. More attention should be paid to the CAVI
1.Background
Cardiovascular disease is a major human disease. The high incidence, high morbidity and high mortality of cardiovascular disease have become a major public health and safety problem, and increasing numbers of younger people are now tending to become afflicted with this disease [1, 2]. Hypertension is the most common condition associated with cardiovascular disease, and its etiology and pathogenesis is complex and has not been fully clarified [3]. Hypertension is a systemic condition associated with the pathological development of a small amount of arteriosclerosis that occurs most often in middle-aged and elderly people. Atherosclerosis is four times more prevalent in patients with hypertension than in patients with normal blood pressure [4]. Therefore, intervening in cardiovascular disease with hypertension at the subclinical stage and identifying asymptomatic patients at high risk at such an early stage are fundamental measures to ward off and control cardiovascular events.
Currently, effective control of hypertension is only 6.1%, the major causes of low control is due to the patient can not accurately measure their blood pressure. The cardio-ankle vascular index (CAVI) is a recently developed measure method involving a comprehensive analysis of limb blood pressure, ECG, PCG, and many other parameters based on the PWV [5, 6, 7, 8, 9]. The CAVI calculation is based on the stiffness parameter
Several studies have shown the CAVI to be significantly increased in hypertension patients, but few reports are available that describe how valid it is to use the CAVI to diagnose hypertension in middle-aged and elderly patients [13, 14, 15, 16]. Is CAVI feasible for the diagnosis of hypertension? The current study proposes a hypothesis that CAVI would diagnose hypertension to a certain extent. Therefore, we measured CAVI and collected information of subjects to analyze the diagnostic validity of the CAVI for hypertension for different age groups, and to uncover relationships between the CAVI and relevant factors. The overall aim of this study was to determine the applicability of the CAVI for diagnosing hypertension, and especially for providing a simple and noninvasive way to detect masked hypertension at an early stage.
2.Methods
2.1Subjects
One hundred and ninety-five subjects (69 males and 126 females; mean age of 56.06
2.2Measurement of the CAVI
The CAVI was measured with a Vasera VS-1000 arterial function detection instrument (Fukuda Company, Beijing, China). All subjects were made to lie in a supine position, with the head held at the midline position, and the palms of the hands turned upwards from the subject’s sides. After resting for 10–20 minutes, the measurement was made. Electrocardiograph electrodes were placed on both wrists in order to collect the ECG waveform, a minitype recorder for detecting heart sounds was placed over the fourth rib at the left edge of the sternum, and blood pressure cuffs were wrapped around both the arms and ankles. CAVI values were automatically measured by the instruments, and the data were then analyzed computationally.
The CAVI was calculated by using Eq. (1),
(1)
where
2.3Relevant factors
The pulse rate, blood pressure and ankle brachial index (ABI) were simultaneously measured with the measurement of the CAVI, all at rest and at the appropriate room temperature to ensure that the test results of the subjects were not affected by the environment. Note that the ABI is the ratio of the highest blood pressure values of the ankle to the highest blood pressure values of the upper arm, and evaluates stenosis or occlusion of the lower limb caused by atherosclerosis. The pulse pressure index (PPI) was calculated using the equation (PPI
2.4Statistical analysis
Data were stored in Excel 2013 and statistical analysis was performed with SPSS 15.0. Data values were expressed as percentages and meanSD.195 patients were classified into 2 groups (healthy group and hypertension group) according to the hypertension, and then they were stratified by 10-year layers into 5 subgroups (30–39, 40–49, 50–59, 60–69, 70 above). The data were statistically analyzed using the independent sample T-test, Pearson Correlations, Multivariate Linear Regression, One-way Analysis of Variance and ROC curve statistical methods to evaluate the relevant factors and diagnosis validity of CAVI for middle-aged and elderly population with hypertension. A difference was considered significant if the P value was
3.Results and discussion
3.1Clinical baseline characteristics of the study participants
The selected groups were divided into healthy group (
Table 1
Comparison of clinical characteristics in different groups
| Characteristics | Healthy (N | Hypertension (N | t | P | 95%CI | |||
|---|---|---|---|---|---|---|---|---|
| Age (years) | 53.1 | 63.8 | .01 | 0.000 | ||||
| Male/female | 40/101 | 29/25 | 3 | .39 | 0.001 | 0.11 | ||
| Height | 163.74 | 167.26 | .23 | 0.001 | ||||
| Weight | 63.57 | 70.54 | .37 | 0.000 | ||||
| BMI | 23.59 | 25.14 | .35 | 0.001 | ||||
| SBP (mm Hg) | 123.13 | 149.44 | .31 | 0.000 | ||||
| DBP (mm Hg) | 76.82 | 89.52 | .25 | 0.000 | ||||
| PP (mm Hg) | 46.31 | 59.93 | .88 | 0.000 | ||||
| PPI | 0.38 | 0.40 | .20 | 0.002 | ||||
| Heart rate | 68.76 | 70.22 | .88 | 0.381 | ||||
| ABI | 1.08 | 1.09 | .52 | 0.616 | ||||
| Blood viscosity | 4.50 | 4.64 | .14 | 0.258 | ||||
| CAVI | 7.75 | 9.13 | .67 | 0.000 | ||||
SBP: systolic blood pressure; DBP: diastolic blood pressure; PP: pulse pressure.
Table 2
Pearson correlations between the CAVI and relevant factors for the entire group, healthy group and hypertension group
| Related factors | Entire group ( | Healthy group ( | Hypertension group ( | |||||||||
| r | P | r | P | r | P | |||||||
| Age (years) | 0 | .728 | 0 | .000 | 0 | .693 | 0 | .000 | 0 | .656 | 0 | .000 |
| Height | 0 | .110 | 0 | .127 | 0 | .041 | 0 | .631 | .045 | 0 | .749 | |
| Weight | 0 | .109 | 0 | .130 | 0 | .089 | 0 | .291 | .242 | 0 | .078 | |
| BMI | 0 | .730 | 0 | .311 | 0 | .093 | 0 | .272 | .249 | 0 | .070 | |
| SBP (mm Hg) | 0 | .557 | 0 | .000 | 0 | .394 | 0 | .000 | 0 | .388 | 0 | .004 |
| DBP (mm Hg) | 0 | .347 | 0 | .000 | 0 | .245 | 0 | .003 | .107 | 0 | .443 | |
| PP (mm Hg) | 0 | .522 | 0 | .000 | 0 | .307 | 0 | .000 | 0 | .445 | 0 | .001 |
| PPI | 0 | .313 | 0 | .000 | 0 | .145 | 0 | .086 | 0 | .376 | 0 | .005 |
| Heart rate | .26 | 0 | .714 | .212 | 0 | .012 | 0 | .189 | 0 | .170 | ||
| ABI | 0 | .219 | 0 | .002 | 0 | .311 | 0 | .000 | 0 | .101 | 0 | .467 |
| Blood viscosity | 0 | .132 | 0 | .066 | 0 | .016 | 0 | .847 | 0 | .248 | 0 | .071 |
3.2Pearson correlations between the CAVI and the relevant factors
Pearson correlations between the CAVI and the relevant factors are shown in Table 2. The CAVI was found to be positively and significantly correlated with age, SBP, DBP, PP, PPI and ABI in the entire group (
Table 3
Multiple linear regression analysis between the CAVI and relevant factors for the entire group, healthy group and hypertension group
| Related factors | Entire group ( | Healthy group ( | Hypertension group ( | |||
|---|---|---|---|---|---|---|
|
| P |
| P |
| P | |
| Age (years) | 0.073 | 0.000 | 0.067 | 0.000 | 0.083 | 0.000 |
| Height | 0.046 | 0.526 | 0.626 | 0.204 | 0.238 | |
| Weight | 0.682 | 0.075 | 0.448 | 0.227 | ||
| BMI | 0.041 | 0.863 | 0.362 | 0.574 | 0.305 | |
| SBP (mm Hg) | 0.064 | 0.404 | 0.311 | 0.044 | ||
| DBP (mm Hg) | 0.091 | 0.556 | 0.047 | |||
| PP (mm Hg) | 0.140 | 0.009 | ||||
| PPI | 0.037 | 0.551 | 0.060 | |||
| Heart rate | 2.628 | 0.026 | 0.896 | 0.041 | 0.005 | |
| ABI | 0.015 | 0.001 | 2.907 | 0.004 | 2.955 | 0.066 |
| Blood viscosity | 0.011 | 0.906 | 0.429 | 0.033 | 0.875 | |
3.3Multiple linear regression analysis between the CAVI and the relevant factors
A multiple linear regression analysis between the CAVI and the relevant factors are shown in Table 3. The independent factors positively correlated with the CAVI were found to be age, PP, heart rate and ABI (
Table 4
CAVI reference range in the middle-aged population
| Age | Number | CAVI value | ||
| (years) | ( |
| 95%CI | |
| 30 | 17 | 6.447 | 0.262 | 5.89 |
| 40 | 47 | 7.191 | 0.123 | 6.94 |
| 50 | 56 | 7.979 | 0.118 | 7.74 |
| 60 | 47 | 8.768 | 0.167 | 8.43 |
| 70 above | 28 | 9.954 | 0.234 | 9.47 |
| There were significant difference ( | ||||
Table 5
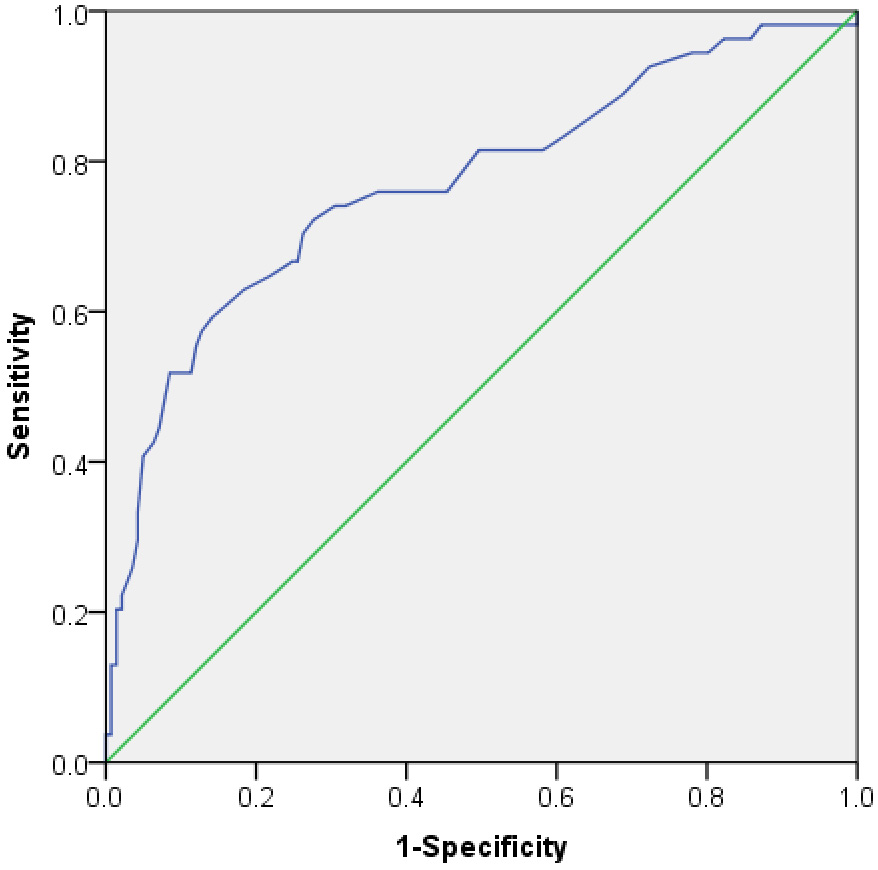
Area under the curve of the CAVI variable
| AUC: The area under the curve. | ||||
|---|---|---|---|---|
| Variable | AUC |
| P | 95%CI |
| CAVI | 0.770 | 0.041 | 0.000 | 0.690 |
Table 6
ROC curvilinear coordinates points of the CAVI variable
| Variable | Diagnostic point | Sensitivity | Specificity | Youden index |
|---|---|---|---|---|
| CAVI | …… | …… | …… | …… |
| 8.150 | 0.741 | 0.681 | 0.422 | |
| 8.250 | 0.741 | 0.695 | 0.436 | |
| 8.350 | 0.722 | 0.723 | 0.446 | |
| 8.450 | 0.704 | 0.738 | 0.441 | |
| 8.550 | 0.667 | 0.745 | 0.411 | |
| …… | …… | …… | …… |
Figure 1.
Change curve of CAVI values between each age group.
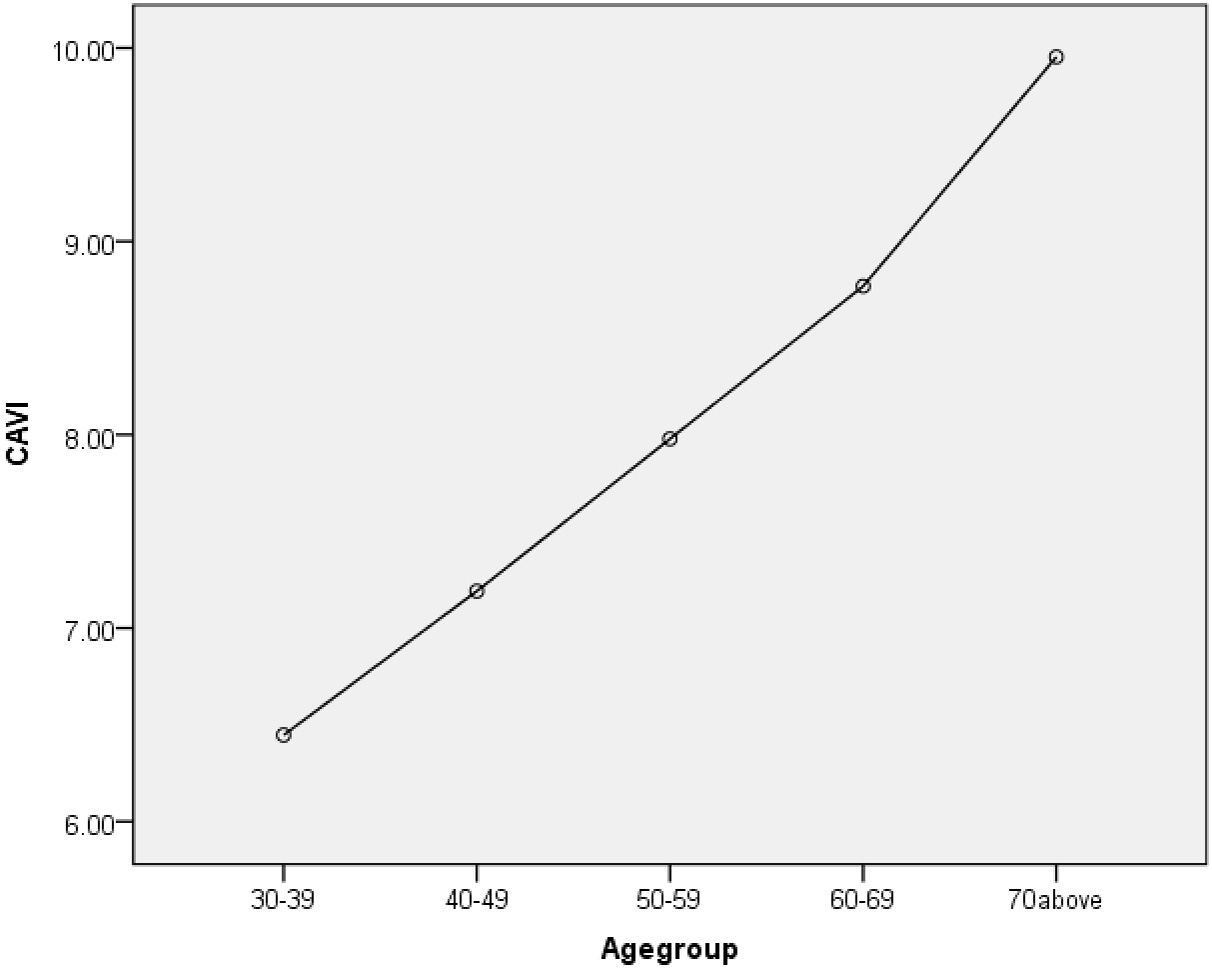
3.4CAVI reference range in middle-aged and elderly
Based on the above analysis, age was the main factor influencing the CAVI. As mentioned above, all subjects were divided into five age-dependent groups, and the data were analyzed by the One-way Analysis of Variance. The mean CAVI of these 30
3.5The relationship between the CAVI and hypertension
The diagnostic criterion of hypertension mentioned above is considered to be the gold standard. The CAVI was determined to have a certain predictive value for hypertension because the AUC value was 0.77 (0.7
3.6Comparison of the positive rate in different age groups
In this study, the subjects were divided into five groups by age, and converted the CAVI into positive (CAVI
Table 7
Comparison of the positive rate between CAVI and normal blood pressure measurements in each age group
| Age (years) | Number ( | CAVI positive rate | Normal positive rate | P | ||
|---|---|---|---|---|---|---|
| 30 | 17 | 1 | (5.9%) | 2 | (11.8%) | 0.545 |
| 40 | 47 | 3 | (6.4%) | 3 | (6.4%) | 1.000 |
| 50 | 56 | 17 | (30.4%) | 13 | (23.2%) | 0.393 |
| 60 | 47 | 31 | (66.0%) | 19 | (40.4%) | 0.013 |
| 70 above | 28 | 26 | (92.3%) | 17 | (60.7%) | 0.004 |
Figure 2.
ROC curve for forecasting hypertension by the CAVI.
3.7Discussion
The CAVI, due to its stability and independence of blood pressure, serves as an indicator of arteriosclerosis [18]. The CAVI has shown a tendency to increase with increasing age, suggesting that there should be different CAVI reference ranges for different ages [19]. In this study, CAVIs of the subjects with hypertension were found to be significantly greater than the healthy subjects, and increased with age, the positive correlation was found to be significant (
Hypertension is an independent risk factor for cardiovascular and cerebrovascular disease, and long-term high blood pressure can cause systemic arteriole lesions, and increased arterial stiffness. This study showed the mean CAVI to be significantly (
In principle of measurement of the CAVI, CAVI is associated with the pulse wave velocity, pulse wave velocity is associated with the blood vessels elasticity, arterial elasticity affects the change of blood vessel radius, and then which will affect the changes of blood pressure in turn. It is alike confirmed that CAVI is feasible to predict high blood pressure according to the principle of measurement of the CAVI. To improve on the current study, future studies should consider a large sample size, a sample that extends beyond a single group (i.e., beyond university teachers), and influencing factors beyond the traditional risk factors studied here, more importantly, the follow-up survey should be carried out to validate this study by epidemic statistics.
4.Conclusions
As you can see from above, CAVI has a greater statistical significant difference in hypertension patients, and measurement of the CAVI predicted hypertension much more reliably than did the measurement of normal blood pressure when the CAVI value was greater than or equal to 8.350 for people older than 60 years. We should pay more attention to this diagnosis point (CAVI
Conflict of interest
None to report.
Acknowledgments
We would like to acknowledge the support of School Hospital in Beijing University of Technology (Beijing, China), where the fieldwork and measurement took place. This work was supported by National Natural Science Foundation of China (81171107, 11472023).
References
[1] | Wang B, Wang Z. Explore the diagnosis and treatment progress of cardiovascular disease. Health Must-read Mag. (2013) ; 12: (8): 688. |
[2] | Li Y, Yang P, et al. Research Progress of Hypertension Impact to Cardiovascular disease. Chin J Primary Med Pharmacy. (2014) ; (5): 776-777. |
[3] | Fu G, Yu J. Cardiovascular System. Shanghai Jiao Tong University Press; (2010) . |
[4] | Chen G, McAlister FA, Walker RL, et al. Cardiovascular outcomes in Framingham participants with diabetes the importance of blood pressure. Hypertension. (2011) ; 57: (5): 891-897. DOI: 101161/HYPERTENSIONAHA.110.162446. |
[5] | Kim HJ, Nam JS, Park JS, et al. Usefulness of brachial-ankle pulse wave velocity as a predictive marker of multiple coronary artery occlusive disease in Korean type 2 diabetes patients. Diabetes Res Clin Pr. (2009) ; 85: (1): 30-34. DOI: 101016/j.diabres.2009.03.013. |
[6] | Seo WW, Chang HJ, Cho IS, et al. The value of brachial-ankle pulse wave velocity as a predictor of coronary artery disease in high-risk patients. Korean Circ J. (2010) ; 40: (5): 224-229. DOI: 104070/kcj.2010.40.5.224. |
[7] | Alvim RD, Santos PC, Dias RG, et al. Association between the C242T polymorphism in the p22phox gene with arterial stiffness in the Brazilian population. Physiol Genomics. (2012) ; 44: (10): 587-592. DOI: 101152/physiolgenomics.00122.2011. |
[8] | Rezai MR, Wallace AM, Sattar N, et al. Ethnic differences in aortic pulse wave velocity occur in the descending aorta and may be related to vitamin D. Hypertension. (2011) ; 58: (2): 247-253. DOI: 101161/HYPERTENSIONAHA.111.174425. |
[9] | Shirai K, Utino J, Saiki A, et al. Evaluation of blood pressure control using a new arterial stiffness parameter, cardio-ankle vascular index (CAVI). Curr Hypertens Rev. (2013) ; 9: (1): 66-75. |
[10] | Hayashi K, Handa H, Nagasawa S, et al. Stiffness and elastic behavior of human intracranial and extracranial arteries. J Biomech. (1980) ; 13: (2): 175-184. DOI: 10.1016/0021-9290(80)90191-8. |
[11] | Shirai K, Song M, Suzuki J, et al. Contradictory effects of β1-and α1-aderenergic receptor blockers on cardio-ankle vascular stiffness index (CAVI)-CAVI independent of blood pressure. J Atheroscler Thromb. (2010) ; 18: (1): 49-55. DOI10.5551/jat.3582. |
[12] | Takaki A, Ogawa H, Wakeyama T, et al. Cardio-ankle vascular index is superior to brachial-ankle pulse wave velocity as an index of arterial stiffness. Hypertens Res. (2008) ; 31: (7): 1347-1355. DOI: 101291/hypres.31.1347. |
[13] | Gong J. The diagnostic validity of the cardio-ankle vascular index of atherosclerosis and the research of cardio-ankle vascular index and hemorheological. Master degree thesis of Jinan University; (2012) . |
[14] | Wang H, Liu J, Zhao H, et al. Possible association between cardio-ankle vascular index and vascular lesion in hypertensive subjects. Beijing Med J. (2014) ; 36: (2): 81-83. |
[15] | Satoh-Asahara N, Suganami T, Majima T, et al. Japan Obesity and Metabolic Syndrome Study (JOMS) Group. Urinary cystatin C as a potential risk marker for cardiovascular disease and chronic kidney disease in patients with obesity and metabolic syndrome. Clin J Am Soc Nephrol. (2011) ; 6: (2): 265-273. DOI: 102215/CJN.04830610. |
[16] | Suzuki J, Sakakibara R, Tomaru T, et al. Stroke and cardio-ankle vascular stiffness index. J Stroke Cerebrovasc Dis. (2013) ; 22: (2): 171-175. DOI: 101016/j.jstrokecerebrovasdis.2011.07.010. |
[17] | Wang W, Zhang W, et al. Blood pressure measurement guide in China. Chin J Hypertens. (2012) ; 19: (12): 1101-1115. |
[18] | Shirai K, Utino J, Otsuka K, et al. A novel blood pressure-independent arterial wall stiffness parameter; cardio-ankle vascular index (CAVI). J Atheroscler Thromb. (2006) ; 13: (2): 101-107. DOI10.5551/jat.13.101. |
[19] | Chen B, Lv L, Tan Y, et al. CAVI and ABI research forecasts the value of coronary artery disease. Chin J Arterioscler. (2014) ; 22: (2), 163-167. |
[20] | Okura T, Watanabe S, Kurata M, et al. Relationship between cardio-ankle vascular index (CAVI) and carotid atherosclerosis in patients with essential hypertension. Hypertens Res. (2007) ; 30: (4): 335-340. DOI: 101291/hypres.30.335. |
[21] | Takaki A, Ogawa H, Wakeyama T, et al. Cardio-ankle vascular index is a new noninvasive parameter of arterial stiffness. Circ J. (2007) ; 71: (11): 1710-1714. DOI: 101253/circj.71.1710. |
[22] | Kadota K, Takamura N, Aoyagi K, et al. Availability of cardio-ankle vascular index (CAVI) as a screening tool for atherosclerosis. Circ J. (2008) ; 72: (2): 304-308. DOI: 101253/circj.72.304. |
[23] | Masugata H, Senda S, Himoto T, et al. Early detection of hypertension in a patient treated with sunitinib by measuring cardio-ankle vascular index. The Tohoku J Exp Med. (2009) ; 218: (2): 115-119. DOI10.1620/tjem.218.115. |
[24] | Sun CK. Cardio-ankle vascular index (CAVI) as an indicator of arterial stiffness. Integr Blood Press Control. (2013) ; 6: : 27. DOI10.2147/IBPC.S34423. |
[25] | Wang H. New arteriosclerosis index CAVI overview: from basic to clinical application. Peking university medical press; (2011) . |


