
Dosimetric comparisons of IMRT planning using MCO and DMPO techniques
Abstract
The goal of this study was to evaluate the use of multi-criteria optimization (MCO) in the planning and optimization of intensity-modulated radiotherapy (IMRT). Twenty (20) IMRT patients (ten (10) with prostate cancer and ten (10) with lung cancer) were randomly selected. The treatment plans for these patients were designed using direct machine parameter optimization (DMPO). Based on these plans, new plans were designed using multi-criteria optimization (MCO), keeping the optimization objectives and constraints unchanged. Comparisons were made between the new plans, which were based on MCO and DMPO, including the dose distribution, dose volume histogram (DVH), the optimization time and the number of monitor units (MUs). The plan designed using both optimization approaches satisfied all clinical requirements. For similar or better target coverage, the rectum, bladder and small bowel were better protected using MCO than when using DMPO. Additionally, MCO reduced the time for optimization by 58% on average, whereas the MUs increased the time for optimization by 32% on average for prostate cancer. For lung cancer cases, the entire lung, heart and spinal cord were better protected using MCO compared to DMPO. Similarly, MCO reduced the time for optimization by 59% on average, whereas the MUs increased the time for optimization by 11% on average. Compared to DMPO, MCO reduces the dose of the organs at risk (OAR) and shortens the time required for optimization.
1.Introduction
The purpose of the optimization of intensity-modulated radiotherapy (IMRT) inverse planning is to achieve high dose coverage of targets and, simultaneously, to protect organs at risk (OARs) and other tissues in addition to the targets to the maximum extent [1, 2]. The outcome of optimization is an optimal or suboptimal dose distribution. Because there is always more than one target and OAR, there are many corresponding objects and constraints used as part of inverse planning. Therefore, the optimization of inverse planning is considered to be multi-objective optimization.
Presently, treatment planning systems (TPS), both domestic and imported, generally solve the optimization problem by transforming it from a multi-objective problem into a single-objective problem with individual weights. A common strategy is to use the weighted sum of all the objectives and constraints to create a new objective, called a second-objective; the optimization of which is the purpose of inverse planning instead of MCO. Direct machine parameter optimization (DMPO) is one of the typical optimization techniques for the aforementioned optimization method. The outcome of optimization using DMPO depends greatly on the weight attached to each objective. Specifically, the larger the weight of one objective is, the more attention is paid to it during optimization. As a result, it will be satisfied preferentially in the final dose distribution. Generally, multiple objectives come into conflict with each other. This results in the exploration of the weighting setup using trial and error [1, 2, 3, 4]. This is a complicated procedure, and clinical experience is often required. It is often difficult to determine if the weighting used is appropriate for the problem. Coincidentally, it is difficult to determine if an outcome that is based on a specific set of weights has been globally optimized.
In this work, MCO is introduced into the optimization of inverse planning to address the weighting problem. The outcome of MCO is not a single optimal solution, but a set of optimal solutions called a set of Pareto optimal solutions [1, 3, 5]. A feasible solution can be selected from the Pareto optimal solutions to serve as a clinically desired outcome. Therefore, MCO is more flexible compared with DMPO.
2.Materials and methods
2.1Mathematical description of MCO
In mathematical terms, an MCO problem can be formulated as [2, 6]:
(1)
where the set
A solution
2.2Design of inverse planning
Ten prostate cancer and lung cancer patients who had received radiotherapy with the IMRT technique were randomly selected for this study. These inverse plans were designed by DMPO using Pinnacle3 v9.0 software. A series of CT images were passed through DICOM to RayStation v2.4.15.6 (RaySearch Laboratories, Sweden). The plans were redesigned using MCO for the same beam directions and objectives. The specific procedure was as follows: (1) Objectives of each OAR were set up according to the clinical demand. (2) The Pareto front was generated from Pareto plans. (3) Navigation to an appropriate solution was used for the Pareto front. (4) Deliverable plans were generated from setting up parameters such as the max segments number.
Plans for the prostate cancer patients were designed using 7 coplanar beams with angle intervals of 51
Figure 1.
Transverse, sagittal, and coronal dose distribution for the same prostate cancer patient. (Figure (a) shows the outcome using the MCO, and Figure (b) shows the outcome using the DMPO. The isodose curve from outer to inner was 10, 20, 30, 40, 50, and 53 Gy).
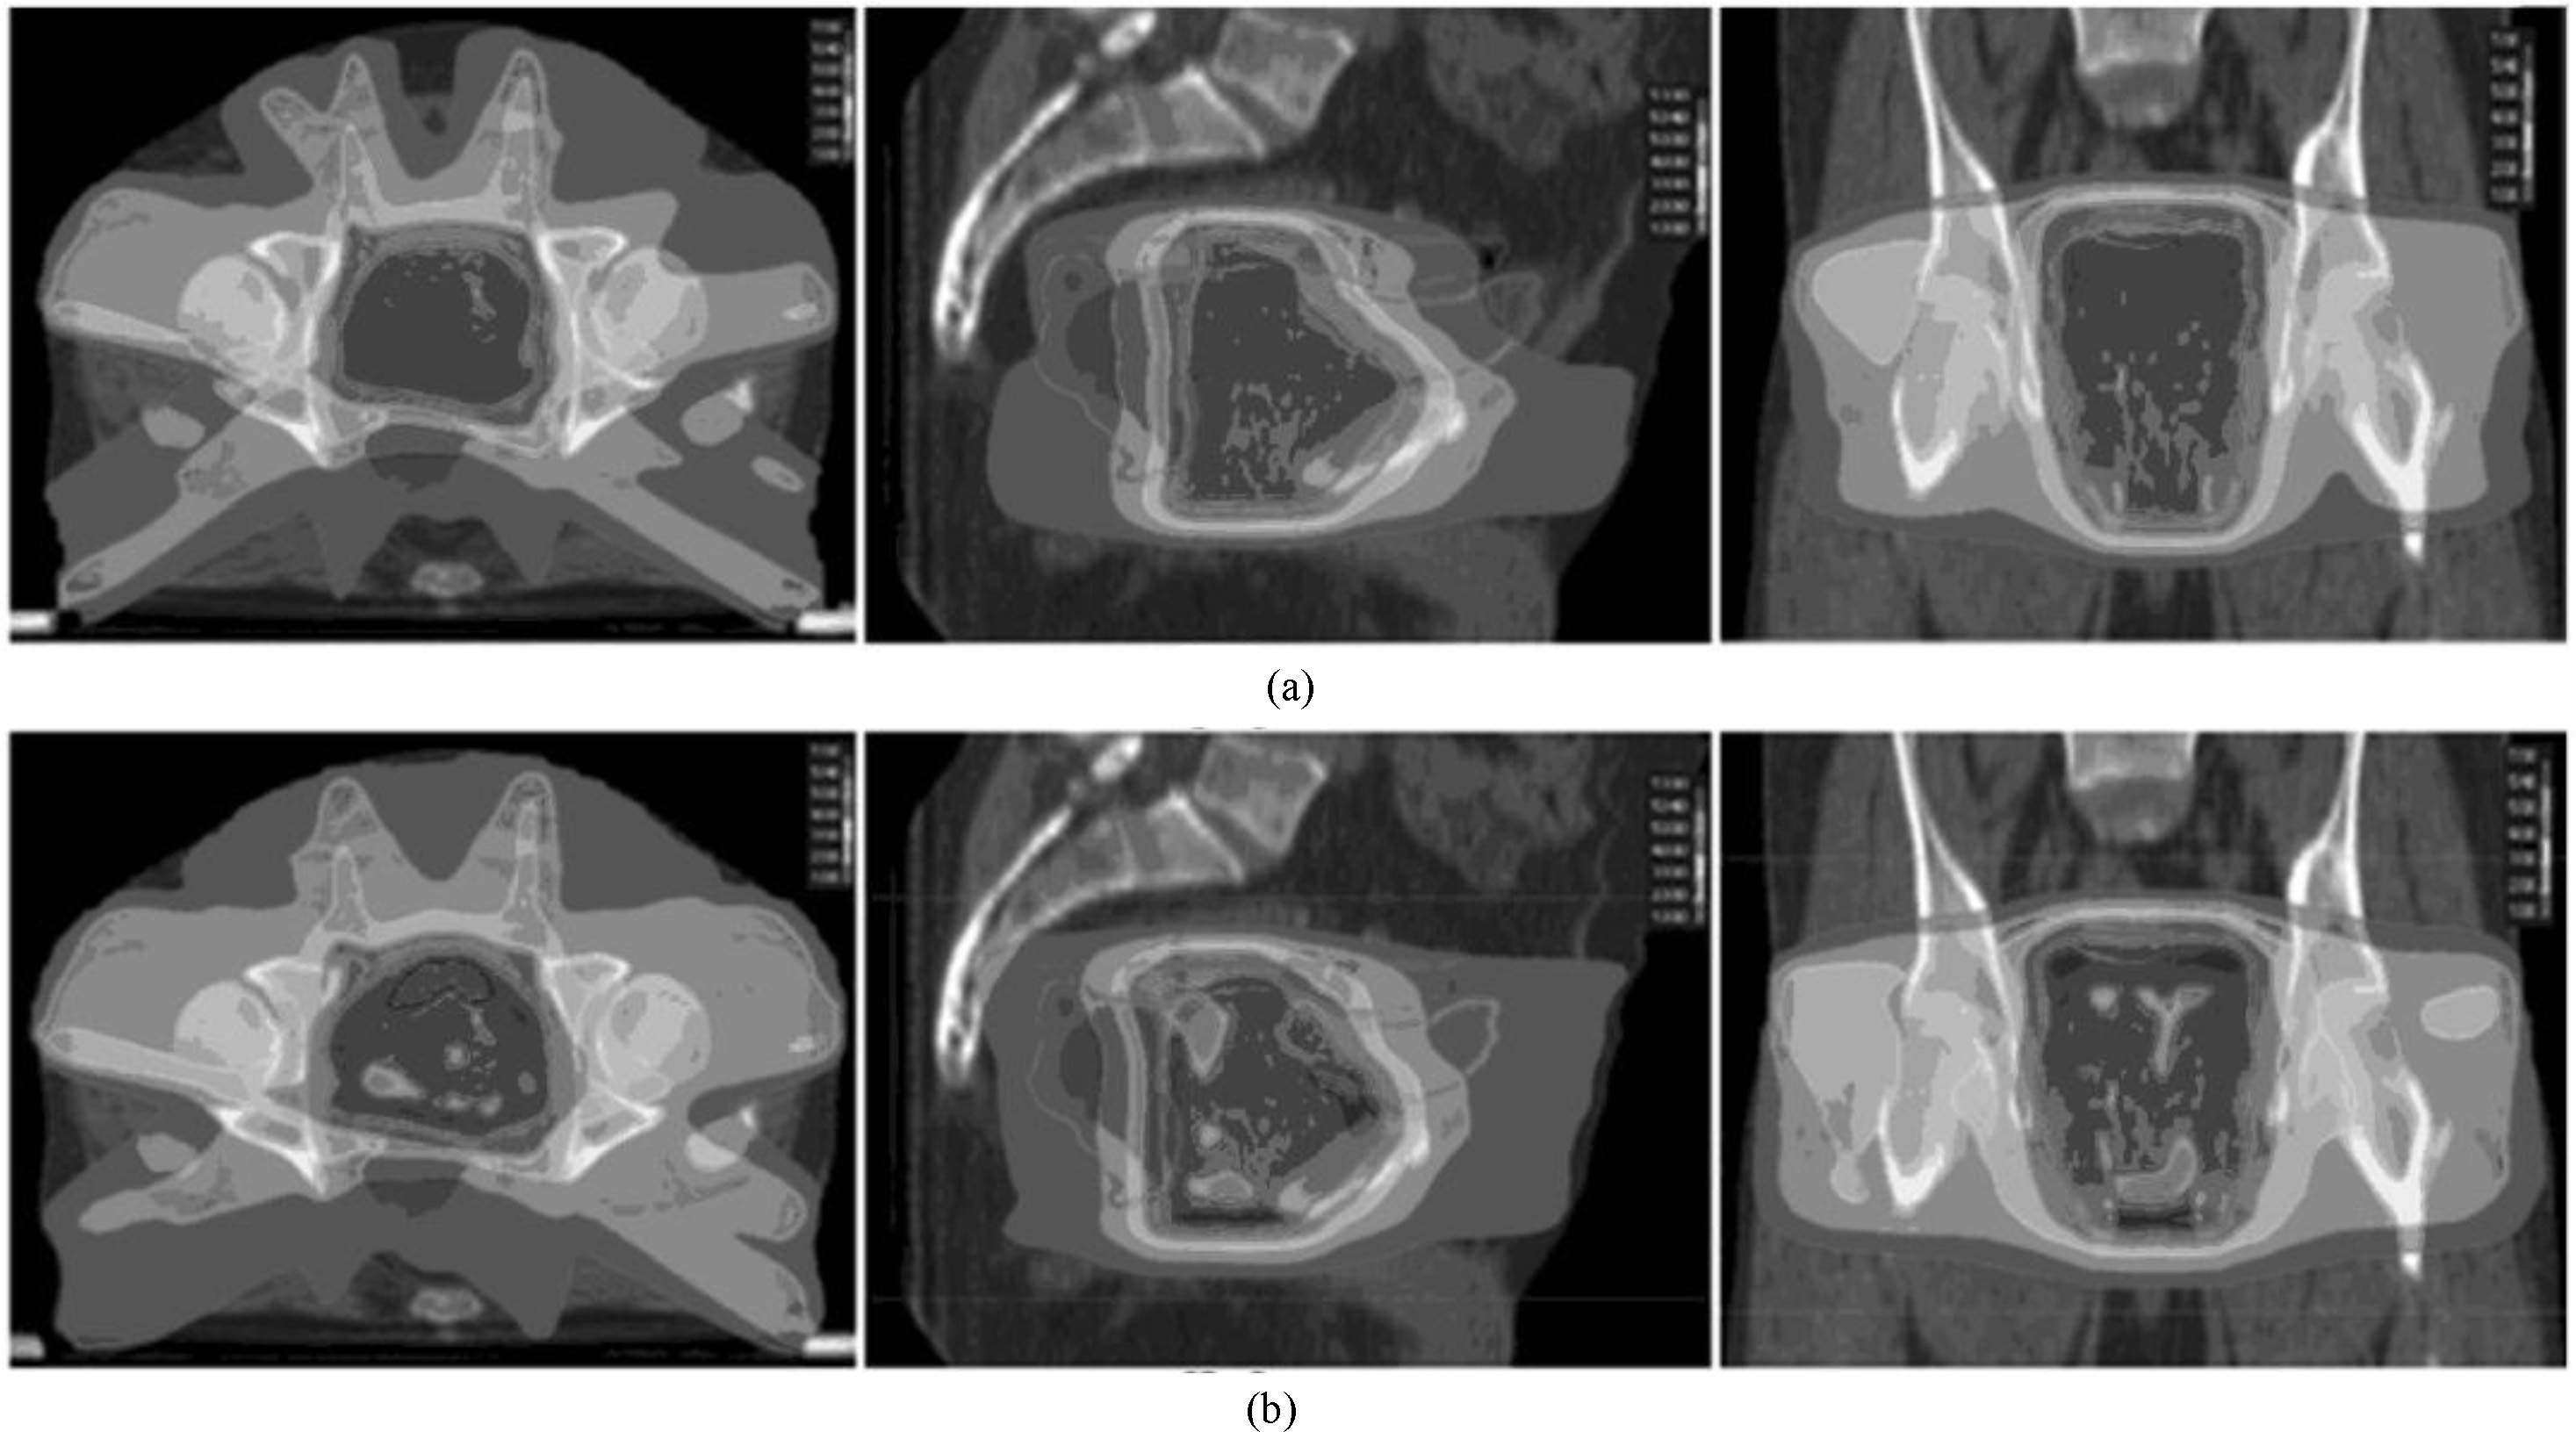
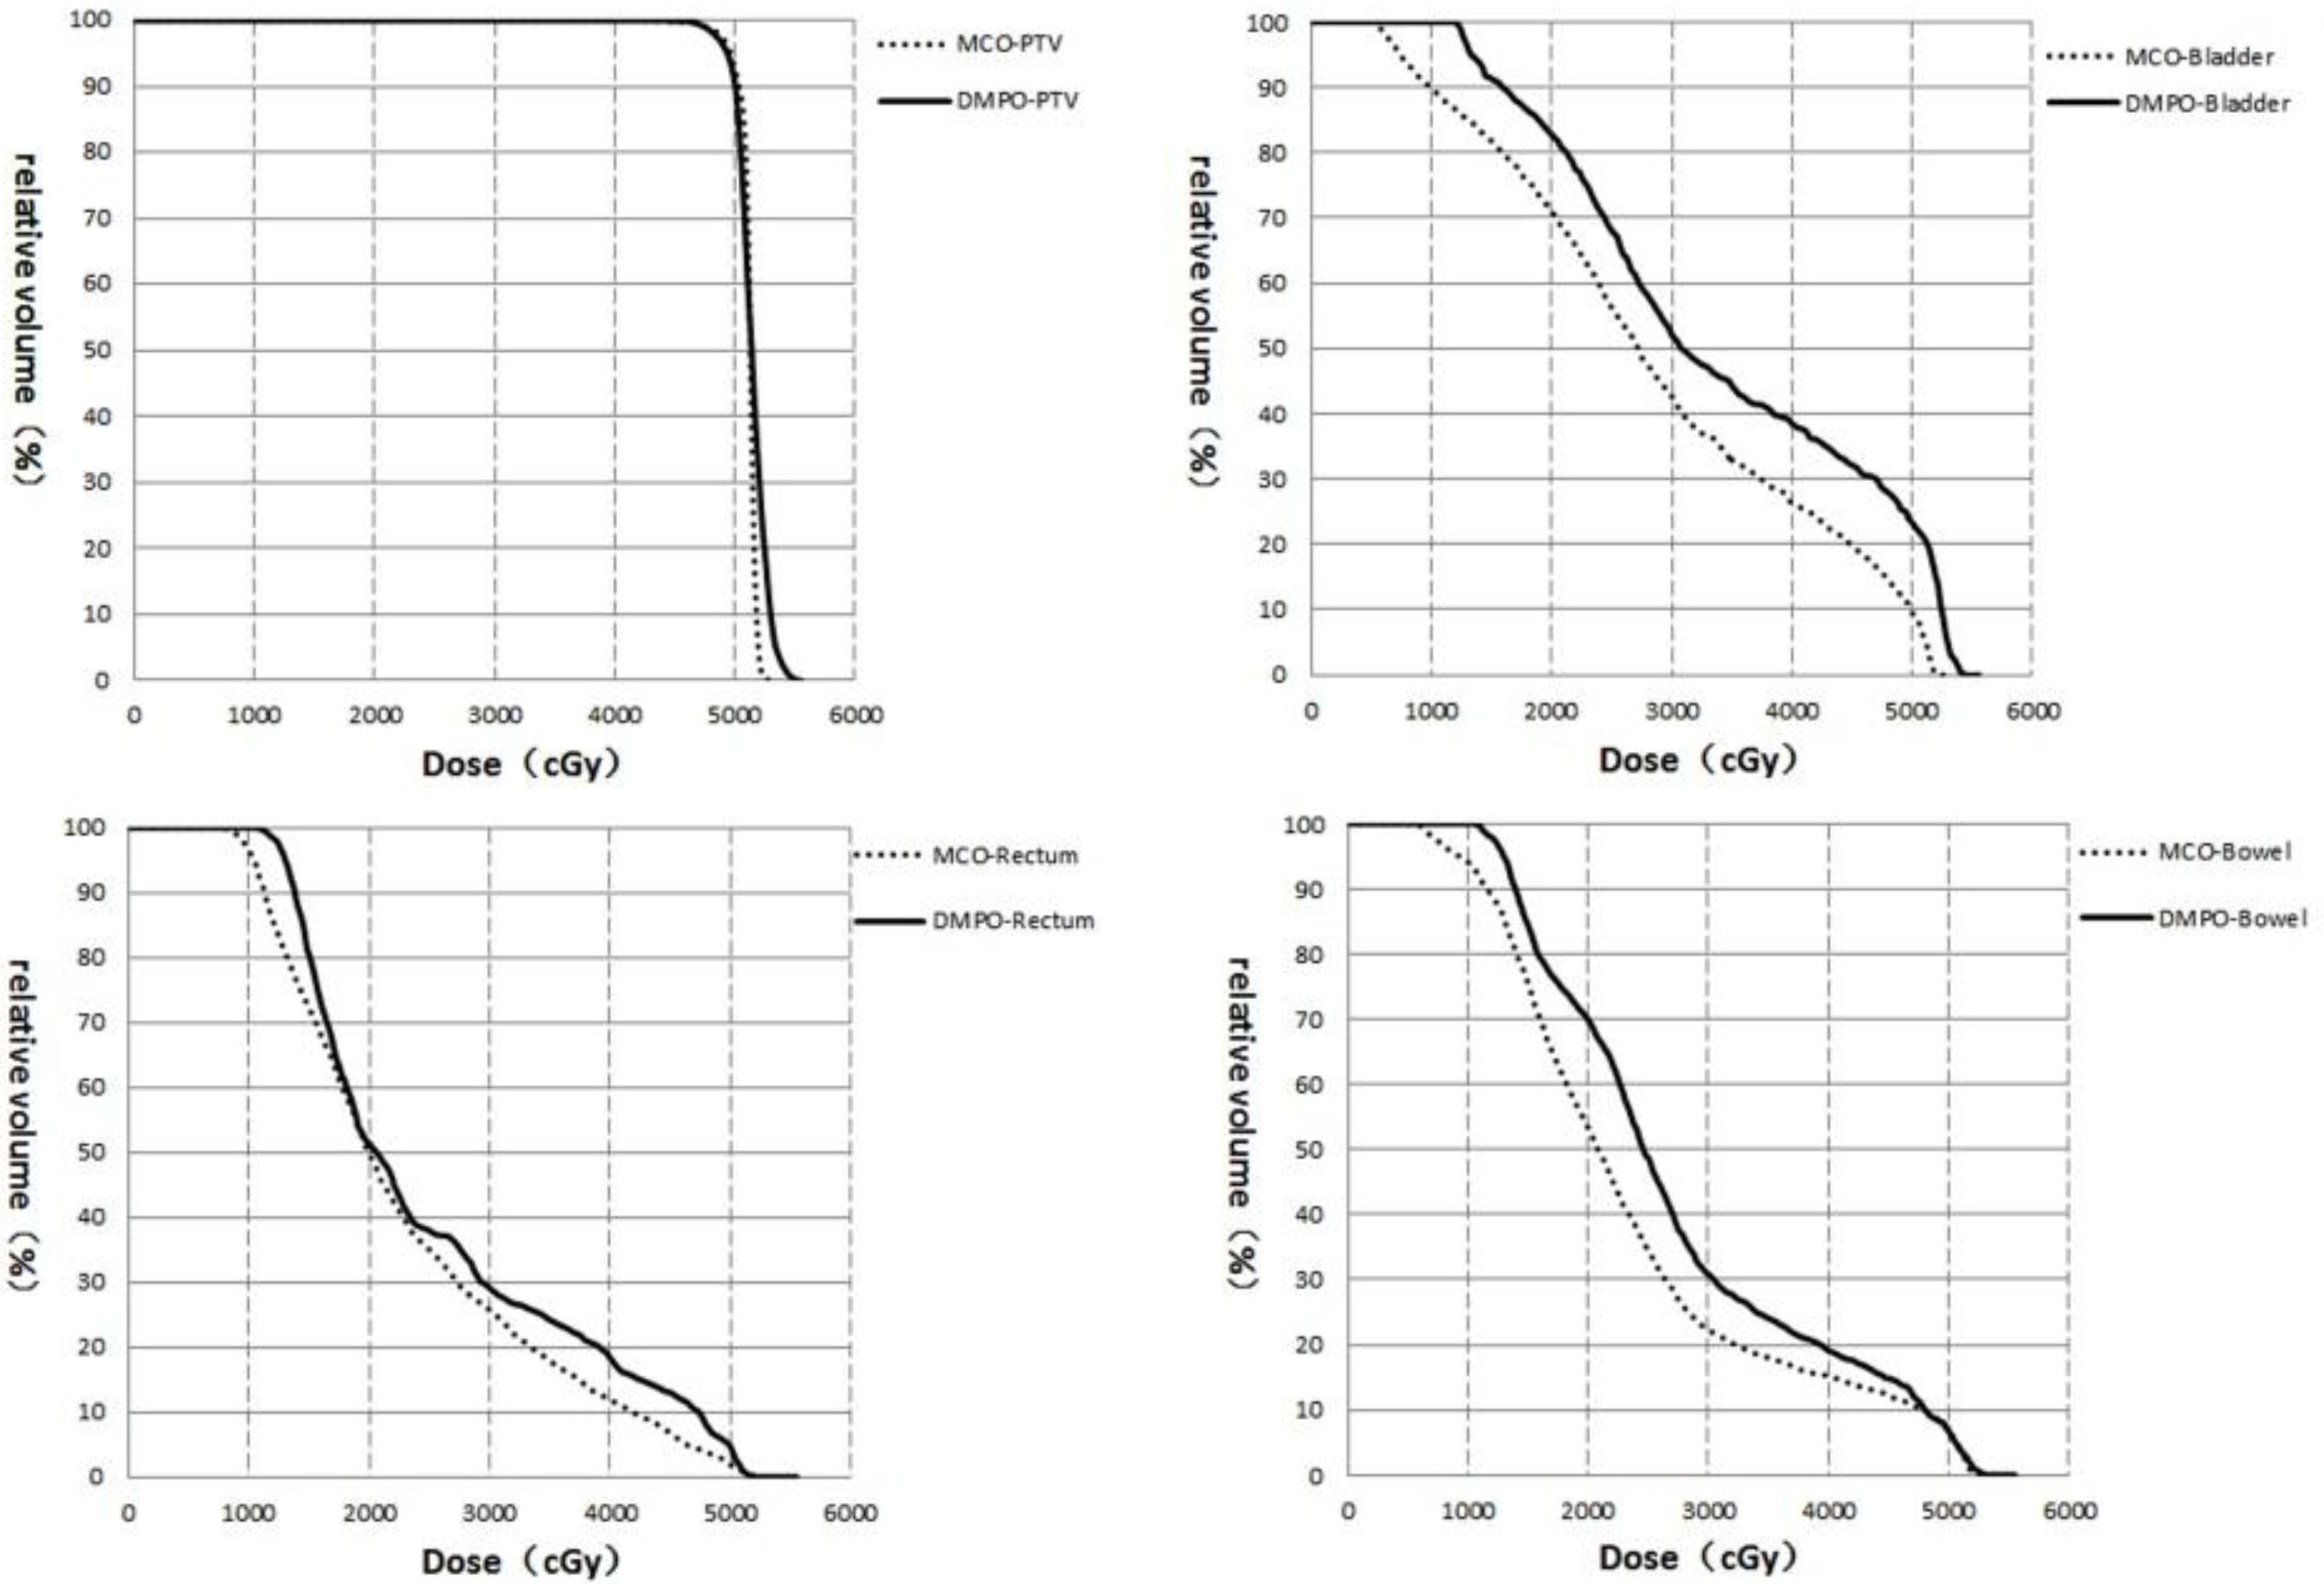
Figure 2.
DVH of the targets and OAR for the same prostate cancer patient.
Plans for the lung cancer patients were designed using 5 or 6 coplanar beams. The number and angles of the beam depended on the tumor location and size. The prescription was defined as follows: at least 95% of the PTV volume received a prescribed dose of 60 Gy; the total lung volume receiving 20 Gy or higher (V20) should not exceed 37%. The maximum dose (1 cc) at the spinal cord should not exceed 45 Gy. A dose of 45 Gy or higher should be limited to 67% of the heart volume. Other tissue should receive as low a dose as possible.
2.3Plan evaluation
A comparison of the transverse dose distribution, DVH analysis, and statistic analysis of the receiving dose for the targets and OAR was performed between the DMPO and MCO plans. The dose coverage of the targets was evaluated by D95, homogeneity index (HI) and conformity index (CI), whereas the protection of the OAR was evaluated by the percentage of the volume receiving the specified dose level. The HI was calculated using the following formula:
A value of HI approaching 1 means the homogeneity is better.
The variable CI is calculated using the following formula:
where Vptv is the volume of the targets, and Vpiv is the volume of the entire body covered by the reference isodose curve. A value of CI approaching 1 means the conformity is better.
Then, the monitor units (MUs) of the DMPO and MCO plans were added up and compared. All of the statistical indicators were analyzed using SPSS 18.0.
3.Results
3.1Prostate cacer
The difference in the transverse dose distribution for the same prostate cancer patient is shown in Fig. 1. The high dose distribution is the same, whereas the low dose coverage from the MCO was clearly smaller than for the DMPO.
Table 1
Statistical analysis of the dose distribution of the targets and OAR for the 10 prostate cancer patients
| PTV and OARs | DMPO (Gy) | MCO (Gy) | P | ||
|---|---|---|---|---|---|
| PTV | |||||
| D95 | 49.70 | 49.80 | 0.475 | ||
| HI | 1.07 | 1.06 | 0.056 | ||
| CI | 0.95 | 0.98 | 0.004 | ||
| Rectum | |||||
| D30 | 39.1 | 34.1 | 0.004 | ||
| D53 | 25.5 | 24.4 | 0.004 | ||
| D1cc | 51.8 | 51.4 | 0.039 | ||
| Bladder | |||||
| D53 | 28.5 | 27.1 | 0.157 | ||
| D1cc | 53.2 | 52.5 | 0.174 | ||
| Small intestine | |||||
| D1cc | 45.8 | 43.4 | 0.021 | ||
Table 2
Statistical analysis of the dose distribution for the targets and OAR of the 10 lung cancer patients
| PTV and OARs | DMPO (Gy) | MCO (Gy) | P | ||
|---|---|---|---|---|---|
| PTV | |||||
| D | 59.1 | 59.1 | 0.562 | ||
| HI | 1.08 | 1.07 | 0.141 | ||
| CI | 0.90 | 0.92 | 0.408 | ||
| Lung | |||||
| V | 25.6 | 23.5 | 0.044 | ||
| D | 14.5 | 13.5 | 0.003 | ||
| Heart | |||||
| D | 12.1 | 9.9 | 0.015 | ||
| D | 12.3 | 10.4 | 0.006 | ||
| Spinal cord | |||||
| D | 38.8 | 32.8 | 0.002 | ||
Figure 3.
Transverse, sagittal, and coronal dose distribution for the same lung cancer patient. (Figure a shows the outcome from the MCO, and Figure b shows the outcome from the DMPO. The isodose curve from outer to inner is 10, 20, 30, 40, 50, and 53 Gy).
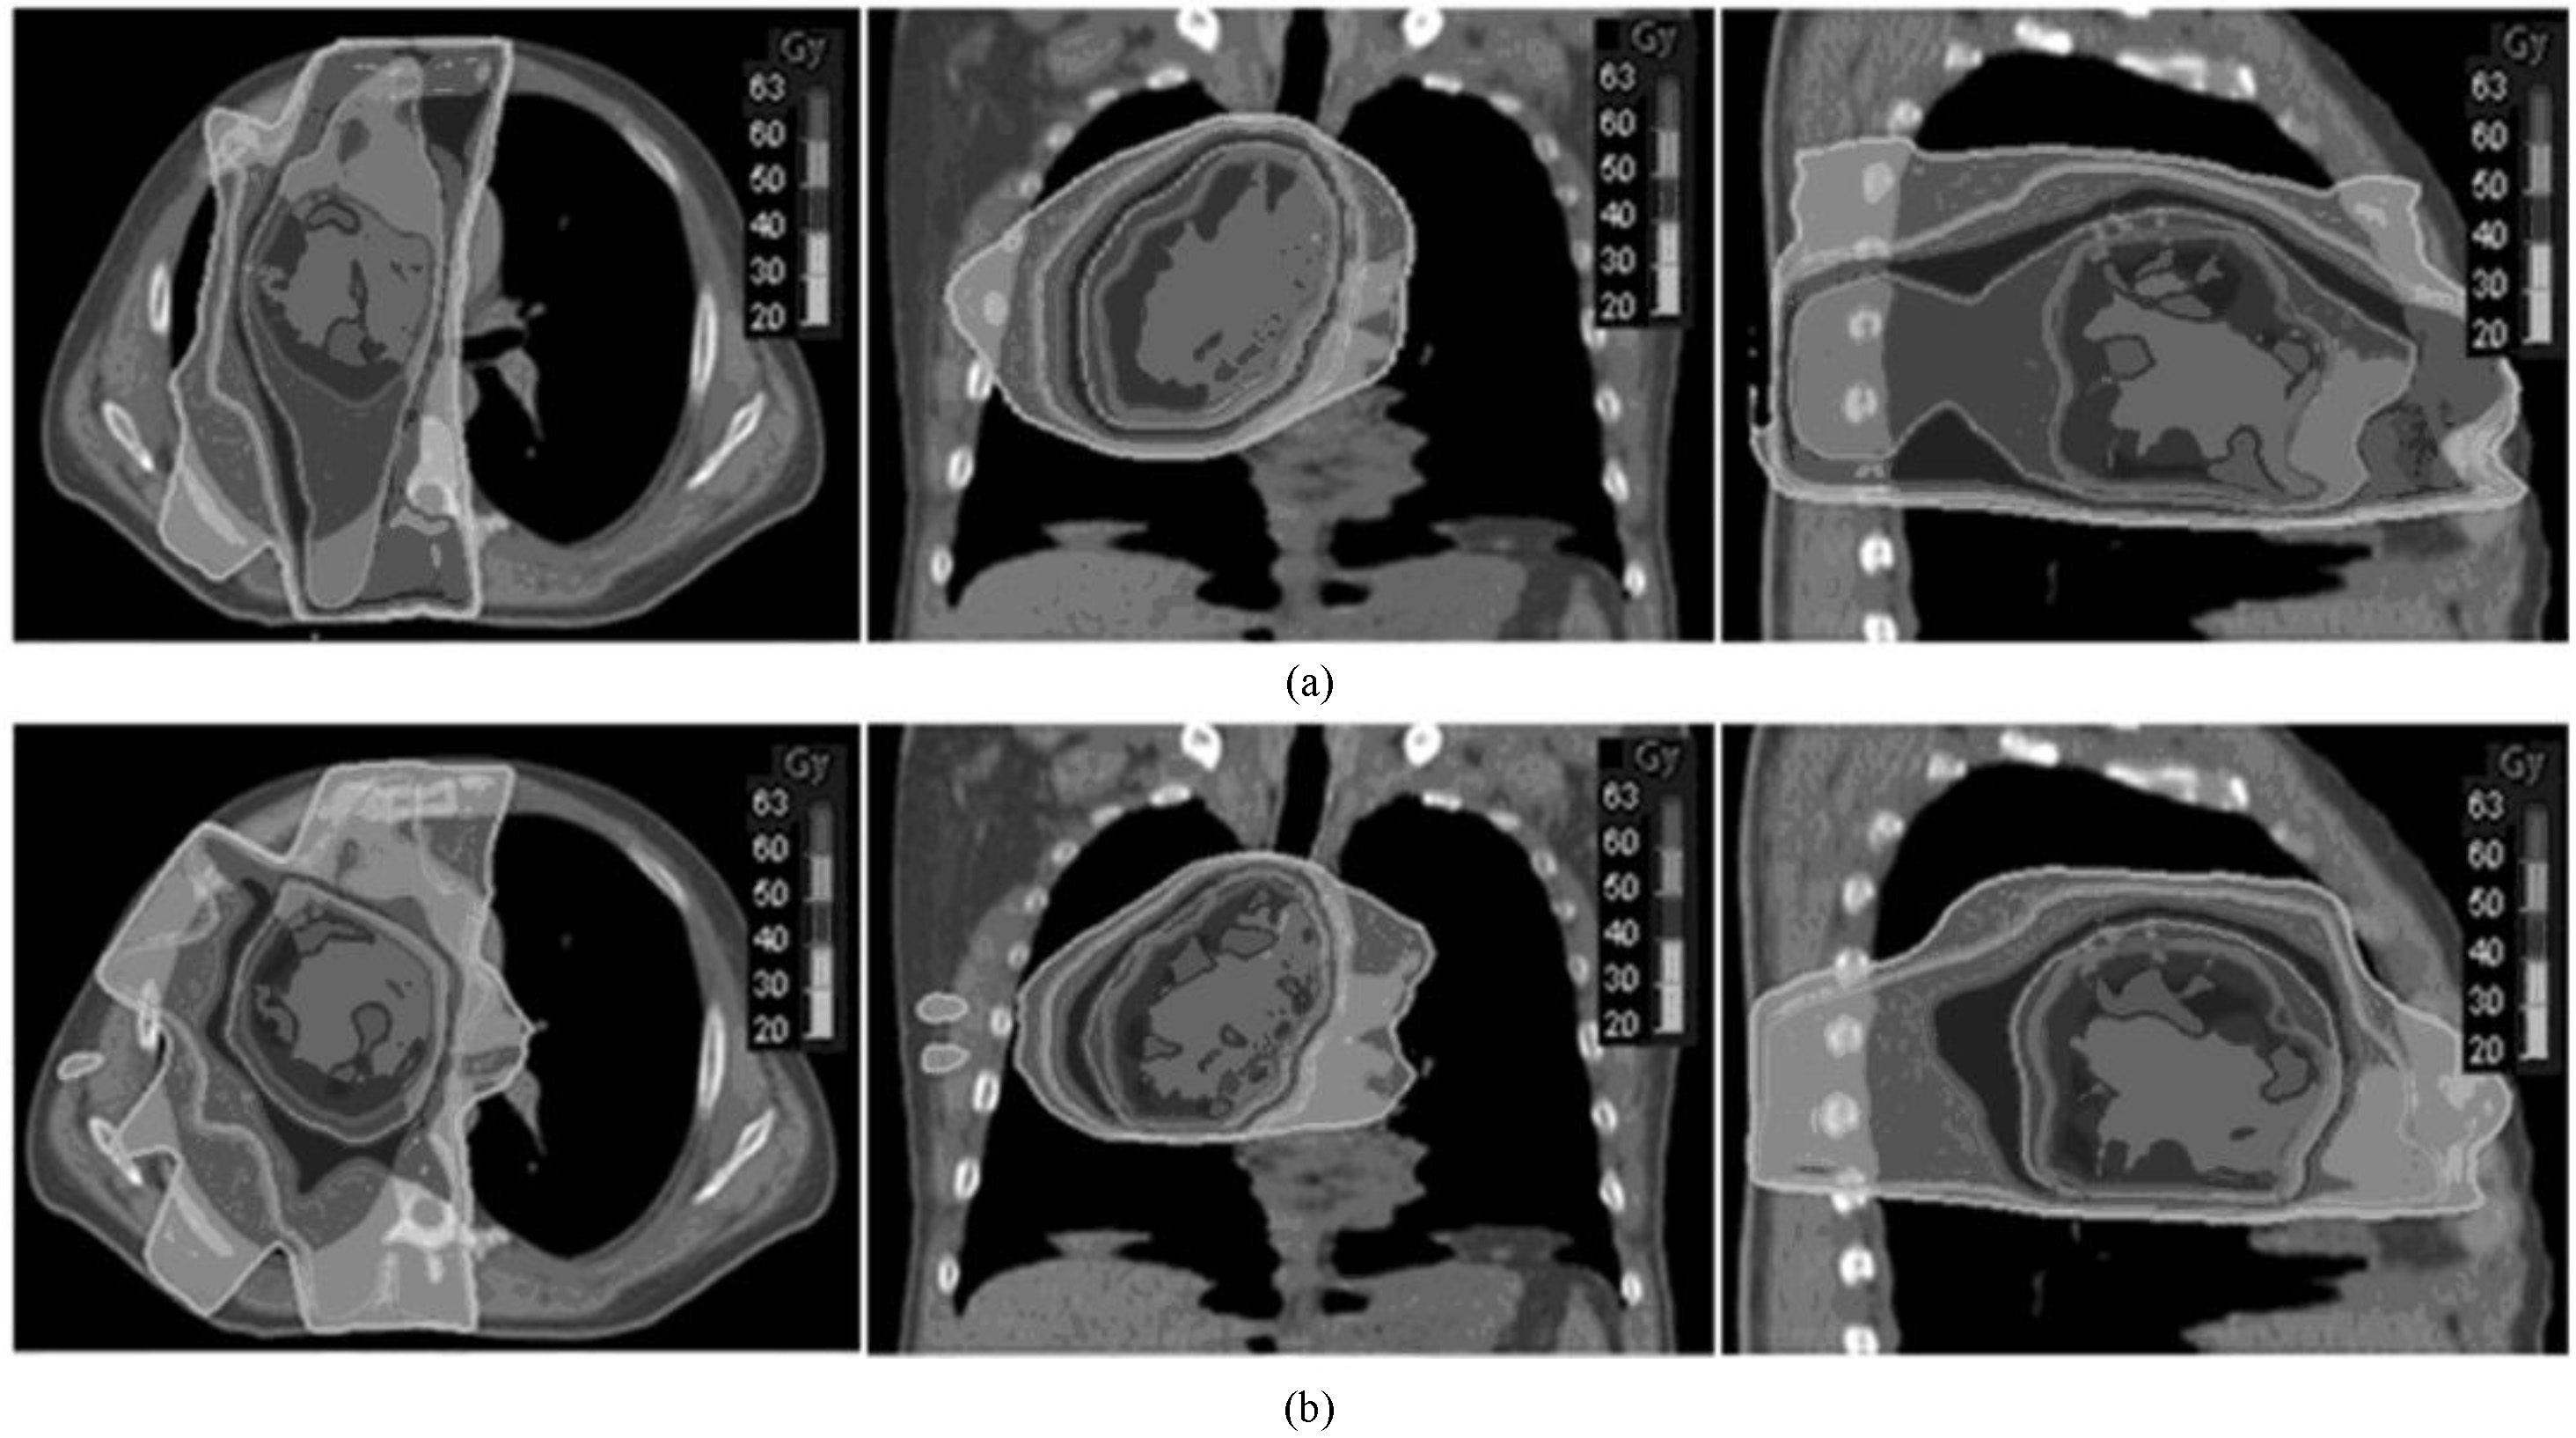
Table 3
Comparison of MUs between MCO and DMPO
| Cases | Prostate cancer | Lung cancer | ||
|---|---|---|---|---|
| DMPO | MCO | DMPO | MCO | |
| 1 | 684 (70) | 1046 (29) | 564 (83) | 756 (35) |
| 2 | 453 (69) | 553 (31) | 474 (76) | 467 (30) |
| 3 | 506 (68) | 649 (29) | 656 (86) | 629 (33) |
| 4 | 533 (63) | 934 (27) | 499 (73) | 668 (28) |
| 5 | 434 (72) | 562 (29) | 570 (82) | 659 (33) |
| 6 | 588 (57) | 792 (25) | 617 (81) | 581 (34) |
| 7 | 627 (65) | 671 (26) | 427 (72) | 535 (27) |
| 8 | 804 (58) | 1076 (24) | 514 (80) | 556 (33) |
| 9 | 677 (73) | 776 (33) | 506 (76) | 541 (32) |
| 10 | 624 (63) | 770 (27) | 499 (75) | 527 (33) |
| Average | 593 (66) | 783 (28) | 533 (78) | 592 (32) |
| P | 0.001 | 0.041 | ||
The time for optimization is in () and the units are in minutes.
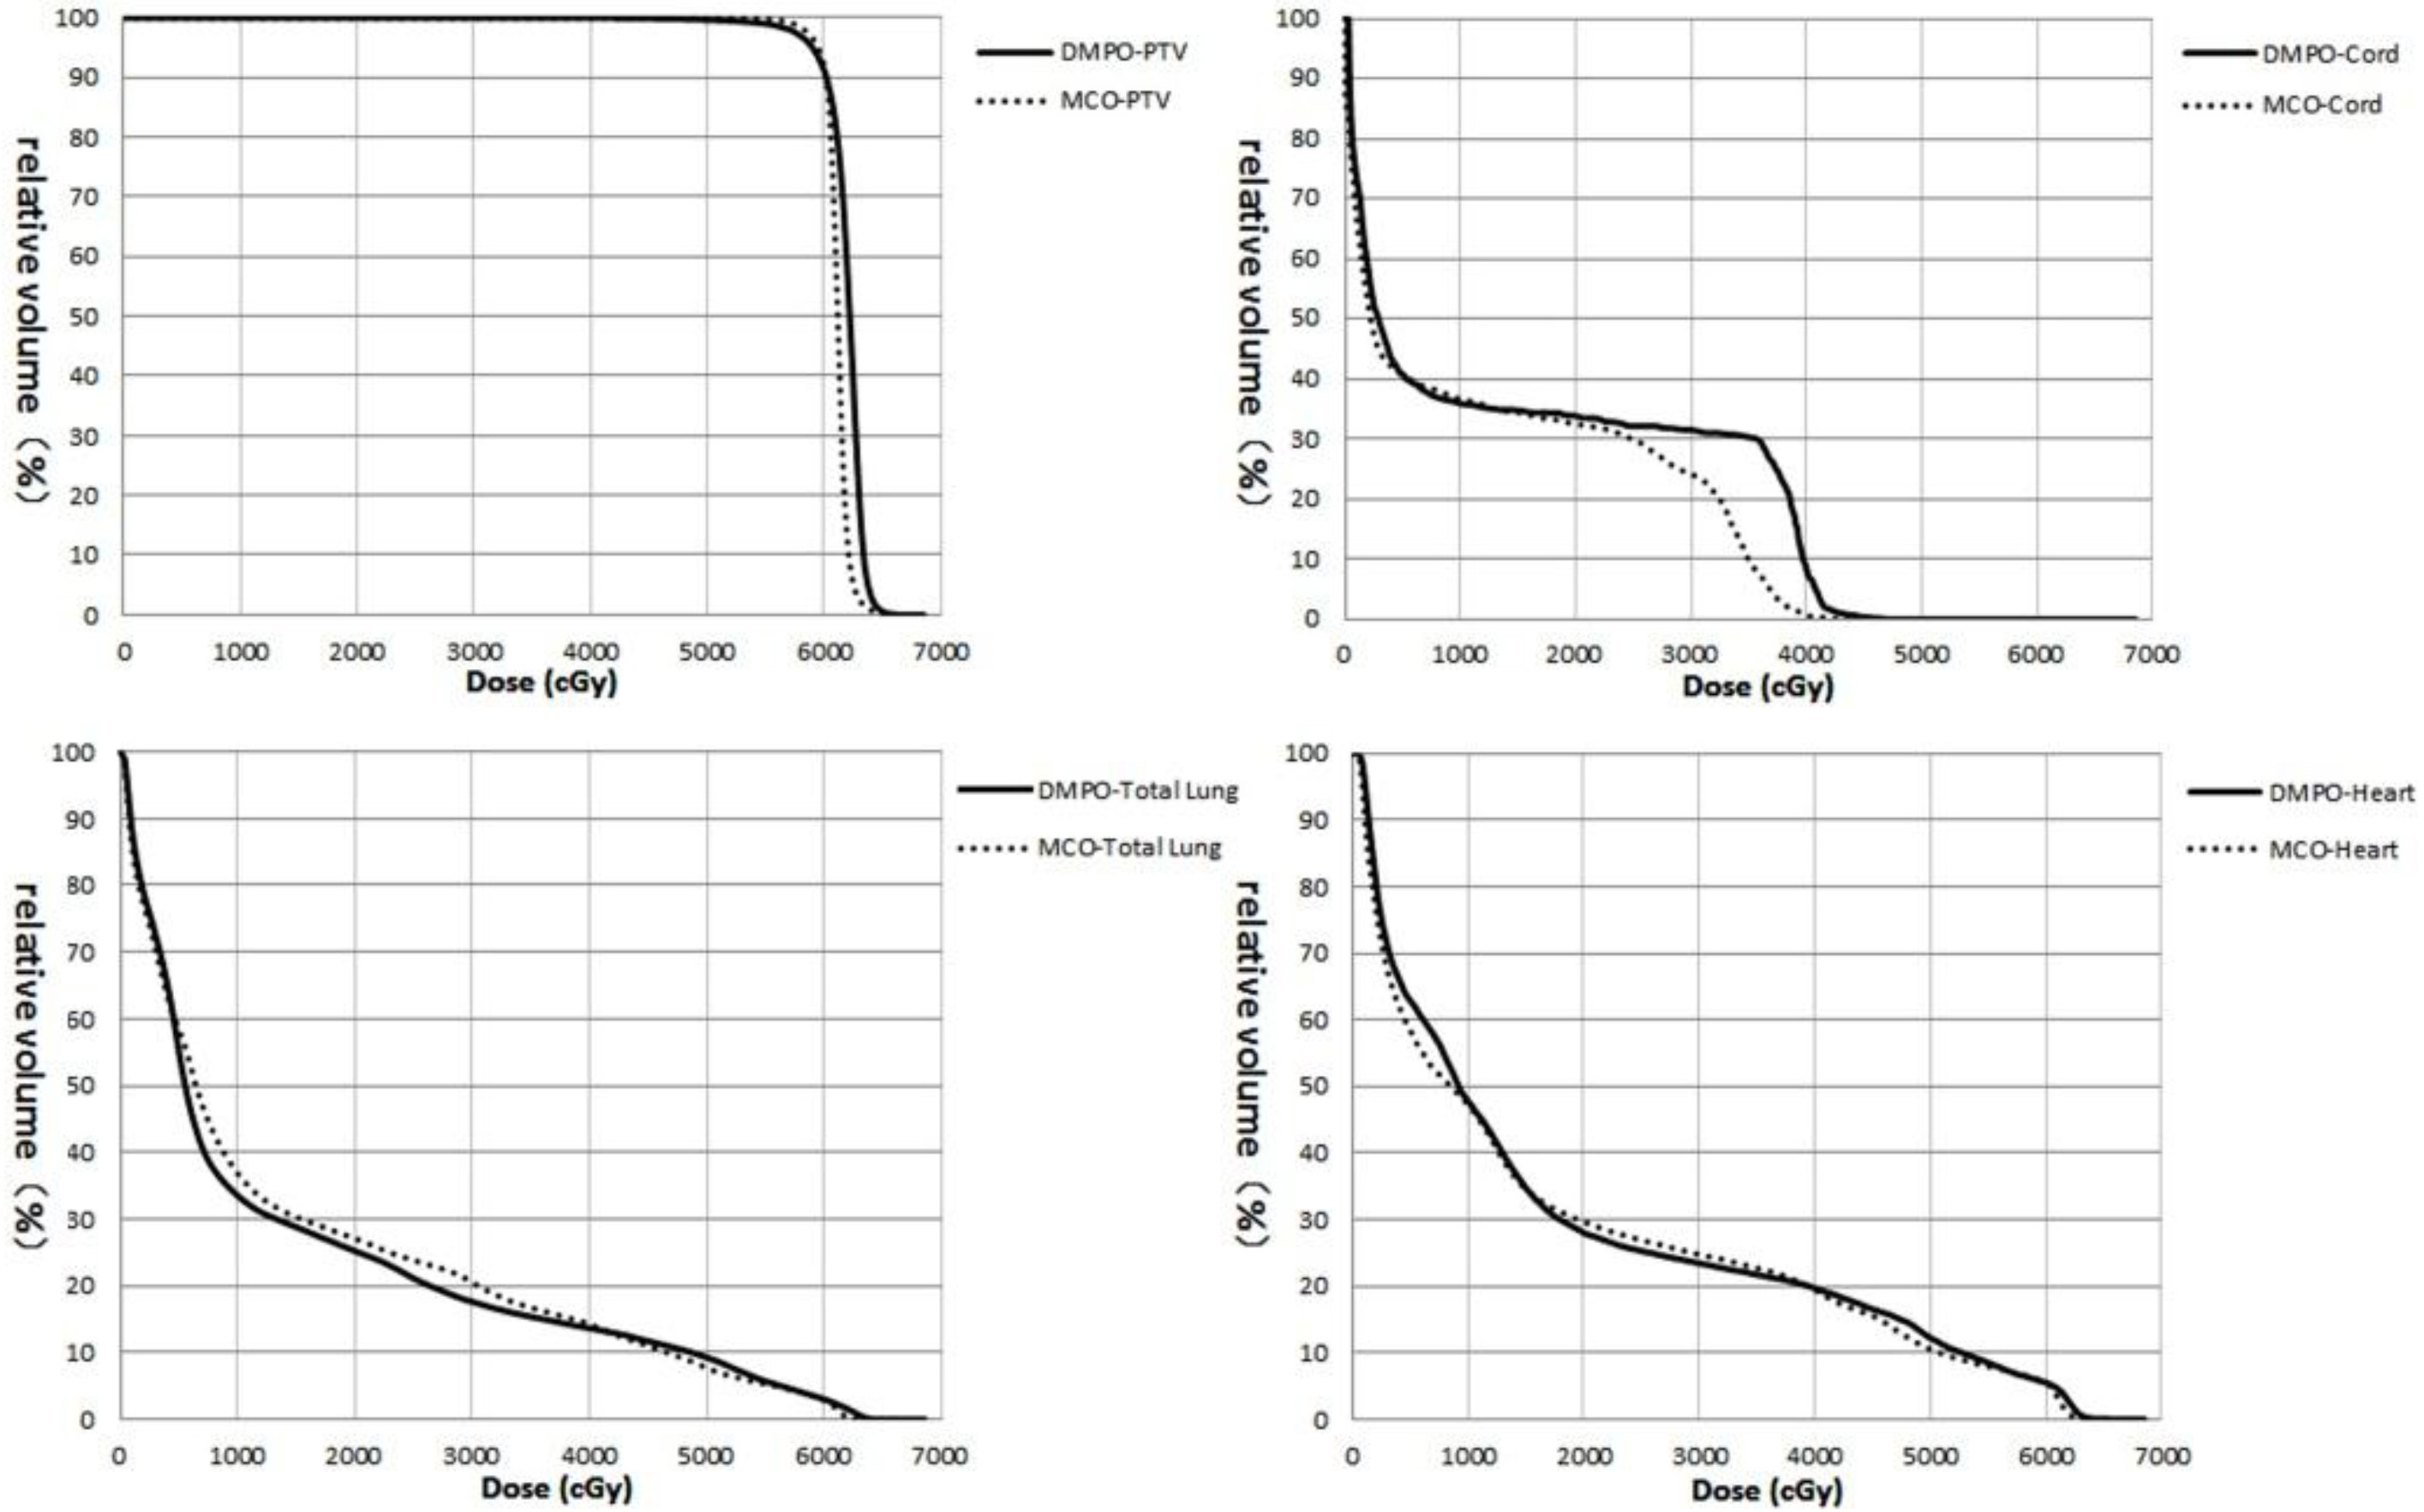
Figure 4.
DVH of the targets and OAR for the same lung cancer patient.
The difference in DVH for the same prostate cancer patient is shown in Fig. 2. The target curve (PTV) showed no difference, whereas the curves for the rectum, bladder and small intestines were superior to the DMPO when using the MCO.
The statistical indicators of the targets and OAR for the 10 prostate cancer patients are shown in
Table 2. The differences in CI of PTV, D30, D
3.2Lung cancer
The difference in the transverse dose distribution for the same lung cancer patient is shown in Fig. 3. The high dose distribution is the same, whereas the low dose coverage from the MCO was clearly smaller than that of the DMPO.
The differences of DVH from the same lung cancer patient are shown in Fig. 4. The target curve (PTV) exhibited no difference, whereas the curves for the total lung, heart and spinal cord using the MCO are shown to be superior those for DMPO.
The statistical indicators for the targets and OAR of the 10 lung cancer patients are shown in
2. The differences in V
3.3Comparison of MUs and consumed time
MUs and consumed time during optimization of MCO and DMPO are displayed in Table 3. Compared to the DMPO, the MUs of the outcome for the MCO for prostate and lung cancer plans were 32% and 11% higher, respectively, and the consumed time for the MCO was 58% and 59% lower, respectively.
4.Discussion
MCO has been introduced to optimize IMRT in recent years. The application of MCO is suitable for IMRT planning, as the objective functions of the optimization problem are generally in conflict with each other. It is impossible to completely satisfy every objective, as an improvement to one objective causes the degradation of other objectives. Compromise for each objective is found during optimization to approach a Pareto optimal. The outcome of optimization can be navigated from the Pareto surface generated by MCO using the RayStation v2.4.15.6 software with the real-time dose distribution displayed. Therefore, the required outcome can be chosen intuitively using less computing time. Several studies [7, 8, 9, 10] have shown that the performance of the treatment plan can be improved, and the amount of time spent on optimization can be minimized by using MCO.
The dose distributions of the targets of the MCO are similar to that of the DMPO when comparing the 10 prostate and 10 lung plans, respectively. However, there is difference in the statistical indicator of one organ between MCO and DMPO, as the optimization mechanism of the two methods are different. It is generally difficult to approach the global optimal solution to generate the best outcome during the optimization of DMPO, and it is also impossible to prove an optimal solution to be the global optimal solution, as the weighting of variables causes changes in the solution. While the problem becomes choosing a solution to satisfy clinical demand from the Pareto surface instead of choosing weights for each objective during the optimization of the MCO. The OAR not evaluated in this study include the head of the humerus (for the prostate plans) and the esophagus and trachea (for the lung plans). The dose coverage of the head of the humerus is low in the prostate plans because it is far away from the targets, and the prescribed dose at target is low. Additionally, the esophagus and trachea can tolerate high doses. Therefore, these organs are not evaluated.
The time spent on optimization of MCO and DMPO was also analyzed. The mean consumed times for optimization of the MCO for the prostate and lung plans were 28 min and 32 min, respectively, and were 66 min and 78 min, respectively, for those of the DMPO. The number of segments in the final deliverable plan was set to be the same for both the MCO and DMPO. However, the MUs of the plans differed greatly. The MUs of the prostate plans for the MCO and DMPO were 783
5.Conclusions
In conclusion, the introduction of MCO transforms the traditional concept of IMRT plan design. The performance of the plan is improved and the time spent on optimization is shorter when using the MCO technique.
Conflict of interest
None to report.
References
[1] | Thieke C, Küfer KH, Monz M, et al. A new concept for interactive radiotherapy planning with multicriteria optimization: First clinical evaluation. Radiotherapy and Oncology. (2007) , (85): 292-298. |
[2] | Breedveld S, Storchi P, Keijzer M, et al. A novel approach to multi-criteria inverse planning for IMRT. Physics in Medicine and Biology. (2007) , 52: : 6339-53. |
[3] | Zhou ZD, Shu HZ, Yu WX, et al. A Combined Multiobjective Optimization of Inverse Planning in Intensity Modulated Radiation Therapy. Journal of Image and Graphics. (2005) , 10: (7): 905-909. |
[4] | Li GL, Wu YC, Song G, et al. The impact of the objective function setting to muiti-objective optimization process in IMRT planning. Nuclear Physics Review, (2006) , 23: (2): 233-236. |
[5] | Halabi T, Craft D, Bortfeld T. Dose-volume objectives in multi-criteria optimization. Physics in Medicine and Biology. (2006) , 51: (15): 3809-3818. |
[6] | Schreibmann E, Lahanas M, Xing L, et al. Multiobjective evolutionary optimization of number of beams,their orientations and weights for IMRT. Physics in Medicine and Biology. (2004) , 49: (5): 747-772. |
[7] | Craft DL, Hong TS, Shih HA, et al. Improved planning time and plan quality through multicriteria optimization for intensity-modulated radiotherapy. International Journal of Radiation Oncology, Biology, Physics. (2012) , 82: (1): e83-90. |
[8] | Craft D, Halabi T, Shih H, et al. An approach for practical multi-objective IMRT treatment planning. International Journal of Radiation Oncology, Biology, Physics. (2007) , 69: (5): 1600-07. |
[9] | Hong T, Craft D, Carlsson F, et al. Multicriteria optimization in intensity-modulated radiation therapy treatment planning for locally advanced cancer of the pancreatic head. International Journal of Radiation Oncology, Biology, Physics. (2008) , 72: (4): 1208-14. |
[10] | Craft D, McQuaid D, Wala J, et al. Multicriteria VMAT optimization. Medical Physics. (2012) , 39: (2): 686-96. |


