
Mechanical and physiological effect of partial pressure suit: Experiment and numerical study
Abstract
BACKGROUND:
During high-altitude flight, the protection of the pilot is vital. A partial pressure suit may affect human physiology, especially circulatory physiology.
OBJECTIVE:
The purpose of this study was to investigate how a partial pressure suit works.
METHOD:
Ten subjects took part in the flight simulation experiments. Counter pressure at the chest, abdomen, thigh and shank were detected, together with physiological parameters such as heart rate (HR), mean arterial pressure (MAP), stroke volume (SV), cardiac output (CO) and total peripheral resistance (TPR). A numerical model was also established to simulate hemo-physiological effects of the partial pressure suit.
RESULTS:
The experiment’s results show the non-uniform counter pressure distribution in different parts of the body. There is a linear, proportional relation between TPR and the pressurizing level. HR and MAP increase along with that of the pressure level. SV and CO decrease with the increase of the pressure level. The numerical model simulated the physiological effect of a partial pressure suit. The results were verified by experiment data. The simulation estimated the change of blood flow with the pressure level.
CONCLUSIONS:
The numerical model provides a potential way to improve the protection of pilots.
1.Introduction
With the development of high-performance military aircraft, protection for pilots has become more and more important [1, 2]. A partial pressure suit is a type of protection equipment that can provide additional pressure to protect pilots at high altitude and in high-agility flight [3, 4]. Because of the significance of a partial pressure suit, some studies have been conducted to evaluate and improve the partial pressure suit [5, 6]. Though the physiological effects have been reported in some studies [7, 8], a quantitative description is lacking. The relation between additional pressure with the hemodynamic parameters should be established to better understand the mechanism of pressured protection.
When a partial pressure suit is pressurized, a serious biomechanical effect impacts the body, especially the cardiovascular system [9]. Since positive pressure ventilation of oxygen is required under low air pressure, the additional pressure provided by a partial pressure suit acts as the counter pressure to help pilot to breathe. When exposed to 12 kilometer high altitude and
Although ground-based experiments could be conducted to simulate the cardiovascular response in high altitude and in space [12, 13, 14], the quantitative description by a numerical model is preferred to predict the physiological response under special conditions. The numerical modeling method is often employed in cardiovascular system studies [15, 16]. A whole body mathematical model has been established to interpret the experimentally-derived intracranial pressure-volume relationship [17]. The lumped parameter model was used by Heldt et al. to describe the cardiovascular response to orthostatic stress [18]. Melek et al. [19] established a second order discrete time model to predict blood pressure dynamics during pitch and roll rotation, and a fuzzy logic model to predict the cardiovascular dynamic changes of head-up/head-down and transitional motions. A lumped circuit model of the pressure sensory baroreflex by Van Heusden et al. [20] studied the viscoelastic stress-relaxation of the systemic veins. Dyachenko et al. [21] developed a model of gravity-dependent effects in the cardiovascular system using numerical integration procedures of a few lumped parameters. Lim et al. developed and optimized the cardiovascular mathematical model to investigate the cardiovascular response of a graded head-up tilt [22]. In spite of these studies on the cardiovascular system, there are few studies on the biomechanical effect of a partial pressure suit. In this study, the lumped whole body model will be developed to explain the protective effect of a partial pressure suit, according to the experimental data.
2.Methods
2.1Subjects
The experimental data were collected from 10 males (24.6
2.2Equipment
A pressure control system was used together with a partial pressure suit. It has two functions: on the one hand, it provides oxygen through a mask to simulate the positive pressure breathing of the pilot at a high altitude; on the other hand, it can pressurize a partial pressure suit rapidly to the setting value.
Figure 1.
Sketch of the measure of counter pressures on body surface: (a) the four different counter pressure measuring points; (b) the schematic diagram of body surface pressure acquisition system (part 1 is the partial pressure suit, part 2 is the pressure control system, part 3 is the pressure bladder, part 4 is the gas flow meter, part 5 is the piezometer, and part 6 is the body part under the pressure bladder).
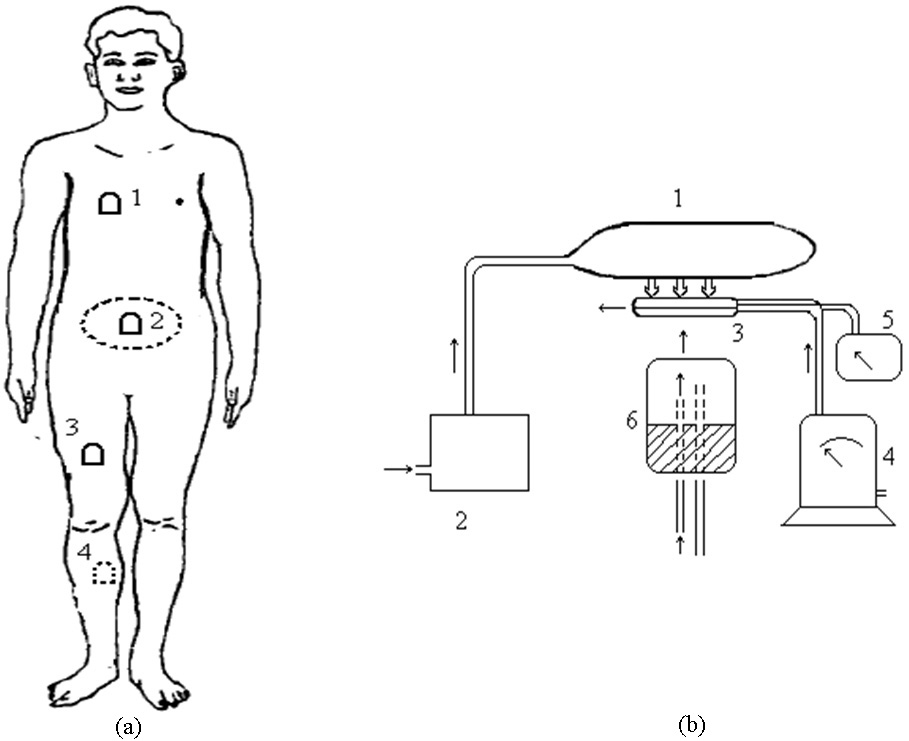
The counter pressure on the body surface was measured by a body surface pressure acquisition system. The system was comprised of pressure bladders, which could balance body surface pressure, pressure sensors and an acquisition module, as shown in Fig. 1(b). In this system, skin flap units were placed under the partial pressure suit. The gas meter controlled the gas flow into the pressure bladders until the default pressure was reached. At the same time, the pressure in bladders was detected by the pressure sensors (CGYL-202) and acquisition module.
The physiological parameters were recorded by Portapres
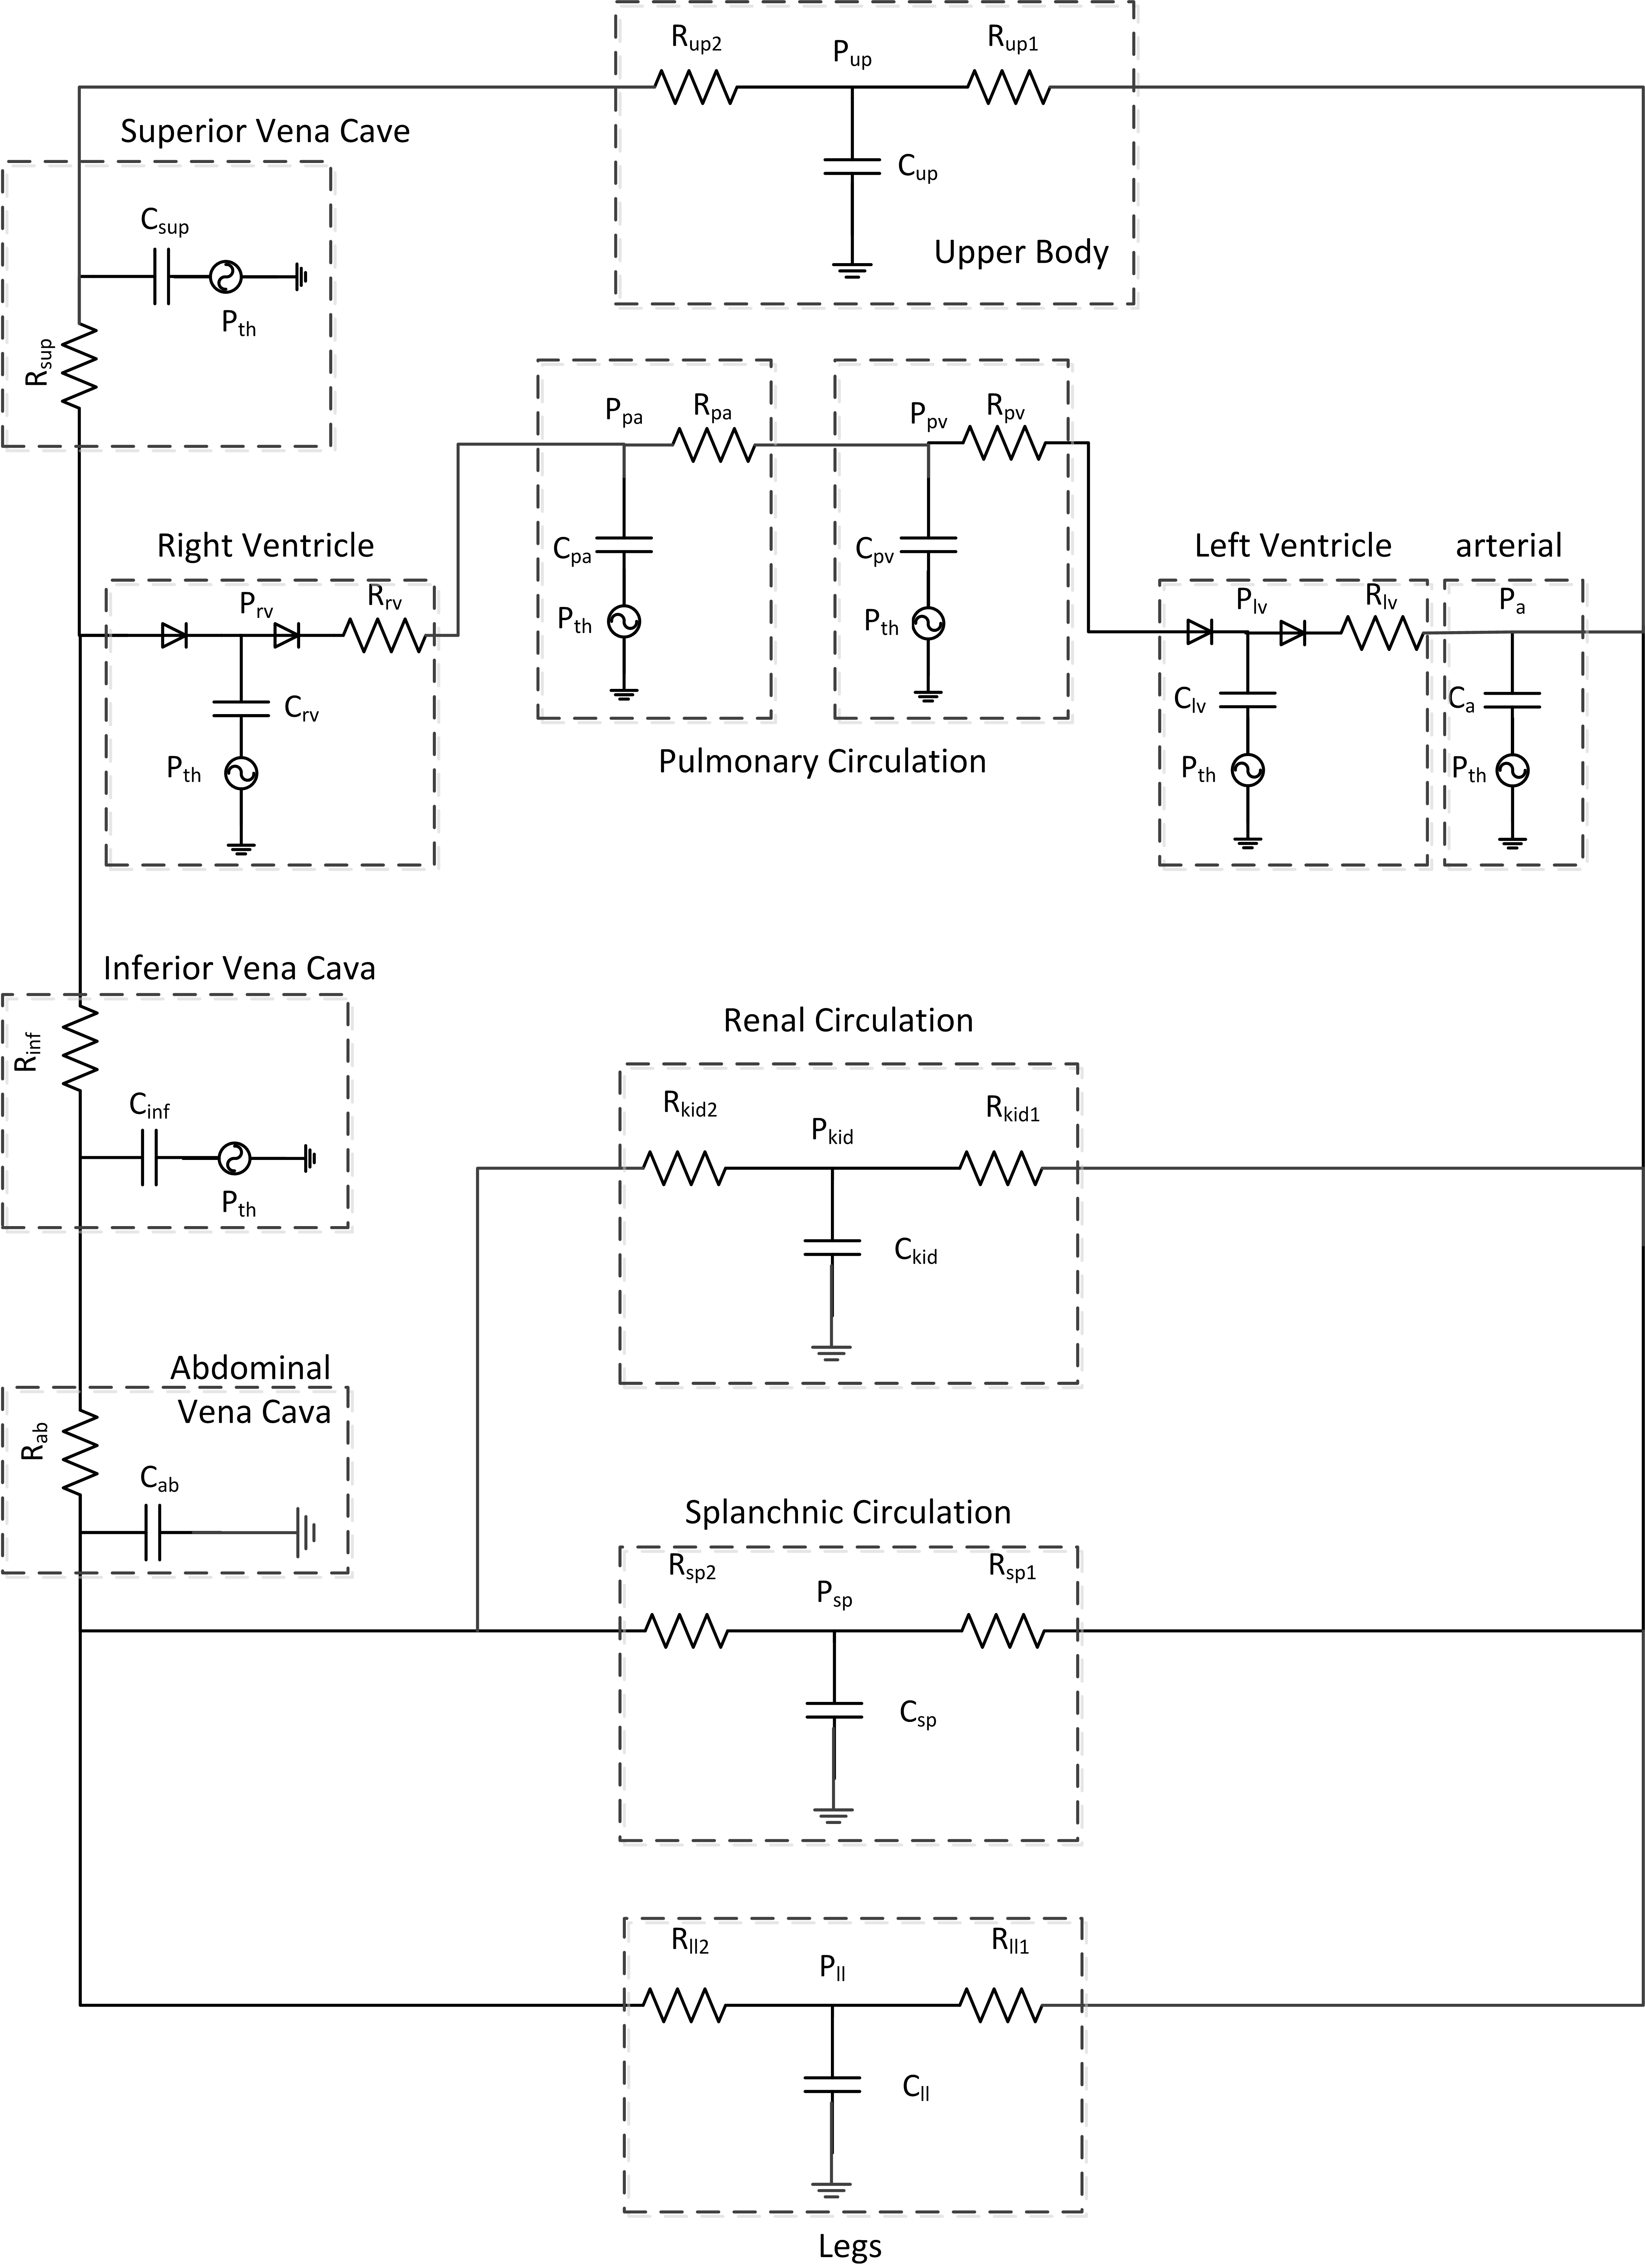
Figure 2.
Model of the cardiovascular system.
2.3Procedure
Each subject wore a capstan partial pressure suit with a pressure control system, providing positive pressure oxygen through a mask. Prior to the experiment, all the subjects were trained to master the skills needed for pressurized breathing.
In each individual experiment, the partial pressure suit was pressurized at 6 different levels: 0, 1.96, 3.92, 5.88, 7.84 and 10.49 kPa. At each level, the pressing process lasted 3 min for each test. There was quite a long time between pressing tests for each subject. When the partial pressure suit was pressurized, the counter pressure on four different parts of the body surface (chest, abdomen, thighs and legs, as shown in Fig. 1(a)) were measured by a body pressure acquisition system. At the same time, some physiological parameters, such as heart rate, blood pressure, and cardiac output, were monitored, and the total peripheral resistance was estimated.
Statistical analysis was accomplished using a multivariate software package (SPSS 13.0) with a significance level of
2.4Numerical model
A lumped parameter model was established to describe the hemodynamics of human body [18], as shown in Fig. 2. It included twelve parts: right ventricle, pulmonary veins, pulmonary arteries, left ventricle, aorta, abdominal veins, kidney, splanchnic, lower limbs, upper body, superior vena cava and inferior vena cava. The model was implemented using an electrical analog method. The voltage corresponded to blood pressure, and the current corresponded to the flow rate. R described the impedance of the some vessel segments, and C stood for the capacitance of the vessel.
The heart was divided into the right ventricle and left ventricle. The ventricles were described by the time-varying elasticity [18]:
(1)
where
The model parameters were determined by the ground tests on the pressurized partial pressure suit. The heart rate was estimated by the regression equation with pressure, which was obtained from the experimental data, as with the total peripheral resistance. The linear regression equation was established between pressure and total peripheral resistance. According to the nonuniform counter pressure on body, the vessel resistance of pulmonary veins, pulmonary arteries, splanchnic, lower limbs vessel are set variable. The variable resistance values are linear to the total resistance, which were detected in experiments. The linear scale is related with the counter pressure ratio of chest, abdomen and lower limbs. The other parameters except vessel resistances of pulmonary veins, pulmonary arteries, splanchnic, lower limbs are kept original value of unpressurized situation.
A four-order Runge-Kutta method was used to solve the model differential equations. The results of the simulation were compared with the data of experiments.
3.Results
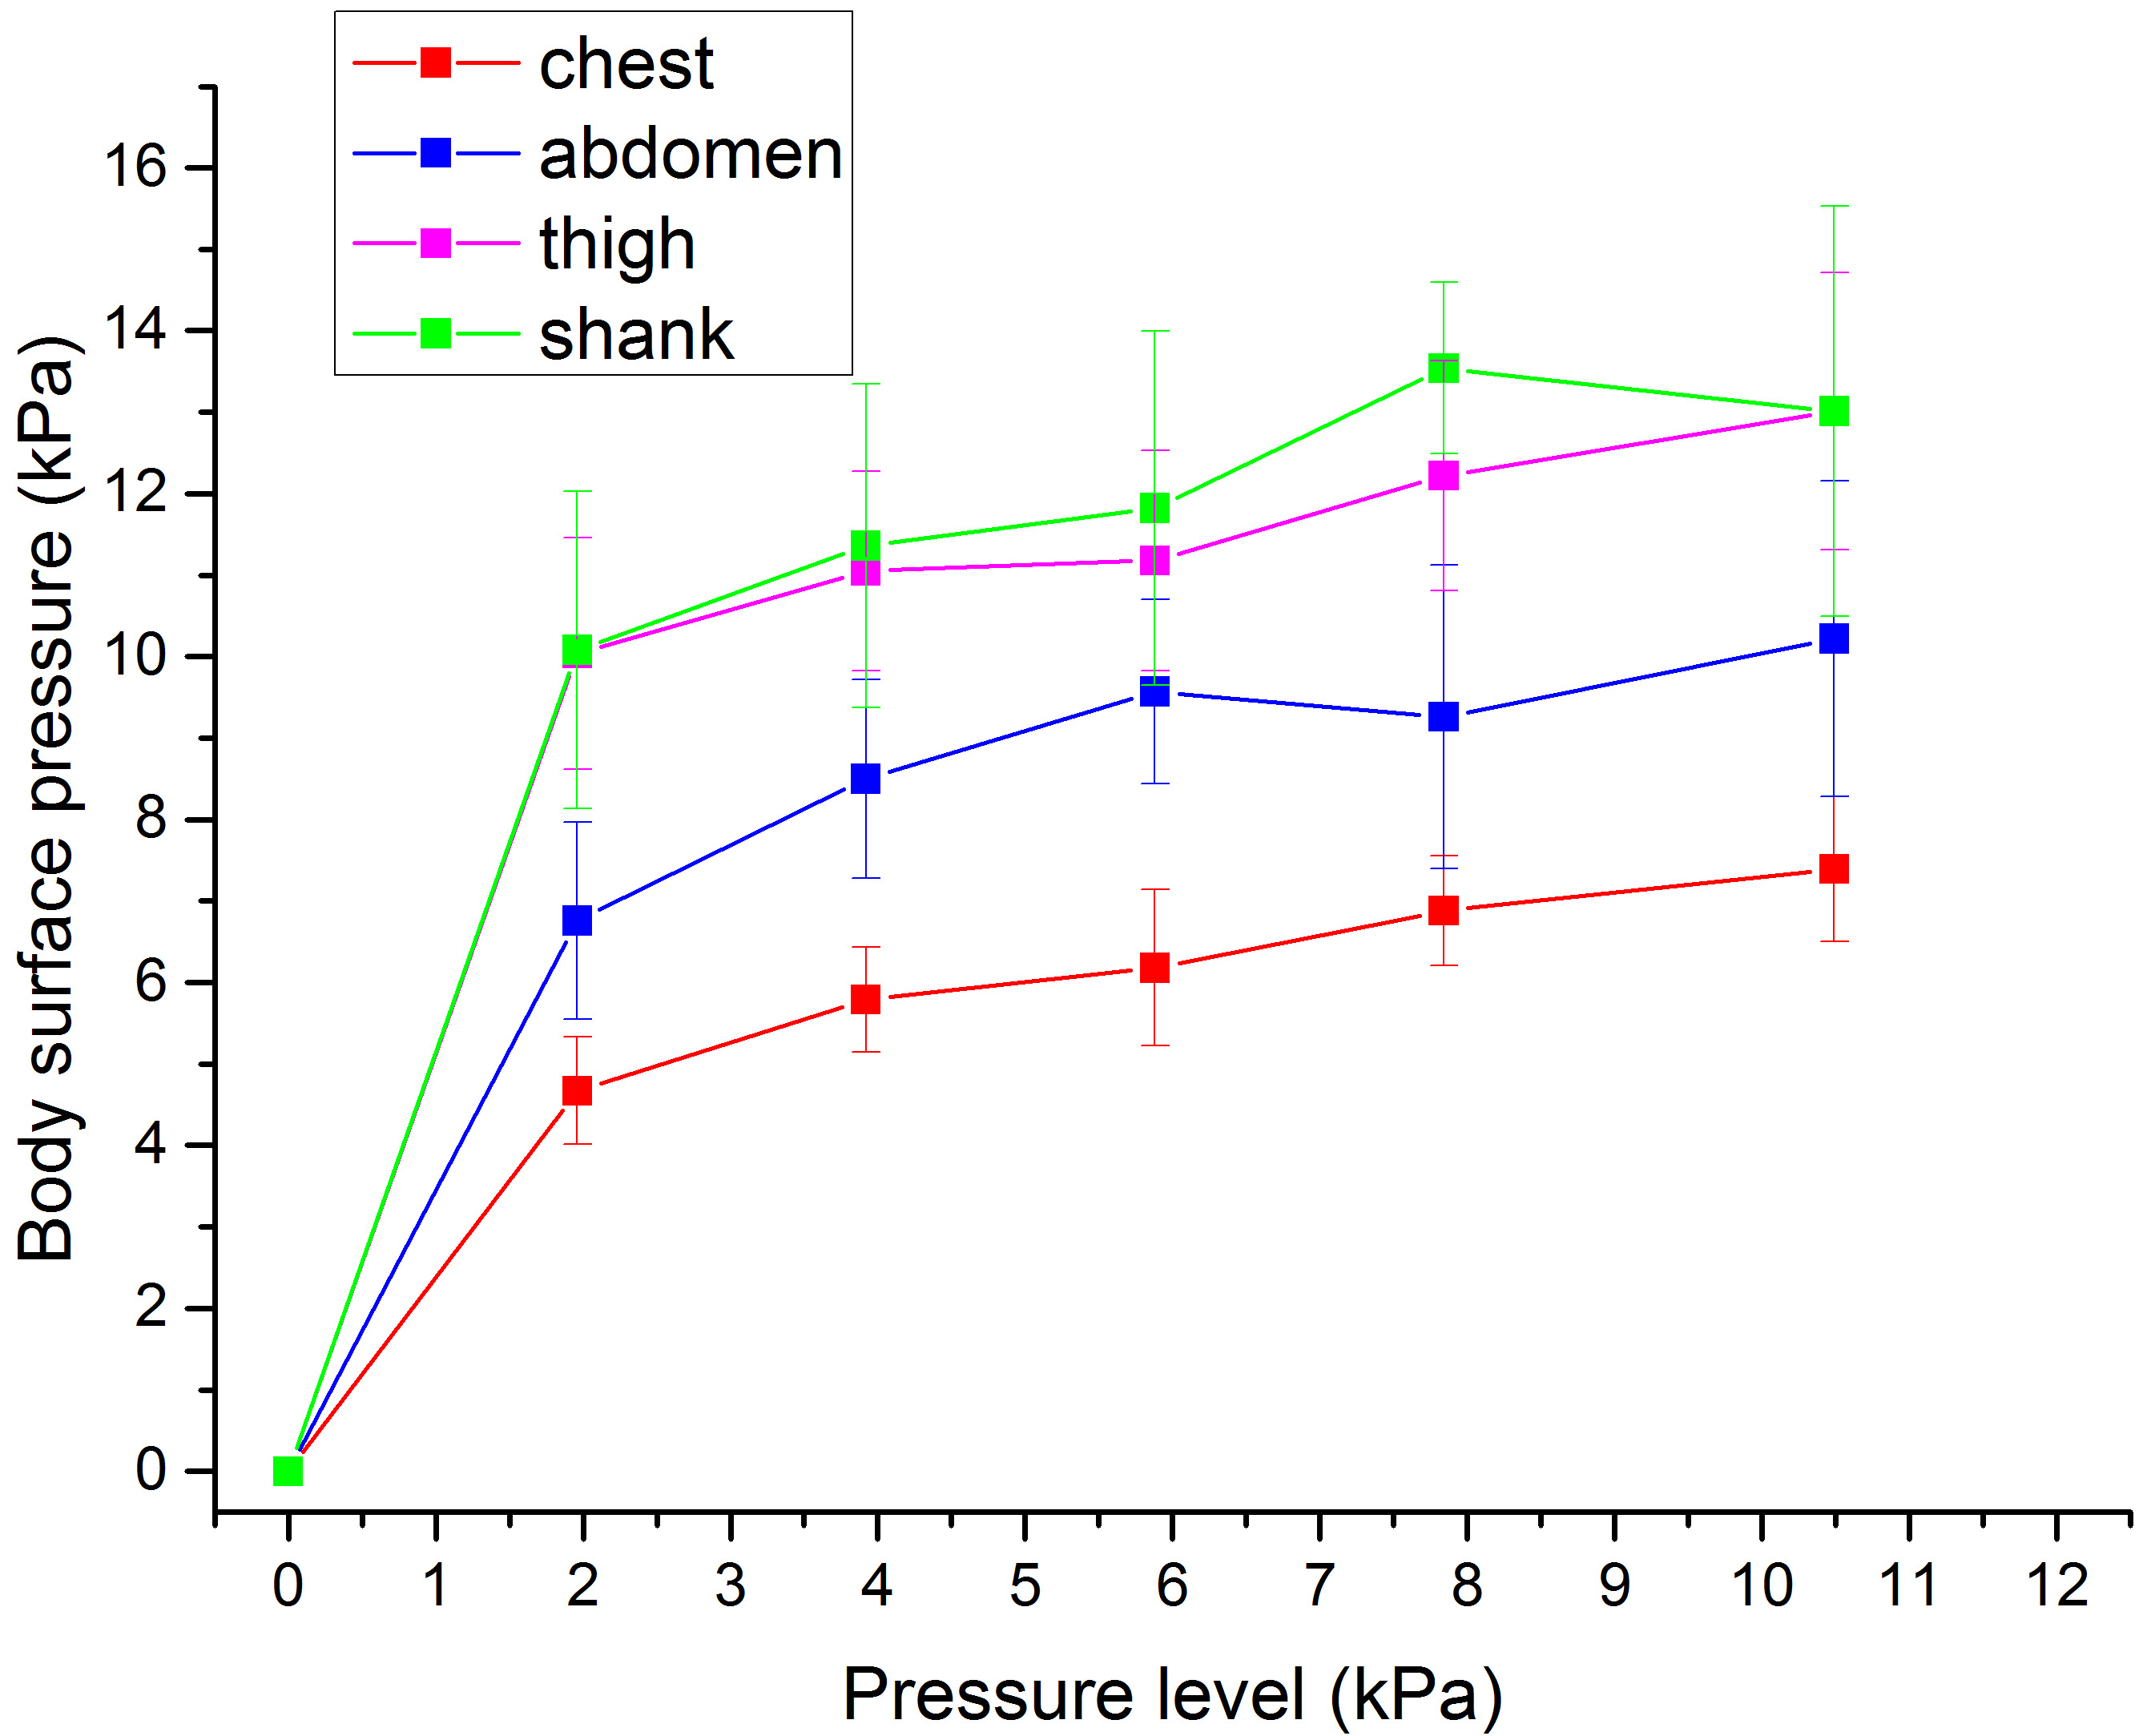
Table 1 shows the counter pressure on the body surface when the capstan partial pressure suit was pressurized from 0 to 10.49 kPa. The counter pressure on the body surface increased along with the pressure level, but it was not uniform (as shown in Table 1). The relation between the body surface pressure and the partial pressure suit pressurized level is shown in Fig. 3. The body surface pressures increased rapidly when partial pressure suits were pressurized, and then they increased gradually along with the pressure level. The counter pressure on the thighs was close to that on the shanks. The counter pressure on low limbs was greater than that on the abdomen. The counter pressure on the chest was the lowest compared with that on the abdomen and lower limbs.
Table 1
The counter pressures on the body surface with the partial pressure suit in different level
| Pressure level (kPa) | Chest | Abdomen | Thigh | Shank | ||||
|---|---|---|---|---|---|---|---|---|
| Pre | 0 | 0 | 0 | 0 | ||||
| 1.96 | 4.67 | 6.76 | 10.04 | 10.08 | ||||
| 3.92 | 5.79 | 8.50 | 11.05 | 11.36 | ||||
| 5.88 | 6.18 | 9.57 | 11.18 | 11.82 | ||||
| 7.84 | 6.88 | 9.26 | 12.22 | 13.54 | ||||
| 10.49 | 7.39 | 10.22 | 13.01 | 13.18 | ||||
Table 2
The physiological measurements with the partial pressure suit in different pressure level
| Pressure level | MAP | TPR | HR | SV | CO | |||||
|---|---|---|---|---|---|---|---|---|---|---|
| (kPa) | (mmHg) | (mmHg | (times/min) | (ml) | (L/min) | |||||
| Pre | 96.22 | 1.02 | 79.67 | 70.52 | 5.62 | |||||
| 1.96 | 123.73 | 1.71 | 89.68 | 58.46 | 5.24 | |||||
| 3.92 | 137.35 | 2.10 | 87.70 | 44.56 | 3.91 | |||||
| 5.88 | 149.14 | 2.86 | 91.40 | 41.00 | 3.75 | |||||
| 7.84 | 185.09 | 3.71 | 96.51 | 35.66 | 3.44 | |||||
| 10.49 | 182.58 | 3.97 | 103.97 | 32.51 | 3.38 | |||||
Figure 3.
The counter pressure on the body surface at different pressuring levels.
Besides the body surface pressure, some hemodynamic parameters, such as MAP, TPR, HR, SV and CO, were also measured during the pressurized experiments. From the data shown in Table 2, MAP, TPR and HR increased significantly (
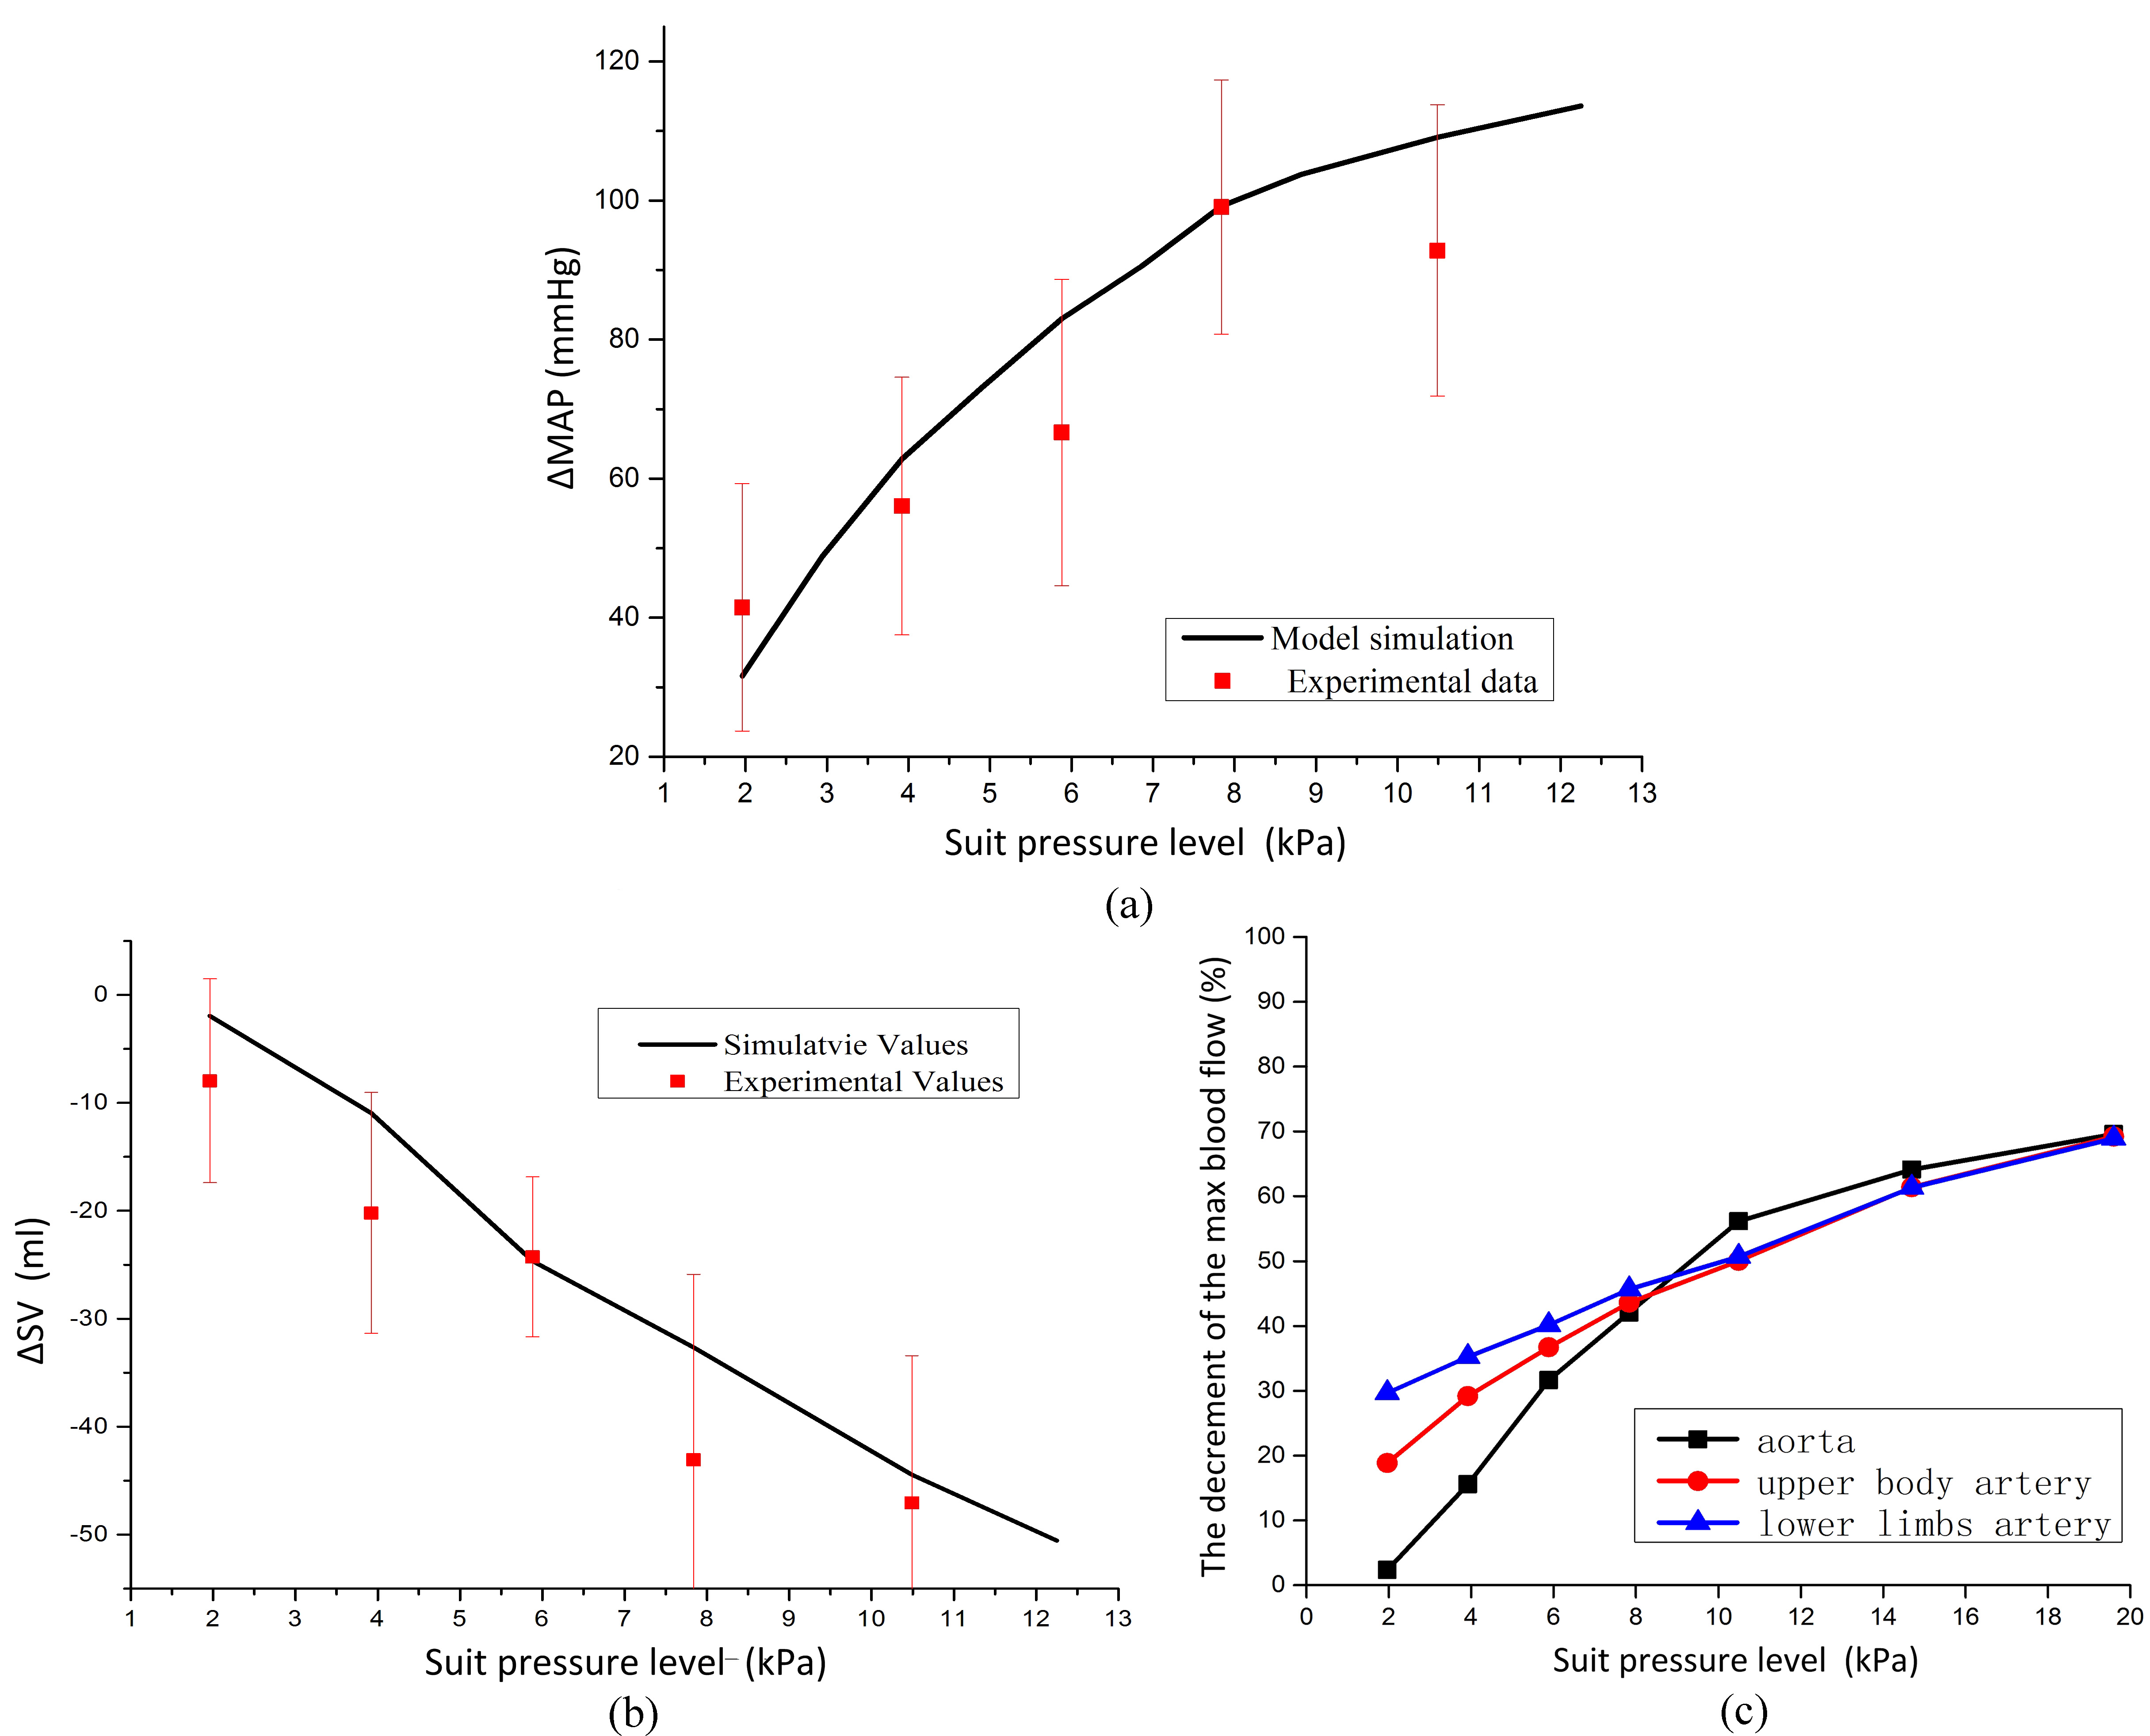
Figure 4.
The simulation of the model. (a) The simulation of the change in MAP along with the increase of suit pressure level, (b) the simulation of the change in SV along with the increase of suit pressure level, (c) the estimation of the decrement of the max blood flow at different suit pressure levels.
The results experiments showed that there was a strong linear relationship between the pressure level of pressurized suits and the total peripheral resistance of subjects with partial pressure suits. The linear regression equation is:
(2)
The linear regression coefficient is R2
(3)
The linear regression coefficient is R2
By changing the vessel resistance of pulmonary circulation, splanchnic circulation and lower limbs, the model could simulate the change in cardiovascular physiology. The model simulated the MAP and SV, along with the increase of the suit pressure level. The MAP increases with suit pressure levels. The increment of MAP along with suit pressure levels is shown in Fig. 4(a), which is consistent with the experiment data. The SV decreases with suit pressure levels. The decrement of SV along with suit pressure levels is shown in Fig. 4(b), which is consistent with the experiment data.
With the model, the maximum blood flow was estimated at different suit pressure levels, as shown in Fig. 4(c). The decline in maximum blood flow was obvious. When the partial pressure suit was pressurized, the decrease of the maximum blood flow in the lower limbs’ arteries is greater than that in the upper body arteries and that in the aorta. But with the increase of the suit pressure level, the decrement of the maximum blood flow in these three parts tends to be the same. The very-high suit pressure level (up to 19.6 kPa) was also estimated by the model.
4.Discussion
The protection provided by the partial pressure suit for pilots during a high altitude flight is of great importance. In this study, the effect of a partial pressure suit on the human body was investigated. The partial pressure suit could exert non-uniform pressure on the surface of the body. At the same time, some of the physiological parameters such as the heart rate, mean arterial pressure, stroke volume and cardiac output, changed. A model was established to describe the hemodynamics of the human body. By varying resistance parameters in the model, the hemodynamic effects of the partial pressure suit were estimated.
When the partial pressure suit was pressurized, non-uniform counter pressure was exerted on the surface of the body. There was a steep change in the counter pressure, when the partial pressure suit began to be pressurized, and then the counter pressure increased linearly with the pressure level. Through measurements taken, it was found that the counter pressure on the thigh and shank was similar, which was a little greater than the counter pressure on the abdomen and chest. Because of the pressure gradient, a partial pressure suit can effectively regulate blood distribution. The higher pressure on lower limbs prevented blood accumulation in the lower body, so that the blood supply to the brain would be sufficient some more important organ blood supply will be sufficient. The non-uniform counter pressure distribution is due to the design of the partial pressure suit. Moreover it affects the hemodynamic physiology to provide protection to pilots.
With a partial pressure suit pressurized, physiological parameters such as the heart rate, peripheral resistance and mean arterial pressure change significantly with the increase in pressure. The peripheral resistance changes linearly with the pressure level of the partial pressure suit. The change in peripheral resistance may be due to the resistance variation in different parts of the model. The variation of peripheral resistance may cause the redistribution of blood flow, and then physiological responses appear. HR and MAP increase along the pressure level, SV and CO decrease with the increase of pressure level.
To describe the effect of a partial pressure suit, a numerical model was established on the basis of the orthostatic stress model by Heldt [18], which was modified in order to apply it to the pressurized partial pressure suit. The influence on circulatory physiology differed with pressurizing levels, due to changes in some of the model parameters, such as the blood flow resistance. Because of the uncertain mechanics for HR regulation, the HR in the pressurizing process was used as an input for the model. There are still some limitations of this study. Except HR, other parameters of cardiac function were assumed to be constant when suit pressurized. The effect of partial pressure suit on left ventricle time varying elasticity should be studied further. There is a strong correlation between HR and suit pressure.
The model was validated by the experimental data of MAP and SV. The simulation results are consistent with the experimental data. The model was used to estimate the variation of blood flow in different parts of the body. At the beginning of pressurizing, the percent decrement of maximum blood flow in the lower limbs is greater than that in the upper-body arteries and aorta. The percent decrement of maximum blood flow increased along with the increase of the pressurizing level. The difference between the lower limbs’ and upper limbs’ percent decrement became less and less, and disappeared when the pressurized pressure was larger than 10 kPa. At about the 10 kPa pressurized pressure, the decrease of aorta maximum blood flow became greater than that of the lower limbs. This agrees with the physiological regulation principle. Lower limbs are not as important as the upper part of the body, which includes the brain; thus, the blood distribution in the lower limbs decreased more remarkably to ensure sufficient oxygen supply for the brain. But with the increase in the pressurized pressure, blood in the whole body may change, and the decrease in cardio output may have a more significant effect.
5.Conclusion
This study investigated the effects of a partial pressure suit in the process of flight protection by means of an experiment and numerical simulation. The non-uniform counter pressure was recorded with the pressurizing process. MAP, TPR, HR, SV and CO were detected to confirm the physiological effect of a pressurized partial pressure suit. Then a numerical model was established to simulate the hemodynamic changes of the partial pressure suit under different pressure. The model was validated by experimental data and could be used to predict the cardio-physiological effect at different pressurizing levels. This study may provide a way to optimize the design of a partial pressure suit.
Conflict of interest
None to report.
Acknowledgments
This work was supported by National key research and development program (2016YFC0106703, 2015BA102B01, 2016YFC1304305), National Natural Science Foundation of China (51175021), National Key Technology E&S Program (2014BAK01B05), 111 project (B13003), and the Fundamental Research Funds for the Central Universities of China.
References
[1] | Pickard, B.J., Altitude decompression sickness in a pilot wearing a pressure suit above 70,000 feet. Aviation Space and Environmental Medicine, (2003) ; 74: (4): p. 357-359. |
[2] | Rudnjanin, S., et al., Loss of consciousness as criterion of |
[3] | Sears, WJ.. High-altitude pressure protective equipment: a historical perspective. in Raising the Operational Ceiling: a Workshop on the Life Support and Physiological Issues of Flight at 60,000; Feet and Above. (1995) : DTIC Document. |
[4] | Murray, D.H., et al., Pathophysiology, prevention, and treatment of ebullism. Aviation, space, and environmental medicine, (2013) ; 84: (2): p. 89-96. |
[5] | Hu, H., et al., The effects of pressurized partial pressure suits on operational ergonomics. International Journal of Industrial Ergonomics, (2015) . |
[6] | Jeon, E.-J., et al., An ergonomic design of flight suit pattern according to wearing characteristics. Proceedings of the Human Factors and Ergonomics Society Annual Meeting, (2011) ; 55: (1): p. 1654-1657. |
[7] | Qin, Z., et al., Protection and ergonomics analysis about two types of partial pressure suits, in Proceedings of the 13th International Conference on Man-Machine-Environment System Engineering, S. Long and B.S. Dhillon, Editors. (2014) ; Springer Berlin Heidelberg. p. 401-409. |
[8] | Eiken, O., et al., The effect of straining maneuvers on G-protection during assisted pressure breathing. Aviation Space and Environmental Medicine, (2003) ; 74: (8): p. 822-826. |
[9] | Eiken, O., et al., A new hydrostatic anti-G suit vs. a pneumatic anti-G system: Preliminary comparison. Aviation Space and Environmental Medicine, (2002) ; 73: (7): p. 703-708. |
[10] | Ernsting, J., Present and future compromises in altitude protection in combat aircraft. Operational Medical Issues in Hypo-and Hyperbaric Conditions, (2001) ; p. 1. |
[11] | Xiao, H., Physiology of Aviation Oxygen Protective Equipment, (2005) ; Beijing: Military Medicine Science Press. |
[12] | Li, X.X., et al., An experimental study on the ergonomics indices of partial pressure suits. Applied Ergonomics, (2013) ; 44: (3): p. 393-403. |
[13] | Harris, M.A., et al., Differential Branch Pulmonary Artery Regurgitant Fraction Is a Function of Differential Pulmonary Arterial Anatomy and Pulmonary Vascular Resistance. Jacc-Cardiovascular Imaging, (2011) ; 4: (5): p. 506-513. |
[14] | Schlabs, T., et al., Comparison of cardiovascular and biomechanical parameters of supine lower body negative pressure and upright lower body positive pressure to simulate activity in 1/6 G and 3/8 G. Journal of Applied Physiology, (2013) ; 115: (2): p. 275-284. |
[15] | Liang, F.Y., et al., Hemodynamic performance of the Fontan circulation compared with a normal biventricular circulation: a computational model study. American Journal of Physiology-Heart and Circulatory Physiology, (2014) ; 307: (7): p. H1056-H1072. |
[16] | Blanco, PJ.. Feijóo, RA.. A dimensionally-heterogeneous closed-loop model for the cardiovascular system and its applications. Medical Engineering & Physics, (2013) ; 35: (5): p. 652-667. |
[17] | Lakin, W.D., et al., A whole-body mathematical model for intracranial pressure dynamics. Journal of Mathematical Biology, (2003) ; 46: (4): p. 347-383. |
[18] | Heldt, T., et al., Computational modeling of cardiovascular response to orthostatic stress. Journal of applied physiology (2002) ; 92: (3): p. 1239-1254. |
[19] | Melek, W.W., et al., Modeling of dynamic cardiovascular responses during G-transition-induced orthostatic stress in pitch and roll rotations. IEEE Trans Biomed Eng, (2002) ; 49(12 Pt 2): p. 1481-90. |
[20] | van Heusden, K., et al., Mathematical modeling of gravitational effects on the circulation: importance of the time course of venous pooling and blood volume changes in the lungs. Am J Physiol Heart Circ Physiol, (2006) ; 291: (5): p. 21. |
[21] | Dyachenko, A., et al., Study of numerical integration procedures aimed for computational modeling of gravity-dependent effects in cardiovascular system, in World Congress on Medical Physics and Biomedical Engineering May 26-31, 2012, Beijing, China, M. Long, Editor. (2013) ; Springer Berlin Heidelberg. p. 2312-2315. |
[22] | Lim, E., et al., A Cardiovascular Mathematical Model of Graded Head-Up Tilt. Plos One, (2013) ; 8: (10). |


