
Inaccessibility maps to support sighted people using visually impaired people’s white cane data
Abstract
BACKGROUND:
Visually impaired people have been considered only as “receivers” of support; however, few studies have considered them as “givers” of support to sighted people.
OBJECTIVE:
To support the walking of sighted people using information available specifically to the visually impaired.
METHODS:
Utilizing white cane usage data of visually impaired people to create inaccessibility maps for sighted people.
RESULTS:
A user study conducted with elderly people and their stakeholders, who had high accessibility needs found that the maps were generally useful as long as they were within the user’s area of interest.
CONCLUSIONS:
Although the proposed method should be practically beneficial to users, the information detected by the system should be expanded from white cane use data, its accuracy, and more data collected from visually impaired people.
1.Introduction
According to World Health Organization data, in 2022, worldwide, 2.2 billion people were classified as visually impaired [1]. Depending on the degree of disability, two types of visual impairment are distinguished: total blindness, in which all visual acuity is lost, and low vision, in which part of the visual field is lost or vision is blurred. The visually impaired are also divided into two types according to the time of onset: 1) the congenitally visually impaired, i.e., those born with a visual impairment, and 2) those who have a visual impairment due to illness or accident.
Figure 1.
Overall flow of the study.
Visually impaired people have difficulties in various situations, especially in transportation, reading, and writing. The gap between the visually impaired and the sighted is widening due to the recent trend toward greater emphasis on “visualization.” Therefore, those support activities important to the visually impaired in daily life, such as transportation [2], reading [3], and writing [4] have been closely studied. Recent research has focused on activities that enrich their lives, such as children’s play [5] and photography [6]. Directly expressed, most of these studies view the visually impaired as “receivers” of support.
However, are visually impaired people truly just being supported? From another perspective, they may be specialized in something because they cannot rely on visual information. Visually impaired people effectively could use other senses such as hearing, and in particular, congenitally visually impaired people, who are born with visual impairment, could have better hearing and other senses than normal people and can perceive minute information. It is proven that following the sound of cars, perceiving changes in olfactory information such as seasonal smells, and noticing and recognizing the difference in height of small steps is faster than in sighted people [7]. Otherwise stated, the visually impaired with their uniquely enhanced skills can perceive different information than sighted people and thus could become “givers” of support. However, only a few studies have examined the potential of using these superior senses and skills.
This study considered the visually impaired as “givers” rather than “receivers” of support and proposed a method of supporting sighted people by using information only accessible to the visually impaired. This study focused on the congenitally visually impaired, i.e., those with heightened senses and thus thought to be less reliant on visual information.
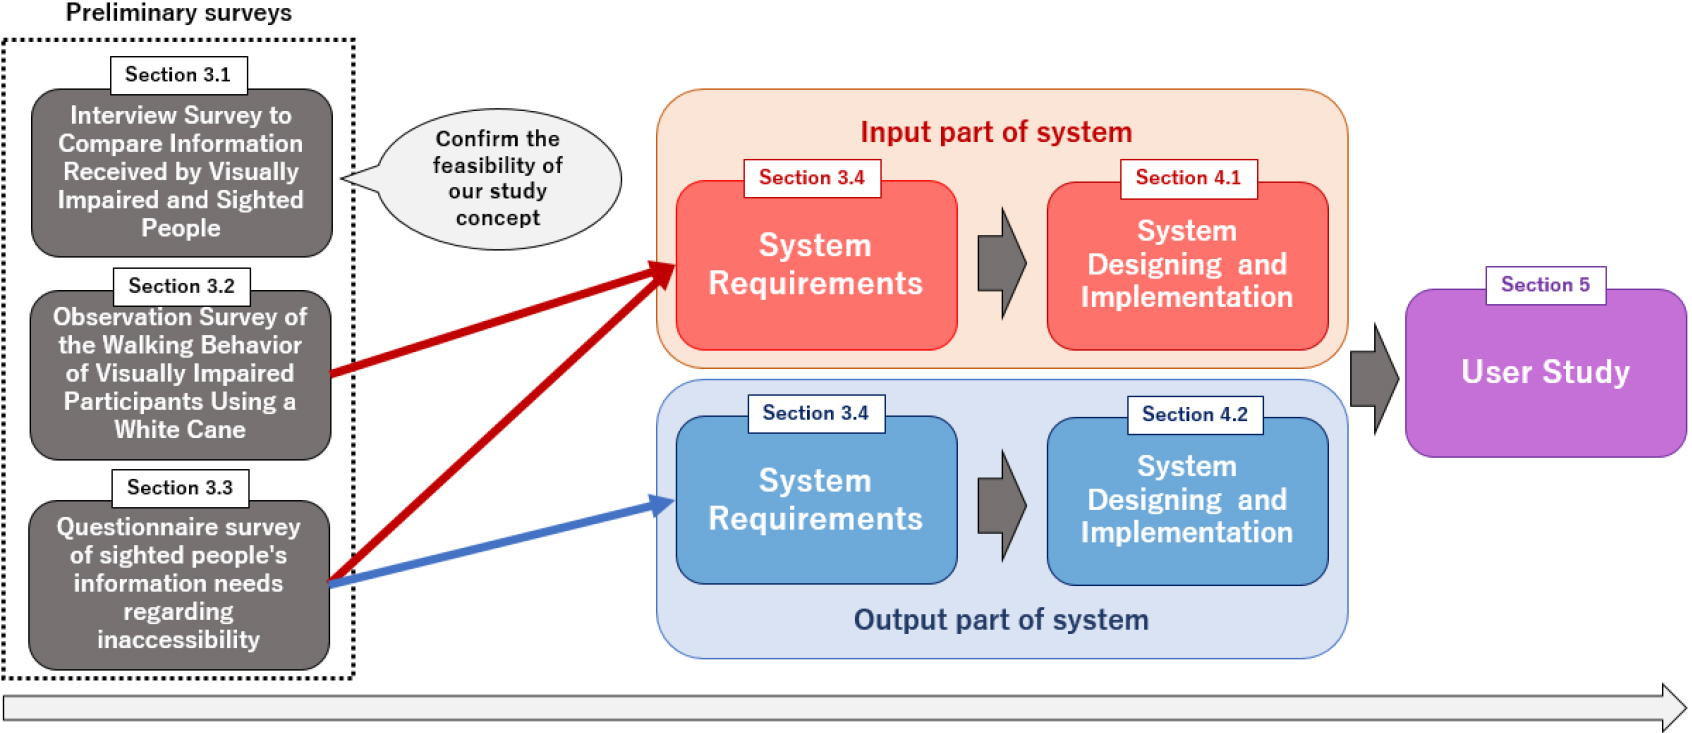
The study proceeded as shown in Fig. 1. In the initial phase, we conducted a few surveys of the visually impaired as the “givers” of support, and of the sighted as the “receivers“ of support (see Section 3). These surveys showed that the walking-with-a-white cane behavior of visually impaired people reveals information that may lead to identifying related difficulties or inaccessibility data useful for providing mobility support to elderly people, wheelchair users, and others with mobility problems. Based on these results, the study developed a system (Section 4) that detects sidewalk inaccessibility information, visualizes it, and then displays it on a map. This system is based on data obtained from visually impaired peoples’ use of white cane, to realize a framework in which visually impaired people are “givers” of support and sighted people are “receivers”. In Section 5 we conducted a user study of the system.
2.Related work
The related works in this study can be divided into two categories. The first contains works on the visually impaired. These include studies that consider the visually impaired as receivers of support and those that consider the visually impaired as givers of support. Most of the previous studies on the visually impaired fall into the former category, while this study falls into the latter. The second contains works on accessibility visualization.
2.1Literature on the visually impaired people
2.1.1Visually impaired people as receivers of support
The previous studies aimed at supporting the visually impaired are diverse and include research on reading and writing [3, 8, 9, 10, 11, 12, 13, 14], which are difficult for the visually impaired, as well as on various activities such as supporting visually impaired children to play [5], enjoy soccer games [15], record with a camera [16], create music [17], play games [18], and use virtual reality (VR) systems [19, 20, 21].
Among these studies on the visually impaired, the most numerous aim to support transportation, which is the most difficult and important activity for visually impaired people. Since they cannot interpret visual information, it is extremely difficult for them to know their exact location, direction they are facing, route to their destination, and obstacles on their path, including passers-by, and traffic conditions. Existing methods to support the visually impaired in perambulating include voice applications on smartphones [22] and smart canes [23, 24] with additional features. Smart canes for the blind can detect obstacles and provide voice navigation in conjunction with a smartphone, but they are not widely available. Consequently, there have been numerous studies to develop systems that provide auditory and tactile feedback to visually impaired people as support in using indoor and outdoor transportation [2, 25, 26, 27, 28, 29, 30, 31, 32, 33, 34]. In the study by Kayukawa et al. [2], a suitcase-type system that can guide visually impaired people was developed to support outdoor mobility. This system can enable visually impaired people to walk safely by alerting them with beeps to imminent collisions with obstacles forward of the user.
As mentioned, several studies on the visually impaired exist that support their various activities, but most of these studies consider them only as receivers of support. Only a few studies have focused on the capabilities of the visually impaired.
2.1.2Visually impaired people as givers of support
It is conceivable that visually impaired people have unique skills not possessed by sighted people. Ito’s book [35], discusses how visually impaired people see the world based on their experiences. It states that visually impaired people can be supported by utilizing their unique skills. A situation is described in which the unique skills of visually impaired people are applied in the sport they play. For example, blind football is played without visual information, using only auditory information for the position of the ball, where to pass, and when to shoot for goal. In bobsledding and aikido, visually impaired athletes have excellent balance and somatic senses, respectively.
“Dialogue in the Dark” [36] is an event where visually impaired people support sighted people. This activity has been conducted globally, experienced in 47 countries, and by more than 9 million participants. The event is organized in a completely light-shielded, dark space, with the visually impaired acting as caregivers and the sighted acting as participants. During the event, visual information is withheld from the sighted participants, thus allowing sensory experiences and insights normally unavailable to them.
In an event called Social View [35, 37], visually impaired and sighted participants interactively view artworks, and several people exchange opinions during the exhibition. The purpose of this event is not limited to explaining the artwork to the visually impaired. By having visually impaired people participate in interactive viewing, the sighted person is required to verbalize things that are not normally necessary when viewing alone or interacting with only the sighted person. In addition, by answering simple and novel questions posed by the visually impaired, the sighted participants were able to update their views and perceptions of the works. In other words, the visually impaired participants in this event provided the sighted participants with new insights about the artworks.
Thus, it is probable that the visually impaired can use their highly developed skills to support the sighted. However, only a few studies have considered the visually impaired as support givers.
Table 1
Reports of sighted participants and visually impaired participants walking in the park determined from the interview survey
| ID | Gender | Visually impaired or sighted | Age | Date | Time | Number and content of reports (Categorized by sense [51]) |
|---|---|---|---|---|---|---|
| P1 | Female | Visually impaired (Acquired blindness) | 50s | 2021/8/11 | 3 min 47 s | 20 items “Sound of water” “Pebbles below” etc. (Auditory 50.0 %, skin sensation 30.0 %, multiple sensations 20.0 %) |
| P2 | Male | Visually impaired (Congenitally blind) | 50s | 2021/9/14 | 3 min 47 s | 16 items “Sound of water” “In a narrow space” etc. (Auditory 37.5 %, equilibrium 12.5 %, skin sensation 18.8 %, multiple senses 31.3 %) |
| P3 | Male | Visually impaired (Poor vision) | 50s | 2021/8/11 | 2 min 12 s | 7 items “Spread” “wind” etc. (Auditory 14.3 %, equilibrium 14.3 %, skin sensation 57.1 %, multiple senses 14.3 %) |
| P4 | Male | Sighted | 20s | 2021/7/21 | 2 min 3 s | 16 items “Green curtains” etc. (Visual 75.0 %, equilibrium 6.3 %, multiple senses 18.6 %) |
| P5 | Male | Sighted | 20s | 2021/7/11 | 2 min 30 s | 15 itemss “Lots of trees” “Clean water” etc. (Visual 86.6 %, auditory 6.6 %, multiple senses 6.6 %) |
2.2Literature on visualization of accessibility
Various analyses and studies have been conducted on pedestrian accessibility in cities. One of the most representative of these is Accessmap [38], which is a web service provided by three municipalities in the state of Washington, United States; it visualizes the accessibility of 109210 sidewalks and 76561 crosswalks using colors. Several other attempts have been made to communicate accessibility, such as Wheelmap [39, 40], which visualizes accessibility for wheelchair users, and Walkscore [41], a walkability index that quantifies density and proximity to areas with good transit facilities
In addition to these specific attempts to visualize accessibility, and as selectively detailed below there have been related studies [42, 43, 44, 45, 46, 47, 48, 49, 50]. Manaswi et al. conducted a user study involving people with walking disabilities and other stakeholders to determine visualization methods that could be used to represent accessibility in the city [42]. In the experiment participants presented and discussed different types of accessibility map information, including heat maps, points, and lines. This was done to investigate the visualization methods and information representations preferred by each user group, which included people with walking disabilities and stakeholders such as political officials. Guilherme et al. proposed a route planning model to help wheelchair users select appropriate routes [48] The study by Hara et al. investigates how people with mobility impairments evaluate the accessibility of the built environment, conducts semi-structured interviews and participatory design, and makes recommendations on accessibility assistance using location-based technology [49].
As mentioned above, there are a wide variety of attempts to visualize accessibility and related research, and some services, such as Access Map [38], have been put into practical use, albeit in limited areas. In addition, related studies examine visualization methods and types of information to be visualized from the viewpoints of actual users and other stakeholders for example caregivers, etc. However, many of these studies utilize official datasets provided by cities and other organizations, as well as to a limited extent, manually obtained accessibility information, which is expensive to collect and does not provide detailed local information. In addition, there have been few efforts to collect such accessibility information automatically
3.Preliminary surveys
To derive the requirements for the system, we conducted surveys with the visually impaired and the sighted. The survey consisted of three parts: an interview to compare the information received from the visually impaired and the sighted, observations of the walking behavior of the visually impaired using a white cane, and a questionnaire to determine the information needs of the sighted regarding their difficulty in walking.
3.1Interview with visually impaired and sighted people
3.1.1Objective and method
To develop a system in which visually impaired people are the information providers, we had to identify the specific information only they can provide. Therefore we conducted an interview study to observe and compare the information-gathering methods of visually impaired and sighted people, to clarify whether the visually impaired perceived information more efficiently than the sighted.
Figure 2.
Surveying environment and capturing video angles.
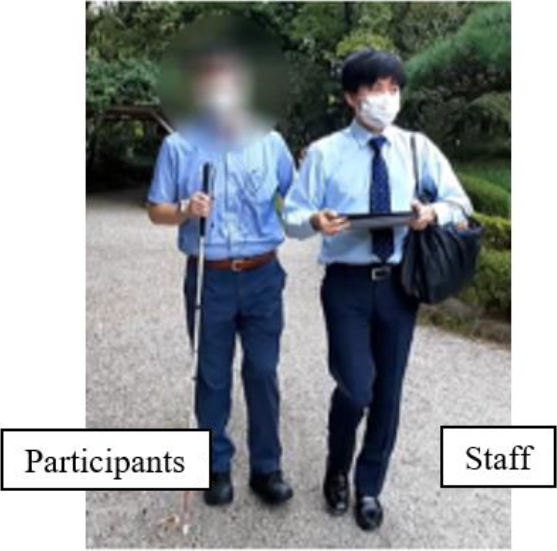
Figure 3.
Survey location and participants’ walking route. Participants walked toward point G in the figure.
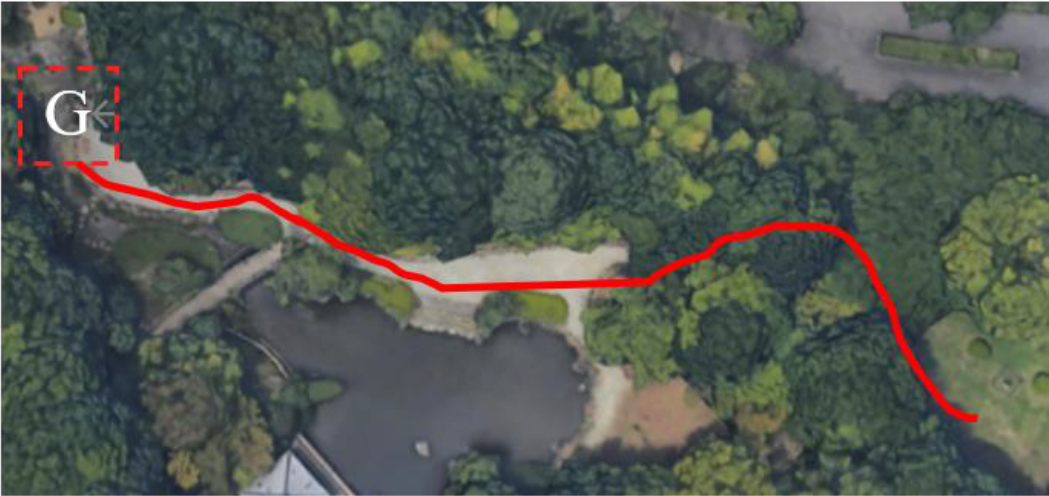
Five participants were recruited: two sighted and three visually impaired (two blind and one with poor vision) (Table 1). Two visually impaired participants who used white canes were requested to walk as usual. Figure 3 illustrates the study situation. A traditional garden in a park (Fig. 2) was selected as the study site because walking there was relatively easy and it was rich in information, including visual information and the sounds of animals and water. Generally, it would take sighted people several minutes to cover the route by walking (red line in Fig. 3). To ensure that both visually impaired and sighted participants could walk comfortably and under the same conditions, all participants were afforded staff support. We captured video and audio recordings of the participants walking. In addition, we required participants to “Please verbally report anything you noticed” and recorded their contributions. The study was approved by the Ethical Review Committee for Research on Human Subjects of Tokyo City University (Approval No.: 2021-h07).
3.1.2Results
In turn, this section describes the participants’ reports and behavior during the survey.
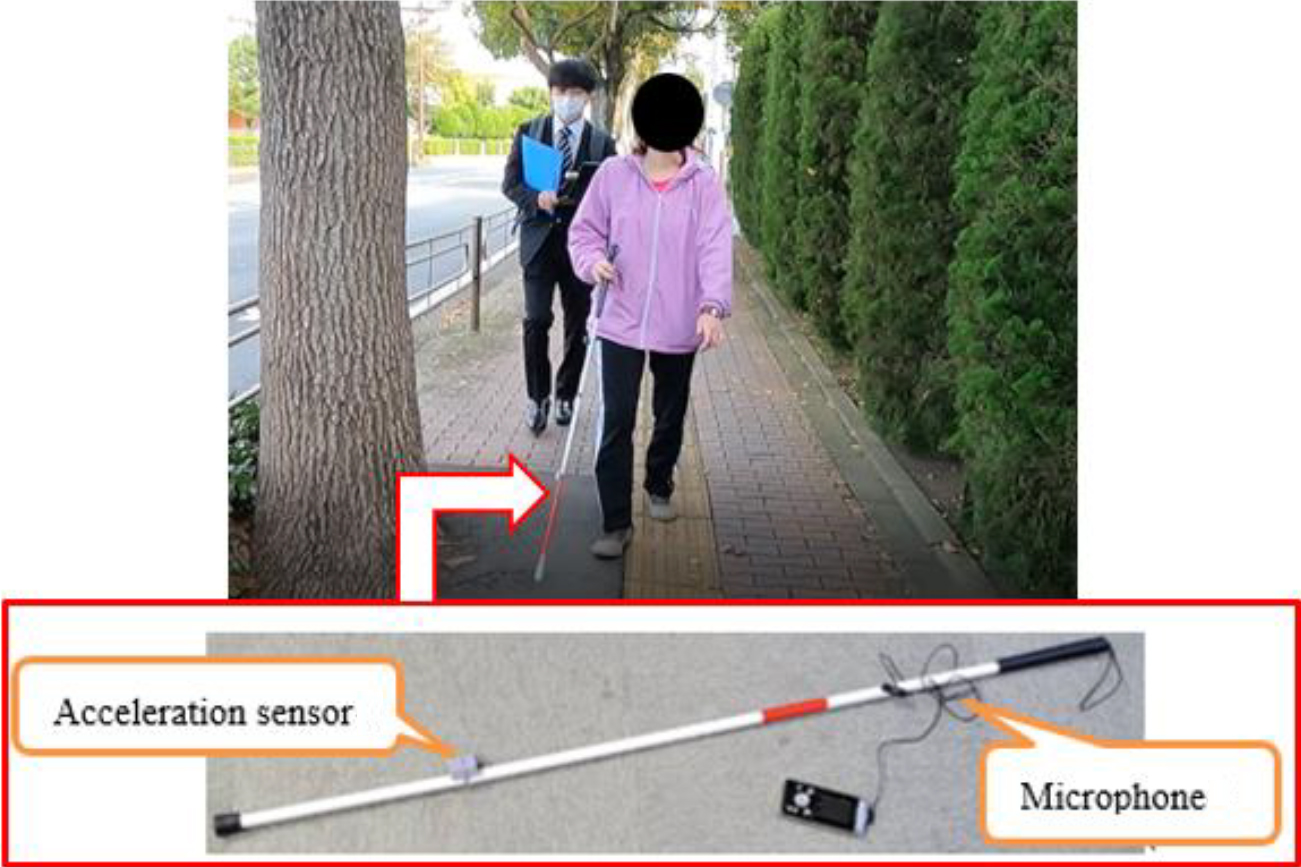
Figure 4.
Perspective of the video. The white cane with the attached sensor.
Reports
Table 1 lists the number and content of participants’ reports. Table 1 shows that most of the reports from sighted people were related to visual information, while the visually impaired people reported only auditory information, which was not reported by sighted people. There are several models of general human information processing, e.g., Card et al. state that “human information processing consists of perceptual, cognitive, and motor processors, in that sequence” [53]. According to this model, the reason why the sighted people did not report the information reported by the visually impaired people is that they had not yet reached the cognitive processor stage, although it is impossible to determine whether the sighted people were not able to “perceive” the information. Otherwise expressed, the results suggest that visually impaired people may be able to “cognize” information that sighted people cannot.
Behavior
Participants P1 and P2, who were blind and visually impaired and required a white cane to walk, took longer to complete the task than the other participants and seemed to search for information more carefully. Participant P3, who had low vision, was able to acquire some visual information and walk unaided, and therefore took less time to complete the task than P1 and P2. Sighted participants P4 and P5 also took less time to complete the task than P1 and P2. Thus, participants who were able to acquire visual information had a shorter time till task completion. The visually impaired participants sometimes slow down their walking pace to pick up information about the surroundings, but this was not observed in the sighted participants. In particular, we observed that the visually impaired participants, who are totally blind, intentionally moved their white canes widely to search for information, although they relied less on the white cane owing to the presence of a companion. Therefore, we decided to observe the visually impaired participants to understand how and what kind of information they received when using their white canes
3.2Observation of visually impaired
3.2.1Objective and method
The results of the above-mentioned comparative survey between visually impaired and sighted people indicate that there appears to be a correlation between the walking movements of visually impaired people using a white cane and the information they receive. Based on this finding, we conducted a survey to observe the walking movements of visually impaired people using a white cane.
Two participants were recruited. P1 and P2 were visually impaired individuals who used a white cane in the preliminary study. They were asked to walk with a white cane on a straight sidewalk near their workplace. We videotaped the participants while walking with modified white canes equipped with a microphone and an accelerometer [52] (Fig. 4). The study was approved by the Ethical Review Committee for Research on Human Subjects of Tokyo City University (Approval No.: 2021-h07).
3.2.2Results
Two participants performed periodic movements with a white cane, varying their walking speed and sometimes stopping. They learned to operate the white cane with periodic movements as a way of operating the white cane for the visually impaired [54]. The tempo of this periodic movement matched the walking tempo, and the side-to-side cane movements were executed to determine if there were any obstacles within a shoulderwidth forward region.
During this observation, three characteristic behaviors of the two participants were observed: A) changing the periodicity of the white cane swing direction, B) slowing down of walking pace, and C) stopping of walking. Table 2 lists these observed movements, along with the factors that may have caused them. The two locations (1–2 and 1–3) where characteristic movements were observed in the gait patterns of P1 were the same for P2 (2–2 and 2–4), respectively. Figure 5 shows P1 walking at positions 1–2, and Fig. 6 shows P2 walking at positions 2–4.
Table 2
Characteristic behaviors observed in visually impaired participants using a white cane and their presumed causes
| ID | No. | Characteristic behavior | Presumed factors |
|---|---|---|---|
| P1 | 1–1 | A) Changing the periodicity of the white cane swing direction | Unknown |
| 1–2 | A) Changing the periodicity of the white cane swing direction | The sidewalk tilts toward the roadway at the entrance/exit of the parking lot. Texture underfoot changes | |
| 1–3 | A) Changing the periodicity of the white cane swing direction | Bulges in the sidewalk owing to tree roots. | |
| 1–4 | A) Changing the periodicity of the white cane swing direction | Bulges in the sidewalk owing to tree roots. | |
| P2 | 2–1 | A) Changing the periodicity of the white cane swing direction | Unknown |
| 2–2 | B) Slowing down of walking pace C) Stopping | The sidewalk tilts toward the roadway at the entrance/exit of the parking lot. Texture underfoot changes | |
| 2–3 | B) Slowing down of walking pace | The sidewalk tilts toward the roadway at the entrance/exit of the parking lot. Texture underfoot changes | |
| 2–4 | B) Slowing down of walking pace | Bulges in the sidewalk owing to tree roots. | |
| 2–5 | B) Slowing down of walking pace C) Stopping of walking | Unknown | |
| 2–6 | C) Stopping of walking | Sounds of cars passing nearby |
These results and the general operation of their white canes learned by visually impaired people [54] suggest that visually impaired people usually repeat periodic walking movements with a white cane but may change their movements where they find it difficult to walk.
3.3Questionnaire with sighted people
3.3.1Objective and method
We conducted an interview survey to understand what information sighted people need when walking, in relation to the ability or difficulty of walking We surveyed nine users of community spaces for the elderly in Kanagawa Prefecture, using a multiple-choice questionnaire as shown in Table 3.
Figure 5.
P1 perceives the inclination of the sidewalk and adjusts the movement of the white cane.
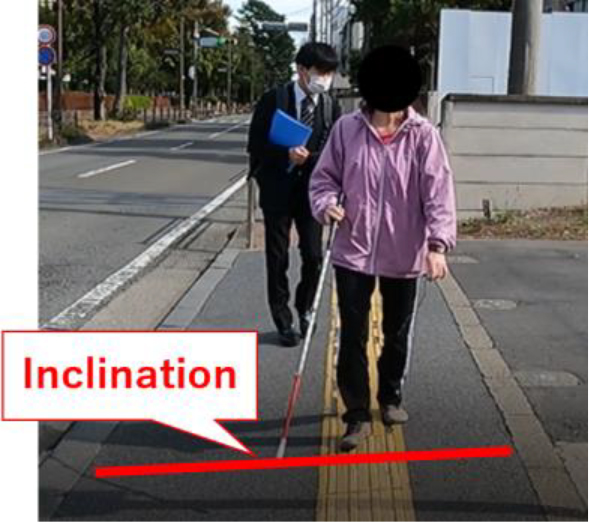
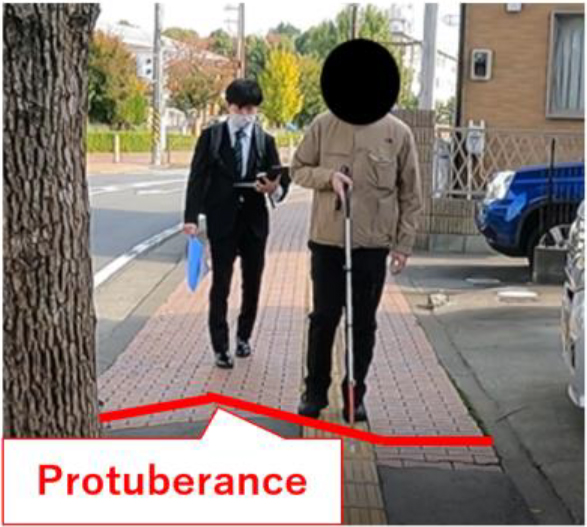
Figure 6.
P2 perceives the protuberance of the road and adjusts the movement of the white cane movement.
The purpose was to focus on elderly people and wheelchair users, who are likely to have a higher need than sighted people for information about the ease and difficulty of walking This survey consisted of two main questions:
(Q1) “Where do you feel uncomfortable or want to avoid walking?” (Q2) “Would it be useful to know in advance which areas are within easy walking distance and which are not?
The response options for Q1 were the 17 factors related to the difficulties shown in Table 4. These 17 factors are the responses from interviews conducted with the same facility users prior to this survey, which posed the same questions as Q1.
3.4Results
Table 3
List of elderly sighted survey participants
| ID | Gender | Age | Equipment for walking |
|---|---|---|---|
| I1 | Male | 70s | Not required |
| I2 | Male | 80s | Not required |
| I3 | Male | 60s | Not required |
| I4 | Female | 60s | Cane |
| I5 | Female | 70s | Not required |
| I6 | Female | 80s | Not required |
| I7 | Female | 80s | Cane, Wheeled walker |
| I8 | Female | 60s | Not required |
| I9 | Female | 70s | Not required |
The main results of the questionnaire are listed in Table 4. In descending order, the most frequently selected items were uneven road pavement marks, steps, inclines, bulging sidewalks near trees, areas with many bicycles, dark areas, and slippery areas.
Table 4
Answers for Q1: Where do you feel uncomfortable or do not want to walk?
| Choices | Number of participants who chose |
|---|---|
| Uneven pavement | 9 |
| Steps | 7 |
| Incline | 6 |
| Ridges in the sidewalk caused by tree roots | 6 |
| Places with many bicycles | 6 |
| Dark places | 6 |
| Slippery places | 6 |
| Uphill | 5 |
| Downhill | 5 |
| Places with several objects on the sidewalk | 5 |
| Places with several cars | 5 |
| Places with thick plants | 5 |
| Stairs | 4 |
| Gravel road | 4 |
| Peeling blocks or tiles | 4 |
| Braille blocks | 4 |
| Places where you are frequently startled by insects or birds | 2 |
All participants agreed when asked about the need for information about difficulty in walking. The results shown in the table indicate that the pavement marks, steps, and slopes that received the most responses were consistent with the information about the condition of the road surface seemingly expressed during observation of the walking behavior of the visually impaired participants described in Section 3.2 This information reflects the factors that cause the elderly to trip or slip while walking, possibly resulting in injuries. Conceivably, collecting data on the walking movements of visually impaired people who use white canes and presenting this information to the sighted elderly could support safe walking and route planning. In response to Q2, the results suggest that older sighted adults would like to receive advance information about walking difficulties in their path, regardless of their physical condition.
3.5System requirements
The survey presented in Section 3.2 suggests that there is information available only to the visually impaired and that some of this information is expressed in their walking behavior regarding three characteristic movements: A) changing the periodicity of the white cane oscillation and direction, B) slowing the walking pace, and C) stopping. Such information could suggest inaccessibility, such as sidewalk ridges, steps, or inclines, as provided by participants in the observation survey (Section 3.2).
The survey reported in Section 3.3 elicited information about walking difficulties that sighted people would want to know. Although the three behaviors observed in Section 3.2 are not precisely consistent with each of the top walking difficulty factors listed in Table 4 (answered in Section 3.3), all the factors are associated with one of the behaviors, e.g., all three types may occur in areas with steps. The system requirements for the input part were derived from the preliminary surveys in Section 3.2 and 3.3, and for the output part were derived from the surveys in Section 3.3. The requirements are as follows:
1. Detect the walking behaviors associated with walking difficulties using white cane usage data (input part of the system).
A) Change in periodicity of the white cane swing direction
B) Slowing down of walking pace
C) Stopping of walking
2. The system outputs information about the walking difficulty of sighted people (system output).
Figure 7.
System overview.
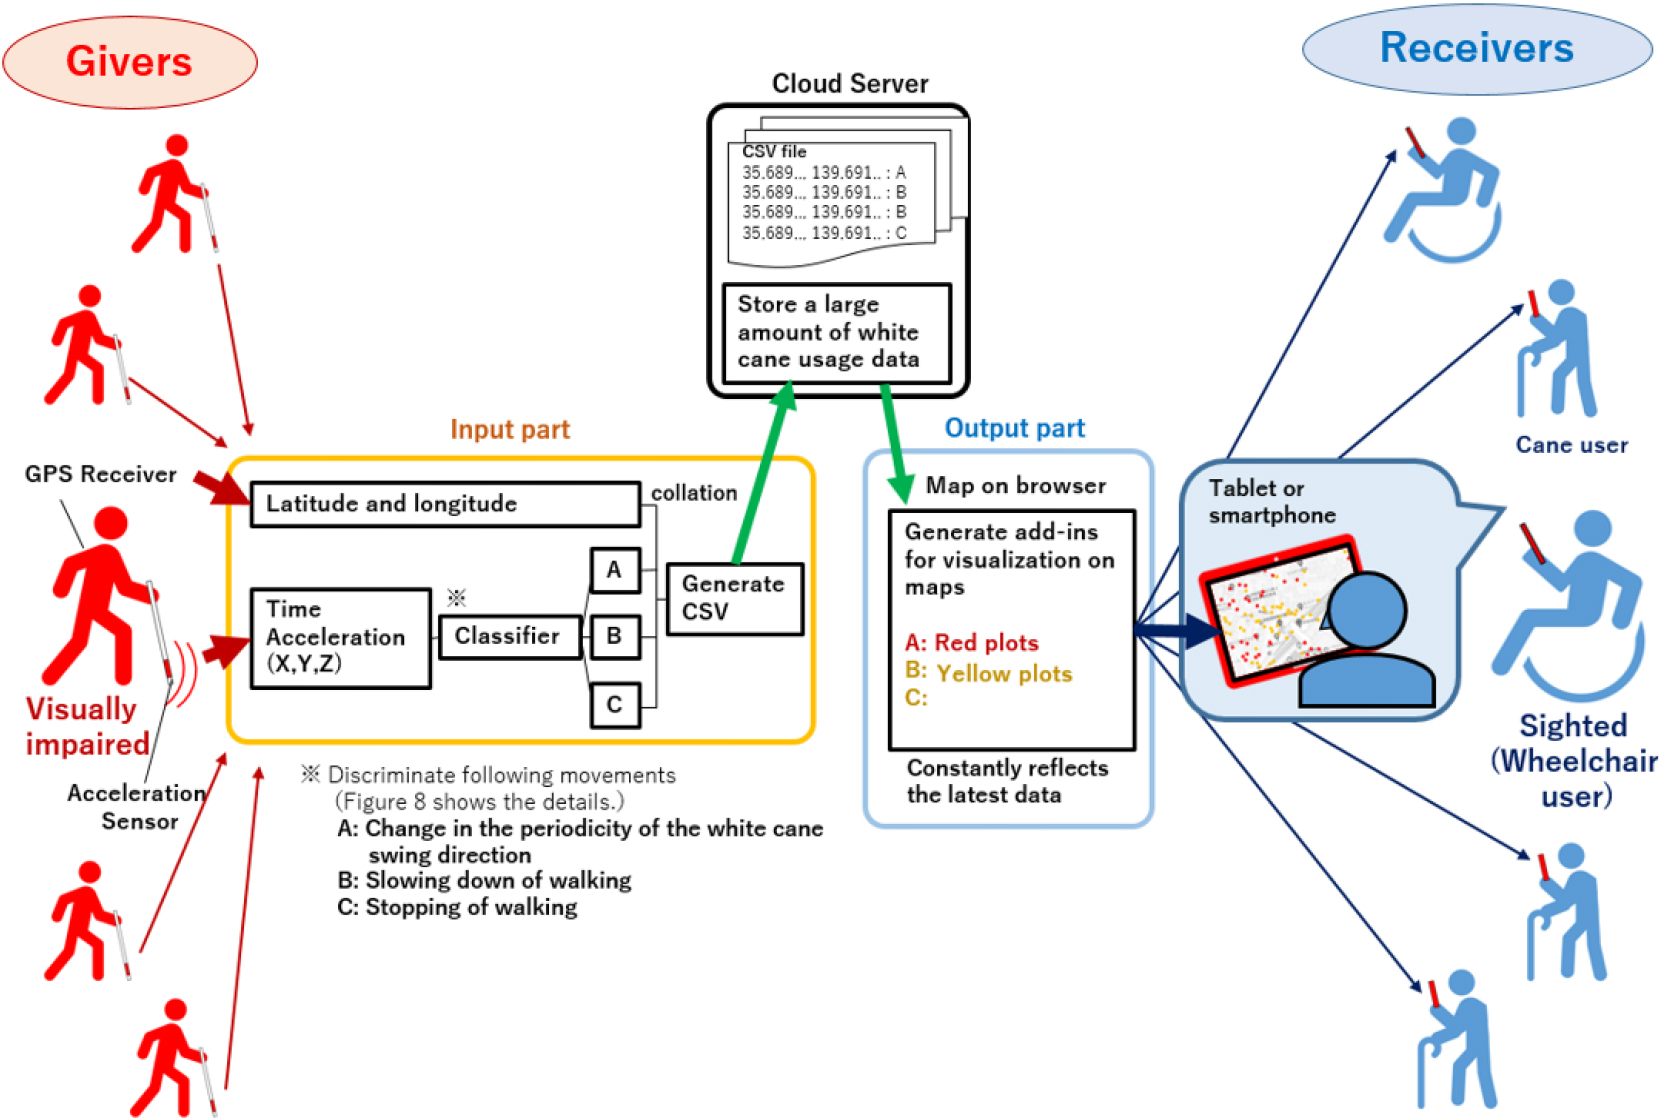
4.System design and implementation
To meet these requirements, this study proposed a system that visualizes inaccessibility on a map and presents it to sighted users, using data on the use of white canes by visually impaired people. The overall system implemented in this study is shown in Fig. 7. Section 4.1 describes the input (left-hand side of Fig. 7) and 4.2 describes the output of the system (right-hand side of Fig. 7) respectively
4.1System input
We consider a system that satisfies the requirements of the input part presented in Section 3.4. In the input part, the system must be able to detect changes in the movements of a visually impaired person who stops walking, slows down walking, and changes in the periodicity of swing the direction in which the white cane is swung. These are behaviors that express the visually impaired person’s perception of inaccessibility.
In general visually impaired people have learned to match two key moments when they walk with the white cane [54]: the moment when they tap the white cane on the ground and when they place their leading foot on the ground. Thus, by capturing white cane usage data associated with the stride step, not only the movement of the white cane but also the slowing down or stopping of the visually impaired person’s walking can be detected.
In addition, the sensor attachment used to collect data regarding white cane usage must not interfere with the walking of the visually impaired person. This can be achieved by using a relatively small and lightweight sensor. By collecting data on the use of the white cane with lightweight sensors, this system can automatically obtain accessibility information that is often costly to collect, by simply recording the visually impaired people walking as they do in everyday life.
Figure 8.
Flowchart of the system input part.
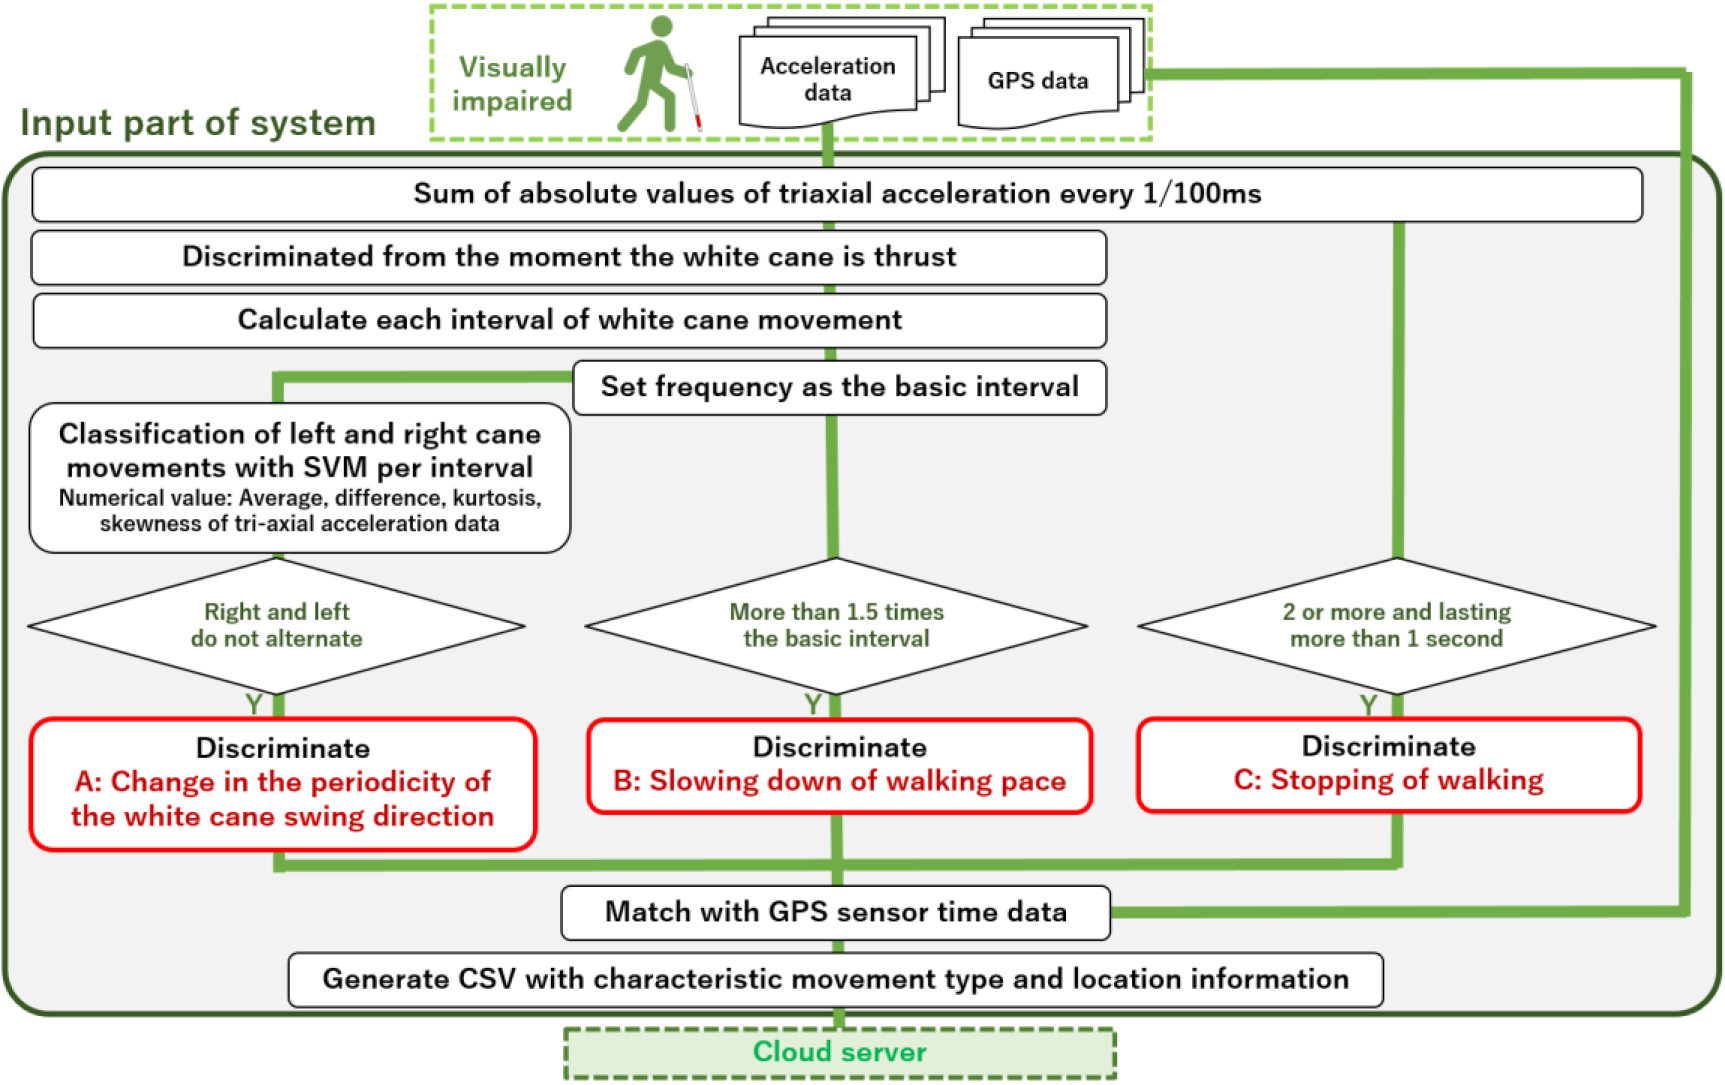
Based on these designs, an input subsystem was implemented. Figure 8 shows the flowchart of the input subsystem. Using a compact and lightweight 3-axis accelerometer TWELITE2525A [52] and a GPS sensor, the system collects acceleration data, positional information and corresponding white cane timing data and uses these to discriminate three types of motion. In the tri-axial acceleration data from the white cane, the acceleration is highest when the tip of the cane touches the ground at both extremes of the oscillation, and this facilitates the extraction of the moment when the white cane and walking foot meet the ground. The system primarily calculates the time interval between one cane tap and the next, defines its most frequent value as the basic interval for each visually impaired person, and uses it as the basis for distinguishing the three movements as shown in the flowchart in Fig. 8. After the three distinctions, the time data is matched with that from the GPS sensor and forwarded to the cloud server.
Therefore, to discriminate the change in periodicity of the direction in which the white cane was swung, we used the support vector machine (SVM) algorithm for machine learning, as shown in the left side of Fig. 8. Using only the acceleration data from a total of 496 oscillations of the white cane, i.e., the usage data of the two visually impaired subjects from the observational survey (Section 3), the accuracy of discrimination was 60.3% when classification is performed with a percentage split of 70.0%. Currently, the accuracy is only 60.3% because with only two participants, we were unable to collect a significant amount of white cane usage data The COVID19 pandemic made it difficult to collect sufficient data, but the accuracy can be improved by adjusting the classifier after data collection.
4.2System output
Figure 9.
Visualize inaccessibility emerging from large amounts of data on a map.
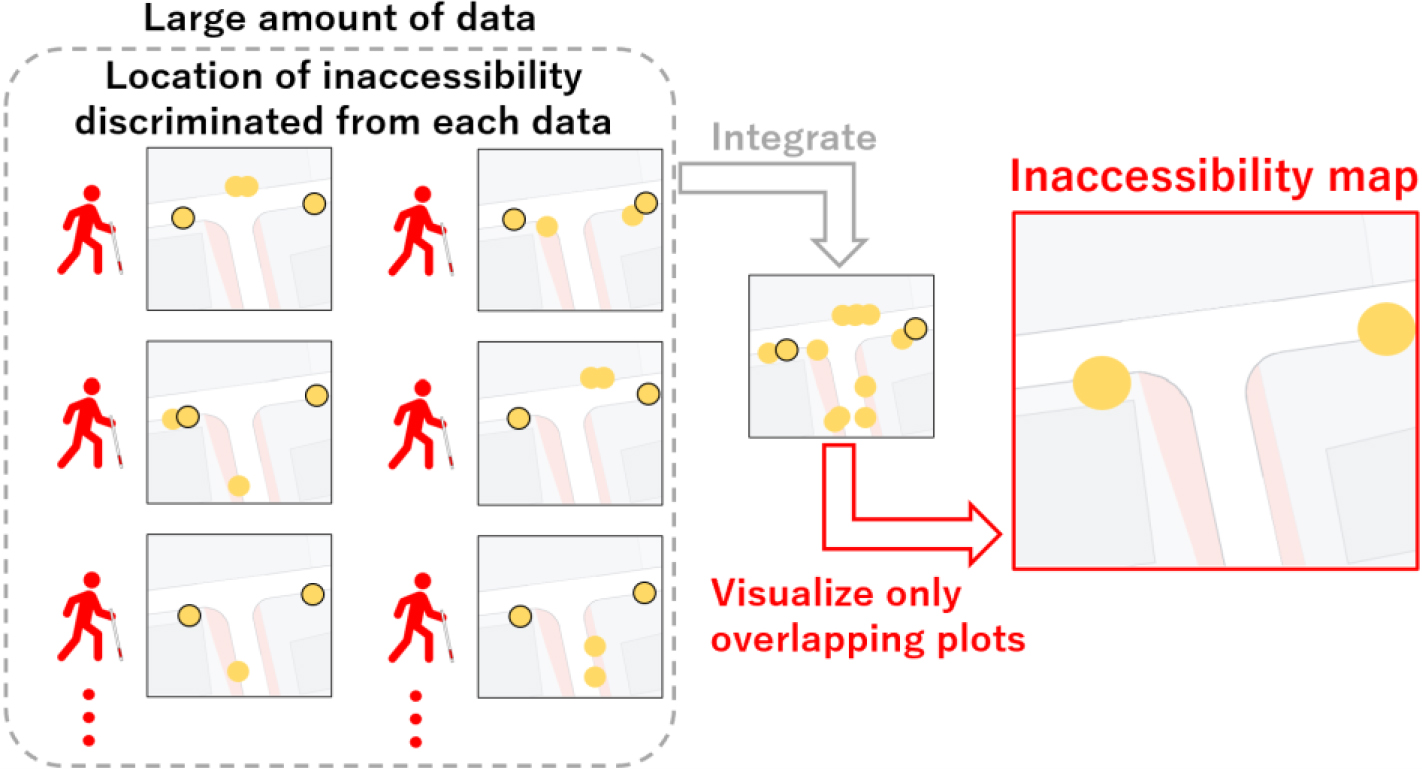
Figure 10.
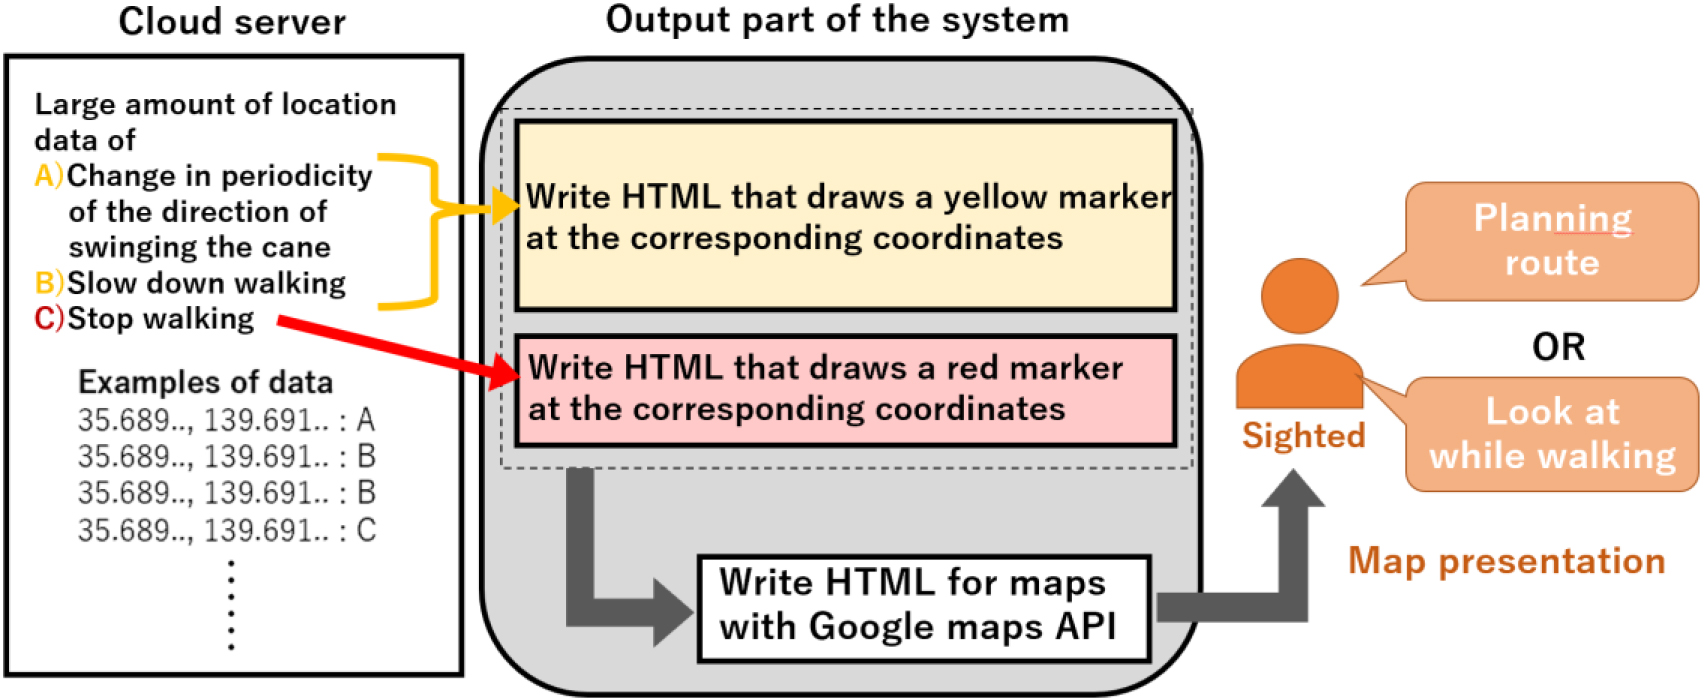
Output system diagram.
We designed a system that satisfies the requirements for the output part as stated in Section 3.4. The output part presents to the sighted person the inaccessibility noticed by the visually impaired person, which is determined by the input part. Therefore, the three walking motions determined by the input part are classified into two types according to their importance and are presented to the sighted person by visualization. First, visually impaired people stop walking when regarding that it is dangerous to move at a location Moreover, they reduce their walking speed and probe with the white cane to explore the surroundings carefully [54]. Therefore, stopping is represented with a red marker indicating that it is the most hazardous. Because reducing speed, changing motion, and scanning with the cane are commonly and simultaneously performed to carefully gather surrounding information, both are represented with yellow markers indicating a high level of hazard. The output part plots the red and yellow markers on the existing map and presents them to the sighted people because the input part can clearly identify the coordinates of inaccessible areas. In addition, this system assumes that a large amount of white cane use data has been collected. If information is graphically presented on a map according to each visually impaired person’s usage data, visualizing inaccessibility correctly may be difficult due to individual differences (such as familiarity), environmental differences (such as weather and time of day) and unrelated content for example. Too much information may also be presented. Therefore, this system visualizes only the inaccessibility that emerges consequent to accumulating a large amount of usage data and avoids the visualization of irrelevant information due to differences among individuals and environments (refer Section 6). A threshold is set according to the scale of the actual data collection, and markers are plotted only at the coordinates where the inaccessibility exceeds that threshold (Fig. 9).
Based on this design, an output part was implemented as shown in Fig. 10. Since the proposed method assumes that data on the use of white canes by a large number of visually impaired people have been collected the relevant coordinate information is stored in the cloud. Several platforms including Google Maps API and Bing Maps API, allow information to be added to maps. Our system uses the Google Maps API to visualize markers on specific coordinates. The implemented system automatically writes HTML describing the markers for the stored coordinates. Figure 11 shows the inaccessibility map output by the system using P2’s white cane and GPS data (test data was used because location information was not obtained) collected during the observation survey described in Section 3. The markers are correctly plotted at the locations where changes in P2’s walking movements were observed during the observational survey.
Figure 11.
Inaccessibility map shown using P2 data collected in the observational study as described in 3.2.
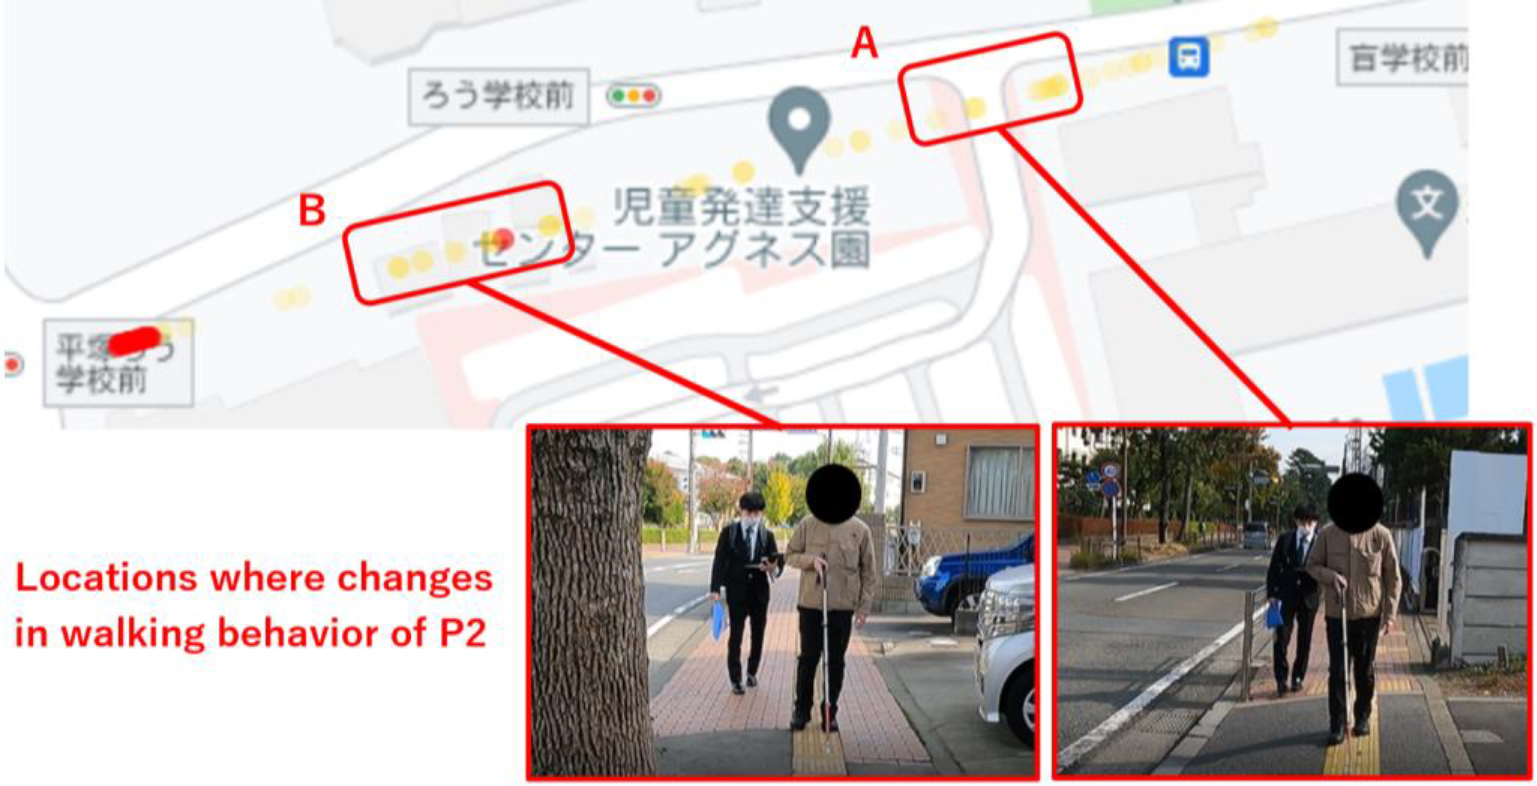
Figure 12.
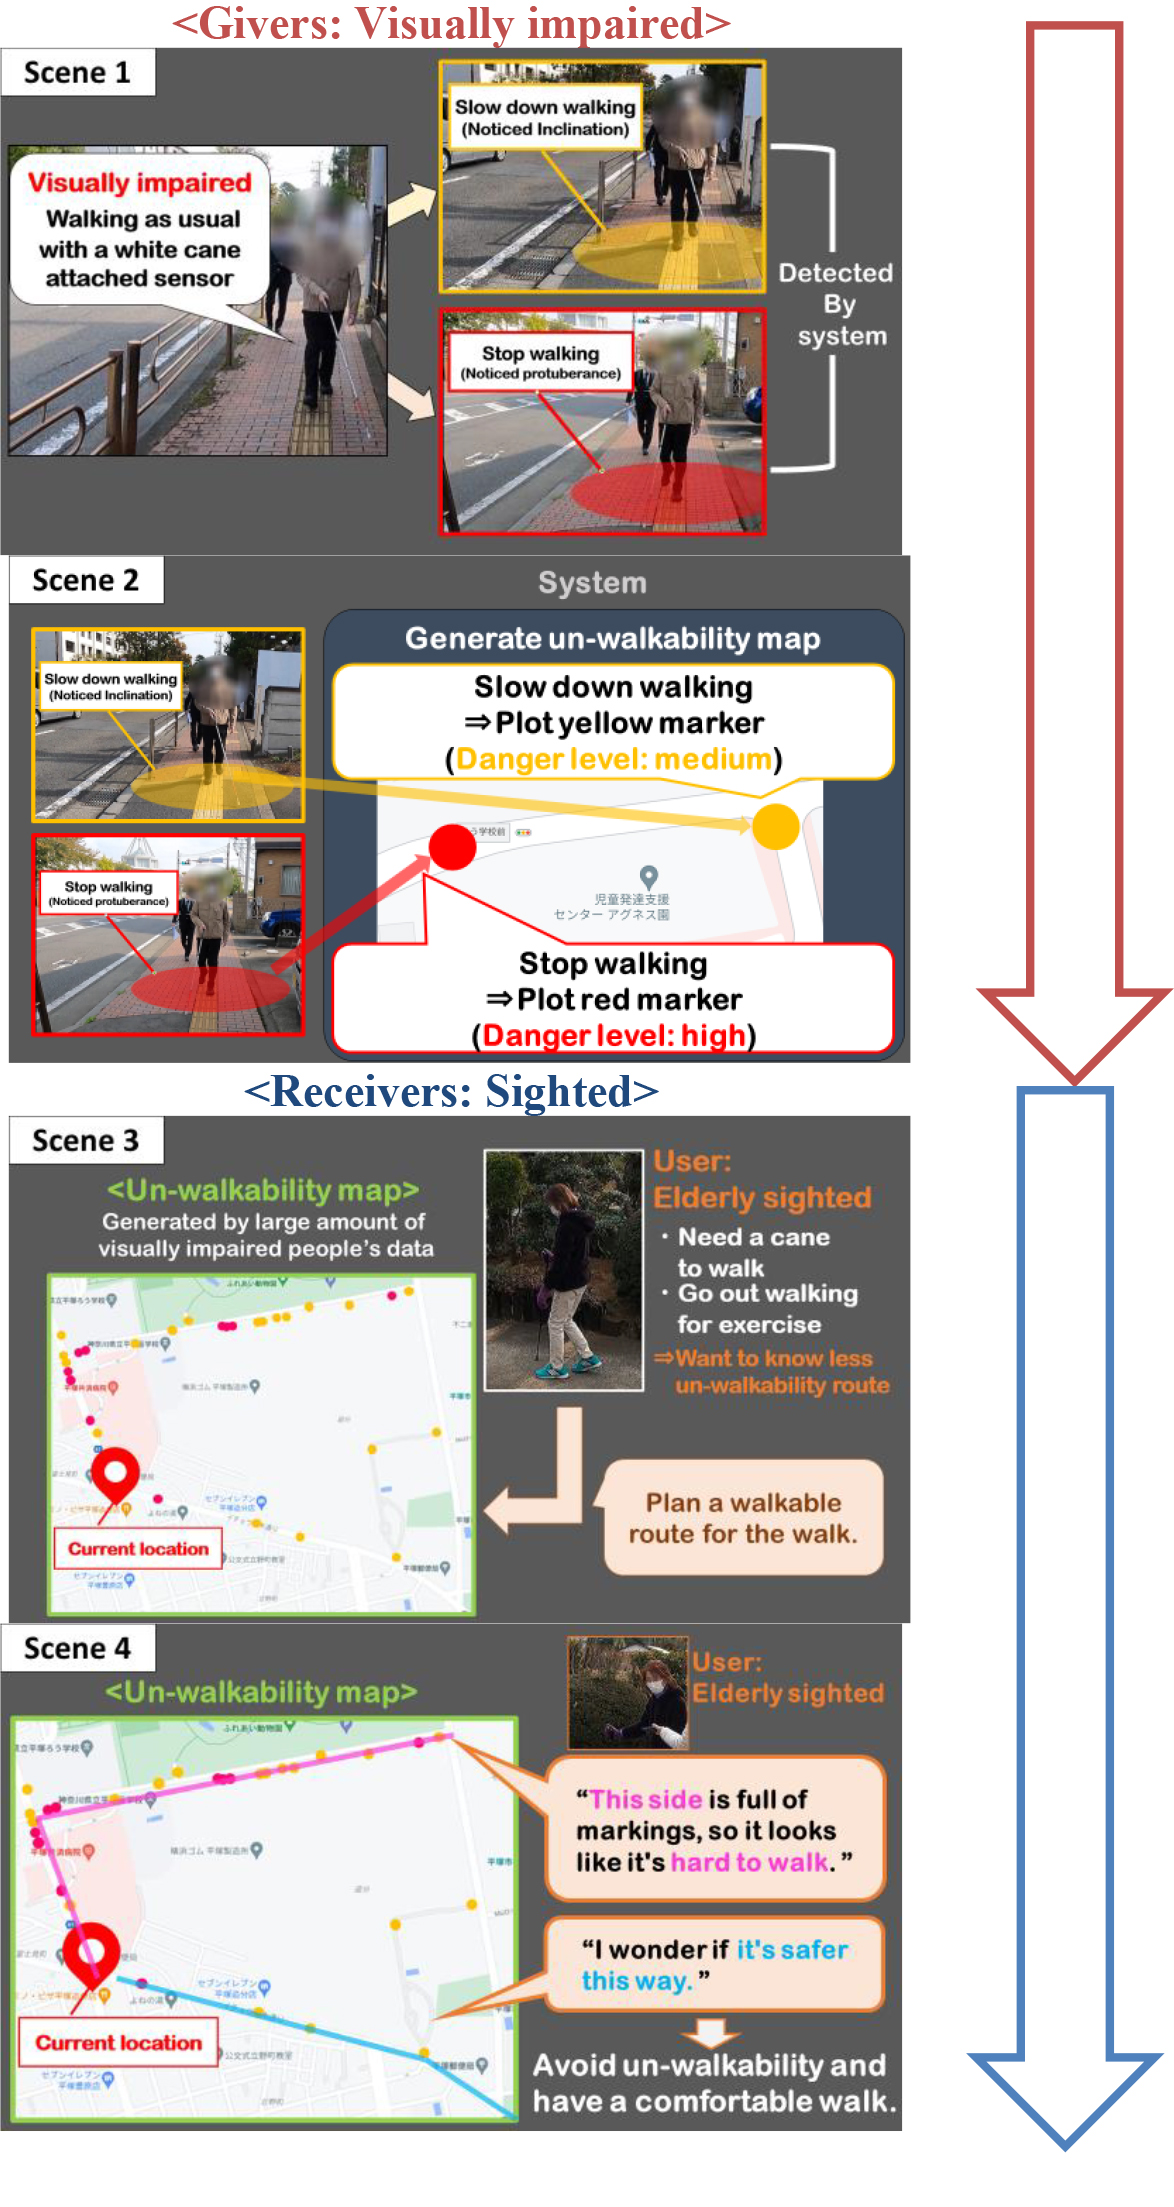
Example of a usage scenario. It shows how the inaccessible areas identified by visually impaired people are visualized on a map, which is then used by older sighted people to plan a more accessible walking route.
4.3Usage scenarios
Figure 12 shows a scenario in which the system is being used by an elderly person who requires a cane to walk. In the figure, the elderly user plans an easy-to-walk route from the green marker to the red marker. It is also assumed that several visually impaired users provided data for the system and that sufficient information about inaccessibility is displayed on the map.
5.User study
5.1Structure of the study
5.1.1Objectives and method
Before collecting the data, we conducted a two-phased user survey on the system’s interface to observe how sighted people, the elderly and their stakeholders understood and utilized the inaccessibility map using mock inaccessibility map we created. The first phase was a thought study to observe how users understand the inaccessibility map (described in detail in Section 5.2), and the second phase was a field study to observe how they actually walk after viewing the map (described in detail in Section 5.3). The study was approved by the Ethical Review Committee for Research on Human Subjects of Tokyo City University (Approval No.: 2021-h07).
5.1.2Participants
We recruited six participants five elderly people who use a senior citizen community space in Kanagawa Prefecture of Japan and one staff member. Table 5 lists the participants. We included the staff member (U6) because she has a good understanding of the elderly participants, which we believed would help the discussion run smoothly and prevent deviations.
5.2Thought study phase
5.2.1Tasks
The participants were first shown the inaccessibility map, representing the proposed method (left-hand side of Fig. 13), and a simple Google map of the same area showing nothing (right-hand side of Fig. 13).
Table 5
List of Participants in the userstudy
| ID | Gender | Age | Attribute |
|---|---|---|---|
| U1 | Male | 70s | Elderly |
| U2 | Male | 80s | |
| U3 | Female | 70s | |
| U4 | Female | 80s | |
| U5 | Female | 80s | |
| U6 | Female | 50s | Facility Staff |
Figure 13.
Two types of maps used in the study. (Left: Map with plots showing inaccessibility; Right: Map of the same area without markers).
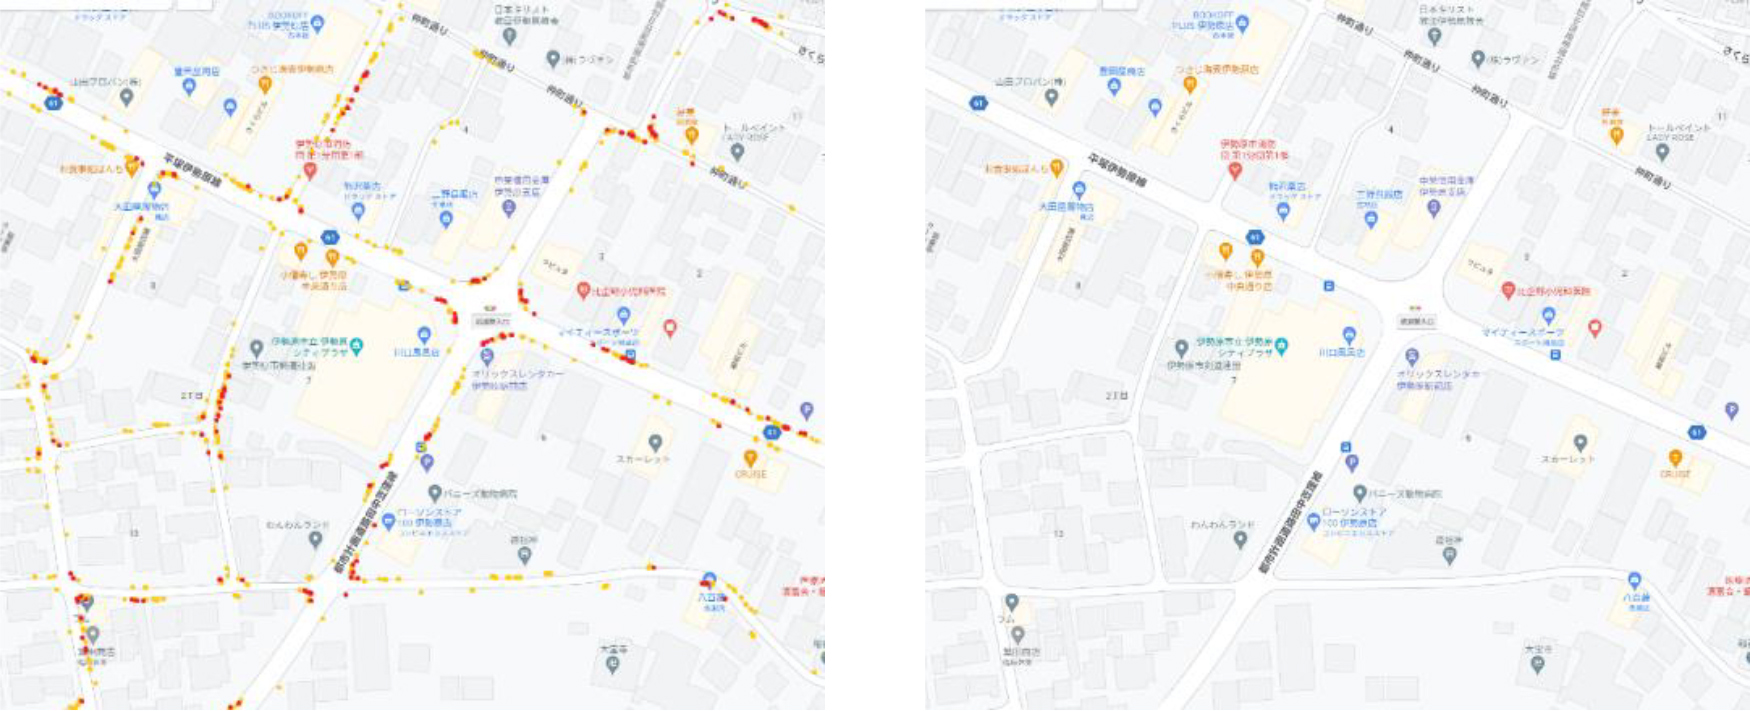
Plain maps with no additional content were also shown to participants because we thought that a comparison would facilitate discussion and help participants understand the maps with additional content. We also referred to a previous study [43] that examined visualization methods for accessibility, and asked participants to discuss the maps as they compared them. These maps were centered on the community space with which all participants were familiar and where the study was conducted. They were also advised that the red markers indicated where the visually impaired people stopped and the yellow markers where the visually impaired people slowed down.
As mentioned in Section 4.2, our system cannot create the actual map at this stage before the data is collected, because our system determines and visualizes inaccessibility from the accumulated data after a large amount has been collected. Therefore, we created and used a mock inaccessibility map created by plotting markers on slopes and steps, comparing the trends in Fig. 10, which was created using the observations described in Section 3.2 and a limited set of actual data from the actual site. Thus, while this user survey was intended to evaluate the proposed methodology, it is not a definitive evaluation based on actual data on the visually impaired, the system, and the maps created using it. This study, which is a partial evaluation of the proposed method possible at the current stage before data collection, intended to test how sighted people, as receivers of support, understand and utilize the information provided by visually impaired people when it is presented through systems to support them.
To observe how the participants, i.e., sighted people, would understand and use our proposed inaccessibility map in the thought phase of the study, we asked them to freely discuss with each other while looking at the two maps. In the first five minutes we said, “First, I want you to look at the two maps and talk freely with each other about what you understand and what you think.” and let the participants discuss freely among themselves. For the next five minutes, we placed two magnets on the inaccessibility map, one indicating the current location and the other the destination, and asked, “Next, please think of a route from the starting point where you placed the magnets to the goal. You can use a pen to draw a line along your chosen route Please discuss this process among yourselves as well.” The participants discussing the map can be seen in Fig. 14 below.
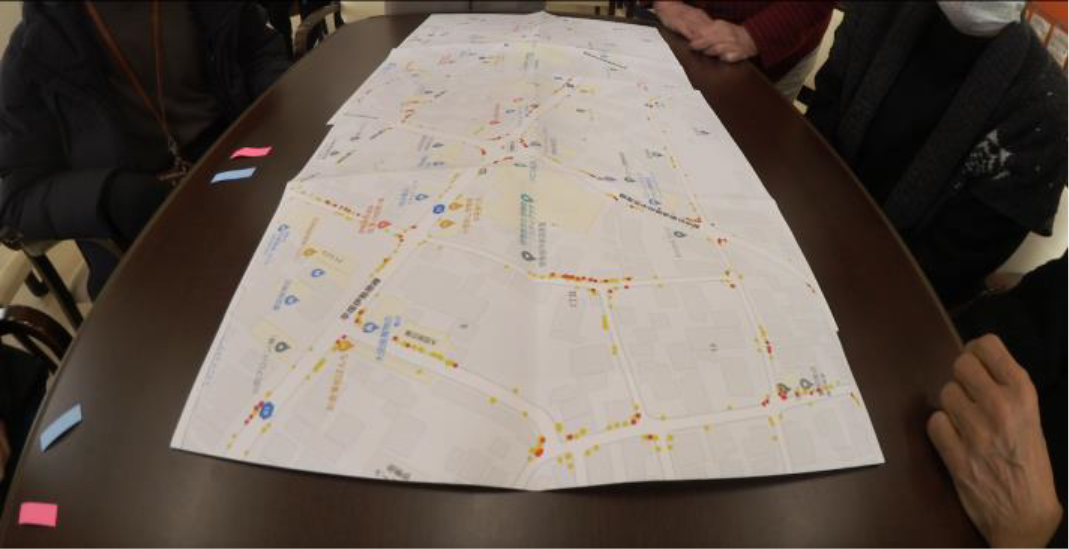
Figure 14.
Participants speaking around two maps during a task. The map in the foreground shows the proposed method.
5.2.2Result and consideration
The first five minutes of the thought study phase focused on where the markers were on the inaccessibility map and what they meant. U1 said, “This street is the safest,” U2 said, “There are quite a few intersections,” U6 said, “Red markers are where the road changes direction,” “There are many red markers in a straight line here,” and “This is because buildings extend to the edge of the road.” Thus, participants commented on the safe, dangerous, and difficult walking areas that could be identified from the markers, as well as the causes and trends, and no skepticism was expressed regarding the reliability of the information. In addition to these statements, U1 and U2 also said, “There are a lot of people speeding in cars,” and “The slope here is difficult to walk on,” and seemed to compare their knowledge of the surrounding environment with the existing information. During the 5-minute route planning discussion in the second half of this phase, U2 first named the shortest and most direct route, and said, “I think of this route first,” to which all participants agreed. However, later, U1 and U2 said, “If we are concerned about safety, we should go this way,” and the discussion focused on the route with fewer markers than the agreed route. The two routes discussed by the participants are shown in Fig. 15.
The results of this phase suggest that the walking difficulty map conveys where seniors would have difficulty walking, but also offers more detail regarding the difficult road conditions than discerned by the granularity of the walking difficulty factors presented by our system. In addition, a few participants were able to interpret the inaccessibility location and match it with their existing knowledge of the environment, suggesting that users who are familiar with the location could also use the system.
In addition, although consensus on the shortest route was reached in the route planning discussion, the participants had also identified a route with fewer markers. They concluded from the inaccessibility map that the route was accessible. We attribute the consensus on the shortest route to two reasons: first, most of the participants were elderly, but few of them had difficulty walking (the study could not be conducted with a large group because of the Covid-19 restrictions). Second, U2 who had no difficulty in walking, had a strong voice among the participants, and all the participants were often influenced by U2’s words. Another possible reason for the participants’ consensus on the shortest route is that the current method of displaying markers in two colors does not sufficiently influence the user’s route planning. By presenting users with a visualization method that highlights inaccessibility, it may be possible to interest users in routes that are easier to walk than using the current one.
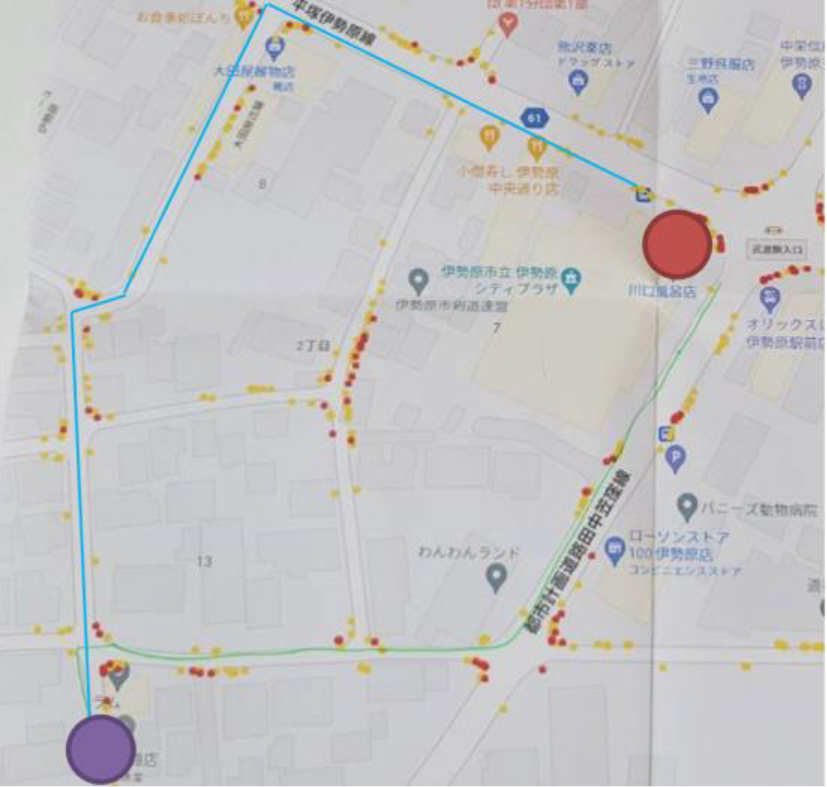
Figure 15.
Two routes on the map discussed by the participants in the thought study phase. (The green line is the shortest route, and the blue line is the most accessible route).
5.3Field study phase
5.3.1Task
In the next phase of the field study, we asked one of the participants U1 from the thought study phase (Table 5) to walk the route discussed in the thought study and comment on its difficulty. This phase was conducted a few days after the thought study. U1 was selected as the participant for this phase because he was vocal in the thought study and mentioned both the shortest and safest routes while planning the route. Because the participant was relatively old, he was accompanied by a staff member during the walk. Participant was asked to express their opinions about elements that made walking difficult if they noticed them during the walk, and the staff member who accompanied them recorded this information. In addition, U1 was asked to walk from the red marker in Fig. 15, using the green route as the outward route (shortest route) and the blue route (route with few markers) as the return route
5.3.2Results and considerations
At this phase, while choosing the shortest route, U1 commented “There is a hill,” and “The steps on the road bother me,” and stated that this route was difficult to walk because it was a main street. In contrast, the other route that the candidate suggested during the thought study phase by participants, was an old back street. It had a few points that caused difficulty in walking. However, during the walk on the route with few markers, the participant commented that they were not concerned about this area. After the walk, they expressed more positivity than they did for the shortest route on the outward journey, stating that contrary to their expectations, no points in the return route (the route with few markers) bothered them considerably. This suggested that the method presented may provide a route plan that is less inaccessible or rarely traversed by users. However, as mentioned, this user study could not fully evaluate the usefulness of the method as that can only be achieved by collecting large scale data on white cane usage and visualizing it on a map.
6.Limitations and future work
During the study, we found four areas with scope for improvement.
6.1Data collection
As mentioned in Section 4.2, our proposed method is assumed to visualize information based on the accumulation of large amounts of data. The current system discriminates locations that may be inaccessible from the white cane usage data of individual visually impaired people, but actually generating the proposed inaccessibility map requires a large amount of data. The visually impaired who will be the providers can collect data simply by wearing the sensor and going about their daily lives, so the burden of data collection on the visually impaired is expected to be small. Although it would take some time for a large amount of data to be collected, it would be easy to do. Thus, the cost of finally generating a map may be smaller than the cost of a municipality or other organization creating a dataset. In addition to the number of visually impaired people, a wide range of data must be collected by region to create inaccessibility maps If the visually impaired live near frequently visited facilities, such as train stations, hospitals, etc., they may walk more frequently. If data are collected and maps are generated only in the vicinity of such facilities rather than for an entire region, it may be possible to provide maps that meet the needs of users more rapidly. However, not all of the collected data will be visualized, to avoid the influence of excessive and unreliable information and individual differences among data givers, only locations where the information surpasses a given threshold will be included. This threshold will be defined and adjusted depending on the post data collection trends and the quantity of data available
6.2User evaluation
Second, evaluations must be conducted by sighted users using a systemgenerated inaccessibility map based on actual usage data. In the user study described in Section 5, the inaccessibility map used was a mock-up. Although it is difficult to collect a significant amount of data immediately (because it requires a long-term setup), the usefulness of the system can be further investigated by conducting an experiment in which an inaccessibility map is generated and evaluated by the system after the actual user data is collected. In addition, the mock-up maps in the user study (Fig. 13) should be compared to maps based on actual data to assess similarities and to review the findings from the user study. The number of participants in the user study was limited to six. Although most of them were elderly, there were also some participants with serious mobility problems, such as wheelchair and cane users. By including differentlysighted users who might be interested in the inaccessibility map, we believe that differences in the use and information required by each user attribute can be identified. This user evaluation also requires we identify which of the information that our inaccessibility map visualizes is useful or unnecessary for sighted people. After future data collection, it may be possible to visualize multiple inaccessibility from visually impaired people’s white cane usage data, but it is possible that some of the information may be misinterpreting to sighted people, making them feel it is superfluous. By identifying this information and eliminating it from the visualization, our method may be able to generate inaccessibility maps that are more useful to sighted people
6.3Improve accuracy of input system
Third, the detection function in the input part of this system can also be further investigated. First, the accuracy of discriminating changes in the left-to-right oscillation of the white cane using SVM is 60.3 %, which is insufficient and must be improved. Currently, the system is implemented based on the usage data of two individuals who participated in the observational study, and only this data, which is an insufficient dataset, was used in implementing the classifier. To investigate a discriminant function that can detect changes in the amount of time the cane is swung with higher accuracy, in the future, a considerable amount of white cane usage data must be collected. Such usage data must also be obtained to evaluate whether the classifier of this system can be robust to the influence of individual differences such as gender, age, and degree of visual impairment. Because the observation and analysis of the walking movements of visually impaired people only included two participants, similar observation and analysis should include a larger number and variety of visually impaired people (degree of visual impairment, congenital or acquired). Through such observation and analysis, the relationship between walking movements and inaccessibility will be further clarified and the detection items in the system will be re-examined.
The current system can visualize mainly the top-ranked information among the walking difficulties that older clear-sighted people want to know, shown in Table 4, which is the result of the survey described in Section 3.3, but the classifier is not sufficient to identify Braille blocks and dark areas. More analysis of data on the use of white canes and the walking movements of visually impaired people may be able to cover these information as well. If there is inaccessibility information required by the sighted people that cannot be detected from only data on the visually impaired, it may be necessary to consider using this information in conjunction with existing data sets and accessibility visualization methods.
The three characteristic behaviors that the current system can detect are not necessarily indicative of inaccessibility. Therefore, re-examining accessibility and walking behavior is required to define which determines accessibility and prevent unrelated information from being erroneously visualized. Moreover, by limiting the data to walking with a white cane on stairs, ramps, and braille blocks, which provides major information regarding accessibility, it may be possible in the future to visualize the current low level of accessibility and, on a map, show direct accessibility information such as where the stairs and ramps are located. Braille blocks are particularly important because they are an accessible element on which visually impaired people can walk but could be inaccessible for sighted people because they could stumble. To improve the accuracy requires an enormous amount of walking data from those who walk daily, However, collecting walking data from visually impaired people who walk only in places with poor accessibility, such as inclines, steps, stairs, ramps, and implementing a classifier from those data, may reduce the amount needed to achieve a high level of accuracy.
6.4Consideration of visualization method
Finally, it may be difficult for the current information presented by the system to have a significant influence on the user’s route planning and, therefore, the method of presentation should be considered. Our system uses place markers at the coordinates of locations considered to present walking difficulties, but as mentioned, there are multiple methods for accessibility visualization [42]. For visualization, these methods use official datasets provided by municipalities and other sources, but the cost of collecting this information is high. Conversely, the proposed method may incur less costs than existing methods because it can automatically collect data to visualize accessibility simply through sensors that are sufficiently light. We could also evaluate the cost of our method by recording how long it actually takes to acquire the accessibility data.
In addition, previous methods [42], instead of placing markers at specific map locations as does ours, visualize accessibility by dividing it into levels, or a certain range of levels using heat maps. Through a study comparing other accessibility visualization methods with our methods, more useful information can be presented to the user and could influence their route planning. A study by Manaswi et al. that evaluated diverse accessibility visualization methods from the perspectives of various stakeholders i.e., caregivers with high relationship values with people with disabilities [42]. They stated that they did not trust data without knowing who created it and that they trusted less granular information, such as information that was visualized in a pinpoint location rather than generalized to a certain range from multiple data sets. In comparison to these results, our user study found no mention of skepticism regarding the reliability of the information in the participants’ discussion. This may be due to our proposed method that visualizes accessibility in a pinpoint location, and the data source was clearly identified as information provided by visually impaired people, thus was fine-grained and the participants trusted it. This result confirms the findings of Manaswi et al. in their study and suggests that low granularity is important in accessibility visualization to gain user trust. In our future studies, we plan to expand the classification functionality of the white cane use data as described in Section 6.3. The aforementioned considerations suggest that future expansion of the functionality may further reduce the granularity of the information we present and thus greatly improve reliability for users.
By adding the information proposed in this study to the existing accessibility visualization maps [42], the map could contribute to more comfortable walking, and this also needs to be evaluated. In addition to considering visualization methods, importantly, the data set to be used for visualization in the map must also be considered. Accessibility varies at different times, such as weekdays and holidays, daytime and nighttime, when congestion and brightness differ. Therefore, by implementing a function that generates a map from all the accumulated data, and a map with conditions, such as daytime on holidays, more useful and appropriate information can be presented to the user. In addition, our method cannot collect information on paths that visually impaired people dislike and avoid. Otherwise expressed, important accessibility information may be whether or not a visually impaired person has walked the path. We have considered adding information in the future on whether or not a visually impaired person walked the path as part of the visualization information.
7.Conclusion
After three preliminary studies, we implemented a system that creates an inaccessibility map to support sighted people by using data from white cane usage patterns exhibited by the visually impaired. This system creates a scenario in which the visually impaired can support the sighted, which has rarely been explored in previous studies. In the survey and preliminary studies conducted before implementing the system, we found that visually impaired people’s perception of non-visual information is superior to that of sighted people. They perceive information based on how they use the white cane, which is difficult for sighted people. A user survey of elderly sighted people conducted after the system was implemented found that the inaccessibility map could help users understand where and why they have difficulty walking, and it also help them plan routes and walk comfortably. In the future, our system will collect actual data to improve its accuracy. Thereby, it would provide more useful accessibility information for users in comparison to existing methods. The use of existing methods in combination with existing data sets could also be considered.
Acknowledgments
We thank the staff of the Kanagawa School for the Blind of Japan, the users and staff of the community space in Isehara City Japan, the students at Tokyo City University, and others who participated in the surveys and studies.
Ethical considerations
The study was approved by the Ethical Review Committee for Research on Human Subjects of Tokyo City University (Approval No.: 2021-h07).
References
[1] | World Health Organization [homepage on the internet]. Blindness and vision important; 2022 [Cited 2023 April 15]. Available from: https://www.who.int/news-room/fact-sheets/detail/blindness-and-visual-impairment. |
[2] | Kayukawa S, Higuchi K, Guerreiro J, Morishima S, Sato Y, Kitani K, Asakawa C. BBeep: A Sonic Collision Avoidance System for Blind Travelers and Nearby Pedestrians. Proceedings of the 2019 CHI Conference on Human Factors in Computing Systems. (2019) ; 52: : pp. 1-12. |
[3] | Shilkrot R, Huber J, Ee WM, Maes P, Nanayakkara S. FingerReader: A Wearable Device to Explore Printed Text on The Go. Proceedings of the 2015 CHI Conference on Human Factors in Computing Systems. (2015) ; pp. 2363-2372. |
[4] | Feiz S, Masum BS, Ashok V, Shilkrot R, Ramakrishnan I. Towards Enabling Blind People to Independently Write on Print Forms. Proceedings of the 2019 CHI Conference on Human Factors in Computing Systems. (2019) ; 300: : 1-12. |
[5] | Abreu L, Cristina PA, Guerreiro T. TACTOPI: A Playful Approach to Promote Computational Thinking for Visually Impaired Children. Proceedings of the 16th international ACM SIGACCESS conference on Computers & accessibility. (2014) ; 82: : pp. 1-3. |
[6] | Vazquez M, Steinfeld A. Helping Visually Impaired Users Properly Aim a Camera. Proceedings of the 14th international ACM SIGACCESS conference on Computers & accessibility. (2012) ; pp. 95-102. |
[7] | Hasegawa R, Ichino J. Support by Visually Impaired: A Proposal for a System to Present Walkability on Maps Using White Cane Data. Collabtech. (2022) ; pp. 141-157. |
[8] | Kane SK, Frey B, Wobbrock JO. Access lens: a gesture-based screen reader for real-world documents. Proceedings of the 2013 CHI Conference on Human Factors in Computing Systems. (2013) ; pp. 347-350. |
[9] | Morris RM, Johnson J, Bennett LC, Cutrell E. Rich Representations of Visual Content for Screen Reader Users. Proceedings of the 2018 CHI Conference on Human Factors in Computing Systems. (2018) ; 59: : pp. 1-11. |
[10] | Tigwell WG, Gorman MB, Menzies R. Emoji Accessibility for Visually Impaired People. Proceedings of the 2020 CHI Conference on Human Factors in Computing Systems. (2020) ; pp. 1-14. |
[11] | Sporka JA, Nemec V, Slavik P. Tangible newspaper for the visually impaired users. Extended Abstracts on Human Factors in Computing Systems. (2005) ; pp. 1809-1812. |
[12] | Kim J, Lee Y, Seo I. Math Graphs for the Visually Impaired: Audio Presentation of Elements of Mathematical Graphs. Extended Abstracts of the 2019 CHI Conference on Human Factors in Computing Systems. (2019) ; SRC08: : pp 1-6. |
[13] | Plommer B, Crossan A, Brewster AS, Blagojevic R. Multimodal collaborative handwriting training for visually-impaired people. Proceedings of the SIGCHI Conference on Human Factors in Computing Systems. (2008) ; pp. 393-402. |
[14] | Chakraborty T, Khan AT, Islam AAMBA. FLight: A Low-Cost Reading and Writing System for Economically Less-Privileged Visually-Impaired People Exploiting Ink-based Braille System. Proceedings of the 2017 CHI Conference on Human Factors in Computing Systems. (2017) ; pp. 531-540. |
[15] | Ohshima H, Kobayashi M, Shimada S. Development of Blind Football Play-by-Play System for Visually Impaired Spectators: Tangible Sports. Proceedings of the 2021 CHI Conference on Human Factors in Computing Systems. (2021) ; 209: : pp. 1-6. |
[16] | Vazquez M, Steinfeld A. Helping Visually Impaired Users Properly Aim a Camera. Proceedings of the 14th international ACM SIGACCESS conference on Computers & accessibility. (2012) ; pp. 95-102. |
[17] | Payne CW, Yixuan XA, Ahmed F, Ye L, Hurst A. How Blind and Visually Impaired Composers, Producers, and Songwriters Leverage and Adapt Music Technology. Proceedings of the 22nd international ACM SIGACCESS conference on Computers & accessibility. (2020) ; 35: : pp. 1-12. |
[18] | Walia A, Goel P, Kairon V, Jain M. HapTech: Exploring Haptics in Gaming for Visually Impaired. Proceedings of the 2020 CHI Conference on Human Factors in Computing Systems. (2020) ; pp. 1-6. |
[19] | Zhao Y, Bennett LC, Benko H, Cutrell E, Holz C, Morris RM, Sinclair M. Enabling People with Visual Impairments to Navigate Virtual Reality with a Haptic and Auditory Cane Simulation. Proceedings of the 2018 CHI Conference on Human Factors in Computing Systems. (2018) ; 116: : 1-14. |
[20] | Merabet BL, Sanchez J. AudioBased Navigation Using Virtual Environments: Combining Technology and Neuroscience. Research and Practice in Visual Impairment and Blindness. (2009) ; 2: : pp. 128-137. |
[21] | Trewin S, Laff M, Hanson V, Cavender A. Exploring Visual and Motor Accessibility in Navigating a Virtual World. ACM Transactions on Accessible Computing. (2009) ; 2: (2): 11: : pp. 1-35. |
[22] | Microsoft [homepage on the internet]. Seeing AI; 2023 [Cited 2023 April 21]. Available from: https://www.microsoft.com/ja-jp/ai/seeing-ai. |
[23] | WeWALK [homepage on the internet]. WaWALK; 2020 [Cited 2023 April 21]. Available from: https://wewalk.io/en/. |
[24] | Amedia [homepage on the internet]. Smart cane SC1; 2022 [Cited 2023 April 21]. Available from: https://www.amedia.co.jp/product/walking/cane/white-cane/SC1.html. |
[25] | Alkhanfer AA, Ludi S. Visually Impaired Orientation Techniques in Unfamiliar Indoor Environments: A User Study. Proceedings of the 22nd international ACM SIGACCESS conference on Computers & accessibility. (2020) ; pp. 283-284. |
[26] | May RK, Tomlinson B, Ma X, Roberts P, Walker NB. Spotlights and Soundscapes: On the Design of Mixed Reality Auditory Environments for People with Visual Impairment. ACM Transaction on Accessible Computing. (2020) ; 13: (2): pp. 1-47. |
[27] | Pariti J, Tibdewal V, Oh T. Intelligent Mobility Cane – Lessons Learned from Evaluation of Obstacle Notification System using a Haptic Approach. Extended Abstracts of the 2020 CHI Conference on Human Factors in Computing Systems. (2020) ; pp. 1-8. |
[28] | Huang CH, Hsieh TC, Yeh HC. An Indoor Obstacle Detection System Using Depth Information and Region Growth. Sensors. (2015) ; 15: (10): pp. 27116-27141. |
[29] | Hub A, Diepstraten J, Ertl T. Design and development of an indoor navigation and object identifcation system for the blind. Proceedings of ACM SIGACCESS Accessibility and Computing. (2004) ; 77-78: : pp. 147-152. |
[30] | Nakajima M, Haruyama S. Indoor navigation system for visually impaired people using visible light communication and compensated geomagnetic sensing. Proceedings of the IEEE International Conference on Communications in China. (2012) ; pp. 524-529. |
[31] | Pham HH, Le LT, Vuillerme N. Real-time obstacle detection system in indoor environment for the visually impaired using Microsoft kinect sensor. Journal of Sensors. (2016) . |
[32] | Amemiya T, Yamashita J, Hirota K, Hirose M. Virtual leading blocks for the deaf-blind: A real-time way-finder by verbal-nonverbal hybrid interface and high-density RFID tag space. Proceedings of the IEEE Conference on Virtual Reality. (2004) ; pp. 165-287. |
[33] | Chumkamon S, Tuvaphanthaphiphat P, Keeratiwintakorn P. A blind navigation system using RFID for indoor environments. Proceedings of the IEEE International Conference on Electrical Engineering/Electronics, Computer, Telecommunications and Information Technology. (2008) ; 2: : pp. 765-768. |
[34] | Gerreiro J, Ahmetovic D, Kitani MK, Asakawa C. Virtual Navigation for Blind People: Building Sequential Representations of the Real-World. Proceedings of the 19th International ACM SIGACCESS Conference on Computers and Accessibility. (2017) ; pp. 280-289. |
[35] | Ito A. How do blind people see the world? 1st ed. Kobunsha Shinsyo; (2015) . |
[36] | DIALOGUE IN THE DARK [homepage on the [internet] DIALOGUE IN THE DARK 2023 [Cited 2023 April [15]. Available from: https://diddialogue.or.jp/. |
[37] | Anzai Y, Hirano T, Yamada S, Shiose T. Art Appreciation through Discussion with Visually Impaired. The Journal for the Association of Art Education. (2018) ; 39: : pp. 27-38. |
[38] | Bolten N, Caspi A. AccessMap Website Demonstration: Individualized, Accessible Pedestrian Trip Planning at Scale. Proceedings of the 21st International ACM SIGACCESS Conference on Computers and Accessibility. (2019) ; pp. 676-678. |
[39] | Wheelmap.org [homepage on the internet] Wheelmap [Cited 2023 April 15]. Available from: https://wheelmap.org/. |
[40] | Mabasheri A, Deister J, Dieterich H. Wheelmap: the wheelchair accessibility crowdsourcing platform. Open Geospatial Fata, Software and Standards. (2017) ; 2: (27). |
[41] | Walk Score [homepage on the internet]. Walk score [Cited 2023 April 15]. Available from: https://www.walkscore.com/. |
[42] | Saha M, Patil S, Cho E, Cheng YE, Horng C, Chauhan D, Kangas R, McGovern R, Li A, Heer J, Froehlich EJ. Visualizing Urban Accessibility: Investigating Multi-Stakeholder Perspectives through a Map-based Design Probe Study. Proceedings of the 2022 CHI Conference on Human Factors in Computing Systems. (2022) ; 413: : pp. 1-14. |
[43] | Saha M, Chauhan D, Patil S, Kangas R, Heer J, Froehlich EJ. Urban Accessibility as a Socio-Political Problem: A Multi-Stakeholder Analysis. Proceedings of the ACM on Human-Computer Interaction. (2021) ; 4: CSCW3: 209: : pp. 1-26. |
[44] | Prandi C, Barricelli RB, Mirri S, Fogli D. Accessible wayfinding and navigation: a systematic mapping study. Universal Access in the Information Society. (2023) ; 22: : pp. 181-212. |
[45] | Bolten N, Mukherjee S, Sipeeva V, Tanweer A, Caspi A. A pedestrian-centered data approach for equitable access to urban infrastructure environments. IBM Journal of Research and Development. (2017) ; 61: (6): pp. 101-10:12. |
[46] | Li A, Saha M, Gupta A, Froehlich EJ. Interactively Modeling and Visualizing Neighborhood Accessibility at Scale: An Initial Study of Washington DC. Proceedings of the 20th International ACM SIGACCESS Conference on Computers and Accessibility. (2018) ; pp. 444-446. |
[47] | Bolten N, Amini A, Hao Y, Ravichandran V, Stephens A, Caspi A. Urban sidewalks: visualization and routing for individuals with limited mobility. Proceedings of the 1st International ACM SIGSPATIAL Workshop on Smart Cities and Urban Analytics, UrbanGIS@SIGSPATIAL 2015; pp. 122-125. |
[48] | Barczyszyn LG, Camenar ODML, Nascimento DFDD, Kozievitch PN, Silva DDR, Almeida ADL, Santi DJ, Minetto R. A Collaborative System for Suitable Wheelchair Route Planning. ACM Transactions on Accessible Computing. (2018) ; 11: (3): 18: : pp. 1-26. |
[49] | Hara K, Chan C, Froehlich JE. The Design of Assistive Location-based Technologies for People with Ambulatory Disabilities: A Formative Study Proceedings of the 2016 CHI Conference on Human Factors in Computing Systems. (2016) ; pp. 1757-1768. |
[50] | Karimi HA, Zhang L, Benner JG. Personalized accessibility map (PAM): a novel assisted wayfinding approach for people with disabilities Annals of GIS 20. (2014) ; 2: : pp. 99-108. |
[51] | Katano Y. Shinteiban Zukai One Point Seirigaku. 1st ed. Saio Syuppan; (2017) . |
[52] | MONOWIRELESS [homepage on the internet]. TWELITE2525A; 2023 [Cited 2023 April 15]. Available from: https//mono-wireless.com/jp/products/TWE-Lite-2525A/index.html/. |
[53] | Card SK, Moran TP, Newell A. The Model Human Processor; An Engineering Model of Human Performance. Handbook of Perception and Performance. (1986) ; 11: : 45. |
[54] | Yamada Y. Hakujou Hokou Support Hand Book. 1st ed. Dokusyo koubo (2010) . |


