
The production of official agricultural statistics in 2040: What does the future hold?1
Abstract
Many National Statistical Offices are modernizing the systems and processes underpinning the production of official agricultural statistics. Moving data and processes to the cloud, collecting survey data via the web, automating editing and imputation, incorporating more administrative, remotely sensed and other non-survey data in the estimation process, and more flexible dissemination of information are only some of the areas of current efforts. Although specific modernization efforts have been described, less discussion has been focused on exactly what the future of official agricultural statistics will be. During the 9th International Conference on Agricultural Statistics, which was held May 17–19, 2023, at the World Bank in Washington DC USA, four statistical leaders with diverse perspectives envision the not-too-distant future of official agricultural statistics in 2040.
1.Introduction
The International Conference on Agricultural Statistics (ICAS) is held every three years in various countries around the world. The 9th ICAS was held May 17–19, 2023, at the World Bank in Washington DC USA. Modernization of all aspects of official statistics, from data collection through data dissemination, was a common thread throughout the conference. During the plenary session ” The Production of Agricultural Statistics in 2040: What Does the Future Hold?”, conference attendees were asked to pause amidst the flurry of activity surrounding the modernization efforts and to focus on the vision of what official agricultural statistics will be in 2040. Four statistical leaders with diverse perspectives provided insights into their vision of what the future holds. Their presentations provided an exciting glimpse into the future of official agricultural statistics in the not-too-distant future of 2040. In this paper, highlights from each speaker will be presented.
2.Mexico’s National Institute of Statistics and Geography
Dr. Graciela Márquez, President of Mexico’s National Institute of Statistics and Geography (INEGI), began the session by providing background on the Mexico Census of Agriculture, Livestock and Forestry. The first Census was conducted in 1930 and subsequent ones were carried out with a 10-year cadence in 1940, 1950, 1960, 1970, 1981, and 1991. Then, after a gap of 16 years, the 2007 Census was conducted. To provide timely statistics in support of Mexican agriculture between censuses, the National Agricultural Survey was conducted first in 2012 and again in 2014 and 2017. In 2022, the Chamber of Deputies approved the 2022 Agricultural Census with a total budget of MX$2.7 billion (US$135 million). The primary objectives were to produce official statistics on economic, technological, environmental and social characteristics of Mexico’s agricultural and forestry production units. An initial release of census results occurred shortly after Dr. Márquez’s presentation with the full release on November 30, 2023. With the data collection complete, an early preview of the data collection activities for the 2022 census and the objectives for the next census were highlighted.
Through extensive efforts, in the design phase of the 2022 Agricultural Census, INEGI identified and mapped all of the approximately 9.3 million land plots units in Mexico; 7.3 million of these plots had agricultural and livestock activities. The land plots were used to identify the 4.6 million agricultural, forestry and livestock land units22 in Mexico, whose information was collected. About 104,000 of the 4.6 million agricultural land units were large, and the remaining 4.5 million were small or medium in size.33
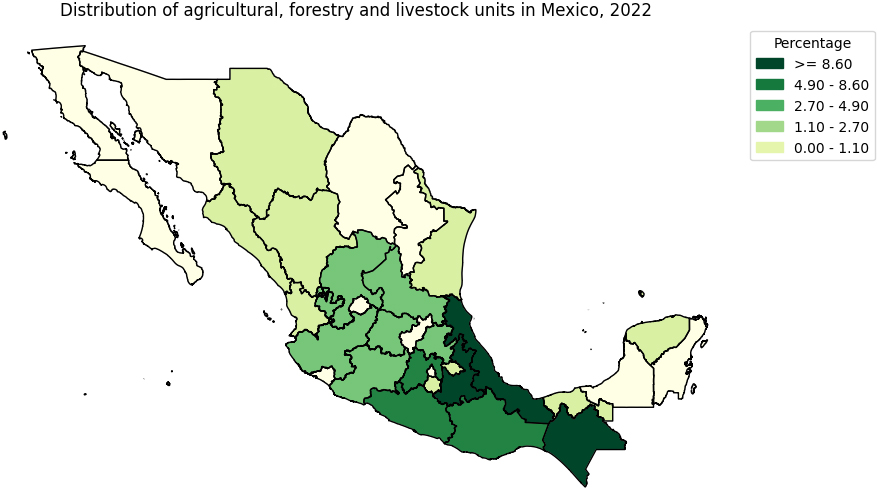
In terms of the regional distribution, almost half of the active units (49.2%) are concentrated in the south of the country, while in the north there is just around 5.5 percent. Figure 1 shows the percentage of the active units located in each one of the 32 states in Mexico.
Figure 1.
Distribution of agricultural, forestry and livestock units in Mexico, 2022. Source: INEGI, 2022 Agricultural Census.
When modernizing data collection processes, National Statistical Offices (NSOs) worldwide are striving to move away from mail, telephone, and in-person interviews to web-based data collection. This requires both access to the internet, which is often lacking in rural communities, and the literacy of those being surveyed. In 2023, 56% of Mexico’s rural population had access to the internet and 89% were literate. By 2040, a goal is to have internet accessible to all Mexicans and to ensure that all are literate.
For the 2022 Agricultural Census, producers of large agricultural units had the option to respond to an extended version of the questionnaire online. To collect data through in-person interviews, around 16,000 interviewers were given mobile computing devices with digitized cartography and preloaded questionnaires and catalogs. The interviewers, who were spread across Mexico, visited each agricultural, livestock and forestry land unit to collect the Census information. By 2040, the goal is to have web-based survey and census forms available for all units, reducing the need to conduct in-person interviews to only a few units.
INEGI has worked diligently to incorporate satellite imagery in its data collection processes for several years. For the 2022 Agricultural Census, land units with open field cultivation could be identified via satellite, but agricultural operations using controlled environments were not captured. By 2040, all agricultural land units should be identified using remotely sensed data. However, INEGI plans to do more than simply identify areas of agriculture. Verifying the crops being grown or the livestock within a land unit and assessing the impact of climate change are two additional uses that should be realized by 2040.
Administrative data can be a rich source of information, which may reduce the respondent burden on producers. INEGI is currently able to identify large agricultural producers using directories that also report location, size, and economic activity. By 2040, it plans to have directories for all producers regardless of the size of their plot. In addition, INEGI has developed HECRA, a tool that can be used to assess the quality of administrative data when evaluating their use in the production of official statistics. In 2023, HECRA was used as a diagnostic tool for the census and surveys. By 2040, INEGI plans to incorporate all available data into the production of official statistics.
In terms of the dissemination of information gathered through a census, for the 2022 Agricultural Census INEGI has released monographs, infographics, and digital maps, and has provided users with an interactive web platform. By 2040, INEGI visualizes providing information tailored to the interests of the individual users. Thus, the 2040 vision for Mexico’s agricultural statistics production includes all phases of the production process, from construction of the survey instruments to the increasing use of technology for data collection, to incorporating data collected from diverse sources to dissemination.
3.United States Department of Agriculture’s Economic Research Service
Dr. Spiro Stefanou, Administrator of the United States Department of Agriculture (USDA) Economic Research Service (ERS), began with a brief history, describing three waves of activity exploring the relationships among data, economics, and policy [1]. The first wave of activity was primarily observational in nature. The emphasis was the development of economic theory that could inform policy. Data to confirm or refute the theory tended to be scarce. Yet, the economic theory had a high impact on policy.
The second wave of activity began with the emergence of official statistics, which was enabled by the development of powerful computational machines. Production of official statistics has historically relied on surveys. Creation of the survey instrument, data collection, quality assurance, analysis, and dissemination all require time. Thus, there is a lag between initiation of the survey process and the release of the official statistics, and this lag often depends on the type of statistics being generated. For example, a monthly survey tends to have a shorter lag time than a national census, which is commonly conducted every 5 or 10 years. The development of economic theory that is informed by official statistics requires additional time once the statistics are available. This approach of using statistics as the foundation for economic analyses that then inform public policy often works well for routine needs, such as the acreages (hectares) planted to various crops. However, for new or emerging needs, such as the impact of the COVID-19 pandemic on aspects of the population’s health, industrial production, and agricultural production, the time lag is too long. Policy makers may be unwilling or unable to wait for the solid analyses, leading them to move forward with incomplete information.
The third wave, which is occurring now, focuses on the use of survey and non-survey data, such as administrative and remotely sensed data, to produce official statistics. Much of the non-survey data are observed at a high frequency and have a fine spatial resolution. The challenge has now become to produce timely economic analyses founded on official statistics, recognizing the difficulty of producing meaningful information based on all available survey and non-survey data.
NSOs are increasingly managing a trilemma. The public is demanding more access to data and statistics at finer temporal and geographical scales and more transparency into how the data are acquired and the statistics produced. At the same time, concerns about protecting the confidentiality of the data, especially after integrating data from several sources, are being expressed. Presently, the NSOs design data collection, curation, assembly, packaging, and release. Calls are being made to democratize the data through transparency and access to promote data and evidence-based policy making.
The needs for data, official statistics, and economic analyses are growing, and NSOs must address numerous policy imperatives between now and 2040. As an illustration, the World’s population is approaching 10 billion people. To provide for this many people, nations need to ensure food and nutritional security, a resilient food supply chain, and sustainable agricultural productivity growth, while controlling any negative impact on environmental assets. These challenges are arising during a time of climate change pressures and income inequality. Agricultural innovation can lead to the conservation of resources. But, what will be the impact of future pandemics, emergent environmental crises, and conflicts? To be successful on a global scale, the future focus must be on moving away from Pillars to a System of Interdependencies.
A 4th wave of activity is needed to meet the policy imperatives between now and 2040. Data are the foundation for evidence building. Real time monitoring of emerging issues, such as extreme weather events, risk management mitigation and the state of environmental assets and ecosystems, is increasingly available and allows trends to be anticipated. Food supply forecasting is an essential component of providing food security to the world’s increasing population. For these efforts to be successful, internationally accepted common indicators need to be designed and collected. Currently, official statistics paint one picture but, to address these large issues, more detail is needed. As an example, the heterogeneity of impacts on equity need to be more fully captured.
Who provides these data? Official statistics will continue to be needed, but they may be increasingly from private sources. Whether public or private sources release official statistics should depend on who is better at communicating value to data providers and users. Is there value in socially provided data and, if so, how should that value can be gathered. Further, what incentivizes private data providers to share their data? The quality of real-time data sources varies and should be evaluated. High-frequency data are generally more useful for identifying turning points than levels. And, the bias of data providers can be reflected in the data. Using data to target policy requires a nuanced approach.
In summary, NSOs are built on the trust and integrity of the processes used to produce official statistics, and this trust and integrity are foundational to the value of the statistics. Those working for and with NSOs need to act as model citizens. The work and products of the NSOs provide a national perspective. To retain or increase the resources needed to do their work, NSOs must show value to appropriators and the public. They must continue to be or become more relevant by getting the numbers right and released within the timeframe needed to form policy and meet other data users’ needs.
4.Statistics Poland
Dr. Dominik A. Rozkrut, President of Statistics Poland, began by noting global megatrends and challenges. Key resources, such as land and water, are increasingly scarce. To feed the world’s growing population, food production must nearly double between 2005 and 2050 [2]. Seventy percent of the world’s population will be urban by 2050. Hunger, poverty, and inequality abound and are increasing challenges in many parts of the world. Global health is a major concern.
The future of agricultural statistics depends on the future of agriculture. Today’s unprecedented advances in scientific research and technology are leading to a wide range of innovations and disruptive technologies and enhancing agricultural resource use efficiency and productivity. Together these have resulted in the current digital agriculture revolution.
With the agricultural revolution, numerous new technologies that improve food safety, reduce food waste, and optimize the use of fertilizer and herbicide, are moving rapidly into agricultural practice [3]. As examples, biotechnology applications, especially genomics and gene editing, are leading to improved crop cultivars and livestock lines. Precision agriculture enables producers to optimize processes, such as targeted applications of fertilizers and pesticides, maximizing production at reduced costs and impacts on the environment. The diversity of agricultural operations is increasing as reflected in the broader applications of hydroponics, aquaponics, vertical farming, indoor farming, controlled-environment agriculture, and urban agriculture. Further, alternative protein research may lead to an abundance of cell-cultured meat, which would substantially reduce the impact of meat production on climate change.
New tools that allow more information to be gathered during a crop growing system are being created and tailored for agriculture. Agricultural drones and satellite imaging can give insights into the health of the crop within and across fields. Soil sensing systems allow soil moisture, salinity, temperature, and other soil characteristics to be continually monitored. Crop biomass is a primary indicator of potential crop yield. Biomass sensors allow the rapid, accurate, and nondestructive monitoring of biomass, which can inform precision agriculture. Yield monitoring systems enable producers to map the yield within a field, which provides insights into areas that may need more inputs to increase future yield. In addition, robotics and other automation efforts are reducing the manual labor required in production agriculture.
Digitalization is rapidly being adopted in agriculture and agricultural statistics [4]. A strong network infrastructure, which is often lacking in rural areas, is required for this effort to be effective. Assuming a good network infrastructure, the internet can be used to control things, which is referred to as the Internet of Things (IoT). Robotics can be used to harvest crops and perform other tasks. Digital supply chains leverage digital technologies and data analytics to guide decision making, optimize performance and rapidly respond to changing conditions. By employing blockchain, producers use embedded and remote sensors to measure growing conditions, including temperature, humidity, and soil health, for their crops in real time. Producers receive valuable insights about their operations through smart connected technologies, which can collect and analyze large amounts of data. Artificial intelligence (AI) methods are an integral part of these digitalization efforts.
Various technology platforms, such as the IoT, Bonjour/Thread/Matter protocol equivalents, blockchain, and data mesh, are available. Data mesh is a new architectural paradigm representing the next generation of data architecture that is capable of handling the increasing agricultural data being generated over time. Data mesh aims to address the challenges of traditional data architecture, decentralizing data ownership and management. This emerging technology is secure, resilient, and scalable.
A data mesh enables the discovery, sharing, and use of data across multiple platforms from any device. Multiple databases can be connected so that data can be shared when needed. Data are stored and processed in a distributed system. A data mesh provides greater control over the quality of the data and offers improved transparency. It is an enabling technology that makes exploration and experimentation with new data sources easier. Data sharing is automated through so-called microservices.
Microservices are small, self-contained applications that operate through APIs and can be deployed independently. Each microservice is built around a specific function, such as preprocessing or producing micro-aggregates. They provide unlimited opportunities for varying approaches and designs.
Data mesh architecture can significantly enhance the production of statistics on agriculture by leveraging its decentralized, domain-oriented approach. Different domains such as crop production, livestock management, and supply chain logistics can own and manage their data. Each domain treats its data as a product, ensuring it is well-curated, high-quality, and easily accessible. This means that statistics on milk production, cattle health, or crop yields are managed by domain experts who understand the data deeply. Stakeholders such as farmers and statisticians can access and analyze data independently. They can generate statistics relevant to their needs without waiting for centralized data teams to provide them.
Data governance is a key requirement for sharing agricultural data. Clear guidelines and processes for data management are needed. Data ownership and parties accountable for data must be specified. Data quality standards must be established. Metadata standards need to be developed and the metadata effectively managed. Increasingly data governance comes in the form of legal and regulatory requirements. And, it needs to explicitly include special privileges for official statistics. Access to privately-held data is an important issue. Fundamental principles should be followed, keeping the common/public good at the core. For example, advanced privacy-protecting practices are essential.
A United Nations Working Group on Data Stewardship has been established (https://unstats.un.org/unsd/ statcom/groups/Data_Stewardship). NSOs serve as data stewards responsible for ensuring that the necessary data are accurate, complete, and up-to-date and that the data are managed in accordance with governance policies and standards. This is precisely the role needed within a decentralized approach to data management, of which a data mesh architecture is a modern example, that enables the performance of cross-domain, cross-platform data analysis that is often beyond the immediate scope by providing high-quality data that satisfies the needs of different users. As the technologies progress, this may not be called mesh architecture; however, a need for a scalable and flexible architecture that allows for the efficient use of data across tools, devices, machines, and organizations will persist. Data stewardship is essential in any system where data quality, compliance, privacy, and usage are important.
Figure 2.
Comparison of plot measurement based on GPS, compass-and-rope and farmer’s self-reporting. Source: Carletto et al. [5].
![Comparison of plot measurement based on GPS, compass-and-rope and farmer’s self-reporting. Source: Carletto et al. [5].](https://content.iospress.com:443/media/sji/2024/40-2/sji-40-2-sji240043/sji-40-sji240043-g002.jpg)
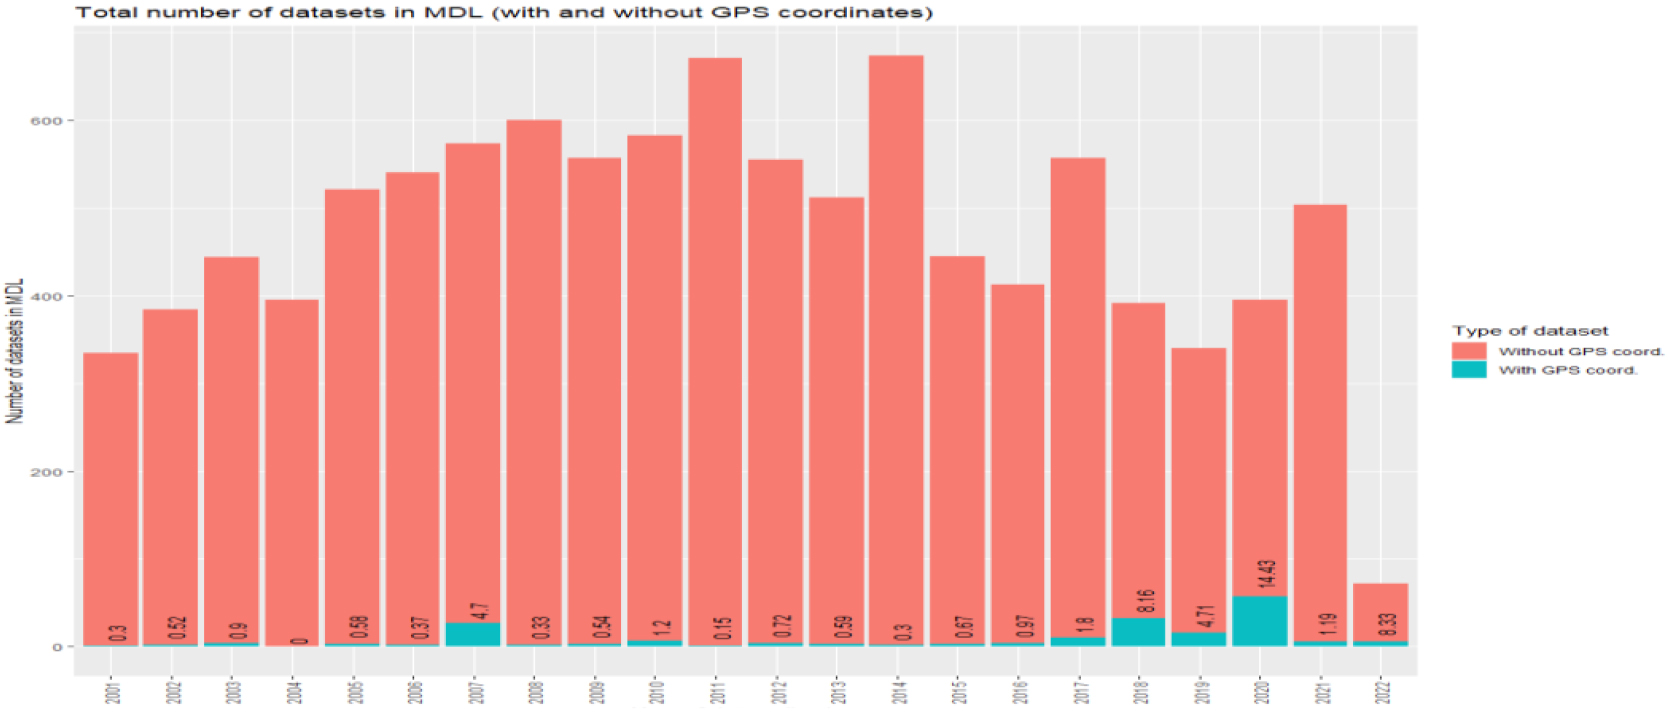
Figure 3.
Proportions of datasets with and without GPS coordinates; University of Toronto Map and Data Library (MDL).
Finally, noting that imperfect information leads to problems, Dr. Rozkrut identified some fundamental principles of official statistics: address problems not data, build an information infrastructure, and blend information from multiple sources. Regardless of technological progress in agriculture and statistics, these issues of a quintessential and holistic nature will continue to be fundamentally important.
5.The future is here – Just not for everyone
Dr. Gero Carletto, Senior Manager of the World Bank’s Development Data Group, focused on the challenges of making the advances in the production of agricultural statistics being realized by the broad-based modernization efforts and the new data sources potentially available to everyone. The COVID-19 pandemic was a great innovator, but not a great equalizer. That is, nature has provided wonderful opportunities to innovate, but the gulf between those who are driving innovation and those who are not may be widening. Leveling the playing field requires the systematic transfer of already acquired knowledge from high income to low income countries, from private to public developers, and from non-official to official statistical processes. Further, technical and institutional solutions are needed to integrate different data sources at scale to achieve the desired levels of temporal and spatial granularity.
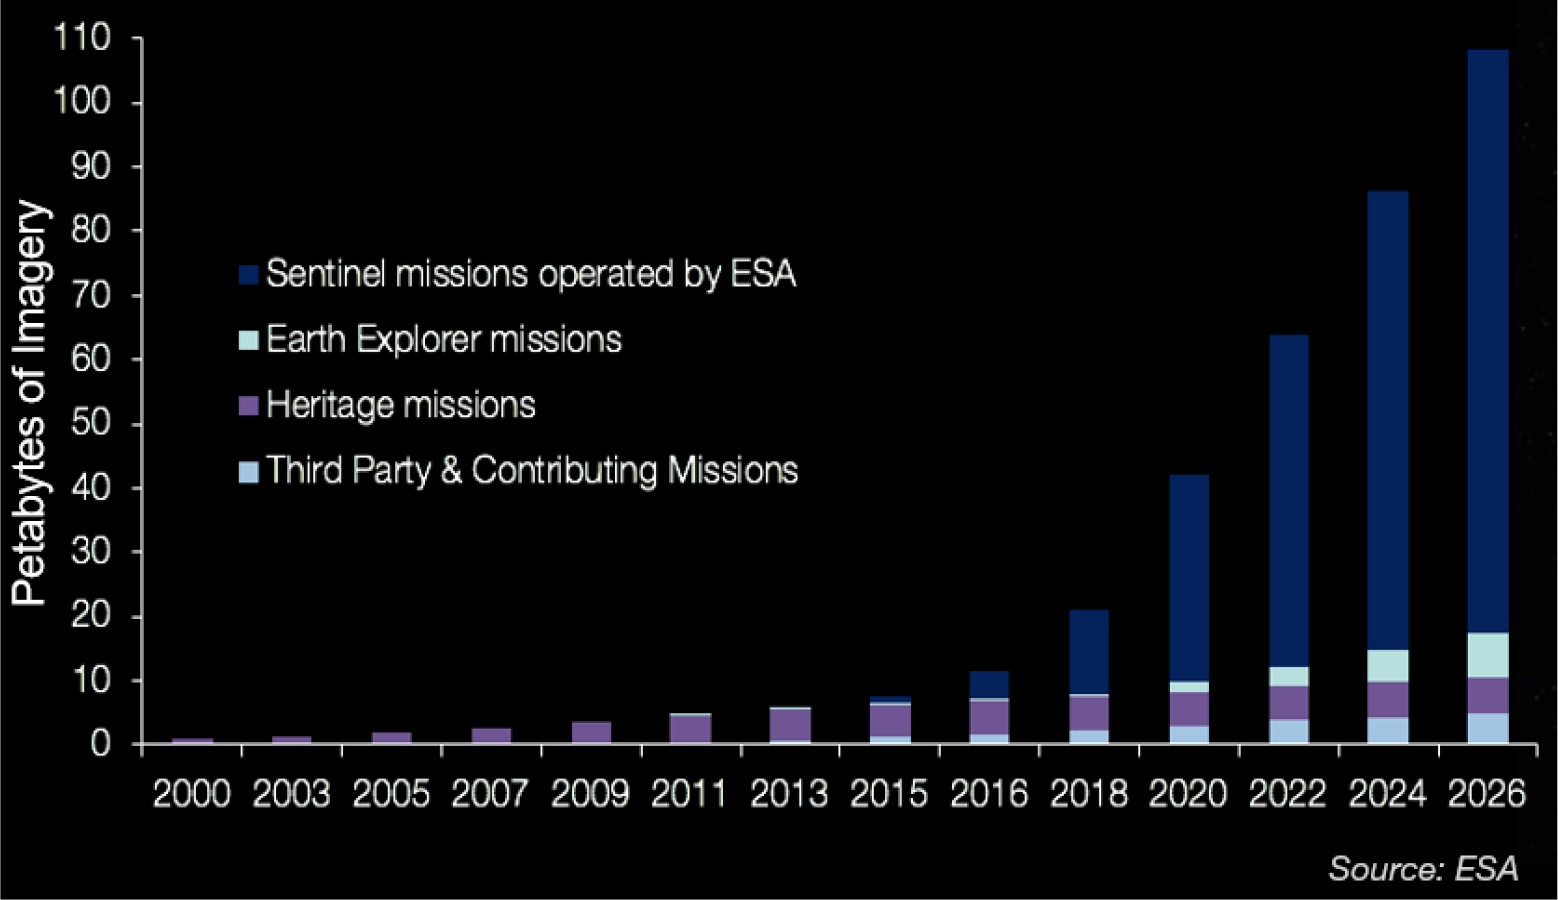
Figure 4.
Current and planned availability of high-resolution satellite imagery.
Technology to change the way survey data are collected, such as using tablets for in-person interviews (CAPI), or mobile phones for high-frequency surveys (CATI) or allowing respondents to report information in a web questionnaire (CAWI), has been available for some time. The impact on data quality is overwhelmingly evident. Although the adoption of these new approaches has been the standard for quite some time in high-income countries, it is still not as widespread in lower-income countries. As an example, a Global Positioning System (GPS) was initiated in 1973 (Satellite Navigation – Global Positioning System (GPS) | Federal Aviation Administration (faa.gov)), but geo-location and GPS measurement in surveys in low-income countries is still not the norm. For instance, when measuring land, studies have compared self-reported and GPS measurements of plot sizes to the gold standard of using a compass and rope. The GPS-derived measurements are highly accurate while farmers’ self-reported information have systematic bias associated with them (see Fig. 2 for an example). Yet, relatively few agricultural surveys still rely on GPS coordinates (see Fig. 3).
As another example of the potential to leverage GIS capability and paradata for quality assurance, the World Bank developed Survey Solutions (Survey Solutions (mysurvey.solutions)), a freely available platform to support survey design and facilitate data collection using tablets offline (CAPI), online web-interface (CAWI), phone interviews (CATI), or mixed modes. Interviewers can be guided to the interview locations using high resolution satellite images and built-in GPS receivers. Survey progress can be monitored in real time through the analysis of rich paradata, and responses can be validated using survey-specific data validation algorithms developed by the users. Further scaling up the use of Survey Solution or similar platforms would greatly improve data quality and timeliness.
Also, the availability of high-resolution satellite imagery continues to surge (see Fig. 4). By combining satellite and ground truth training data, machine learning can be used to produce improved methods for classifying crops and estimating yields of those crops. However, commensurate investments in ground-data for the calibration of remote-sensing models still falls short of ideal.
Dr. Carletto completed his presentation by sharing his “Christmas list”: scale up the adoption of GPS and other digital tools for better measurement; greater interoperability by design to facilitate better data integration; more and better individual-level data; improved access to administrative data and agriculture censuses; and, finally, a more equitable diffusion and adoption of new data sources, tools and technological innovations.
6.Conclusion
Many NSOs are modernizing the systems and processes underpinning the production of official agricultural statistics. All four speakers discussed advances and challenges in the modernization effort, which is impacting all phases of the production process. Modernization will impact data providers (agricultural producers and businesses) and data users. Surveys will be needed in many cases, but not in all. When needed, data providers will be able to report their information in a variety of digital formats; other forms of data collection, such as mail and in-person interviews, will be used little, if at all. Survey data will increasingly be integrated with non-survey data to produce estimates. When surveys are not conducted, identifying non-survey data that can produce quality statistics is of paramount importance. Establishing standards and processes that ensure the quality and comparability of the official statistics over time is essential. Modeling will likely play an increasing role. Dissemination of official statistics will allow data users to readily gather the information of interest. Many of these processes will rely on a cloud environment.
The transition from the reality of today to the envisioned state in 2040 requires an influx of resources. Within a country, the availability of needed modernization funds may be erratic, which can lead to delays or even the suspension of modernization efforts in one or more areas. And, the access to funding varies greatly across countries. For all, an on-going challenge is to evolve to new processes while still meeting today’s production demands. Thus, the path to realizing the stated objectives is a risky one. However, these four leaders have provided a collectively wonderful vision for 2040 to which all can aspire.
Notes
2 A unit is one or more land plots managed by the same producer and with the same production elements, such as equipment, machinery, vehicles, and labor, in the same municipality.
3 Results of the 2022 Agricultural Census, published on the 21st of November 2023.
Acknowledgments
The findings and conclusions in this article are those of the authors and should not be construed to represent any agency determination or policy. They have not been formally disseminated by the US Department of Agriculture.
References
[1] | “Enter third-wave economics: How the pandemic reshaped the dismal science.” (2021) October 23. The Economist. |
[2] | FAO. 2018. The future of food and agriculture – Alternative pathways to 2050. Summary version. Rome. 60 pp. Licence: CC BY-NC-SA 3.0 IGO. https://openknowledge.fao.org/server/api/core/bitstreams/2c6bd7b4-181e-4117-a90d-32a1bda8b27c/content. |
[3] | Asseng S, Palm CA, Anderson JL, Fresco L, Sanchez PA, Asche F, Garlock TM, Fanzo J, Smith MD, Knapp G, Jarvis A. Implications of new technologies for future food supply systems. The Journal of Agricultural Science. (2021) ; 159: (5-6): 315-319. doi: 10.1017/S0021859621000836. |
[4] | McFadden J, Griffin T. The Digitalisation of Agriculture: A Literature Review and Emerging Policy Issues (Paris: Organisation for Economic Co-operation and Development, 2022); Michael Tsan, Swetha Totapally, Michael Hailu, and Benjamin K. Addom. The Digitalisation of African Agriculture Report 2018–2019. https://www.oecd.org/publications/the-digitalisation-of-agriculture-285cc27d-en.htm#. |
[5] | Carletto, Calogero, Gourlay, Sydney, Murray, Siobhan, Zezza, Alberto. (2016) . Land Area Measurement in Household Surveys: Empirical Evidence and Practical Guidance for Effective Data Collection (English). LSMS Guidebook Washington, D.C.: World Bank Group. http://documents.worldbank.org/curated/en/606691587036985925/Land-Area-Measurement-in-Household-Surveys-Empirical-Evidence-and-Practical-Guidance-for-Effective-Data-Collection. |


