
More efficient use of household consumption and expenditure surveys (HCES) to inform food security1
Abstract
Household Consumption and Expenditure Surveys (HCES) collect comprehensive information on households’ consumption and can provide a range of analyses on access to food. They are key to estimating poverty (SDG 1.2.1) and Prevalence of Undernourishment (SDG 2.1.1).
Before the food data becomes meaningful for analysis, it needs extensive preparation. While NSOs are responsible for poverty statistics and typically prepare the data for this purpose, it is often organizations or researchers that use the data for food security. Although the preparation of the data for these two purposes has a lot in common, they rely on different traditions and guidelines.
This paper presents results from an ongoing project that aims to bridge the gap between these two processes. The project’s goal is that NSOs take the lead in preparing the HCES food data for all uses. An expected result is that the food security statistics will be available at the same time as the other main outputs from the survey and can be used for planning for improved food security. The project includes preparing a guideline for NSOs and others (endorsed by the United Nations’ Statistical Commission in 2024), building capacity in NSOs, and using results in a regional context.
1.Introduction
Statistics Norway has, over the last decade, been working together with other National Statistical Offices and international organisations to build capacity for undertaking and producing statistics from Household Consumption and Expenditure Surveys (HCES). One important focus has been on using the data for poverty and food security analysis.
Through this work, it became clear that the welfare and food security statistics are often not prepared in a joint cleaning and preparation of the data collected in the food consumption modules of HCESs. It became clear that joint processing for all the main users of the data would be more efficient, could provide better quality data, and could ensure the timely production of important food security statistics.
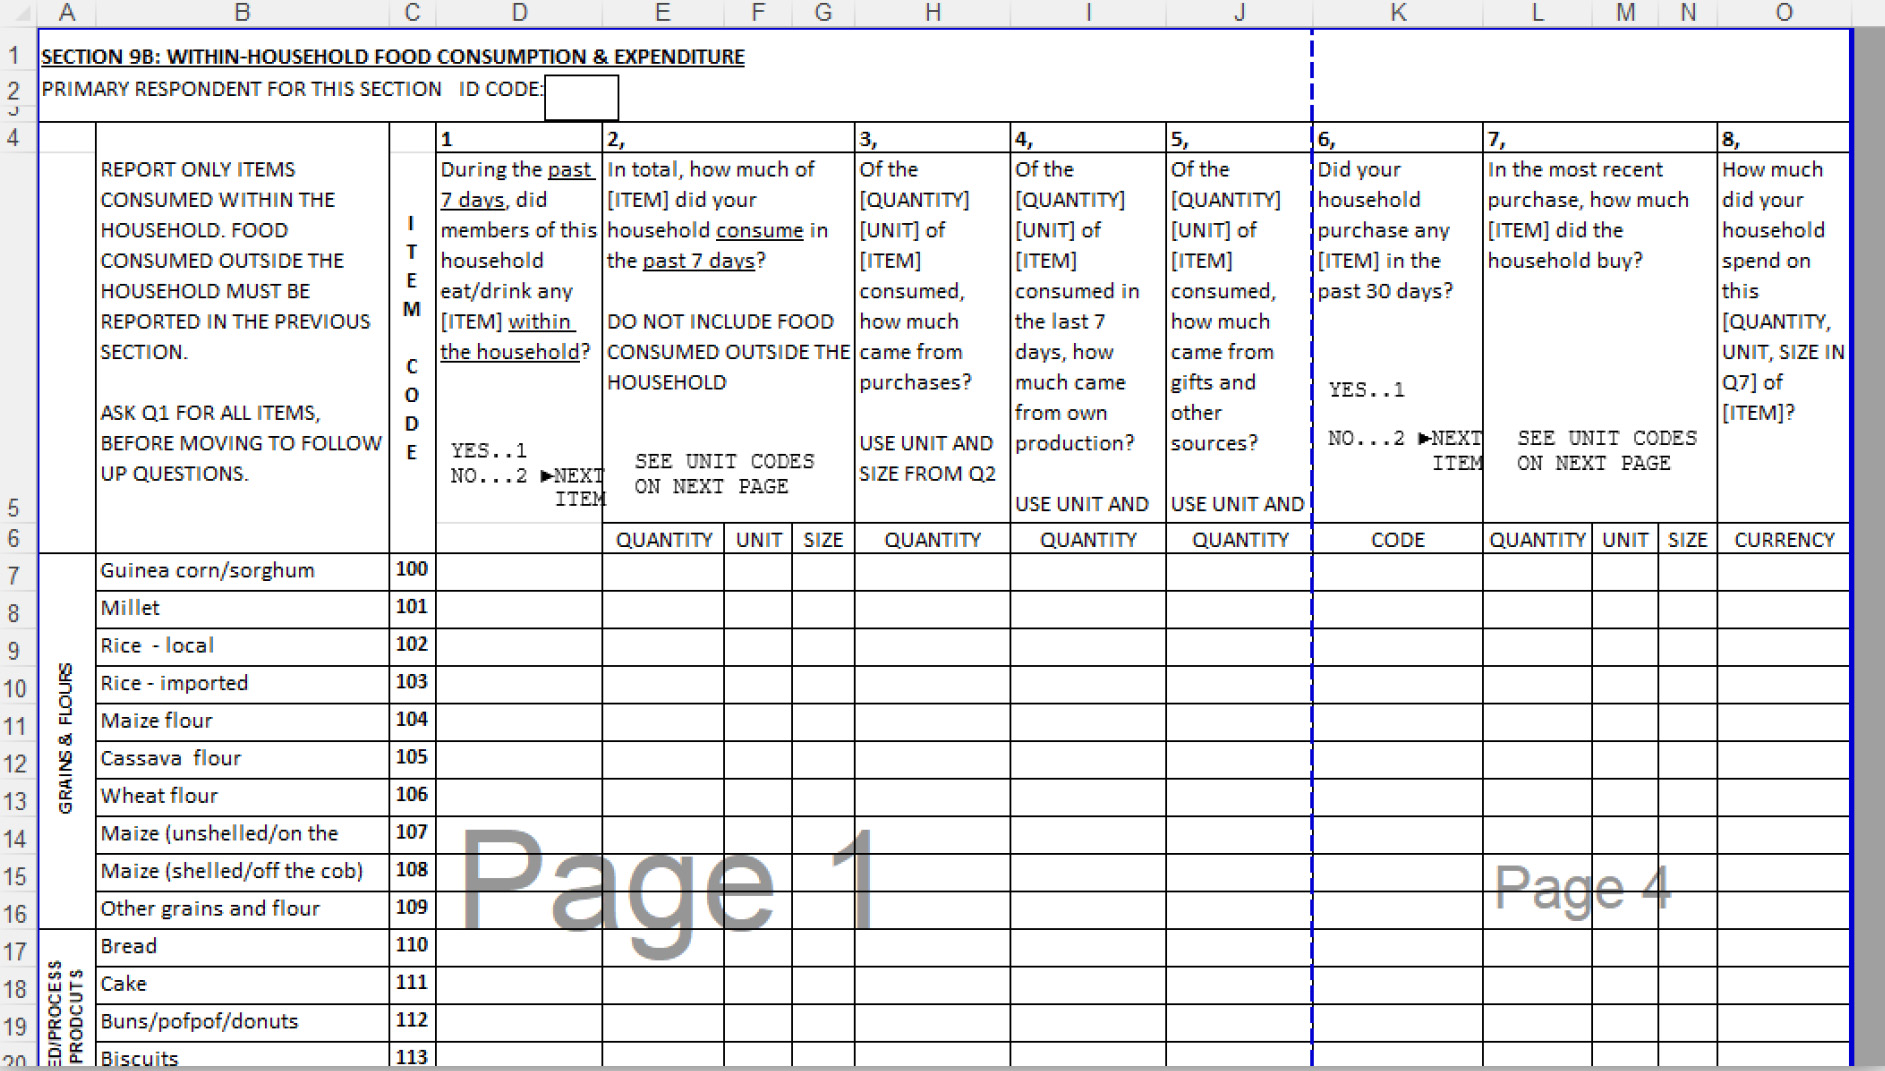
Figure 1.
First page in a module collecting food data.
This paper presents results from an ongoing project that involves the production of a processing guideline under the United Nations Committee of Experts on Agriculture, Food Security, and Rural Statistics (UN-CEAG) and capacity building workshops together with the Common Market for Eastern and Southern Africa (COMESA). The project aims to bridge the gap between the two rounds of cleaning and processing the data. The project’s goal is that NSOs take the lead in preparing the HCES food data for food security analyses, following the guidelines that have been developed and that were presented to and endorsed by the United Nations Statistics Commission in March 2024. The overarching goal is to increase the use of food data already collected for the purpose of improving food security. The following will describe the rationale behind the project and present conclusions so far.
The next chapter mentions some main points about HCES surveys, followed by a bit of background on the project. Chapter four presents the work on the guidelines. Chapter five presents the capacity building project with staff from NSOs in COMESA member countries. Chapter six is about interlinkages between these two activities. The seventh chapter points out how the activities can improve the quality of the statistics produced according to the UN National Quality Assurance Framework. This is followed by some examples of statistics produced by the participating countries in chapter eight, before presenting the conclusions in the last chapter.
2.Household consumption and expenditure surveys (HCES) and their potential for food security statistics
Household Consumption and Expenditure Surveys (HCES) have different names in different countries. It also varies what information they collect, but common to all is that they collect comprehensive information on households’ consumption and expenditure. They are resource-demanding nationwide surveys, typically conducted every three to five years. They are often representative at the first and second administrative levels, serving as cornerstone data sources in most national statistical systems. The HCES are used to estimate consumer price index baskets and to model consumption in national accounts. It is also used to measure monetary poverty and a range of other interesting analyses and research.
This paper focuses on the food data collected in HCES. The food consumption module may be designed differently across countries, but its objective remains consistent: to report on all foods acquired and consumed in the household, from purchase, own production, gifts, and other sources, as well as food consumed away from the household.
Although not originally designed for reporting on food security, there has been increased attention to the potential of HCES data for this purpose. This is evidenced by the UNSC’s endorsement of guidelines on how to collect food data in HCES in 2018. These guidelines were developed under the aegis of the Inter-Agency Expert Group on Food Security, Agricultural and Rural Statistics (IAEG-AG). They encompass research findings followed by recommendations on how to better capture food consumption, both in monetary value and quantity. The guidelines can be found here [1].
Figure 1 shows an example of the first page of an HCES module capturing food consumption. It is taken from the World Bank LSMS guidebook “Capturing What Matters” [2] and is following the recommendations given by the IAEG-AG guidelines endorsed by UNSC in 2018 [1].
The HCES does not capture how food is distributed among the members within the households, but it provides rich information on the amount of food accessed by the whole household, disaggregated into individual food items. Researchers, nutritionists, and food security agencies use it to serve their various interests. It is important in estimating the Prevalence of Undernourishment (PoU), which is an indicator under SDG 2.
Poverty statistics, consumer price baskets, and input to the national accounts are typically provided by the NSO. Simply put, the primary focus in these analyses is on the monetary value of food consumption, while the food security analyses are primarily focused on food quantities. Preparation and analysis of food security statistics from HCES surveys are often not undertaken by the NSO but by others, and thus, they are done when the data is made publicly available. Consequently, processing the food data is often done more than once. This processing is a demanding task, involving extensive checking and cleaning, and there are several choices made depending on the approach to be taken in this work. Rather than taking advantage of synergies in jointly processing the data for all purposes, a new analyst aiming at deriving food quantity data after the food monetary values have been checked and cleaned has to start from scratch.
The advantages of processing the data for both poverty and food security simultaneously are, firstly, that it is much more efficient and fewer resources are spent in a joint processing of the food data for all purposes. Secondly, the quality and consistency of the data are likely to improve as the data undergoes more extensive cross-checking. Thirdly, timeliness can be improved as food security statistics can be available immediately when the data is ready.
In addition, if clear guidelines are followed and the process is better documented, then it should be easier to trust and therefore use the data. All of these are likely to lead to increased usage of these statistics.
3.Background to the project
Statistics Norway has cooperated with other NSOs for several decades on sharing knowledge and building new statistical tools. Areas of cooperation range from quality assessments and building registers to data collection and analysis. Developing and implementing household surveys has been an area of interest for a long time. It evolved into assisting in poverty analysis from HCES’s, which led to also assisting in food security analysis from these surveys. At this point – more specifically, while working with the statistics offices in Sudan in 2010 – it became clear that doing poverty and food security analysis in two different processes is both inefficient and leads to poorer quality results.
When the Central Bureau of Statistics (CBS) in Sudan was undertaking their next HCES in 2014/15, they invited Statistics Norway to take part in preparing and analysing the data for both poverty and food security. This resulted in the report “Food security and poverty analysis from Household Budget Surveys” [3].22
The questions about what the international best practice or an international recommendation is, always come up when working with HCES data. (As it does during international cooperation about almost anything else too.) Whereas there are guidelines focusing on processing food data for poverty and there are guidelines for processing food data for food security, there is not one unified guideline telling us how to do it all at once. And there is not an internationally endorsed standard that we may refer to. Thus, having the UNSC recommend the process provides more clarity to the NSOs and others on how to implement it.
Statistics Norway decided to embark on making such a guideline available. At the same time, Statistics Norway and COMESA entered a partnership. COMESA is a regional actor in Africa and ensures a coordinated effort to reach out to NSOs, providing exchange and collaboration between African NSOs. COMESA is also creating new demand for the food data as it will be used for regional planning.
The link between coordinating the work of putting together a user-friendly guideline at the same time as doing the hands-on work with NSOs that are interested in taking food security on board as a regular output from these surveys, has been very fruitful. Draft guidelines have been tested on data while being written, and the statisticians have provided feedback on the drafts.
4.Making a guideline on processing the food consumption data
The guideline trajectory of the project is the production of guidelines on how to process food consumption data from HCES to make them usable for producing the basket for CPI, input to national accounts, consumption-based poverty analysis, and consumption-based food security analysis. It covers going from raw data to complete numbers for monetary value, quantity (grams), and dietary energy from all the food consumed by the household and where they sourced the food from of all the food items. That means both those purchased and the estimated value of those not purchased (gifts, own production, etc.). It is important to mention that all these statistics have, of course, been produced before, and guides on how to produce them exist. What is new with these guidelines is primarily that they bring together these methods into one process that can serve all.
The work on the guideline was adopted under the United Nations Committee of Experts on Food Security, Agriculture and Rural Statistics (UN-CEAG) workplan. The process of producing the guideline brought together the main international actors33 in this field with the aim of negotiating a unified approach to data processing. The goal of this is that they, by being part of producing it, will also use the guideline in further trainings and consultancies.
The guidelines were prepared by a team of experts from Statistics Norway, the World Bank, FAO, and the Pacific Community, including several rounds of consultations with experts from national statistical offices, international organisations and academia. It draws on published and unpublished material produced for use in processing data and conducting training.
The draft guidelines went for a global hearing to NSOs in mid-2023. Based on the comments received, a new draft was presented and endorsed by the UN Statistical Commission in March 2024.44
The guidelines consist of an overview of principles that are valid for everyone, no matter what their HCES data collection tool looks like. This is followed by a step-by-step guide on how to process the data. The guidelines outline the process and give concrete advice on how to process the data. They are limited to processing data that is collected in line with the UNSC-endorsed guidelines on data collection, where the LSMS module shown higher up is one example. Most countries will still have to make small adjustments to fit their own exact questions and raw data files, but the main steps and choices will be there. The guidelines are voluntary, but there are some principles in them that are necessary to follow if you want to produce quality data. There are, however, other elements where the NSO can make their own choices. An example is outlier detection and imputation. In these cases, the consistency between surveys and documentation of choices is also crucial.
It is significant to mention that the guidelines stop when the data has reached clean variables on quantities, monetary value, and dietary energy. How these variables are used in different analyses and indicators is not included. The needs of some known analyses, like poverty, CPI baskets, national accounts, and prevalence of undernourishment, have however been considered all the way, as the goal is that these users do not have to start their own processing of the data.
The idea is that by following the guidelines while processing the food data, datafiles with food monetary values and quantities, which can be used by most of the users without further cleaning, are produced. That includes that the guidelines recommend documenting the process so that the users can know exactly what has been done. Analyses of the cleaned data for official statistics are sometimes done by the NSOs themselves, sometimes done in different ministries, and sometimes done by external consultants. The cleaning and documentation also aim to benefit other users once the microdata is released.
5.Capacity building in processing the data
The capacity-building trajectory of the project is aimed at strengthening the capacity to process food data from HCES in NSOs as well as making new uses of these data. This has been done together with COMESA, with their member countries taking part in workshops and processing data in dialogue with experts in COMESA and Statistics Norway. Input has also been given by experts from FAO and the World Bank who are cooperating with the same countries in this area.
COMESA as an organization is a user of statistics, and the project seeks to prepare the national food statistics so that they are useful for policy and planning at the regional level as well as at the national level.
5.1Strengthening capacity
NSO staff members from several countries – Malawi, Zambia, Uganda, Kenya, Tanzania, and Zimbabwe – took part in the first round of training and analysis. The training was done using the most recent HCES-survey, with the goal that this is then taken up in the regular data processing and analysis with the new HCES data. The training has been organized as online activities, individual hands-on training workshops with each country, and a regional joint hands-on workshop with participants from all three countries taking part. In total, about 35 NSO staff took part. More specifically, the training has been organized in bulk in three countries, as follows:
After initial meetings with each country where participation was agreed upon and all information needed for the training was collected, a joint online one-week workshop with the countries was organized. The aim was to introduce the participants to the main principles in processing the food data jointly for food security and poverty, to introduce food security concepts, and to start the exchange of experience and resources between the countries. Hands-on work was then undertaken in physical workshops. First, a separate workshop was held for each country where the HCES food data was processed to be readily available for food security analysis. As each country has variations in the food module, it is beneficial to have this processing training for each NSO separately. The three countries were then brought together to create national food security statistics profiles for their own countries, as well as a joint regional food security profile. These workshops normally spark a lot of good discussions and exchanges. Follow-up work to finalize the profiles and consultations with stakeholders follows.
After the training, the countries have requested various forms of support with respect to improving the tools for collecting better food data in the next survey. For example, one of the countries was previously not collecting conversion factors, but with the funding for scales from the project, conversion factors for units used for reporting food acquired have now been collected. Conversion factors are critical for calculating quantities into a standard unit, such as grams. Commonly, there are a range of different units, for example, a cup of sugar or a heap of tomatoes, that do not have a universal meaning. The conversion factors will improve the quality of the data for food security analysis.
6.Interlinkages
Dividing the project into two trajectories makes it easy to administer, but the two are strongly and intentionally interlinked. The guidelines need feedback from the statisticians, and the statisticians use the guidelines in their work. The team leaders in three NSO took part in a global meeting on the guidelines, and the writers of the guidelines lectured in the trainings. And everyone learns from the discussions and new networks.
The work with colleagues in the NSOs proved how work is easier with clear guidance, thus the need for the guidelines. But in much of our work, we realize that international guidelines are often not known to those for whom they are intended. Especially when the guidelines are voluntary. And when they are known, they may only be used if they are easy to understand and answer the work the specific statistician is about to do.
The workshops with NSOs from countries in COMESA are the testing grounds for the guidelines. The feedback has so far been that there is a need for coherent written materials to support the presentations and syntax files; there is a need for a document that outlines the process when discussing with other stakeholders; and there is a need for examples on how to do the work. The discussions with the NSO teams of statisticians have influenced priorities for the guidelines as well as revealed the need for supporting material in a manual for the guidelines. One of the reasons to not send those parts to UNSC is that they are the mandate of other expert groups, for instance, on how to document surveys. The manual will attempt to include already-endorsed advice in these areas but also make some new materials. One clear message from both researchers and consultants and the NSOs is that a manual on how to make the Nutrition Composition Table is highly needed, and FAO has provided a first draft for that.
On the other hand, taking part in the expert discussions with other NSOs, international organizations, and researchers has brought about more discussions around data collection tools and methods. It has also provided us with a network of people to discuss concerns with. And this exchange of ideas and deeper understanding is lowering the threshold to adopt so-called best practices. The three countries in the first group of COMESA members are each discussing improvements to data collection, from improving conversion factors to better capturing food away from home. In the long run, it will hopefully converge towards more harmonized statistics.
The open meetings in UN-CEAG where the guidelines were discussed are also an arena for marketing them. The immediate goal was to get feedback and keep those interested in the loop of progress, but the more people who know it exists, the higher the chance of it being used – or at least considered – by NSOs and the consultants they work with.
7.Quality
The title of the paper says, "More efficient use of HCES.” By efficiency, we mean improved timeliness of data processing and statistical production and saving money. The money will be saved through less work. Improving the processing looks like more work, but compared to doing it twice, it will be much less. The time spent processing food data from a HCES survey varies depending on how the data was collected and the challenges of the given survey. Thus, it is difficult to give an estimate of the time saved. However, a good and thorough cleaning and checking of the food data is likely to take several weeks of work. Taking into account that the data may be processed twice or even more times to prepare it for various analyses of food security by various actors, the time savings may be considerable.
But efficiency is only one part of quality in statistics. The United Nations National Quality Assurance Frameworks Manual for Official Statistics [4] lists nine dimensions of quality: relevance, accuracy, reliability, timeliness, punctuality, accessibility, clarity, coherence, and comparability. Improving the processing of the data touches upon several of these.
7.1Accuracy
Accuracy is “the closeness of the estimates to the exact or true value that the statistics were intended to measure” [4, p. 8]. It is probably the part most people think about first, when talking about quality in statistics. Following the recommended guidelines in the processing of food consumption data can lead to better quality monetary values and better-quality measures of quantity by more systematically cleaning the two of them together. For those who do not already use a high-quality Nutrient Composition Table from the beginning while processing the data, following the recommendations will also improve the quality of the matching of the quantities in the dataset to food composition information (energy and macronutrients).
In addition, the stakeholders working together to design the process, the statisticians working in the same offices as the data collectors, and, most of all, improved documentation increase the chance of problems with data collection being corrected in future surveys. Conversely, making changes in data collection tools to accommodate one stakeholder may impose unforeseen problems for other users of the data. But this is less likely to happen when the NSO oversees a holistic preparation of the food data collected. Thus, adopting the guidelines can strengthen the institutional memory and help improve the quality and efficiency of future data collections.
7.2Coherence (or consistency)
With the most important data users agreeing upon one processing of the food consumption data, the inconsistencies between analyses of the same data should be less. And with the processing well documented and repeated from survey to survey, the inconsistence between surveys is reduced.
7.3Clarity (or transparency)
Clarity deals with the documentation of the statistics and how available this information is to users. The guidelines give advice on what to document, encouraging improved transparency both for analysts using the data and for users of the final statistics products.
7.4Comparability
Under this heading, the primary goal of the project is to improve comparability between surveys by ensuring that different analysts do not change important steps in the processing of the data – and thus make it non-comparable – just because they are not aware of what has been done before.
Table 1
Consumption of main food items. Rural and urban Zambia. Percent of households consuming the items
| Rural | Urban | Rural | Urban | Rural | Urban | |||
|---|---|---|---|---|---|---|---|---|
| Maize grain shelled | 33 | 6 | Cabbages | 24 | 54 | Kapenta, dried | 36 | 53 |
| Breakfast mealie meal | 10 | 74 | Tomatoes | 80 | 98 | Eggs | 32 | 64 |
| Hammer mealie meal | 20 | 3 | Pumpkin leaves | 73 | 57 | Bream, fresh | 12 | 30 |
| Green maize | 37 | 22 | Rape | 51 | 81 | Beef, fresh | 15 | 34 |
| Rice shelled | 14 | 38 | Onions | 48 | 92 | Chicken, fresh | 37 | 53 |
| Bread/breadrolls | 22 | 73 | Kalembula | 38 | 46 | Butter | 4 | 25 |
| Buns/Scones | 25 | 35 | Okra | 38 | 38 | Milk, fresh | 13 | 35 |
| Sweet Potatoes | 27 | 30 | Pumpkin | 35 | 9 | Juice | 8 | 40 |
| Potatoes | 7 | 25 | Bondwe | 15 | 21 | Soft drinks | 7 | 21 |
| Cassava tubers | 20 | 6 | Impwa | 20 | 42 | Fritters | 22 | 20 |
| Groundnuts unshelled | 21 | 16 | Oranges | 5 | 22 | Sugar | 59 | 87 |
| Dried beans | 37 | 54 | Bananas | 9 | 28 | Cooking oil | 82 | 93 |
Calculation based on Zambia LCSMS 2015 survey [6].
Figure 2.
Average calories per capita per day. In Zambia and as recommended by 2021 guidelines. Calculation based on Zambia LCSMS 2015 survey [6].
![Average calories per capita per day. In Zambia and as recommended by 2021 guidelines. Calculation based on Zambia LCSMS 2015 survey [6].](https://content.iospress.com:443/media/sji/2024/40-2/sji-40-2-sji230098/sji-40-sji230098-g002.jpg)
Following the guidelines on processing in combination with the previously mentioned guidelines on how to collect the data will also lead to more harmonization between countries.
Our hypothesis is that all this can be achieved. It doesn’t mean it will happen on all levels and in all the countries involved just because of new guidelines and some workshops. But then again, any improvement means you have improved. So even small steps would mean that we are on our way.
8.Outputs
While the guidelines stop at monetary value, quantity, and dietary energy, the COMESA project also includes analysis and producing statistics.
8.1National food security profiles
The national food security profiles include analyses of consumption patterns based on dietary energy consumption, macronutrient consumption, food groups, food items, relative prices, food expenditure, and food sources. The analysis can be disaggregated to province level, and several statistics and analyses can be generated. Two examples from the Zambian draft food security profile are given below to illustrate some uses. For more about this survey, see [6].
Table 1 shows the lists of foods consumed by at least 20 percent of the households in rural and urban areas of Zambia and the percentage that reported consuming them in the last 7 days. This is a good starting point to dive into the analysis of food consumption in households. It also illustrates that the consumption pattern varies greatly between rural and urban areas.
Figure 3.
Consumption of refined and whole grain cereals. Calories per capita per day. Poor and non-poor. Urban and rural areas. Calculation based on Zambia LCSMS 2015 survey [6].
![Consumption of refined and whole grain cereals. Calories per capita per day. Poor and non-poor. Urban and rural areas. Calculation based on Zambia LCSMS 2015 survey [6].](https://content.iospress.com:443/media/sji/2024/40-2/sji-40-2-sji230098/sji-40-sji230098-g003.jpg)
The next example compares observed average food consumption per capita to recommended dietary guidelines. Zambia has a recent national food-based dietary guideline [5]. It recommends a varied diet, and in particular, there is a recommendation on consumption of calories from a list of seven broad food groups.
Figure 4.
Maize consumption, production, and trade in Malawi, Zambia, and Zimbabwe. Calculation based on Malawi IHS5, Zambia LCSMS survey, and Zimbabwe PIES survey [6, 7, 8] and production and trade data compiled by the COMESA.
![Maize consumption, production, and trade in Malawi, Zambia, and Zimbabwe. Calculation based on Malawi IHS5, Zambia LCSMS survey, and Zimbabwe PIES survey [6, 7, 8] and production and trade data compiled by the COMESA.](https://content.iospress.com:443/media/sji/2024/40-2/sji-40-2-sji230098/sji-40-sji230098-g004.jpg)
As seen from Fig. 2, on average, people in Zambia consume much more calorically dense foods, i.e., more cereals, roots, and tubers, as well as more sugar than recommended. Consumption of cereals, roots, and tubers is almost twice as high as the recommendations. Consumption of sugar, which is near 80 calories per capita per day, is compared to no recommended sugar at all. On the other side, of all the other food groups, the average consumption in Zambia is lower than what is recommended. For example, consumption of fruit and vegetables is, on average, only about one fifth of the recommended level. Note that not all consumption is covered in the figure below, mixed foods that do not belong to only one of these categories (such as meals eaten in restaurants) are not included. Further, the data does not tell us if any of the food was wasted or given to animals.
Another recommendation is to eat whole grain cereals rather than refined cereals, such as white rice and refined maize (called “Breakfast Mealie Meal” in Zambia). The figure below shows the amount of cereal from refined sources as well as whole grains. It is divided between poor and non-poor and between urban and rural areas. Consumption of refined cereals is much higher among the non-poor and in urban areas.
8.2The regional food security profile
Regional food security sub-regional food security profiles draw on the national analysis and compare statistics that are harmonized between the countries. Figure 4 below shows a page in the “regional fact sheet.” This page combines information from the three surveys in Malawi, Zambia, and Zimbabwe [6, 7, 8] with statistics that COMESA compiles from the countries on production and trade. We have chosen maize as the product to look more closely at here, as it is a very important food in all three countries. This is illustrated by the map. In Malawi, almost all households reported that they ate maize. Production of maize per capita is also highest in Malawi, as shown in the first figure to the left, whereas Zimbabwe has the lowest production as well as the highest net import of maize. The numbers are adjusted for per capita by dividing by the population in the country of interest. The arrows on the map show the net trade per capita of maize between the countries.55 Net 9 kilo of maize per capita per year is exported from Zambia to Zimbabwe, and 2.4 from Zambia to Malawi. There is near zero net trade between Malawi and Zimbabwe. To the right of the map, we can see that their own production of maize is an important source for their consumption (data on sources were also collected in Zimbabwe, but the definition used was different and is therefore not comparable to the two other countries). More than 40 percent of all the calories of maize consumed by households were grown by households. Finally, the last part of the page illustrates that maize is a very cheap source of calories, as compared to other cereals, roots, and tubers. In Malawi, it costs about a third of the average cost per calorie of other cereals, roots, and tubers, and it is even cheaper in the two other countries. At the same time, due to the high consumption of maize, it accounts for most of the expenses for cereals, roots, and tubers. This kind of analysis can be used to assess the likely impact on food security of changes in maize production, trade conditions, and prices.
Note that there are some caveats when interpreting these figures. Firstly, the HCES surveys were conducted at different times. Malawi in 2019-20, Zambia in 2015, and Zimbabwe in 2017. The statistics on trade and production are calculated as the average across these five years. Thus, rather than giving a snapshot at a point in time, the analysis aims at showing the general pattern.
9.Conclusion
The challenges this project attempts to address are twofold:
• Firstly, in many countries food data already collected is either not being used for food security statistics or is being produced late.
• Secondly the quality of the statistics produced can be improved.
The proposed way to get there is to improve the quality of the data through training, improved methods, and improved data processing. The work has so far led to the expected outputs, but the project is not over yet, so it remains to judge the final result. Food consumption data is challenging to collect, and quality is often questioned, particularly when it comes to quantities consumed. But at the same time, it is the only data reflecting food consumption, food sourcing, and diet diversity for nationally representative populations in most countries. Therefore, it is by far the best we have and worth improving. The many thousands of households spending hours recording or recalling all their expenses and consumption deserve that we do our best to create as accurate and detailed statistics from it as we can.
From the work, we have learned that:
• The NSOs confirmed that they need user-friendly guidelines on how to produce food security statistics. Other organisations and academics have also confirmed the need for guidelines and improved documentation. This was expressed in feedback in workshops, hearings, and evaluations of training.
• Bringing an initiative like this under the UN-CEAG umbrella allows us to tap into a wide network of experts while also giving transparency to the process towards an international recommendation. The input from FAO and the World Bank has, however, been essential, as these two organisations have produced so much of the materials that precede the joint guidelines, and they collaborated on producing the guidelines from 2018 on data collection.
• Feedback in the hearing rounds for the guidelines was positive. There were no objections to the technical aspects of the process described, which we see as an indication that there are no problems arising for the main users by following the proposed principles. There have been thorough responses from experts, and there were many suggestions for the structure of the document and the terminology used.
• Involving NSO staff from low- and middle-income countries that work with the HCES is also critical. If the guidelines do not work for the users, then it doesn’t help that they are correct and agreed upon in a high-level meeting.
• Detours are not always bad. The optimistic starting point was to have the guidelines done by 2022, but that underestimated the UNSC process. Rather, the guidelines were endorsed at the UNSC 2024 meeting. The longer process means more people have provided input, and more people are aware that it exists. This improved the quality and hopefully contributes to more countries using it.
• The involvement of a regional organization has been good. The direct interaction with a user of the data (COMESA) created a clear demand that the NSOs could respond to. The regional organisation already has established relationships with the NSOs, which eases their involvement. Working with more countries at the same time created a platform for more exchange between NSOs who work in similar ways. Having the trainer based in the region also reduced long-distance travel, saving both money and the environment.
• Although the goal is more efficiency, more knowledge leads to more work, not less, from a short-term perspective. The NSOs involved are now adding elements to improve the collection and analysis of food consumption data in their new surveys. This requires more work for all involved parties but will ultimately improve the food consumption data and statistics, which is the overall goal of the whole project.
Notes
2 This report is currently not available on the Central Bureau of Statistics in Sudan’s’ web page. It can be obtained by requesting Statistics Norway through [email protected].
3 Core actors who have agreed to be part of this are the UN Food and Agricultural Organisation (FAO) which is the custodian of measuring SDG goal 2 on hunger, and the World Bank, which is the custodian of SDG 1 on poverty. Of the UN-CEAG members, the NSOs from India, Indonesia, and Mexico, as well as USDA-ERS, UNECLAC, and UNICEF, signed up to the task force, while a number of academics have contributed comments to an early draft after the open UN-CEAG meeting in October 2022.
4 The guidelines can be found here (the UNSC background document link): https://unstats.un.org/UNSDWebsite/statcom/session_55/ documents/BG-3i-ProcessingFoodComsuptionData-E.pdf.
5 These numbers are calculated by using the total quantities of maize traded between countries to calculate the net import. The total export from country 1 to country 2 is not exactly equal to the import from country 2 to country 1 (this may have to do with differences in reporting or estimations). Thus, the net trade in the figure, is calculated as the mean of the two reported figures. To calculate the per capita measure, we have used the population in the country the arrow is pointing to, i.e., the country that is the net importer of the two.
Acknowledgments
We are grateful to participants in the 17th International Association for Official Statistics Conference (Livingstone 2023) and the Ninth International Conference on Agricultural Statistics (Washington 2023) for comments provided to this paper. We thank the three NSOs in Malawi, Zambia, and Zimbabwe for sharing data and participating in the project. Lastly, we are grateful to the Norwegian Agency for Development Cooperation (Norad) for funding the project.
References
[1] | FAO and The World Bank. Food data collection in Household Consumption and Expenditure Surveys. Guidelines for low- and middle-income countries. Rome. (2018) . |
[2] | Oseni G, Palacios-Lopez A, Mugera HK, Durazo J. Capturing What Matters: Essential Guidelines for Designing Household Surveys, Washington DC: World Bank; (2021) . |
[3] | Central Bureau of Statistics Sudan, Ministry of the Cabinet and Statistics Norway. Food security and poverty analysis from household budget surveys – Analysis of the 2014/15 sudan household budget and poverty survey. (2018) . |
[4] | UNSD. The United Nations National Quality Assurance Frameworks Manual for Official Statistics. Studies in Methods. Series M No. 100; Department of Economic and Social Affairs, United Nations, New York; (2019) . |
[5] | Ministry of Agriculture. Zambia food-based dietary guidelines. Technical Recommendations With the technical assistance of the Food and Agriculture Organization of the United Nations Co-funded by The European Union; (2021) . |
[6] | Central, Statistical Office. 2015 Living Conditions Monitoring Survey (LCMS) Report. Lusaka, Zambia; (2016) . |
[7] | Zimbabwe National Statistics Agency. Poverty, Income, Consumption and Expenditure Survey 2017 Report. Harare; (2018) . |
[8] | Malawi Government. The Fifth Integrated Household Survey (IHS5) 2020 Report. National Statistical Office, Zomba; (2020) . |


