
To count or to estimate: A note on compiling population estimates from administrative data
Abstract
Like many countries, Ireland has been researching new systems of population estimates compiled using administrative data. Ireland does not have a Central Population Register from which the estimates can be compiled.
The primary step in compiling population estimates from administrative data is to first build a Statistical Population Dataset (SPD). Ideally an SPD will have one record for each person in the population containing the relevant attributes. The ideal SPD then allows compilation of statistics by simply counting over records.
In practice, the compilation of SPDs is prone to error. These errors can be classified into 4 types of error; overcoverage, undercoverage, domain misclassification and linkage error.
Ireland, to date, has investigated 2 different approaches to the compilation of population estimates from administrative data. The first, labeled in this paper as the simple count method, is based on building an SPD which minimises the overall number of individual record errors such that simple counts from the SPD will provide population estimates. The second, labeled in this paper as the estimation method, is based on building an SPD which aims to eliminate all error types bar that of undercoverage and then adjusts counts for undercoverage using Dual System Estimation (DSE) methods to obtain population estimates.
This paper explores the advantages and disadvantages of both methods before considering how they could be integrated to eliminate the disadvantages.
Many NSIs will be considering similar challenges when compiling annual Census like population estimates and this paper aims to contribute to that discussion.
1.Introduction
Statistical agencies in many countries are investigating methods for replacing traditional census based population estimation systems. Not every country has a Central Population Register (CPR) which can be easily used as the basis of directly compiled population statistics. Ireland is one such country. The Central Statistics Office (CSO), Ireland, like many statistical agencies, has been investing significant resources into the exploitation of administrative data sources for statistical purposes [1]. As part of this effort, the CSO has been investigating new methods for the compilation of population estimates.
The first step in compiling population estimates is the compilation of a SPD from administrative data sources. The simple idea behind an SPD, is that it can be used instead of a CPR to count persons in the population for a given reference point or reference period.
The ideal SPD will have a record for each statistical unit (person) in the target population - each unit identified with a unique identification number. The target population for population estimates requires a person to be living in the State. There will be variations of the basic definition, de facto, de jure, registered etc. but the basic premise is the person must be living in the State. In compiling an SPD from multiple data sources, four main types of error can arise with respect to the target population:
• Overcoverage: Where the SPD has units that do not belong to the target population.
• Undercoverage: Where the SPD is missing units that belong to the target population.
• Linkage error: Where units are incorrectly identified as other units, for example where a Personal Identification Number (PIN) is incorrect.
• Domain misclassification: Where an attribute has an incorrect value for a unit. This may occur when the same or similar attributes on different contributing data sources have conflicting values.
Ireland, to date, has investigated two different approaches to the compilation of population estimates from administrative data. The first, labeled in this paper as the simple count method, is based on building an SPD which minimises the overall number of individual record errors such that simple counts from the SPD will provide population estimates. The second, labeled in this paper as the estimation method, is based on building an SPD which aims to eliminate all error types bar that of undercoverage and then adjusts counts for undercoverage using Dual System Estimation (DSE) methods to obtain population estimates.
This paper explores the advantages and disadvantages of both methods before considering how they could be integrated to eliminate the disadvantages.
2.Methods
2.1Simple count method
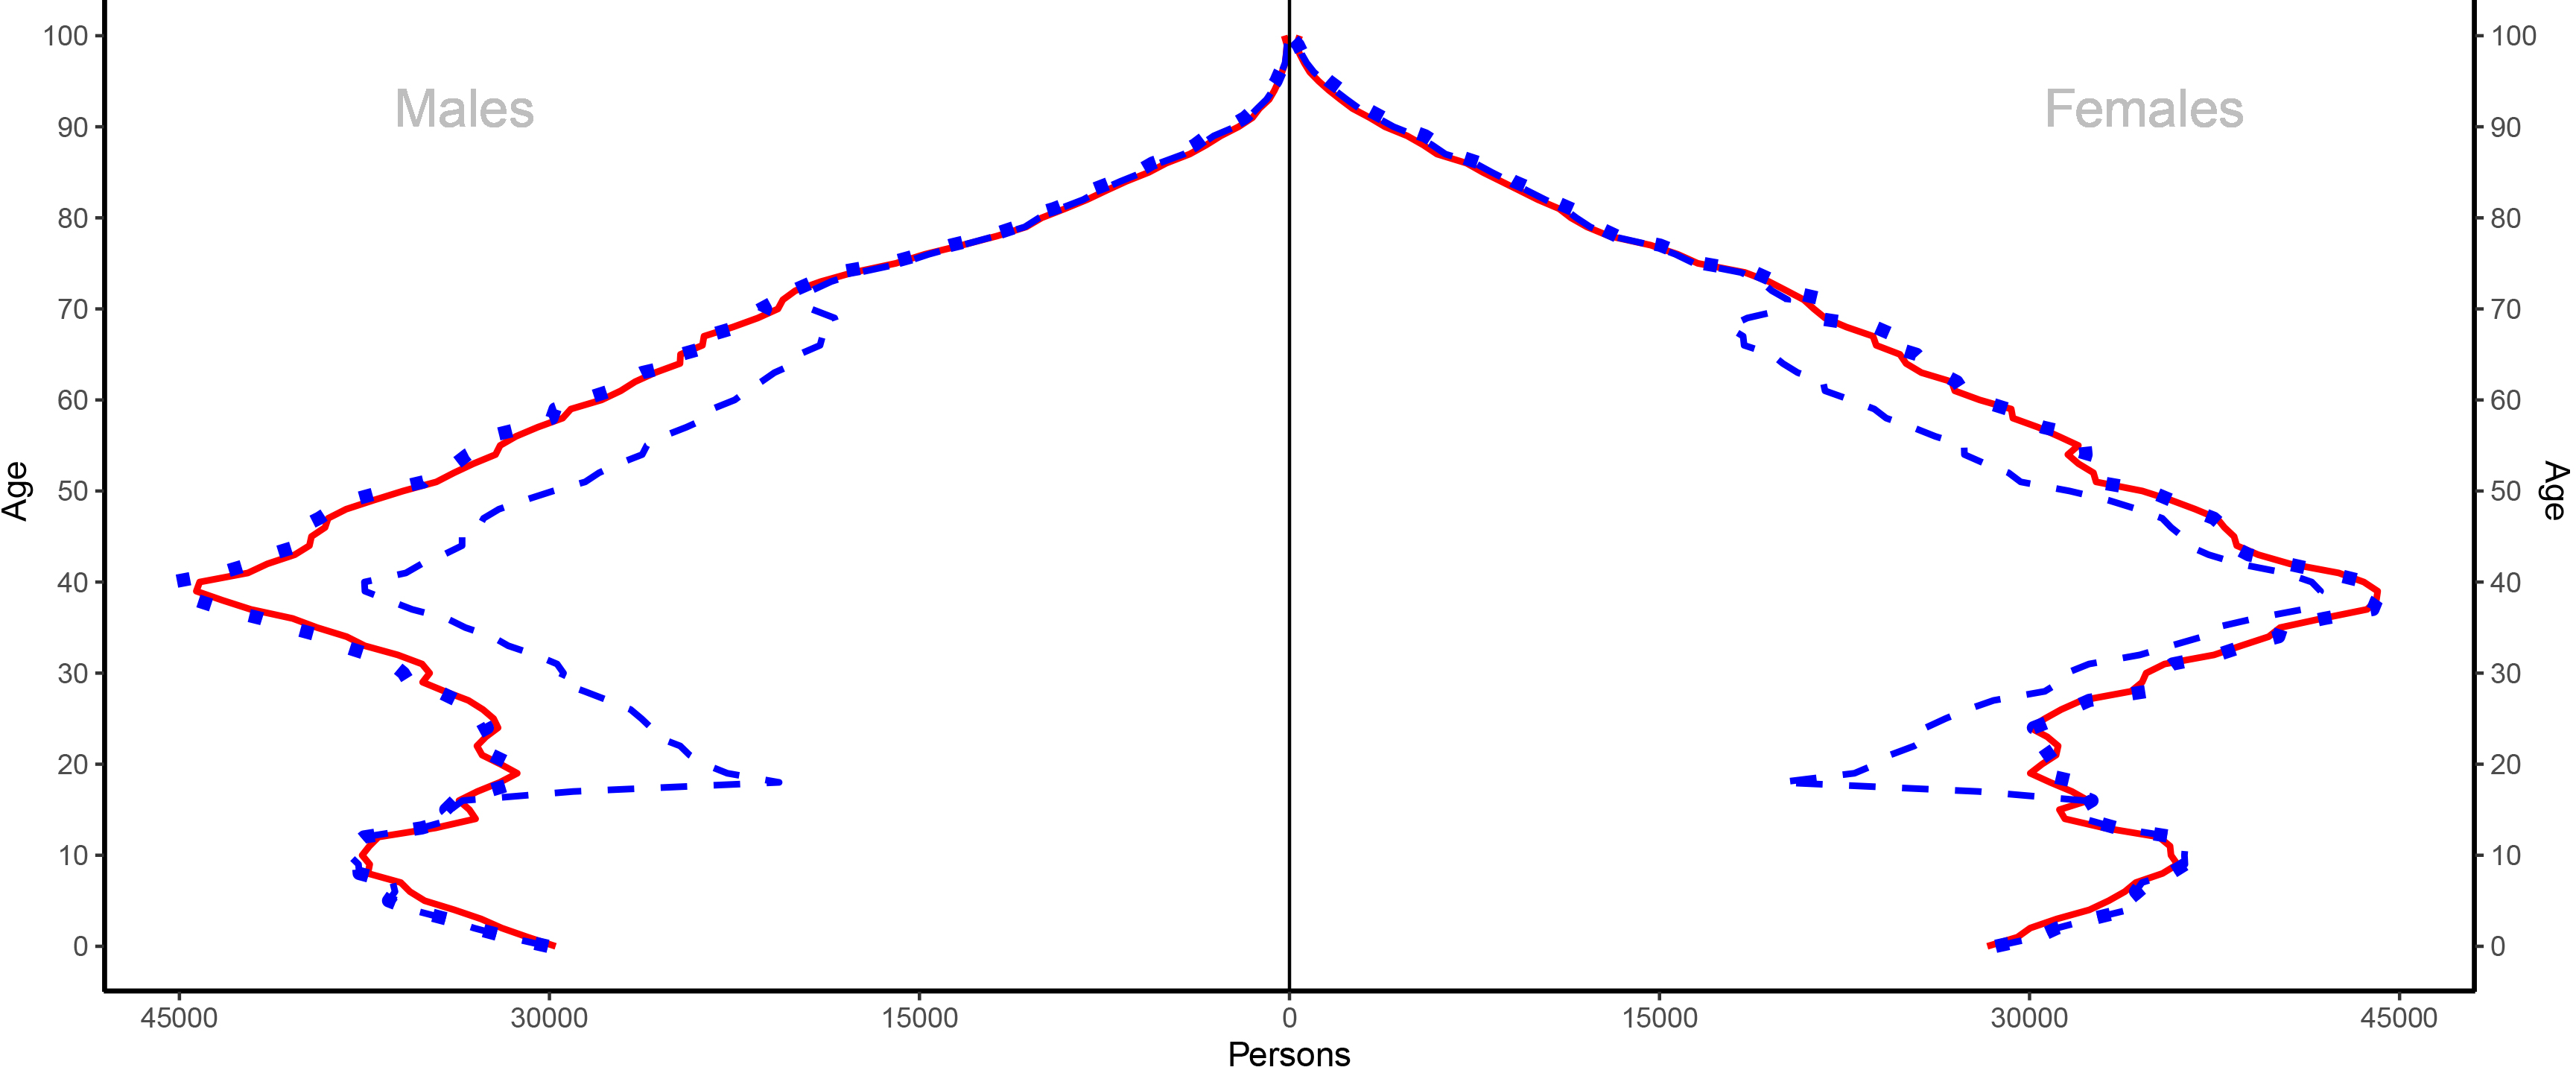
The simple count method was used to compile population estimates for reference year 2020. The population was estimated at 5.2 million.11 An age by gender breakdown is provided in Fig. 1 where the simple count and estimation methods are compared for reference year 2020.
Figure 1.
A comparison of the simple count method with estimation method when used to compile population estimates by gender and single year of age, 2020. Red continuous line denotes estimates using simple count method – SPD compiled based on minimising number of errors. Blue dotted line denotes estimates using estimation method – adjusted counts from SPD compiled based on limiting type of errors to undercoverage – SPD also denoted using a blue dashed line.
This method takes a Signs of Life (SoL) approach to compiling the SPD. The rules underpinning SoL are chosen in an intuitive manner to target one record in the SPD for each person in the population. The approach relies on minimising the number of errors when counting records in the SPD to estimate the population. In practice there will be errors in the SPD and these errors will also cancel each other out to some extent.
In some sense, this approach is similar to the Nordic register based approach [2]. Here it is simply assumed that every person in the population engages with one of the underpinning public administration systems and that estimating the population is simply a matter of counting persons engaging with public administration systems. In the Nordic register-based system the population is equated to the registered population – the full population and only the population is registered. It is generally accepted that coverage errors are insignificant and registered counts are sufficient. These errors have previously been estimated and provide reassurance to users – [3] used an SoL type approach in administrative data sources to explore overcoverage issues and demonstrated that potential overcoverage in the CPR is significantly less than 1% of the population in the case of Sweden.
Data sources with respect to universal child benefit payments, primary school enrolments, post-primary school enrolments, third level and further education enrolments, self employment, employment, social welfare and pension payments were used to identify persons to be included in the SPD.
Location or place of residence was then assigned using a rules-based approach to give more prominence to data sources that were considered of higher quality. Data sources used for assigning geography included rental registrations, local property tax for property owners and a listing of addresses maintained by the Department of Social Protection.
A limited number of attributes are also included in the SPD for each person. These include economic sector of employer for employees, nationality and whether a person is in receipt of a welfare payment along with core attributes such as age, gender and nationality.
There are some drawbacks. It is acknowledged in this approach that an adjustment to the rules for including a person in the SPD can impact directly on the population counts. However, if the rules are applied in a consistent manner from year to year and the underlying data sources are stable and robust in their operation, it can be argued that errors introduced are systematic and, therefore, shouldn’t impact observations about the changing nature of the population from year to year. Changes in the nature of the data in the underlying data sources or changes with respect to the availability of data sources will also be a weakness or drawback to this approach. Changes in an underlying data source can come about due to a change in population behaviour with respect to interactions with the respective public administration system, a change in rules (or implementation of rules) for the operation of a public administration system or some other reason.
This approach has the advantage that it can compile coherent cross tabulations of estimates for the population by simply counting records for each table cell. This can be done for any attribute derived from the variables contained in the data sources contributing to the SPD. At the time of writing this method has only been applied for one reference year – 2020.
2.2Estimation method
2.2.1Overview of estimation method
The estimation method comes from the IrishPECADO (Population Estimates Compiled from Administrative Data Only) project [4].
The estimation method, when applied using selected administrative data sources for reference year 2020, estimated the population of Ireland at 5.3 million persons. An age by gender breakdown is provided in Fig. 1 where the simple count and estimation methods are compared for reference year 2020.
At its simplest, the estimation method is a 2 step process.
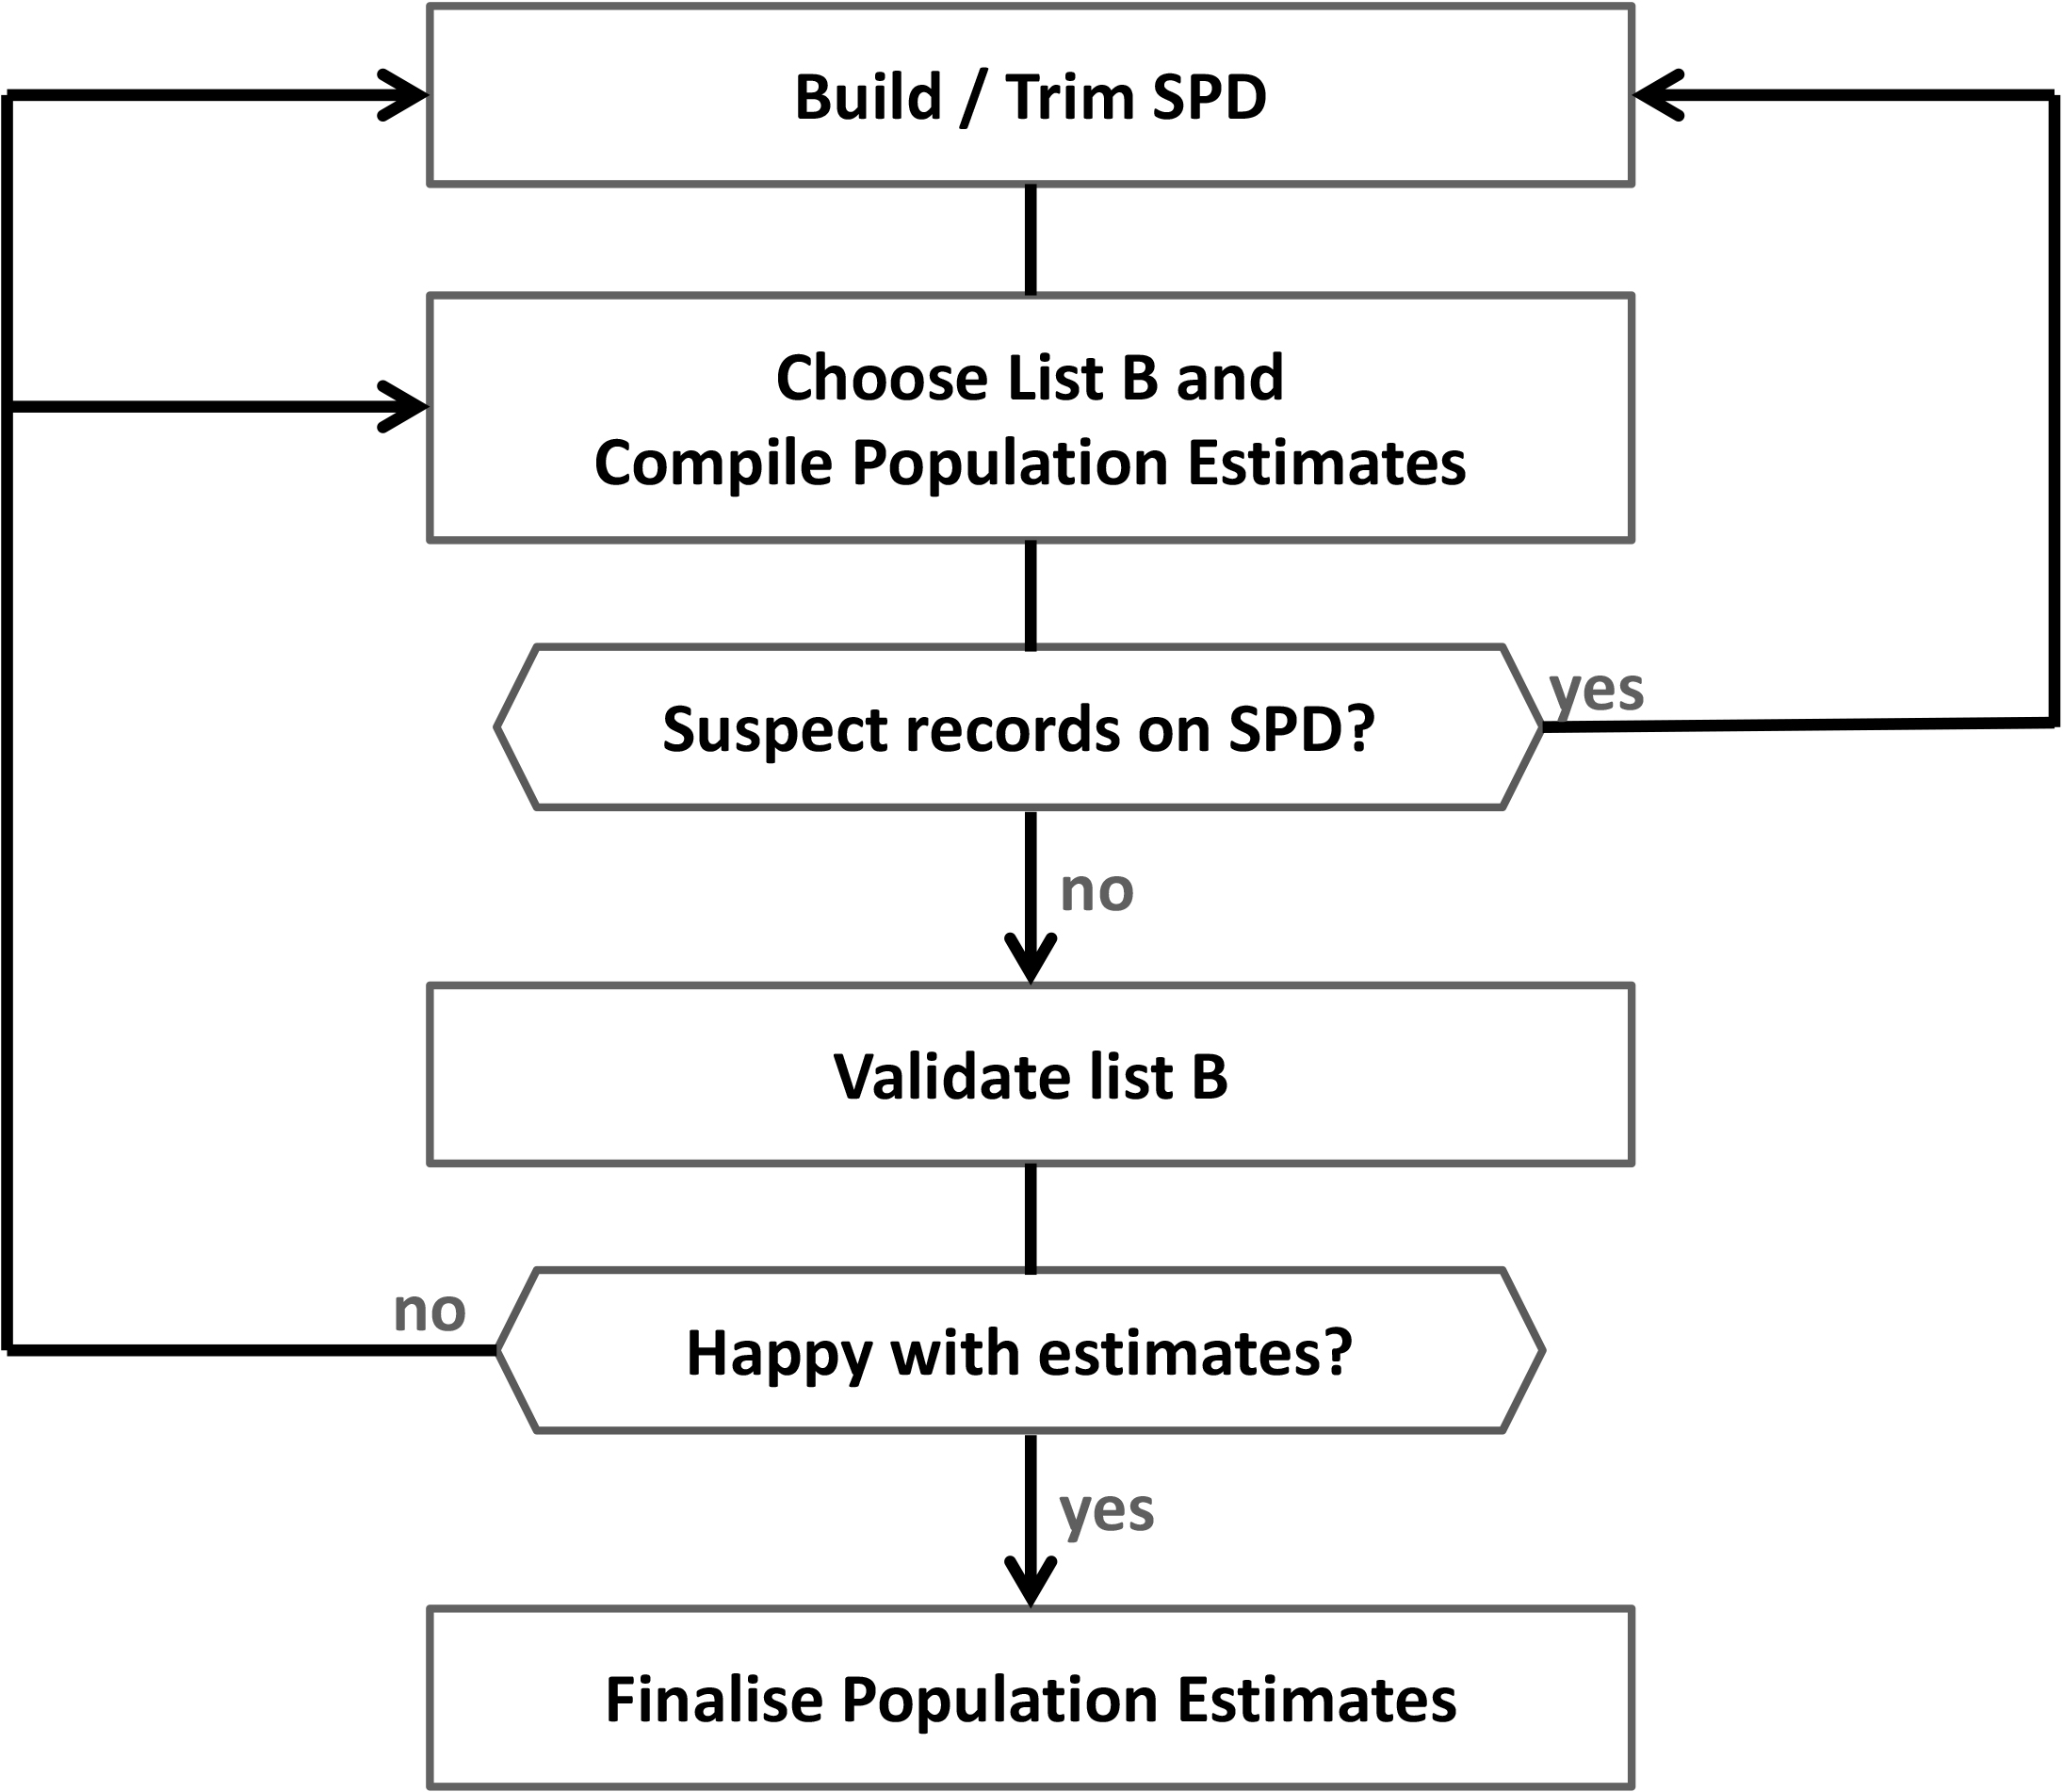
Figure 2.
High level process map for compilation of population estimates in the Irish PECADO project.
The first step involves the compilation of an SPD with only one type of error with respect to the population – undercoverage. With this method, the SPD is compiled based on applying a strict SoL criteria over a similar set of data sources as that for the count method. The primary difference is that the criteria used for the SPD in the estimation method is to reduce the types of error to be dealt with down to one – that of undercoverage. The strict criteria have the purpose of ensuring that all records included in the SPD represent a person in the population, but the SPD does not necessarily contain a record for every person in the population. Undercoverage is expected.
The second step requires adjusting the SPD counts for undercoverage. Once the SPD is compiled, a designated data source deliberately excluded from the compilation of the SPD is used as a second list in a DSE setup to adjust SPD counts for undercoverage to obtain population estimates.
In practice, an iterative process is used with an extended DSE toolkit, called the PECADO toolkit, to ensure the estimates are robust and can be defended from a methodological perspective. The toolkit can also be used to deal with suspect records and overcoverage errors in list A. Figure 2 illustrates the iterative process applied to ensure estimates are robust.
The tools/methods used to compile the population estimates (the PECADO toolkit) are described below. More details can be found in [4] noting the DSE and Trimmed DSE (TDSE) were first presented in [5]. [4] also presents population estimates for reference years 2011 to 2016 along with a reasonable argument for their robustness.
The drawbacks to this approach is that there is no complete dataset for the population. The SPD compiled as part of this approach can contain significant undercoverage issues and as such it is not so easy to generate various cross tabulations for the population in a coherent manner.
2.2.2Summary of PECADO toolkit
DSE revisited
In the DSE setup, the two lists are denoted as list A (of size
i) No erroneous records: A closed population ensures no records from outside the population but we also suppose there are no duplicate records or incorrectly identified records in either list A or list B.
ii) Matching assumption: There is no linkage error when matching records between list A and list B.
iii) Homogeneous capture with respect to list B: Every unit
These assumptions now allow us to write
(1)
We consider
The additional assumption used to enable variance estimation relates to independent capture of persons in the population on list B, that is, the event that a person is captured on list B is independent of whether any other person is or is not captured on list B . The variance estimator is the same as the standard DSE described in the text book of [6].
(2)
The additional assumption enables the use of the Binomial theorem to obtain estimators for the variances of
Trimmed DSE (TDSE) and hunting for erroneous records in list A
Consider
(3)
However, in reality
If we trim
(4)
We can use TDSE, noting the following results from [5, 7], to evaluate the presence of erroneous records in different subsets of list A
i) If
ii) If
iii) If
iv) If
v) If all the
In summary, if erroneous records exist on list A, as long as one is able to trim the erroneous records in list A more effectively than when randomly trimming records, the TDSE Eq. (4) can be expected to reduce the bias of the DSE at Eq. (1) where no erroneous records are assumed and move it closer to the ideal DSE at Eq. (3). If trimming succeeds in removing all erroneous records, the expectation of the TDSE will become approximately the same as the ideal DSE at Eq. (3).
If it is assumed that all erroneous records have been removed from list A, the variance estimator for TDSE can be written as
(5)
An effective trimming strategy will remove erroneous records without increasing the variance of the estimator to the extent that it is no longer useful or stable. There is a trade off when trimming – the greater the number of records trimmed, the greater the increase in the variance estimator, denoted at Eq. (5).
Impact on estimates when homogeneous capture assumption in list B does not hold
Dunne and Zhang [4] consider the impact of a violation in the homogeneous capture rate assumption with respect to list B. This is done by considering a partition of the population into two subgroups or strata and then considering the difference between a stratified estimator (
(6)
From Eq. (6) we see that
A further note on the PECADO toolkit
An innovative aspect of the PECADO toolkit is that it revisits the DSE setup, in particular the assumptions used by [8], and restates the DSE methods such that the assumptions are relaxed and restated as three primary assumptions with a fourth included to enable variance estimation.
The PECADO toolkit also extends the traditional DSE methods such that parts of the SPD can be evaluated for erroneous records including overcoverage. This is an important extension as it now allows validation of the no erroneous records assumption when compiling estimates. In more general terms, this extension allows DSE methods to be used in the treatment of overcoverage errors.
The relaxation of the assumptions and the ability to be able to extend the methods themselves provides for a far broader application domain for DSE methods. One possible application is the replacement of the traditional post enumeration survey as part of the traditional Census with the use of a simple administrative list with the application of DSE methods. Counter-intuitively, the Census can be considered as a large coverage survey for any administrative list (with undercoverage only) in a DSE setup. If such an application is feasible there are significant benefits in terms of cost, timeliness and reduced complexity of operations in the traditional Census model.
2.2.3Outline of how toolkit is applied in PECADO project
Figure 2 provides an overview or high level process map of how the estimates have been compiled using the toolkit and also how the toolkit can be used to provide reassurance around the estimates. We briefly describe this process below. For a more in depth consideration of this process and its feasibility we refer the reader to [4].
To start, an SoL approach is used to build the initial SPD using the selected data sources. A candidate data source is excluded from this selection and designated to be list B in the DSE set up. In theory, this SPD should only have undercoverage with respect to the population – the use of high quality identification numbers mitigates against linkage errors in the PECADO project.
In the PECADO project there are 2 candidate data sources for list B. The first list B candidate is created using activity (renewals or applications) on the Irish Driver Licence Data (DLD) system and the second candidate is a household survey designed to select individuals from the population with equal probability. The DLD source is considered the primary candidate for list B as the coverage of this list should ensure precise estimates (low standard errors). Considering (6), we also make the assumption that population coverage on the SPD does not differ significantly for drivers and non-drivers. Post-stratification by single year of age, gender and nationality grouping is deployed to further mitigate any bias due to a violation of the homogeneous capture assumption.
Population estimates and confidence intervals are now compiled by strata using Eqs (1) and (2).
In practice, one could suspect that one or more of the underlying data sources (used to compile the SPD) contain erroneous records and as such will lead to overestimation of the population size, note Eq. (3). If the SoL rules are effective there should be no erroneous records on the SPD. To test the SoL rules, the TDSE methods described above are used to hunt for erroneous records by dropping each underlying data source in turn when building the SPD and comparing estimates.
In practice, one could make the argument that list B (DLD) violates the homogenous capture assumption and will lead to significant bias. To test this argument, the population estimates are recompiled using the second candidate list B data source (a household survey) and the estimates compared. The results show a coherent set of estimates (noting the second set of estimates using the household survey will have larger confidence intervals) and, as such, no evidence to suggest the assumption that population coverage on the SPD does not differ significantly for drivers and non drivers is invalid.
To reconcile the estimates with existing population counts (reference year 2016), the toolkit is deployed in a scenario where the Census list is considered list B (a significant coverage survey) for an administrative list (list A) compiled from those that received a social welfare payment in the month the Census was taken. Taking account of the underlying population concepts, the differences in the two sets of estimates can be reasonably reconciled at a conceptual level. The PECADO project uses an Annual Resident Population type concept (somebody considered resident at any point in the year) when estimating population size while the Irish Census counts conceptual measure is based on being usually resident on Census night. The conceptual differences can plausibly be explained with migration estimates [7]. The idea of using a base concept closely aligned to how best to estimate the population is not new, the Nordic countries use a registered population concept to underpin their population counts. [9] provides an in depth consideration of different population concepts and their implications.
3.Further discussion and proposed combination of methods
In considering a comparison of estimates from the two methods, the simple count method and the estimation method, in Fig. 1 we see the two sets of estimates are broadly comparable.
The comparative strength of the estimation method is that it can be defended as a robust set of estimates from a methodological perspective while the comparative strength of the simple count method is that cross tabulations are simply derived by counting over the various dimensions in the SPD.
A consideration of the underlying methods and their comparative strengths leads to a proposal that combines both methods to leverage their comparative strengths. The proposal, in a simple form, can be described as follows:
First, compile an SPD from underlying data sources (holding a suitable data source back to use as list B in a DSE setup) that has also an attribute that scores each record on whether you consider the record to be sure (
Second, compile benchmark population estimates using DSE methods where list A is the subset of the SPD where all records are marked as sure and list B relates to the data source that has been excluded from the compilation of the original SPD. In our example, population estimates could now be compiled with a suitable list B and list A containing 900 sure records to obtain a population estimate of 1,000.
Third, top up the records in list A to the benchmark population estimates using a probability based selection of records marked possible from the SPD. This creates a new SPD that can now be used for cross tabulations while summing to the population estimates that can be defended from a methodological perspective. In our example, list A could now be topped up by selecting from the 200 possible records in the SPD with a probability
The greater the implicit population coverage of the SPD (containing
Regardless of which method is preferred, two key challenges remain with respect to meeting demands for detailed population estimates; detailed geographical disaggregation and household composition. Address information on administrative data sources may be out of date or incoherent with other data sources and as such is not always accurate or up to date. It is difficult to deploy rules for assigning persons to detailed geographical location when the quality of address information on administrative data sources is varying, inconsistent and incoherent.
Extending the toolkit to deal with domain misclassification as part of the estimation method contains challenges in dealing with small numbers associated with detailed geographical breakdowns. In general, only partial household relationships are captured on administrative data systems where it relates to a form of payment or relief in Ireland; for example a parent in receipt of child benefit payment will have a parent-child relationship captured (note, even these administrative relationships may not mirror real world living arrangements - it could be the case that the child does not live with the designated parent and may in reality reside with another parent/guardian). The population consisting of third level students is a particularly difficult cohort to pin down in terms of geographical location and household composition, it is quite difficult to determine whether they are residing in some form of student or rented accommodation or with their parents based on information available in administrative systems in Ireland.
The traditional Census has the benefit of directly collecting many attributes of individual persons in the population and being able to easily disseminate detailed statistics based on these attributes at highly disaggregated geographical levels. If the traditional Census is to be replaced by a Census primarily using administrative data, significant consideration will also need to be given on how best to meet the needs of the users of such statistics. The traditional Census typically dedicates special attention to count hard to reach sub groups of the population (e.g., non documented persons, homeless persons) and any replacement of the traditional model will likely require similar special attention for hard to reach groups.
In conclusion, the authors believe it is possible to compile population estimates from administrative data
sources without the requirement to have the public administration system underpinned by a high quality Central Population Register. The work undertaken to date shows this possibility, however, more work is required in developing the respective methods to address outstanding challenges, most notably to provide statistical detail on household composition and geography.
Notes
1 Published as a frontier release at https://www.cso.ie/en/releases andpublications/fp/fp-ipeads/irishpopulationestimatesfromadministr ativedatasources2020/ accessed on 2nd June 2023.
References
[1] | Dunne J. The Irish Statistical System and the Emerging Census Opportunity. Statistical Journal of the IAOS. (2015) ; 31: (3): 391-400. Available from: http://www.medra.org/servlet/aliasResolver?alias=iospress&doi=10.3233/SJI-150915. |
[2] | UNECE. Register-based Statistics in the Nordic Countries. Review of Best Practices with Focus on Population and Social Statistics. United Nations; (2007) . Available from: http://www.unece.org/fileadmin/DAM/stats/publications/Register_based_statistics_in_Nordic_countries.pdf. |
[3] | Bengtsson T, Rönning SÅ. Overcoverage in the Total Population Register. In: Nordiskt Statistikermöte – Statistics in a changing world. Towards 2020 and beyond. Stockholm: Statistics Sweden; (2016) , p. 12. Available from: https://www.scb.se/Upload/NSM2016/theme1/TorBengtsson–StinaÅslingRönning.pdf. |
[4] | Dunne J, Zhang LC. A system of population estimates compiled from administrative data only. Journal of the Royal Statistical Society Series A: Statistics in Society. (2023) (June). Available from: https://rss.org.uk/RSS/media/File-library/Events/Discussionmeetings/Dunne_preprint_27-June-2023.pdf. |
[5] | Zhang LC, Dunne J. Trimmed Dual System Estimation. In: Bohning D, van der Heijden PGM, Bunge J, editors. Capture-recapture methods for the Social and Medical Sciences. CRC press; (2018) , pp. 237-258. |
[6] | Bishop Y, Feinberg S, Holland P. Discrete Multivariate Analysis. Springer; (1975) . |
[7] | Dunne J. The Irish PECADO project: Population Estimates Compiled from Administrative Data Only. University of Southampton; (2020) . Available from: https://eprints.soton.ac.uk/452353/. |
[8] | Wolter KM. Some Coverage Error Models for Census Data. Journal of the American Statistical Association. (1986) ; 81: (394): 338-346. |
[9] | Lanzieri G. On a New Population Definition for Statistical Purposes Note. CES Group of Experts on Population and Housing Censuses. (2013) (September). Available from: http://www.unece.org/fileadmin/DAM/stats/documents/ece/ces/ge.41/2013/census_meeting/Eurostat_introductory_paper_on_new_population_definition.pdf. |


