
Using paradata to assess respondent burden and interviewer effects in household surveys: Evidence from low- and middle-income countries1
Abstract
Over the past decade, national statistical offices in low- and middle-income countries have increasingly transitioned to computer-assisted personal interviewing and computer-assisted telephone interviewing for the implementation of household surveys. The byproducts of these types of data collection are survey paradata, which can unlock objective, module- and question-specific, actionable insights on survey respondent burden, survey costs, and interviewer effects – all of which have been understudied in low- and middle-income contexts. This study uses paradata generated by Survey Solutions, a computer-assisted personal interviewing platform used in recent national household surveys implemented by the national statistical offices of Cambodia, Ethiopia, and Tanzania. Across countries, the average household interview, based on a socioeconomic household questionnaire, ranges from 82 to 120 minutes, while the average interview with an adult household member, based on a multi-topic individual questionnaire, takes between 13 to 25 minutes. The paper further provides guidelines on the use of paradata for module-level analysis to aid in operational survey decisions, such as using interview length to estimate unit cost for budgeting purposes as well as understanding interviewer effects using a multilevel model. Our findings, particularly by module, point to where additional interviewer training, fieldwork supervision, and data quality monitoring may be needed in future surveys.
1.Introduction
Household surveys serve a vital role in national statistical systems, inform official statistics on an extensive range of socioeconomic phenomena, and are required to track progress toward national and international development goals. Multi-topic household surveys are frequently implemented across the developing world to fill data and research gaps, and there is increasing international momentum to improve the scope of intra-household, self-reported, individual-disaggregated survey data collected on key dimensions of men’s and women’s economic wellbeing [1, 2, 3, 4].22
Although household surveys have continued to grow in terms of topical coverage and complexity, substantial gaps persist – particularly in low- and middle-income countries – in empirical evidence regarding various aspects of survey implementation. This includes evidence on respondent burden, survey costs and interviewer effects, all of which are critical for gauging data quality concerns – both during and after data collection – and informing decisions regarding the design of future surveys.
A related promising development is that over the last decade, national statistical offices (NSOs) in low- and middle-income countries have accelerated their transition to computer-assisted personal interviewing (CAPI) for face-to-face surveys [7] and have adopted computer-assisted telephone interviewing (CATI) for phone surveys, particularly in response to the data needs brought about by the COVID-19 pandemic [8]. As such, practitioners can address the aforementioned empirical knowledge gaps regarding survey implementation by leveraging survey paradata, i.e. data that is generated as a byproduct of computer-assisted data collection and that capture the entire process of creating a final survey dataset [9, 10]. For example, Survey Solutions, a free CAPI/CATI platform developed by the World Bank Group and used by various international organizations and NSOs, automatically provides an extensive paradata file for each survey. This ancillary dataset is a highly disaggregated account of the “life” of a survey and includes time stamped records of all “events” associated with each interview (e.g., interview record creation, interview assignment to an enumerator, answer provision, modification and comment addition in each questionnaire field, interview completion, to name a few).
Past research, based on high-income country data, has demonstrated the use of survey paradata for (i) monitoring survey progress and informing adaptive survey designs, (ii) analyzing and adjusting for survey non-response, (iii) computing granular interview duration statistics during the survey fieldwork and as an input into the design and costing of future surveys, (iv) tracking answer modification patterns and compliance with the intended interview flow, (v) identifying falsified data, (vi) verifying compliance with the intended visits to sampled enumeration area and household locations, and (vii) studying respondent behavior and predicting future survey participation [11, 12, 13, 14, 15, 16, 17, 18]. Comparable applications, however, are scarce in low- and middle-income countries, where building NSO technical capacity in the use of paradata for survey design, management, and quality control has been identified by the United Nations Intersecretariat Working Group on Household Surveys as one of the technical priorities for positioning household surveys for the next decade [7].
Our study is the first to provide paradata-powered insights on survey respondent burden, survey costs, and interviewer effects using representative data for several low- and middle-income countries. Specifically, we use paradata generated as part of national household surveys implemented by the NSOs in Cambodia, Ethiopia and Tanzania between 2018–2020, and which used the Survey Solutions CAPI platform. These surveys were supported by the World Bank Living Standards Measurement Study-Plus (LSMS+) project and included (i) a multi-topic socioeconomic household questionnaire, and (ii) a cross-country comparable individual questionnaire administered to adult household members in private interviews to collect self-reported information on their work and employment, as well as ownership and rights over physical and financial assets, among other topics.
The paper starts by providing precise country- and questionnaire module-specific duration estimates, as proxies for respondent burden, for an extensive range of household and individual questionnaire modules. These statistics can serve as operationally relevant inputs to inform survey practitioners’ decisions in implementing similar questionnaire modules in comparable contexts. The average household interview ranges from 82 minutes in Cambodia to 120 minutes in Tanzania. The food consumption module tends to be the most time-consuming household questionnaire module to complete, averaging 22–26 minutes, depending on the country. Apart from food consumption, household modules on non-food consumption, housing, and the household roster (listing of household members and their demographic characteristics) consistently rank among the highest in interview length. Likewise, the average individual interview ranges from 13 minutes in Ethiopia to 25 minutes in Cambodia, with the individual questionnaire modules on land ownership, labor, health and education consistently ranking among the top time-consuming modules. We further provide a detailed look at respondent burden by the number of targeted individuals in the household and discuss how interview length can be used for a back of the envelope calculation of monetary cost of a survey.
Subsequently, we turn to the cross-country analysis of interviewer effects on module duration. Interviewers play a large part in survey implementation, with potential effects on how respondents answer questions, non-response, measurement errors, and interview length [19, 20, 21, 22]. Regarding interviewer effects on interview length in particular, previous research has focused exclusively on high-income settings [12]. Contributing to this literature from a developing-context perspective, we rely on multilevel hierarchical models of module duration, with levels defined as enumeration areas, interviewers, and households. We compute the interclass correlation coefficient (ICC) for each module and then decompose the ICC to understand the extent of the variance in module duration that is explained by its interviewer component (i.e., ICC-I).
Our findings show that interviewer effects vary by module, despite having the same interviewer sample across modules. These effects are generally higher relative to comparable multilevel model estimates from high-income countries, and explain a large share of the total variance in interview length. Based on an intercept-only multilevel hierarchical model specification that incorporates area, interviewer, and household random effects (for individual-level modules only), we found that interviewer effects range from 1% to 44% percent of total variance, depending on the module and country. Identifying modules with high total variance estimates and high ICC-I measures is a first step towards instituting measures to minimize interviewer effects, including additional interviewer training and fieldwork supervision. We then discuss nuances in module fit when using a basic intercept-only model (a general model for all modules) to create the ICC-I rankings, what to pay attention to when looking at the results, and suggestions on how to extend the analysis.
On the whole, the module duration estimates, survey unit costs, and multilevel hierarchical model insights presented in our paper constitute operationally relevant and previously undocumented reference points for the NSOs and survey practitioners in low- and middle-income countries that may adopt (i) questionnaires and fieldwork protocols similar to ours, including the goal of minimizing the use of proxy respondents while collecting personal information on adults; and (ii) the use of paradata and empirical methods presented in this paper to improve further efficiency and quality of future surveys.33
The paper is thus structured as follows. Section 2 discusses the LSMS+ survey data, as well as how the paradata was extracted and cleaned. Section 3 provides descriptive statistics related to the time costs of individual modules in the LSMS+ in comparison to household modules, and an example of using interview length and budgets to make design decisions. Section 4 conducts a multilevel model analysis to understand how the interviewer effect contributes to variation in interview length. Finally, Section 5 concludes.
Table 1
Overview of national surveys used in analysis
| Ethiopia | Tanzania | Cambodia | |
|---|---|---|---|
| Survey | 2018/2019 Ethiopia Socioeconomic Survey | 2019/2020 Tanzania National Panel Survey | 2019/2020 Cambodia LSMS+ |
| Implementing Agency | Ethiopia Central Statistical Agency | Tanzania National Bureau of Statistics | National Institute of Statistics of Cambodia |
| Fieldwork Period | 9/2018 – 8/2019 | 1/2019 – 1/2020 | 10/2019 – 1/2020 |
| Household Sample | 6770 Households | 1184 Households | 1512 Households |
| Scope of Household Questionnaire | 8 modules | 16 modules | 10 modules |
| Adult Respondent Sample for Individual Questionnaire | 7235 Men 8153 Women | 1407 Men 1506 Women | 1845 Men 2095 Women |
| Scope of Individual Questionnaire | 7 modules | 8 modules | 11 modules |
| Individual Questionnaire Modules on Asset Ownership | Non-residential (primarily agricultural) and residential land, financial assets, mobile phones, livestock | Non-residential (primarily agricultural) and residential land, financial assets, mobile phones | Non-residential (primarily agricultural) and residential land, financial assets, mobile phones, livestock, consumer durables |
| Other Individual Questionnaire Modules | Employment, non-farm enterprises, education, health, savings | Employment, non-farm enterprises, education, health, subjective well-being | Employment, non-farm enterprises, education, health, 24-hour time use diary; domestic and international migration |
Notes: LSMS + data are publicly available. More information on the data and questionnaire can be found https://www.worldbank.org/en/programs/lsms/initiatives/lsms-plus/data here.
2.Paradata from national surveys in Cambodia, Ethiopia, and Tanzania
2.1Overview
This paper uses paradata from three nationally representative surveys supported by the LSMS+ program: the Cambodia Living Standards Measurement Study – Plus (LSMS+) Survey 2019/20, the Ethiopia Socioeconomic Survey (ESS) 2018/19, and the Tanzania National Panel Survey 2019/20. The country surveys were implemented by their respective NSOs. Each survey included a multi-topic household questionnaire, as well as a cross-country comparable individual questionnaire that aimed to collect self-reported data on adult household members’ work and employment, and ownership of and rights to physical and financial assets, among other topics.44 The questionnaire structure, wording, and approach to implementing the individual-level survey modules was the same across countries. Table 1 reports general descriptions of each survey and the types of modules included.
Table 2
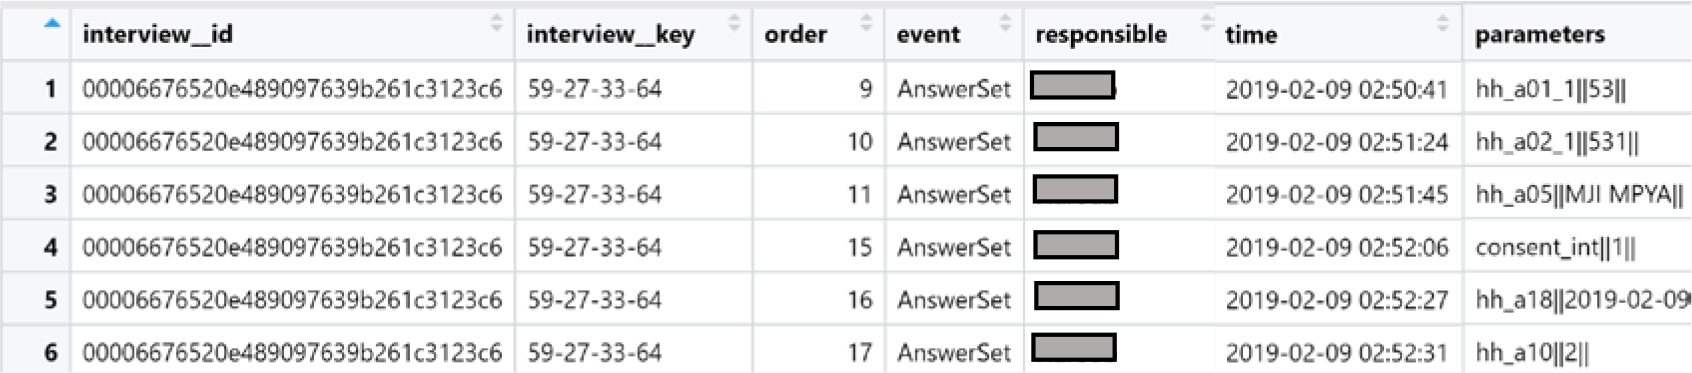
Example of paradata collected through Survey Solutions
|
Notes: The column “responsible” reports the name of the interviewer which is anonymized in the example above.
2.2Paradata collection and cleaning
The Cambodia, Ethiopia, and Tanzania surveys were conducted using the World Bank Survey Solutions CAPI software, which automatically includes supplemental paradata that contains timestamps of all “events” associated with each interview. Table 2 provides an example of what a paradata file looks like. There is a row for each event followed by the timestamp of when the event occurred. The “parameters” column provides input associated with the event. For example, the first row shows an AnswerSet event for the question hh_a01_1 where the person answered “53”.55 Each row in the paradata follows the previous row sequentially in time which is shown in the column “order”.66 Our analysis includes data on events initiated by the interviewer (variable role==1) and is associated with a questionnaire. The number of observations per person or household may differ since questions are automatically skipped when they are not applicable and are not logged as events.
There are multiple types of events tracked in the paradata and that are central to the computation of our duration measures. Examples include: AnswerSet (indicates when a question was answered in the interview), CommentSet (marks when a comment was added to a question in the interview), AnswerRemoved (flags when the answer to a question was removed), and Paused (denotes a prolonged pause, such as when a tablet goes to sleep).77 The number of observations in a paradata file is typically very large since thousands of events can be available for a single respondent. This represents one of the major complexities of handling paradata.
Certain events in the paradata were not deemed necessary for our analysis and are thus excluded. Excluded events, for example, are KeyAssigned (indicates when an enumerator creates a new interview and Survey Solutions automatically assigns it a unique key) and ApprovedByHeadquarter (indicates when the interview was approved by one of the individuals at the headquarters – typically a survey manager). The final dataset used for this paper’s analysis consists of mostly AnswerSet events (97.5% of all events in Cambodia, 98.7% for Tanzania, and 98.8% for Ethiopia), since these events are ones that occur during the interviews.
Subsequently, we construct a measure of interview length in minutes, by calculating the elapsed time between two logged events and removed outliers, namely events that were in the top 1 percent of the duration distribution in each country.88 We proceed by using the final dataset to estimate interview length at the question-, module-, individual-, and household-level, and also to link it with the information on household, individual and interviewer attributes.
3.Duration and costs of household and individual interviews
Using the setup discussed above, we turn to examining country-specific insights on respondent burden - specifically descriptive statistics for the duration of each household and individual questionnaire module, and for the duration of household and individual interviews. Given often-limited resources in conducting multi-topic surveys, the descriptive analysis in this section can provide insight on which modules might be more costly and complex to implement than others, aiding in survey design decisions. We then show how interview length estimates with survey budget data can be used to provide a monetary unit cost of household and individual interviews in Section 3.2.
Table 3
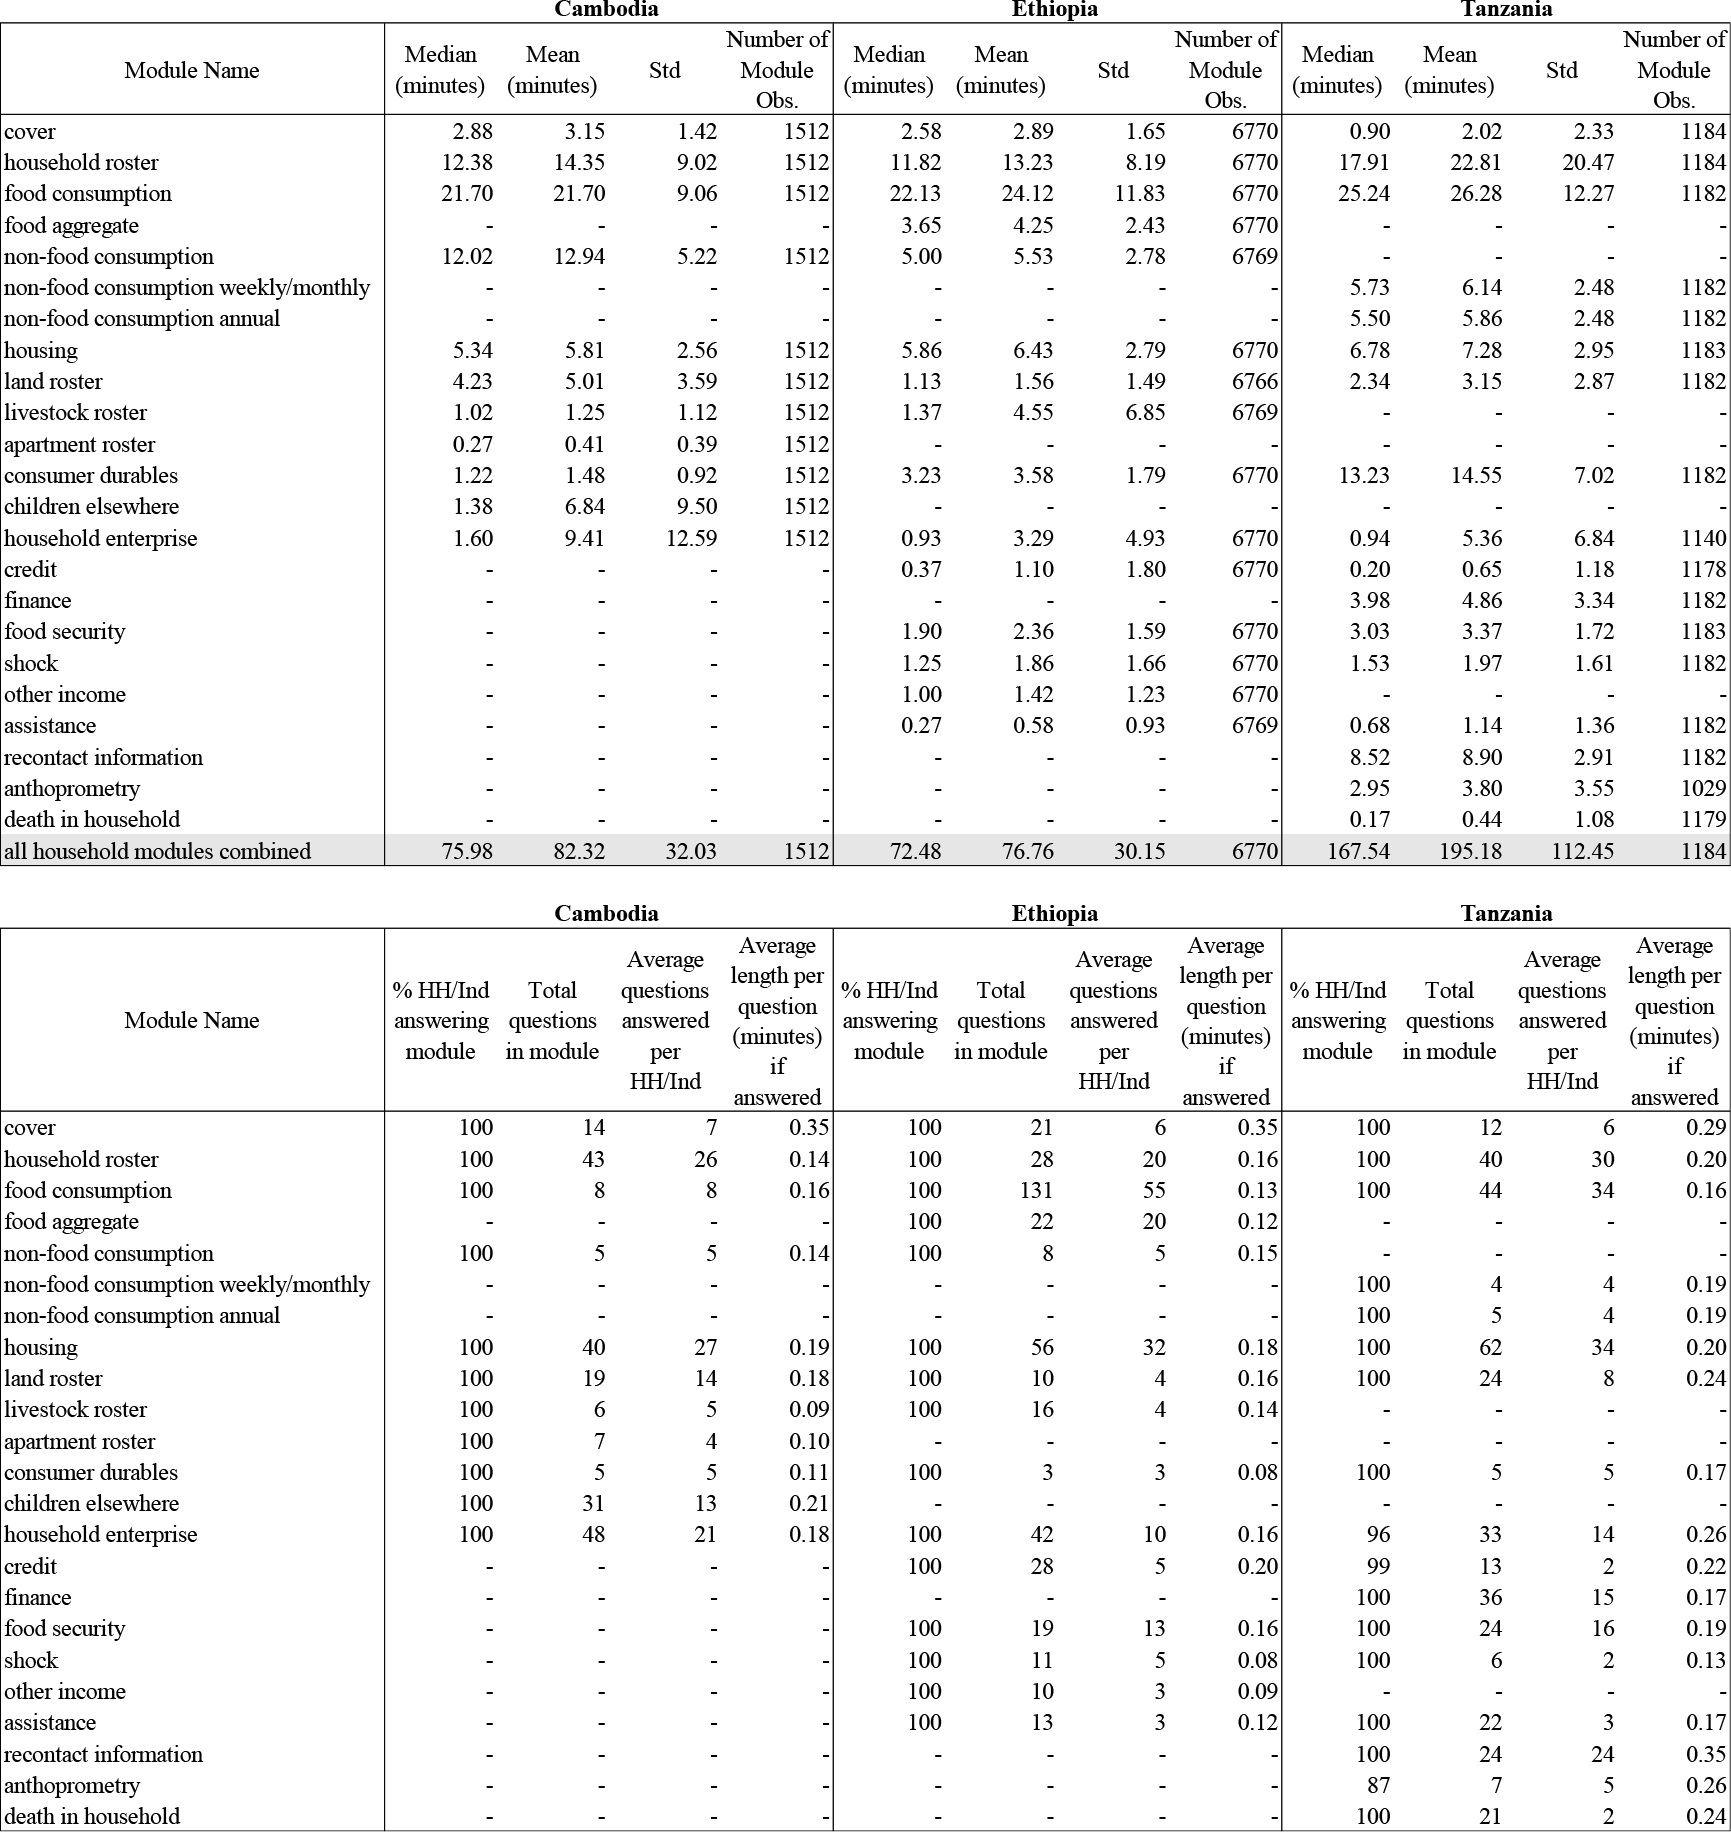
Duration of household questionnaire modules, by country
|
Notes: Number of module observations is based on how many respondents answered in that module. In Tanzania, household member roster and land roster were integrated and thus combined in the table. Not all modules are available for all countries. If a module is not available, no number is reported (shown as – in the table).
Table 4
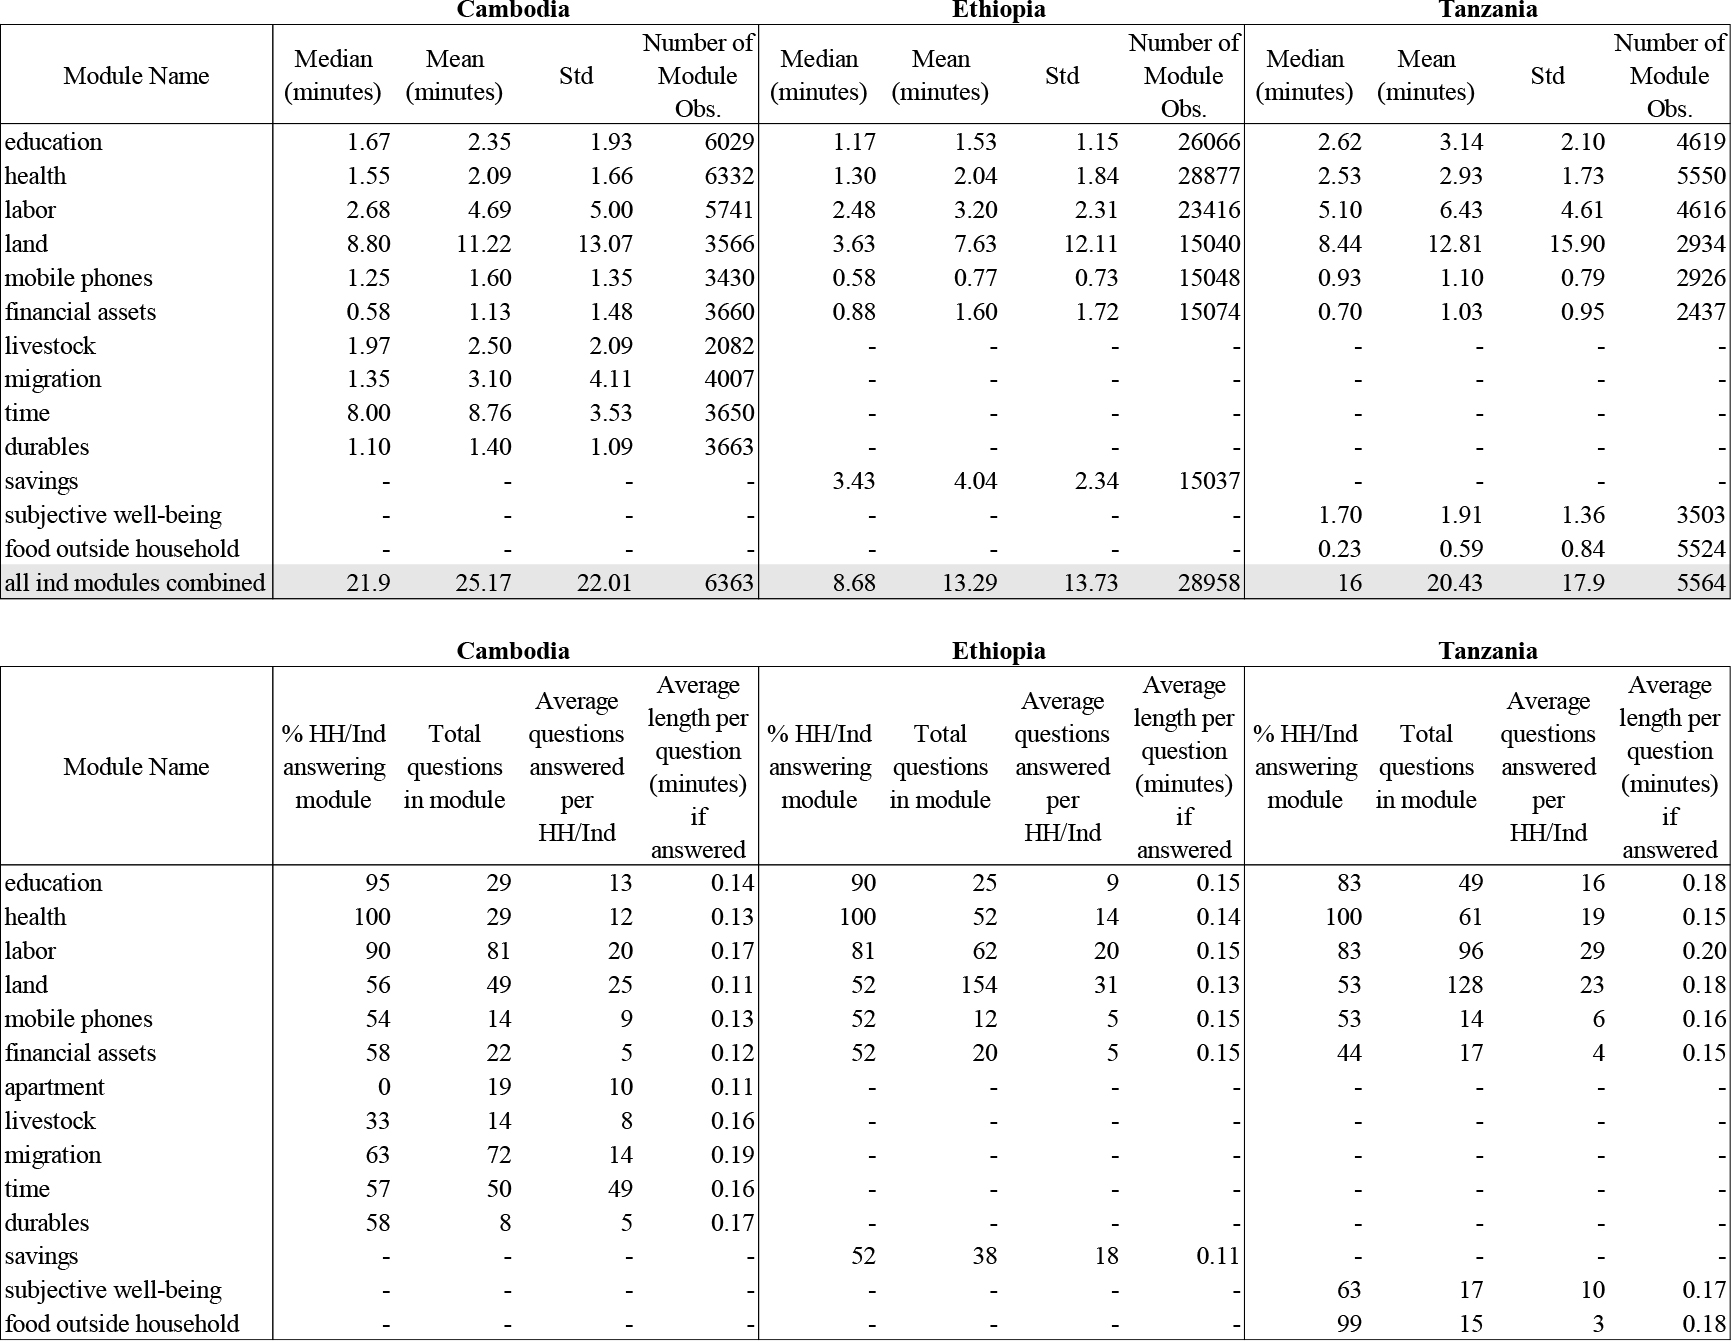
Duration of individual questionnaire modules, by country
|
Notes: Number of module observations is based on how many modules a person/household answered. Not all modules are available for all countries. If a module is not available, no number is reported (shown as – in the table).
3.1Duration estimates
Table 3 provides key descriptive statistics regarding the time burden of household questionnaire modules while Table 4 provides the same for the individual questionnaire modules. Countries are presented side-by-side for ease of comparison. The mean and median duration estimates for each module are computed over the entire household sample concerning the household questionnaire modules and over the entire age-eligible sample of household members (which varies by module, say education versus health versus labor) concerning the individual questionnaire modules. Most modules tend to have a median interview length of less than 10 minutes per interview, with a few exceptions noted below. We also find consistent patterns across countries in terms of which modules take the longest and ranking of modules by interview length.
Table 3 shows that the average total household interview ranges from 82 minutes in Cambodia to 120 minutes in Tanzania. The food consumption module emerges as the longest module to administer across countries, with an average module duration of 22 to 26 minutes, reflecting a very small amount of time per question – about 0.16 minutes or less – conditional on answering.99 Other top time-consuming modules across countries are (i) non-food consumption (5 to 13 minutes per module, or 0.19 minutes or less per question), (ii) housing (6 to 7 minutes for the module, or 0.20 minutes or less per answered question), and (ii) household roster (13 to 23 minutes for the module, or 0.29 minutes or less per answered question). The average duration for the administration of the entire set of household-level asset rosters for land, livestock, and apartments ranges from 6 to 7 minutes, resulting in an average duration of 0.20 minutes or less per answered question.
Table 4 shows that the average individual interview ranges from 13 minutes in Ethiopia to 25 minutes in Cambodia. The land module consistently emerges as the longest module to administer in each country, with an average duration of 8 to 13 minutes for the module. This is followed by the labor module (with an average duration of 3 to 6 minutes); health module (with an average duration of 2 to 3 minutes); and education (with an average duration of 2 to 3 minutes for the module). Individual-level modules on assets are less time consuming. The average duration for the administration of the entire set of modules on land, livestock, apartments, financial assets, mobile phones, durables (if applicable) and savings (if applicable) ranges from 14 to 18 minutes for each interviewed adult, with an average duration of 0.18 minutes or less per answered question.
The number of questions within a module and the number of individual interview targets for a given module are clearly linked with interview duration. The lower panels of Tables 3 and 4 provide insights into how many questions are in a given module and how many respondents answered each module (some were not eligible to answer). Some household modules are required and thus their response rates are almost always 100 percent. Individual modules, on the other hand, may not be administered to all individuals in the household, depending on the age eligibility for each module. For instance, the health module aims to collect information on all household members, while the age threshold for data collection is typically 5 years for the education module and 18 years for the land module (except in rare cases when head of household or his/her spouse is younger than 18 and still qualify as interview targets).
All questions within a module may also not be applicable to a given respondent. The third-to-last column of Tables 3 and 4 provide the total number of questions available in the module, while the second-to-last column provides the average number of questions that the respondent answered. Despite some modules having higher numbers of questions than others, this does not necessarily mean that the average interview length would be higher, since the duration ultimately depends on (i) the number of answered questions per module, (ii) the reliance on recall to provide information (as in the case of reporting on quantities and expenditures in the consumption modules) and (iii) the use of open-ended questions (as in the case of descriptions of the main and secondary jobs in the labor module), among other factors.
Moreover, when interpreting the results in Table 4, the duration estimates for the modules on asset ownership are not conditional on ownership of the type of asset in question. For example, the incidence of financial asset ownership is low across countries and thus individuals that respond “no” to the initial filter question on ownership would not complete the remaining questions. This drives down the module-specific mean and median estimates.
Figure 1.
Interview length (in minutes) by number of individual interview targets. Notes: Only up to 4 targeted individuals are shown in the graphs. Most households have between one to four eligible individuals. In Ethiopia, 95.75% of households have 4 eligible individuals or less. This number is 93.92% for Cambodia and 90.88% in Tanzania.
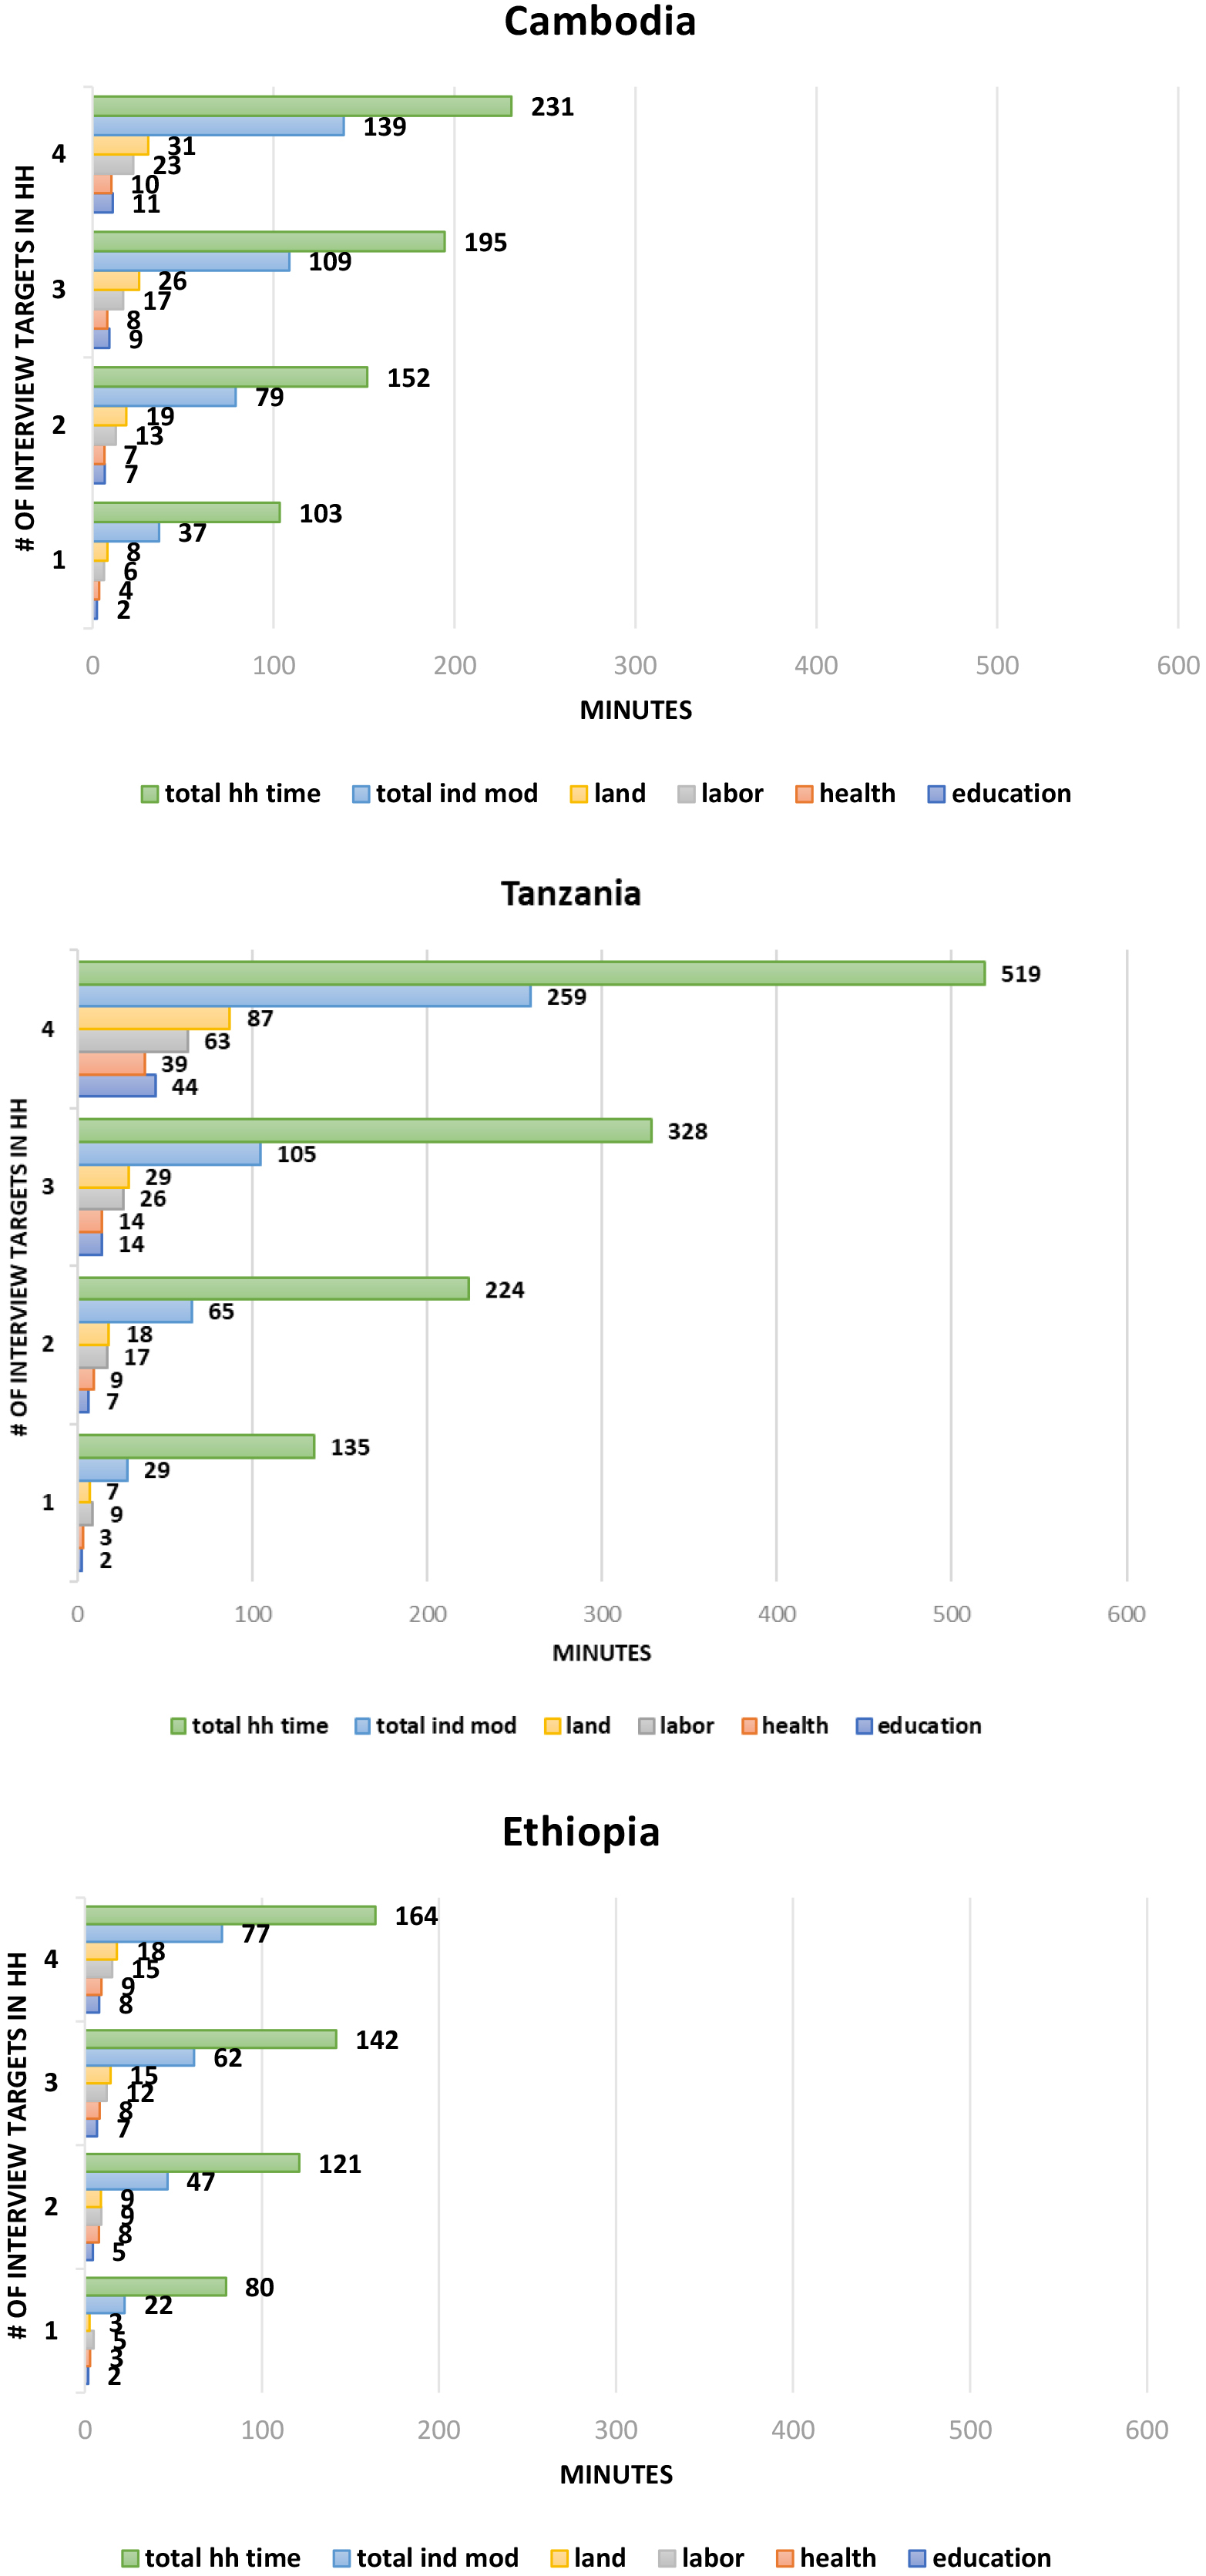
Due to the disaggregated nature of the paradata, we are also able to further estimate how average total time spent in the household varies by the number of adults targeted for individual interview. Figure 1 provides a visual comparison of the average total time spent at the household (for the administration of household and individual questionnaires) versus the average total duration of individual interview targets in each household. The estimates are presented according to the number of individual interview targets, and the average duration estimates for the land, labor, health and education modules are included. Total time spent at the household increases with the number of individual interview targets. In Cambodia, interviewers spent on average 103 minutes in total for the administration of household and individual questionnaires when the household only had one individual interview target. Moving from one target to two, the average total time in the household increases to 152 minutes. The marginal time for each additional individual interview target, however, does decrease, with the exception of Tanzania. In Ethiopia, for example, the difference in time in household with one target versus two is 41 minutes; when shifting from one targeted individual to two, the additional time per individual target is less than 22 minutes. Tanzania’s increase in additional time per interview target is the largest relative to other countries, given the number of modules the survey administered: as high as 191 minutes when moving from three to four targets and as low as 81 minutes when moving from one to two targets.
Overall, except for a few more complex-to-implement modules, module duration estimates appear to be modest for most of the individual questionnaire modules. While including modules that would be deemed critical for development research and policy making may not add as much time on the margin as one may think, the total respondent burden implied by the administration of both household and individual questionnaires is considerable, irrespective of the country. As such, analyzing survey paradata to obtain objective proxies for respondent burden is precisely what survey practitioners should do in order to make evidence-based decisions regarding survey data collection, in particular regarding the scope of both household- and individual-level data collection vis-à-vis the budget constraints and the data priorities.
3.2Unit cost estimates
Limited cross-country availability of household survey cost data continues to be a challenge for the international statistical community and donor organizations. Even when information is available, computing unit cost estimates on the basis of the number of interviewed households is a second-best approach when surveys exhibit significant heterogeneity in terms of questionnaire design and field work organization (e.g. one visit versus multiple visits to sampled households or use of resident interviewers versus mobile field teams (see, for instance, the analysis of Kilic et al. [23])). When the latter mention varies widely, the total monetary unit of a survey budget and broad cost categories may be less informative for budgeting decisions. We thus illustrate how interview length estimates can be used to provide estimates of unit costs that take into account these operational differences.
First, we combine (i) the paradata on total time spent on the administration of household and individual questionnaires with (ii) the information on survey implementation costs, to create the estimated unit cost for a minute of face-to-face multi-topic survey data collection in Cambodia, Ethiopia and Tanzania. This approach enhances the precision with which country-specific unit costs can be compared.
Second, to estimate the unit cost for a minute of survey data collection, one can divide the total survey budget by the total interview length of the survey. The total adjusted interview length has been cleaned to include only key aspects of the interview process (i.e., certain events are excluded in the time calculation process, as part of the data cleaning process discussed in Section 2.2). The disaggregated survey budgets that we have access to are comparable in terms of the main budget categories, including household listing, piloting, recruitment of staff, training and field practice, fieldwork implementation (including renumeration and transportation costs), and purchases of equipment and office materials.
Table 5
Cross-country cost comparisons
| Ethiopia ESS 2018/2019 | Tanzania NPS 2019/2020 | Cambodia LSMS + 2019/2020 | |
| Unit cost of a minute of interview time (USD in 2019 Prices)* | $1.71 | $3.94 | $0.87 |
| Household interviews | |||
| # of completed interviews | 6,770 | 1,323 | 1,519 |
| # of modules in household questionnaire | 15 | 16 | 11 |
| # of questions in household questionnaire | 418 | 397 | 226 |
| Average duration of a household interview (minutes) | 77 | 120 | 82 |
| Average cost of a household interview | $131 | $472 | $71 |
| Individual interviews | |||
| # of completed interviews | 29,038 | 5,564 | 6,363 |
| # of modules in individual questionnaire | 7 | 8 | 12 |
| # of questions in individual questionnaire | 363 | 382 | 392 |
| Average duration of an individual interview | 13 | 20 | 25 |
| Average cost of an individual interview | $23 | $80 | $22 |
Notes: Unit cost of a minute of interview time is calculated as the ratio of total survey cost and total duration of all completed household and individual interviews in the country. Survey costs include the costs for household listing, piloting, recruitment of staff, training and field practice, fieldwork (field staff salaries and per diems, managerial staff per diems, vehicle rental and maintenance, and fuel), equipment, and office material purchased.
Table 5 reports our cost estimates, in USD at 2019 prices. In Cambodia, the cost of a minute of survey data collection is estimated at $0.87, while the comparable figure is $1.71 in Ethiopia, and $3.94 in Tanzania. One would notice that unit cost estimates are higher in Tanzania relative to the two other countries. This is due to differences in both survey operational costs and variation in modules being implemented in the field (total interview time is fed into the denominator). The total budgets used in the numerator of our calculations are comparable in terms of the broad cost categories. However, they are not strictly comparable since there are differences in fieldwork organization (e.g., reliance on resident enumerators (Ethiopia) versus mobile teams (Cambodia and Tanzania) that affect transportation costs for fuel and vehicle hires). Additionally, both Tanzania and Ethiopia were conducted as part of longitudinal surveys and in Ethiopia this involved household-level tracking while in Tanzania they carried out more intensive individual-level tracking. There are differences in country-specific levels for field staff monthly salaries and per diems and supervisory per diems. These all affect the total survey budget. Both the total survey budget and the total interview time of each country are accounted for in the total unit costs seen above.
One helpful feature of having a unit cost rather than looking at a broad category of a budget is to aggregate the potential cost of adding interviews, modules (or groups of modules), or specific questions. We thus have a more precise estimate of the costs associated with specific types of data collection in future surveys. For example, with the estimated unit cost, we can calculate the average cost of a household interview, which is $71 in Cambodia, $131 in Ethiopia, and $472 in Tanzania. Each additional individual interview per household, on average, costs $22 in Cambodia, $23 in Ethiopia, and $80 in Tanzania. The high operational cost in Tanzania relative to other countries is reflected in these numbers.
4.Interviewer effects on interview duration
Given the connection between interview length and survey costs, survey practitioners also need to consider factors related to fieldwork implementation that may affect interview duration, especially those that can improve the efficiency and quality of surveys with enhanced training and supervision. Interviewers are undoubtedly among these factors.
In view of the central role that interviewers play in face-to-face survey data collection, this section presents results from the analyses that seek to document potential interviewer effects on survey data collection, specifically interview duration. Given the complexity of multi-topic survey data collection that interviewers are entrusted with, interviewers should be subject to rigorous training and field practice to minimize heterogeneity across interviewers in all aspects of data collection from human subjects. If there is significant variation in interview length by interviewer, this could suggest that additional training, field practice and fieldwork supervision may be needed, including a critical evaluation of the interviewer pool and recruitment practices for future surveys. The type of analysis that we showcase can be conducted both during and after survey fieldwork – while the former may lead to additional steps for “course correction” in the context of an ongoing survey, the latter would be useful for decisions regarding future surveys.
In the literature, the term “interviewer effect” has been used to reference interviewer contributions to variations in interview outcomes. Interviewers can contribute to the variability of respondents’ answers, non-response/survey participation, measurement error or bias, and interview length. West and Blom [19] summarize findings concerning interviewer effects, focusing on high-income countries. In low- and middle-income countries, interviewer characteristics such as gender [20, 21] and ethnicity [24] have been found to affect responses. Research has also shown that interviewer characteristics can affect responses to sensitive questions, including those on political preference in Uganda [22], domestic violence in India [25], and abortion (in the context of Demographic and Health Surveys) [26].
The paradata-driven analyses of interviewer effects on survey duration have been limited in low- and middle-income countries until now – in contrast with the numerous applications that have been focused on high-income contexts. The latter category of research has typically relied on multilevel models, which are used for analyzing data with a hierarchical structure or when the data is nested within a larger group (such as responses within a group of interviewers). These models have been used to decompose the contributions of interviewer effects, enumeration area effects, and respondent effects towards the variance in survey duration. In high-income countries, the effects of these variables have overall been quite modest [12].1010 With the increasing availability of CAPI/CATI paradata, there is now an opportunity to undertake similar analyses in low- and middle-income countries.
In what follows, we use the CAPI survey paradata at our disposal and obtain multilevel model estimates to discern interviewer effects on survey duration in Cambodia and Tanzania. Our analysis differs from the previous paradata-powered research, in the sense that we do not model question-level duration but rather focus on module duration and conduct separate analysis for each module. This allows us to contrast results across various modules, currently a significant gap in the literature.
One caveat of conducting the analysis at the module-level is that a general model may not fit well for all modules in the survey because each module is unique and covers a range of different types of questions. Therefore, this exercise should be viewed as an initial step to rank modules by potential interviewer effect that will then need to be examined in more detail. Practitioners should be cautious of using the model for any type of prediction analysis. In the following sections, we will describe our analysis in creating a ranking of interviewer effects using a basic intercept-only model, then discuss related model issues that practitioners should be cautious about; finally, we provide suggestions on how to use the ranking and improve the performance of the model.
4.1Interviewer and enumeration area (EA) hierarchy
Using the data from Cambodia and Tanzania, we analyze a cross-classified multilevel model, given that the interaction between the levels (enumeration areas, household, and interviewer) are crossed. Practitioners should keep in mind that the hierarchy of the fieldwork assignment may affect the chosen specification of the multilevel model. In this section, we describe the hierarchical interview setup across surveys.
Figure 2.
Interviewer assignment structure in Cambodia.
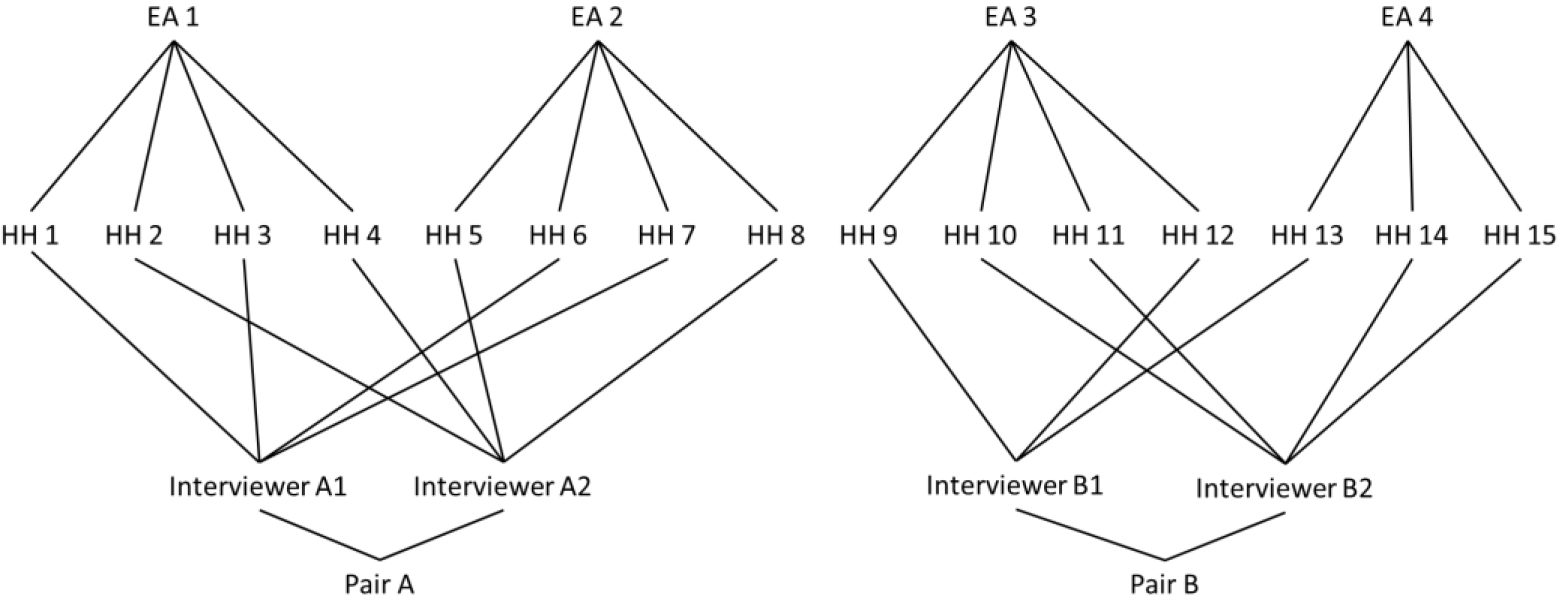
In Cambodia, there were 252 enumeration areas (EA) and 42 interviewers. Each EA was covered by 2 interviewers (one male and one female), and every 2-interviewer pair covered the same 12 areas. Therefore, we have two households from the same area, but interviewed by different people. Each household was assigned to one main interviewer. However, for the administration of the individual-level modules, teams were instructed to match the gender of the enumerator and respondent whenever possible. Figure 2 provides an example of the allocation of interviewers to the area.
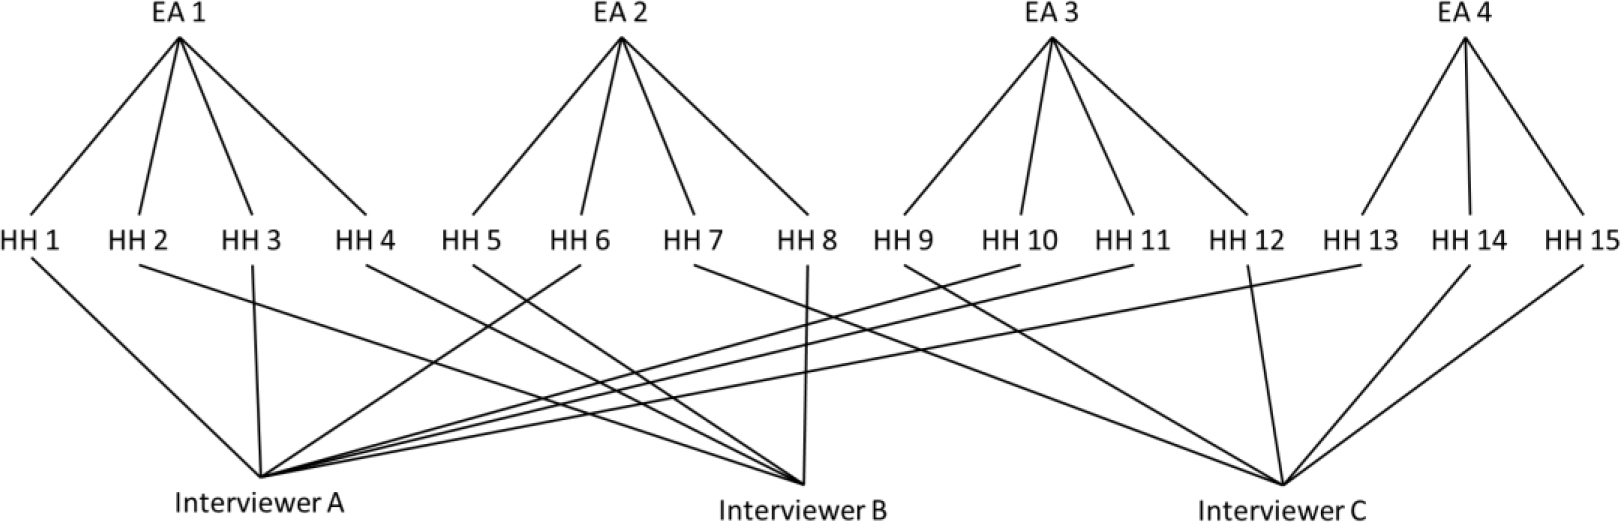
The assignment of interviewers and EAs differs across Tanzania and Cambodia. In Tanzania there were four mobile teams, comprised of one team supervisor and 3 enumerators. This resulted in some EAs having up to 7 interviewers, depending on the number of households located in the area. Since the Tanzania LSMS+ survey is also a panel survey, it involved tracking households that have split-off from their household from previous waves of the survey. As a result, some EAs may have only one household. Figure 3 summarizes the allocation of interviewers to an area.
We do not include Ethiopia in the analysis below, as we would not be able to disentangle the interviewer and area effects. Enumerators in rural Ethiopia were residential enumerators and thus responsible for only one enumeration area; 78% of all interviewers are responsible for only one area with no overlap with other areas. Therefore, our methodology would not be able to conclude whether the variation in interview length is due to the variation in areas or interviewers.
4.2Multilevel model methodology
We estimate a specific multilevel model depending on whether it is an individual or household questionnaire module. The dependent variable for all models is the module duration in minutes. Since we model duration estimates across multiple modules – and to create a preliminary ranking of interviewer effects across modules – our interviewer effect analysis begins with the basic intercept-only model, with random effects for interviewers, enumeration areas, and households – i.e., the hierarchy defined for the multilevel model Eq. (1):1111,1212,1313
(1)
lnyihjk=β+uj+uk+uh+eihjkwhere yihjk is the module duration for individual i in household h living in enumeration area k and being interviewed by interviewer j. β is the intercept term. The model includes three types of random effects: uj is the interviewer random effect, uk is the EA random effect and uh is the household random effect. Lastly, eihjk is the error term. We assume that all the random effects and the residual term are distributed normally and have a constant variance. More specifically, uj∼N(0,σ2j),uk∼N(0,σ2k),uh∼N(0,σ2h) and eihjk∼N(0,σ2e). We focus on a log transformation of the interview length which worked better to fit the normality assumption for the residuals of the model.
For household-level modules, we estimate a similar model without the household random effect Eq. (2). Similarly, all random effects and residuals are assumed to be normally distributed with mean zero and a constant variance.
(2)
lny′hjk=β′+u′j+u′k+e′hjk
Figure 3.
Interviewer assignment structure in Tanzania.
One could also estimate Eq. (3) that builds on Eq. (1) by bringing in fixed-effects of individual (I) and household (H) attributes.
(3)
lnyihjk=β+′′Finally, Eq. (4) is the equivalent of Eq. (2) for the household questionnaire modules but includes controls for household attributes.
(4)
We estimated all our models above in R using the lme4 package, the lmer command, and maximum log-likelihood estimation.1414
Multilevel models allow us to calculate the interclass correlation (ICC). The ICC describes how much of the variation in interview length is attributed to the grouping structure for the module, i.e. the same enumeration area group and the same interviewer group. We use this to assess interviewer effects. For Eq. (1), for example, the ICC interviewer (ICC-I) is shown below. For Eq. (2), the ICC-I will not include the household random effect in the denominator.
Table 6
| a. Multilevel model estimation results from Cambodia | |||||
| Intercept-only model | |||||
| Total variance | Rank | Variance of residual | ICC-I | Rank | |
| Individual modules | |||||
| Time-use | 0.142 | 10 | 0.054 | 0.299 | 1 |
| Financial assets | 0.702 | 4 | 0.419 | 0.150 | 2 |
| Health | 0.490 | 8 | 0.345 | 0.118 | 3 |
| Durables | 0.590 | 6 | 0.306 | 0.106 | 4 |
| Migration | 0.885 | 3 | 0.539 | 0.090 | 5 |
| Land | 1.212 | 1 | 0.859 | 0.085 | 6 |
| Livestock ownership | 0.665 | 5 | 0.418 | 0.068 | 7 |
| Education | 0.487 | 9 | 0.396 | 0.068 | 8 |
| Mobile phones | 0.515 | 7 | 0.343 | 0.061 | 9 |
| Labor | 0.953 | 2 | 0.816 | 0.048 | 10 |
| Household Modules | |||||
| Food consumption | 0.154 | 10 | 0.069 | 0.442 | 1 |
| Non-food consumption | 0.141 | 11 | 0.076 | 0.371 | 2 |
| Housing | 0.159 | 9 | 0.084 | 0.289 | 3 |
| Livestock roster | 0.997 | 3 | 0.669 | 0.151 | 4 |
| Land roster | 0.452 | 5 | 0.331 | 0.123 | 5 |
| Consumer durables | 0.309 | 7 | 0.250 | 0.120 | 6 |
| Apartment roster | 0.475 | 4 | 0.381 | 0.110 | 7 |
| Cover | 0.171 | 8 | 0.144 | 0.093 | 8 |
| Non-farm enterprise | 2.589 | 2 | 1.963 | 0.083 | 9 |
| Household roster | 0.347 | 6 | 0.289 | 0.065 | 10 |
| Children elsewhere | 2.997 | 1 | 2.796 | 0.036 | 11 |
| # of EAs | 252 | ||||
| # of Interviewers | 42 | ||||
| b. Multilevel model estimation results from Tanzania | |||||
| Intercept-only model | |||||
| Total variance | Rank | Variance of residual | ICC-I | Rank | |
| Individual modules | |||||
| Health | 0.317 | 8 | 0.175 | 0.164 | 1 |
| Land | 2.301 | 1 | 1.362 | 0.106 | 2 |
| Financial assets | 0.507 | 5 | 0.307 | 0.082 | 3 |
| Education | 0.429 | 6 | 0.306 | 0.079 | 4 |
| Labor | 0.327 | 7 | 0.244 | 0.066 | 5 |
| Mobile phone | 0.537 | 4 | 0.409 | 0.064 | 6 |
| Subjective wellbeing | 0.773 | 3 | 0.657 | 0.063 | 7 |
| Food from outside | 1.077 | 2 | 0.798 | 0.056 | 8 |
| Household modules | |||||
| Recontact information | 0.100 | 17 | 0.059 | 0.305 | 1 |
| Shocks | 0.650 | 8 | 0.399 | 0.283 | 2 |
| Non-food consumption (weekly/monthly) | 0.166 | 15 | 0.108 | 0.223 | 3 |
| Housing | 0.161 | 16 | 0.088 | 0.215 | 4 |
| Non-food consumption (annual) | 0.186 | 14 | 0.136 | 0.161 | 5 |
| Food consumption | 0.329 | 11 | 0.238 | 0.160 | 6 |
| Food security | 0.258 | 12 | 0.164 | 0.148 | 7 |
| Credit | 1.473 | 3 | 1.182 | 0.139 | 8 |
| Household assets | 0.239 | 13 | 0.173 | 0.118 | 9 |
| Household roster | 0.541 | 9 | 0.388 | 0.099 | 10 |
| Assistance | 0.733 | 6 | 0.589 | 0.098 | 11 |
| Finance | 0.433 | 10 | 0.346 | 0.090 | 12 |
| Land roster | 1.101 | 4 | 0.667 | 0.059 | 13 |
| Anthropometry | 0.721 | 7 | 0.602 | 0.036 | 14 |
| Non-farm enterprise | 3.947 | 1 | 3.422 | 0.031 | 15 |
| Death in the household | 0.928 | 5 | 0.867 | 0.017 | 16 |
| Cover | 2.361 | 2 | 1.409 | 0.009 | 17 |
| # of EAs | 242 | ||||
| # of Interviewers | 14 | ||||
4.3Interviewer effect: Intercept-only model results and discussion
Tables 6a and 6b report our main results. We want to understand how much variance from the interviewer random effect contributes to the total variance in the model. Both tables report the total variance, the variance of the residual, and ICC-I for Eqs (1) and (2). The total variance provides a benchmark of the total of all variance components in the model (the denominator for ICC-I) while the variance of the residual gives us a benchmark magnitude of the contribution of the error term in the model.
Table 6a and 6b rank modules by ICC-I. In Cambodia, interviewer effects measured by ICC-I range from 4.8% to about 30% for individual questionnaire modules, and 3.6% to 44% for household questionnaires. Within this survey, household modules with the highest interviewer effects are food and non-food consumption, as well as housing – and among individual modules, livestock ownership, time use, and financial assets. In Tanzania, ICC-I ranges from 5% to 16% for individual questionnaires (with the highest interviewer effects for health and land ownership) and from 1% to 30% for household questionnaires (with the highest interviewer effects for recontact information, shocks, housing, and non-food consumption). Importantly, within each survey, modules were conducted by the same set of interviewers. The fact that some modules have higher ICC-I thus points to potential interviewer difficulty in administering some modules compared to others.
Overall, compared to studies from higher-income contexts using multilevel models, the contributions of interviewer effects to the variance of interview length are much higher in our surveys of interest. Couper and Kreuter [12], for example, using data from cycle 6 of the National Survey of Family Growth, and with question-level observations, found that interviewer and respondent effects account in total for at most 7 percent of the total variance in interview length.15 To our knowledge, module-level comparison of ICC-I as in our study has not been examined in the literature, and our findings are consistent with other developing-country studies [20, 21, 22] showing that the interviewer effects can be large – although those results were obtained using different methodologies and did not include interview length as the outcome of interest.
The module-specific findings reveal a few insights that are consistent across the two countries. Consumption and housing modules, for example, consistently are among the highest ICC-I. As discussed earlier, the household food and non-food consumption modules rank high in terms of average interview length (close to half an hour). The ICC-I further indicates that a large share of the total variation in interview length is due to interviewer effects (about 16% to 22% in Tanzania and 37% to 44% in Cambodia). This result is not surprising, given the complexity of the consumption modules, where interviewers ask respondents on the purchased quantities of individual items (in Tanzania, for example, there are more than 50 categories for food consumption, with different unit measures depending on the item) as well as the monetary value. The recall burden of such questions can, as a result, lead to greater interviewer effects. These results point to important areas where interviewer training efforts could be better focused, given the complexity of such modules.
Housing is another household module that consistently ranks high in ICC-I for the two countries (22% in Tanzania and 29% in Cambodia). This module typically covers detailed questions about housing construction and access to facilities, including the type of building material; sources of water, electricity, and fuel in or near the household; and sanitation. The range of different issues covered in this module may be one reason why interviewer-related factors (including experience and familiarity with different housing-related issues) may matter more. Within the LSMS+ surveys, household modules were also asked of one “most knowledgeable” respondent. This may make interviews more challenging, then, for modules such as housing and consumption with greater topic heterogeneity – when in reality multiple household members, as opposed to one, may be knowledgeable about different household facilities and infrastructure, as well as purchases/consumption across food and non-food items.
For individual modules, health and financial asset modules also rank somewhat higher in ICC-I for both countries, as compared to other modules. Some recent studies, while not looking at interview length per se, point to how questions and modules that might trigger greater respondent sensitivity are linked with greater interviewer effects as measured by ICC-I. In a study from Germany, for example, Essig and Winter [28], find that nonresponse to financial asset questions is reduced with greater interviewer experience. Sharma et al. [29], in a study from northern India, also find that interviewer effects are high when examining whether certain maternal and child health questions were skipped in the National Family Health Survey. Given the limited research on module specific interviewer effects, particularly on interview length, further investigation is needed into potential reasons for the high ICC-I for different modules.
Regarding country-specific insights, we find that the ICC-I for the time use module conducted in Cambodia is quite high (30%). The time use module was administered for the first time that year and there were differences in how the module was administered by interviewers. Due to the complexity of the module, some interviewers were entering responses directly into CAPI , while others were first administering the module on paper. These various modes of administration also could potentially explain the large ICC-I seen in the results. In Tanzania, recontact information and shocks also ranked high in ICC-I.
In our results, we also observe that interviewer effects tend to be higher in Cambodia than in Tanzania. One potential explanation could be differences in the approach to enumerator training between the two countries. The trainings in both countries were backstopped by English-speaking experts that provided additional emphasis and details to the material that is covered by local NSO staff. However, in Tanzania, all interviewers spoke English as a second language, but this was not the case in Cambodia. Thus, in Cambodia, interviewers were trained through a translator and the direction of communication was more one-way from the experts to the interviewers.
Our hypothesis about the high ICC-I in the time use module and differences in communications during training causing differences in ICC-I still need to be investigated further in future research. Randomizing survey methodologies, for example, and collecting paradata on the different approaches may help shed greater light on the underlying factors driving higher interviewer effects.
From the overall discussion above, we suggest that, when providing training to interviewers, survey practitioners should pay attention to the (i) the mode of administering the survey (CAPI versus paper-based, for example); (ii) specific questions where the interviewer’s understanding of the question and delivery could elicit different responses from respondents; (iii) question complexity, including the range of different topics covered in the module, that might affect a single respondent’s ability to accurately recall (with greater effort needed, as a result, on the part of the interviewer); (iv) potential sensitivity; and, relatedly, (v) factors affecting interviewer training (how information was presented and communicated for different modules). These issues may be particularly pronounced in lower-income contexts as well, where lower literacy and numeracy are likely to affect reported quantities, prices, asset values and time.
4.4ICC-I rankings: Practical considerations
Survey practitioners can use this initial ranking as a starting point to investigate whether certain modules require further investments such as additional interviewer training or changes in survey design or fieldwork operations. Results will vary by country context and fieldwork organization; as discussed above, some modules across the Cambodia and Tanzania surveys, such as consumption and housing, both have high ICC-I rankings, but other high-rank modules are more country specific.
The module’s total variance ranking also provides valuable information to complement the ICC-I ranking. Modules with a smaller total variance may be of a lower priority to practitioners relative to those with a larger total variance but lower ICC-I ranking. For example, in Cambodia, the time use module has the highest ICC-I among individual modules, where 30% of the total variance is due to the interviewer. The total variance, however, is ranked last. Instead, one might decide on investigating and improving the financial asset module, migration, and land for the individual module in Cambodia given that their total variance is much higher, and thus the interviewer effect is relatively larger in these modules compared to the time use module, for example.
For the household modules, a very large ICC-I is observed in the food consumption module, a 44% contribution to total variance. Despite the lower ranking of the total variance, we may still want to flag this module to prioritize. Given the importance of the consumption modules for consumption-based monetary poverty and inequality measurement in these contexts, minimizing the extent of interviewer effects in the administration of these modules can have non-negligible implications for the quality of survey data on demographics, poverty and inequality.
4.5Nuances in model fit
As discussed earlier in the motivation for using an intercept-only model, each module has a different structure of questions and implementation, making it difficult to create a complex model that fits all modules. Because of this, practitioners should consider checking the fit of the model after receiving the preliminary ranking to see whether it would be useful to extend the model for a particular module and adjust the interpretation of the rankings based on module-specific modifications. Practitioners should pay attention to whether the residuals are normally distributed, for example, as well as the random effects. Investigating these issues also provides valuable information on the complexity of a specific module.
Figure 4.
Distribution of Residuals Selected Household Modules – Tanzania.
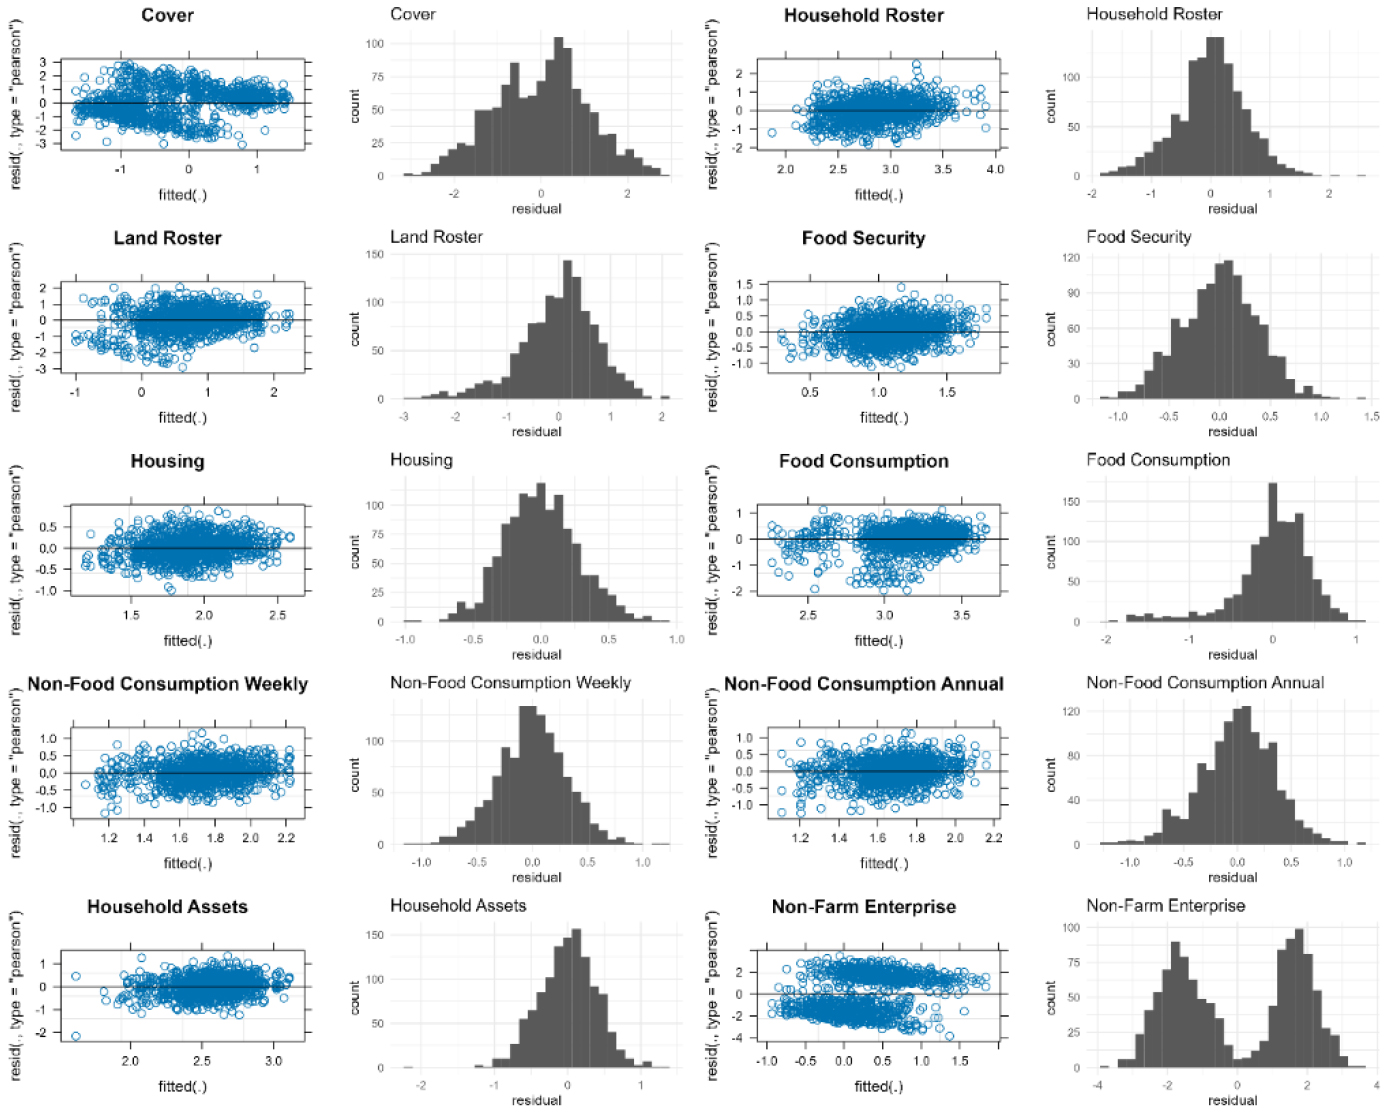
As an example, we illustrate issues with model fit for intercept-only household modules in Tanzania, with suggestions on ways forward. Figure 4 presents the distribution of residuals for selected household modules in Tanzania to check whether the normality assumption is violated. This assumption appears to hold overall, although we do observe some skewness in some modules, such as food consumption and household assets (likely due to outliers). One may not necessarily want to delete outliers, however, because outliers do happen in the field and should be part of survey burden analysis. The goal of the analysis therefore needs to be considered when making these decisions.
Figure 5.
Interviewer Random Effects Normal Q-Q Plots for Select Household Modules – Tanzania.
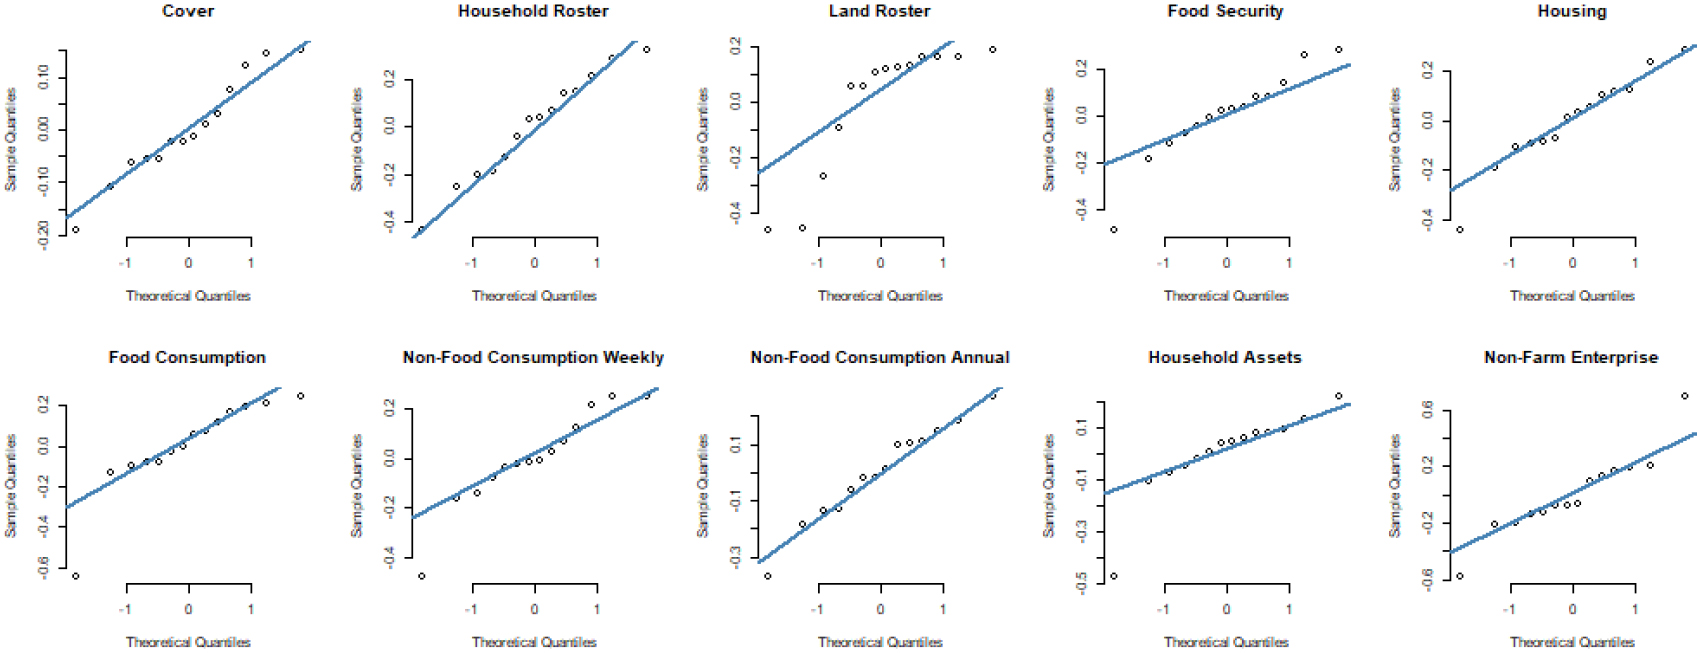
Another potential concern on model fit is the assumption that interviewer random effects are distributed normally when we have a small number of interviewers. This is the case in Tanzania where we have only 14 interviewers across 252 enumeration areas. The 14 interviewers do generate enough variation, which can be seen in histograms of the interviewer random effect (Fig. 5). Given the small number of observations, we do see that some modules are not normally distributed, such as the land roster.
Table 7
Multilevel model results for Cambodia select modules
| Food consumption | Non-food consumption | |||
|---|---|---|---|---|
| Predictors | Estimates | Estimates | ||
| (Intercept) | 2.77 | 2.16 | ||
| Rural | 0.02 | 0.548 | 0.02 | 0.399 |
| House number rooms | 0.01 | 0.195 | 0.00 | 0.974 |
| Household head is female | 0.06 | 0.258 | 0.09 | 0.092 |
| Highest year of education in household | 0.01 | 0.242 | 0.02 | 0.014 |
| Household size | 0.06 | 0.06 | ||
| Household has electricity | 0.03 | 0.147 | 0.05 | 0.018 |
| Second quantile in non-food consumption (First omitted) | 0.09 | 0.08 | ||
| Third quantile in non-food consumption | 0.08 | 0.11 | ||
| Forth quantile in non-food consumption | 0.16 | 0.21 | ||
| Fifth quantile in non-food consumption | 0.14 | 0.28 | ||
| Total variance | 0.14 | 0.12 | ||
| Variance of residual | 0.06 | 0.06 | ||
| ICC Interview | 0.46 | 0.38 | ||
| N | 42 Interviewers | |||
| 252 Enumeration Areas | ||||
| Observations | 1512 Households | |||
Figure 6.
Histogram of Residual for Non-Farm Enterprise Household – Tanzania.
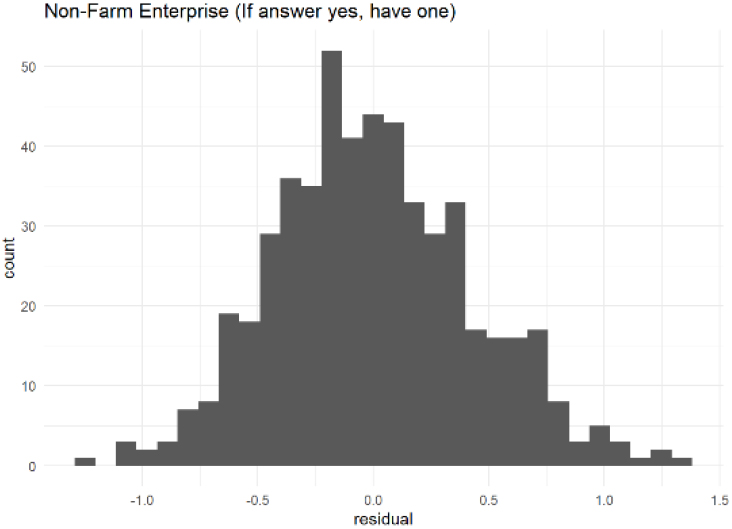
Lastly, some modules exhibit residuals that are bimodally distributed. This is the case, for example, for the household non-farm enterprise module in Tanzania (Fig. 5). This pattern is typically caused by a group of respondents answering one set of questions in a module (enabled by a filter question) and not others.1515 For example, all households in Tanzania were asked whether they own a non-farm enterprise. If they answered no to this module (about 56 percent of households), additional questions about the non-farm enterprise were not asked. Practitioners could consider adding covariate to the intercept-only model (variable related to the filter questions) or restricting the sample to a smaller group of interest (only to those who answer yes to owning an enterprise, for example) which will solve the issue (Fig. 6 presents the resulting residuals of this modification for the Tanzania nonfarm enterprise module).
4.6Adding covariates to the model
One could extend the model to include covariates (Eqs (3) and (4)) to see if certain covariates correlate with an increase or decrease of interview time and provide better model fit. Adding certain covariates, however, may improve fit for certain modules but can also worsen model fit so practitioners should be cautious when adding a general set of covariates for all modules.
As an example, we estimate Eq. (3) using the modules for non-food and food consumption in Cambodia (which had the highest ICC-I, about 30%). The set of covariates include whether the household is in a rural area, household size, whether the household head is female, number of rooms in the household, whether the household has electricity, highest years of education attained by any member in the household, and an indicator variables on the quantile of non-food consumption as a proxy for income group. Covariates that are continuous variables were demeaned before we included them in our model.
The results are shown in Table 7. In both modules, adding covariates does improve the model fit, which we checked by comparing the AIC. The total variance has decreased due to the improved model fit. Additionally, the overall conclusions on the magnitude of the ICC-I have not changed. This is expected as we have not added interview-level covariates, which could have influenced the magnitude of the ICC-I much more. The ICC-I increased slightly from 44% to 46% for food consumption and 37% to 38% for non-food consumption.
In Table 7, we see that certain covariates correlate with a longer module time. The coefficients on rural area, number of rooms in the household, female headed household, and highest level of education in the household were not statistically significant. An increase in household size as well as income is associated with higher interview times, likely because these households have greater consumption and thus answered more questions in the module. Depending on the interest of the survey practitioner, various covariates can be added to improve model precision of the model and understand how these covariates relate to interview time.
5.Conclusions
Our study highlights the power of paradata in generating operationally relevant insights to assist in designing household surveys and improve the quality of survey data collection in low- and middle-income countries. The analysis uses timestamped paradata for nationally representative household surveys implemented by NSOs in Cambodia, Ethiopia and Tanzania, between 2018 and 2020. Each survey coupled a multi-topic socioeconomic household questionnaire with an individual questionnaire, the latter of which focused on one-on-one, private interviews with adult household members, and elicited in-depth individual-level data on a range of topics, with a strong focus on labor and asset ownership. Our paper conducts a range of analyses related to interview length, yielding estimates at the module-, individual-, and household-level; unit cost estimates as a function of interview length and total survey budget; as well as a ranking of interviewer effects estimates based on variation in module duration.
Module duration estimates constitute useful reference points for survey practitioners aiming to conduct similar data collection in comparable contexts. Often, the decision concerning whether to include an additional module or an additional person to interview depends on how this would affect overall interview burden and overall cost. Due to the disaggregated nature of paradata, the smallest unit of analysis is an “event” which provides the time a specific question is asked and therefore allows us to construct various measures of interview length at the module, individual, and household levels. We provide duration estimates for each module per country, as well as an estimate of average total time an interviewer spends asking questions from the household questionnaires, which ranges from 82 minutes in Cambodia to 120 minutes in Tanzania. The household food consumption module has the longest duration, on average, ranging from 22 to 26 minutes, depending on the country. Additional high duration household modules include non-food consumption, housing, and the household roster. Going forward, one could potentially conduct an analysis at the question level to investigate ways to improve module efficiency, balancing module duration with the amount of information extracted.
Furthermore, combining the paradata with the total survey budgets allows us to provide estimates of each minute of survey data collection. For instance, the unit cost estimate is $1.71 in Ethiopia, implying that the administration of the socioeconomic household questionnaire to a sampled household would cost, on average, $131, and that the administration of the multi-topic individual questionnaire to an adult household member would cost, on average, $23. Constructing the unit cost estimate per minute of data collection promotes comparability in cost estimation given the cross-country differences in questionnaire design, unlike previous attempts that had to report, due to lack of paradata, country-specific cost estimates per completed interview. This approach also allows for a consistent cost assessment across countries of specific modules and questions. The resulting estimates are helpful for understanding the budget implications of questionnaire design decisions for future surveys.
Finally, we use the paradata to measure interviewer effects on variation in interview duration. Multilevel models permit the estimation of the ICC-I – which, through its decomposition, allows us to capture the extent to which the residual variation in module duration is attributable to interviewers. Household and individual questionnaire modules that had a relatively high ICC-I ranking may benefit from additional interviewer training, fieldwork supervision, and data quality monitoring. The ICC-I results, in particular, point to some priority areas that might benefit from additional interview training, particularly with lower literacy and numeracy in low-income contexts. This includes the complexity and variety of topics, including quantities, prices, and different areas of household facilities infrastructure (as with the household consumption and housing modules); potential sensitivity of questions (as with financial assets and health); as well as the survey mode. Each module, however, is unique, and caution is warranted when interpreting the preliminary ICC-I ranking results, particularly given priorities over data collection.
Overall, our findings reveal important insights from survey paradata on module development and implementation, in otherwise understudied low- and middle-income contexts. The type of analysis conducted in this paper can be considered by NSOs and survey practitioners for several applications. This includes high-frequency and disaggregated insights regarding respondent burden, as well as identification of priority modules with elevated interviewer effects in duration analysis – such that timely training and field supervision measures that can be deployed to minimize these effects during ongoing surveys. This is particularly important in the context of large-scale household surveys in low- and middle-income contexts that can span up to 12 months. Doing so also aligns well with recent calls for building NSO technical capacity in the use of paradata for household survey design, management, and quality control [7].
Notes
2 Several indicators for the Sustainable Development Goals (SDGs) require individual-disaggregated survey data, including SDG 1.4.2 (the proportion of total adult population with secure tenure rights to land, with legally recognized documentation and who perceive their rights to land as secure, by sex and by type of tenure), SDG 5.a.1 (a) (the proportion of total agricultural population with ownership or secure rights over agricultural land, by sex), and SDG 5.a.1 (b) (the share of women among owners or rights-bearers of agricultural land, by type of tenure), SDG 5.b.1 (the proportion of individuals who own a mobile telephone, by sex); SDG 8.10.2 (the proportion of adults (15 years and older) with an account at a bank or other financial institution or with a mobile-money-service provider, by sex). Research has revealed the importance of eliciting self-reported survey data collected in private interviews for the accurate measurement of these and related indicators [2, 5, 6].
3 Since the implementation of the surveys that inform our analyses, Survey Solutions issued multiple updates that also have a bearing on the paradata file structure. While researchers may not be able to leverage our syntax files with ease for the purpose of analyzing their own Survey Solutions paradata, our syntax files can be made available upon request. Our paradata, however, cannot be shared, as they contain confidential information that is excluded from the public use survey datasets.
4 Each survey was supported by the World Bank Living Standards Measurement Study – Plus (LSMS+) project, which was established in 2016 to improve the availability and quality of individual-disaggregated survey data on key dimensions of men’s and women’s economic opportunities and welfare. For more information, please visit www.worldbank.org/lsmsplus.
5 The variable “parameters” is important since it consists of key information concerning the event. For example, for an AnswerSet event, the parameters value contains the question that is answered, what was the answer, and who answered the question. In some cases, there are multiple IDs in the paradata to uniquely distinguish specific assets or agricultural plots. Parsing these types of information allows for a richer set of analysis at the question-level or respondent-level.
6 Some events were deleted during the data cleaning process which explains the missing numbers in order.
7 For detailed information regarding the Survey Solutions paradata file format and the comprehensive descriptions of events, please visit: https://docs.mysurvey.solutions/headquarters/export/paradata_file_ format/.
8 The removed outliers mostly constitute events that are recorded as the entry of a comment, or an interviewer being assigned to a given household. Additionally, there were rare timestamp entries that were not entered subsequently and thus created very large interview time. These were excluded as well during the trimming. After the trimming, means were quite close to the median indicating the data is more centered than before the trimming. In their analysis, Couper and Kreuter [12], remove “outlier” events with negative or zero response times or with response times that are higher than 2 standard deviations above the mean. This trimming would have been quite conservative in our case, corresponding to only 0.001 to 0.04 percent of events being deleted, depending on the country.
9 Although most questions within modules are comparable across-countries, the survey designer can modify or add questions that are of interest to the country and fit more with the country’s context. Given this, not all questions across countries are created the same and there might be some variation.
10 Couper and Kreuter [12], for example, found that the interviewer variable contributes to less than 2 percent of the variation in interview-length while the respondent variable contributes about 3.8 to 6.3 percent, depending on the model. Most of the variation is at the question-level – about 96 percent, again depending on the model. The authors noted that this result is consistent in the literature and thus one should expect that interviewer and respondent contribution to not impact survey time much when conducting fieldwork.
11 One could extend the model to make it more complex, but there is a tradeoff between using a general model to estimate a rank of interviewer effects versus creating a specific model that fits well for a given questionnaire module.
12 For further descriptions of multilevel models, see Gelman and Hill [27].
13 The main objective of the surveys that inform our research was not in analyzing interviewer effects – as such, the interviewers were not randomly assigned to sampled households and individual interview targets. Following common practices in large-scale household surveys, NSOs considered regional language requirements in composing field teams that were in turn assigned to regions with matching language profiles. While there may be unobserved variables that may confound our analyses, given the lack of randomized assignments of interviewers to sampled households and individual interview targets, we prioritize the discussion of the results from the estimations that control for observable individual- and household-level attributes.
14 R-scripts are available to use for replicating our analysis on any Survey Solutions paradata. Contact author for further details.
15 We also observe this pattern for several modules in Cambodia (children living elsewhere, household non-farm enterprises, and the household livestock roster).
Acknowledgments
The authors thank the editor and anonymous reviewers at the SJIAOS as well as James Arthur Shaw for their valuable comments.
References
[1] | FAO, World Bank, UN-Habitat. Measuring Individuals’ Rights to Land: An Integrated Approach to Data Collection for SDG Indicators 1.4.2 and 5.a.1. Washington, DC: World Bank; (2019) . Available from: https://openknowledge.worldbank.org/handle/10986/32321. |
[2] | Hasanbasri A, Kilic T, Koolwal G, Moylan H. LSMS+ Program in Sub-Saharan Africa: Findings from Individual-Level Data Collection on Labor and Asset Ownership. Washington, DC: World Bank; (2021) . |
[3] | ILO. Report III: Report of the Conference, 20th International Conference of Labour Statisticians (Geneva, 10–19 October 2018), International Labour Office, Department of Statistics, Geneva; (2018) . |
[4] | United Nations. Guidelines for Producing Statistics on Asset Ownership from a Gender Perspective. (2019) . Available from: https//unstats.un.org/edge/publications/docs/Guidelines_final.pdf. |
[5] | Kilic T, Moylan H, Koolwal G. Getting the (Gender-Disaggregated) lay of the land: Impact of survey respondent selection on measuring land ownership and rights. World Development. (2021) ; 146. |
[6] | Kilic T, Broeck G, Koolwal G, Moylan H. Are You Being Asked? Impacts of Respondent Selection on Measuring Employment in Malawi. Journal of African Economies. (2022) . |
[7] | Carletto C, Chen H, Kilic T, Perucci F. Positioning household surveys for the next decade. Journal of the International Association for Official Statistics. (2022) ; 38: (3): 923-946. |
[8] | Gourlay S, Kilic T, Martuscelli A, Wollburg P, Zezza A. High-frequency phone surveys on COVID-19: good practices, open questions. Food Policy. (2021) ; 105: : 102153. |
[9] | Couper M. Measuring survey quality in a CASIC environment. Proceedings of the Survey Research Methods Section of the ASA at JSM (1998) ; 41-49. |
[10] | Kreuter F. (eds.) Improving surveys with paradata: analytic uses of process information. Hoboken, New Jersey: John Wiley & Sons, Inc: (2013) . |
[11] | Choumert-Nkolo J, Cust H, Taylor C. Using paradata to collect better survey data: Evidence from a household survey in Tanzania. Review of Development Economics. (2019) ; 23: (2): 598-618. |
[12] | Couper M, Kreuter F. Using paradata to explore item level response times in surveys. Journal of the Royal Statistical Society: Series A (Statistics in Society). (2013) ; 176: : 271-286. |
[13] | Gordeev VS, Akuze J, Baschieri A, Thysen SM, Dzabeng F, Haider MM, Smuk M, Wild M, Lokshin MM, Yitayew TA, Abebe SM, Natukwatsa D, Gyezaho C, Amenga-Etego S, Lawn JE, Blencowe H, Every Newborn-INDEPTH Study Collaborative Group. Paradata analyses to inform population-based survey capture of pregnancy outcomes: EN-INDEPTH study. Population Health Metrics. (2021) ; 19: : 10. |
[14] | Jans M, Sirkis R, Schultheis C, Gindi R, Dahlhamer J. Comparing CAPI trace file data and quality control reinterview data as methods of maintaining data quality. American Statistical Association Proceedings of the Survey Research Methods Section. (2011) . Available from http//www.asasrms.org/Proceedings/y2011/Files/300407_64067.pdf. |
[15] | Kreuter F, Couper M, Lyberg L. The use of paradata to monitor and manage survey data collection. In Proceedings of the joint statistical meetings, American Statistical Association (pp. 282-296). Alexandria, VA: American Statistical Association: 2010. |
[16] | Kreuter F, Olson K. Paradata for nonresponse error investigation. Improving Surveys with Paradata: Analytic Uses of Process Information. (2013) ; 2: : 13-42. |
[17] | Murphy JJ, Chew R, Biemer PP, Duprey MA, Harris KM, Halpern CT. Interactive visualization to facilitate monitoring longitudinal survey data and paradata. (2019) ; Available from: wwwncbi.nlm.nih.gov/books/NBK545492/. |
[18] | Virgile M. Measurement error in American Community Survey paradata and 2014 redesign of the contact history instrument. United States Census Bureau Research Report Series: Survey Methodology. (2016) ; 01. |
[19] | West BT, Blom AG. Explaining interviewer effects: A research synthesis. Journal of Survey Statistics and Methodology. (2017) ; 5: (2): 175-211. |
[20] | Flores-Macias F, Lawson C. Effects of interviewer gender on survey responses: Findings from a household survey in Mexico. International Journal of Public Opinion Research. (2008) ; 20: (1): 100-110. |
[21] | Vollmer N, Singh M, Harshe N, Valadez, JJ. Does interviewer gender influence a mother’s response to household surveys about maternal and child health in traditional settings? A qualitative study in Bihar, India. Plos One. (2021) ; 16: (6). |
[22] | Maio MD, Fiala N. Be Wary of Those Who Ask: A Randomized Experiment on the Size and Determinants of the Enumerator Effect. The World Bank Economic Review. ((2020) ); 34: (3): 654-669. |
[23] | Kilic T, Serajuddin U, Uematsu H, Yoshida N. Costing Household Surveys for Monitoring Progress Toward Ending Extreme Poverty and Boosting Shared Prosperity. World Bank Policy Research Working Paper 7951; (2017) . |
[24] | Adida CL, Ferree KE, Posner DN, Robinson AL. Who’s asking? Interviewer coethnicity effects in African survey data. Comparative Political Studies. (2016) ; 49: (12): 1630-1660. |
[25] | Singh A, Kumar K, Arnold F. How interviewers affect responses to sensitive questions on the justification for wife beating, the refusal to have conjugal sex, and domestic violence in India. Studies in Family Planning. (2022) ; 53: (2): 259-279. |
[26] | Leone T, Sochas L, Coast E. Depends who’s asking: Interviewer effects in demographic and health surveys abortion data Demography. (2021) ; 58: (1): 31-50. |
[27] | Gelman, A, Hill J. Data Analysis Using Regression and Multilevel/Hierarchical Models (Analytical Methods for Social Research). Cambridge: Cambridge University Press: (2006) . |
[28] | Essig L, Winter JK. Item non-response to financial questions in household surveys: An experimental study of interviewer and mode effects. Fiscal Studies. (2009) ; 30: (3-4): 367-390. |
[29] | Sharma R, Dwivedi LK, Jana S, Banerjee K, Mishra R, Mahapatra B, Sahu D, Singh SK. Survey implementation process and interviewer effects on skipping sequence of maternal and child health indicators from National Family Health Survey: An application of cross-classified multilevel model. SSM – Population Health. (2022) . |

