
Overview of discrimination in Cameroon in 2014: Between perception and experience, predominance of the phenomenon
Abstract
This article analyses discrimination in Cameroon based on data from the Governance, Peace and Security (GPS) module of the Strategy for Harmonization of Statistics in Africa (SHaSA). The data from this module were collected during the fourth Cameroon Household Survey (ECAM4), the main aim of which was to determine the profile of income poverty in Cameroon in 2014. The analysis highlights the forms of discrimination observed in Cameroon in 2014, the characteristics of people who are victims of discrimination and the determining factors of discrimination. Measuring discrimination using subjective and objective approaches shows a very high level both generally and in relation to law enforcement agencies. Discrimination relating to economic status (poverty or wealth) is the most widespread form. Certain forms of discrimination experienced are based on human capital, regional particularities and specific individual characteristics. This article suggests pathways to better target actions to fight against discrimination in all its forms, and thereby “to promote and enforce non-discriminatory laws and policies for sustainable development”, Target 16.b of the Sustainable Development Goals (SDGs).
1.Introduction
Discrimination is not a new phenomenon, although it has changed with time. This type of unequal treatment of individuals within a society was originally based on a single criterion such as race, gender, religion, disability, minority status, etc. However, over time, it has taken other forms and its targets are no longer as identifiable. Based on this situation, Law No 96-06 of the 18
In its quest to drive development and consolidate national unity, Cameroon has drawn up its development vision entitled Cameroon Vision 2035 [3], the objective of which is to ensure that Cameroon becomes an emerging country by 2035. The elements relating to the implementation of the first phase of this vision, for the period 2010–2020, are contained in the Growth and Employment Strategy Paper (GESP) [4]. The country’s progress towards this objective has been impeded over recent years by crises marked by attacks of the terrorist group Boko Haram in the North of the country and by political demands reflecting the secessionist desires of the Northwest and Southwest regions of Cameroon.
Although the GESP states the efforts regarding other social policies, it rather also highlights the weaknesses associated with the improvement of the living conditions of population groups that are victims of discrimination or exclusion. The country adopted the 2030 Agenda for the Sustainable Development Goals (SDGs) [5], target 16.b of which relates to the promotion and enforcement of non-discriminatory policies. To date, no analysis on the level of discrimination based on data collected in 2014 from a representative sample of adults at national level has been carried out in Cameroon. However, these data enable us to calculate SDG Indicator 16.b.1, namely the proportion of persons who reported having personally been threatened or harassed in the last 12 months for reasons of discrimination contrary to international human rights. In order to strengthen national unity and consolidate its democratic process, as specified in the Growth and Employment Strategy Paper (GESP), it is essential to be able to measure the phenomenon of discrimination in Cameroon.
This study aims to analyse perceptions and experiences of discrimination of persons aged 18 or more, by highlighting the forms of discrimination and its determining factors. Section 2 of this article is dedicated to a short literature review. Section 3 presents the data and the methodology used. The results are then presented and discussed in the Section 4 before finishing with a conclusion in Section 5.
2.Literature review
There are very few studies that address the issue of discrimination in Cameroon. One attempt to analyse discrimination on the Cameroonian labour market based on ethnicity did not prove to be entirely conclusive [6]. Indeed, in that study, the author concludes that it is not possible to determine whether ethnicity constitutes a possible factor of discriminatory practices by employers. Using the gain function analysis, wage gaps on the labour market could not be attributed to ethnicity.
On a different note, a UN report [7] for West and Central African countries, shows that “people living with HIV very often suffer helplessly from discrimination and stigmatisation due to fear and shame”. But at the same time, the study on the rights of persons with disabilities [8] in Cameroon shows that 29% of the disabled respondents reported attitudes leading to discrimination and 7% declared that they suffered discrimination by public authorities. In that study, 95 interviews were successfully conducted among 100 disabled persons living in one of the following three cities: Yaounde (48), Bafoussam (35) and Bamenda (17).
The study by the non-governmental organisation “Cercle de recherche sur les droits et les devoirs de la personne humaine” [9], based on a sample of 724 persons from the South, South West and Centre regions highlights discrimination based on ethnicity (28.9%), economic criteria (18.5%) and social status (27.3%) as the most widespread forms in Cameroon. Furthermore, individuals (61.2%) are relatively more likely discrimination perpetrators than public authorities (23.3%) and public institutions (14.8%).
Analysing gender and labour market participation using the Blinder-Oaxaca decomposition, Ekamena Tsama et al. [10] observe gender differentials on the labour market and highlight that inequalities based on gender are real in Cameroon. In another study, in addition to wage discrimination between men and women, Ekamena Tsama [11] also notes that women experience professional segregation in Cameroon. Using the same Blinder-Oaxaca decomposition method based on data from the National Social Security Fund (CNPS) contributor files, Etoundi et al. [12] confirm the existence of salary discrimination against women on the Cameroonian labour market. Analyzing gender pay gaps in companies in Cameroon, Miamo [13] comes to the conclusion that the effect of discrimination fades as moving up the pay scale. Even for those who are looking for a job, discrimination based on diploma and sex are noted according to Ndifen [14]. In another aspect, examining the question of the schooling of children in the southern region of Cameroon, Abe [15] reveals the discrimination to which the pygmies are victims.
In some cases, a single individual is the victim of several forms of discrimination. To that end, Becuwe et al. [16] recall that Crenshaw, at the end of the 1980s, introduced the concept of multiple discrimination, which occurs when one individual is discriminated on the basis of several criteria. Furthermore, indirect discrimination must also be considered. On its website, the French Senate11 highlights the distinction between direct discrimination (treating a person less favourably on the grounds of one criterion (gender, age, social class, etc.)) and indirect discrimination (application of a provision that is seemingly benign but which actually is disadvantageous to a certain group). Miendjiem [17] gives an example of indirect discrimination through the phenomenon of “ethnic crowding” in certain State structures, in which the preferential means of accessing employment is through family relations. He highlights that, despite the fact that the law is not grossly discriminatory, grey areas persist in the fight against discrimination. Indeed, Cameroon has adopted various conventions or declarations developed by the United Nations to eliminate various forms of discrimination, but the law is not precise enough in certain areas to effectively prevent their existence.
In terms of measuring the phenomenon, Delattre et al. [18] set out two further approaches: indirect assessment and perceived discrimination. According to the authors, the indirect assessment of discrimination is based on a statistical finding of inequality between two populations, while the subjective approach allows us to establish discrimination on the basis of the perceptions of respondents. Alongside these concepts and methods, there is also the objective approach that makes it possible to measure experienced discrimination on the basis of statements made by respondents.
Duguet et al. [19] mention the difficulties encountered by researchers in measuring and analysing discrimination. Here, the objective of the Praia Group, a United Nations Statistics Division (UNSD) city group set up in March 2015, is to encourage countries to produce statistics based on sound and documented methodologies [20]. The Handbook on Governance Statistics presented by this group provides clarifications that supplement the definition of discrimination and its measurement, as well as direct and indirect discrimination. Furthermore, the indicator used by the SDGs for measuring this dimension is Indicator 16.b.1 on the proportion of the population reporting having personally felt discriminated against or harassed in the previous 12 months on the basis of a ground of discrimination prohibited under international human rights law. The working group recommends using the household surveys to produce this indicator, which is based on the first dimension of governance entitled non-discrimination and equality.22 The report analysing the GPS-SHaSA module of the National Institute of Statistics of Cameroon [21], which follows the work of the working group, specifies that 61.1% of people aged 18 or over living in Cameroon have been victims of at least one form of discrimination (based on gender, economic status, religion, albinism, ethnicity, regional origin, etc.) in the 12 months preceding the survey in 2014. Given its magnitude, a more in-depth analysis of the characteristics of this phenomenon needs to be carried out.
3.Data and methodology
3.1Sources of data
The GPS-SHaSA initiative aims to harmonise the data collection instruments of the Governance, Peace and Security (GPS) module in order to facilitate comparisons of the statistics produced by the nations of the African Union [22, 23]. The data used for this article come from the GPS-SHaSA33 module, which was attached to the fourth Cameroon Household Survey (ECAM4) carried out in 2014 [24]. The ECAM4 sample was representative both at national level and at the level of the survey region44 coupled with the residence stratum (urban, semi-urban or rural). One in two households was selected to be part of the GPS module sample. Within the households chosen in this way, one person aged 18 or older was selected using the Kish table in order to be administered the GPS-SHaSA questionnaire. In total, 5044 people aged 18 or older were selected as part of the sample and 4926 people responded fully to the interview, thus a response rate of 97.6%. The data collected are representative at national and regional level by residence (urban/rural). The GPS-SHaSA module enabled us to collect data on the opinions and experiences of the individuals in terms of 10 forms of discrimination (see below) in general and in terms of those committed by law enforcement agencies in particular. Furthermore, the module provides data on respect for human rights and on certain characteristics of democracy, as well as on individual characteristics and monetary poverty [26].
3.2Methodology
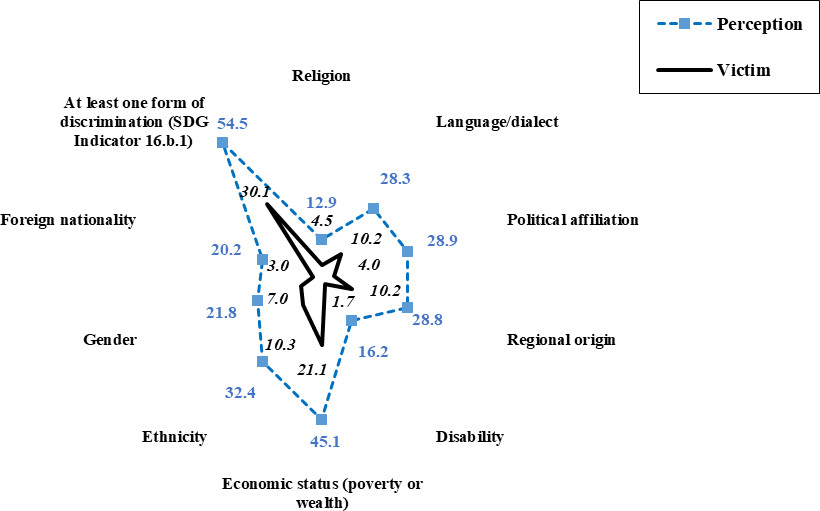
Figure 1.
Perception and experience of discrimination problems. Sources: GPS-SHaSA module, 2014, NIS; authors’ calculations. Questions are worded as follows: People are sometimes discriminated against based on personal characteristics. In Cameroon, do you think that there is discrimination based on (economic status, regional origin, religion, etc.). Have you been a victim of discrimination due to (your economic situation, regional origin, etc.)
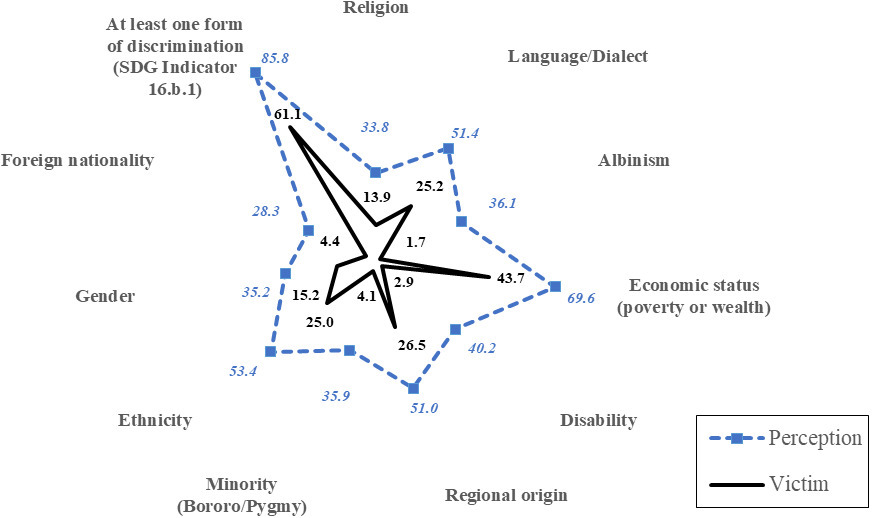
The discrimination that is the subject of this study is defined as the unequal or unfavourable treatment of a person on the basis of their ethnicity, the language or dialect they speak, their regional origin, their foreign nationality, their economic status (poverty or wealth), their gender, their disability, their religion, their membership of a minority (Bororo/Pygmy) or their albinism. This is therefore direct discrimination rather than indirect discrimination, which results from the application of the provisions of a law or regulation that adversely affects certain groups.
The exploratory analysis method based on univariate or bivariate descriptive statistics has been used to study the level of discrimination. Following this, econometric modelling based on logistic regressions enabled us to highlight the factors that explain discrimination. The results of this approach were validated using the model quality test carried out using the “Goodness of Fit” approach, which indicates whether the regression model fits more accurately than could be expected by chance.55
4.Results
4.1Perceptions and experience of discrimination
4.1.1A very high level of perceived discrimination
Perceived discrimination in Cameroon is characterised by its very high level and the diversity of its forms. The very large majority of Cameroonians believe that discrimination is widespread in the country. Indeed, 86% of people aged 18 or more think that there is at least one form of discrimination in Cameroon, among the 10 included in the survey (Fig. 1). Perceived discrimination based on economic status66 (poverty or wealth) is the highest, with 70% of individuals considering it relatively common. Discrimination based on ethnicity (53.4%), language/dialect (51.4%) and regional origin (51%) are also perceived to be widespread by over half of the adult population. The perception of discrimination based on disability (40.2%) and, to a lesser extent, gender (35.2%) and religion (33.8%) is shared by fewer people.
Figure 2.
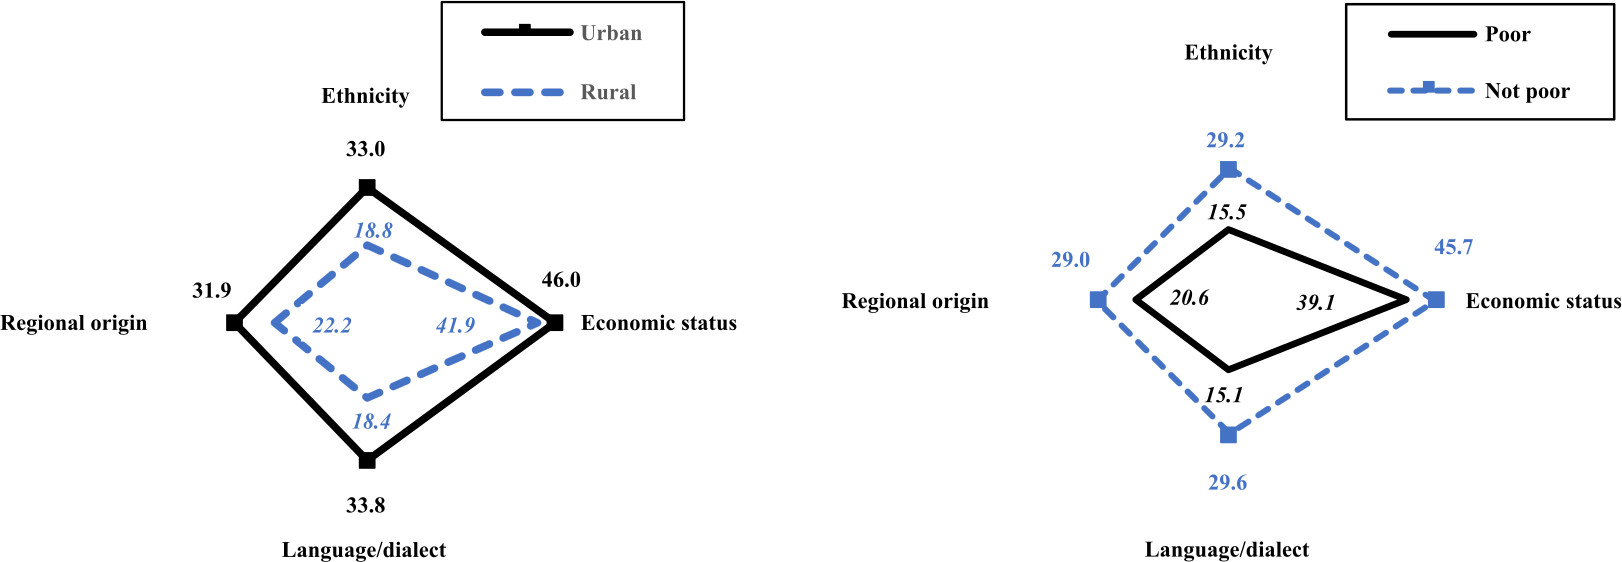
Percentage of victims of discrimination by residence stratum and poverty status. Sources: GPS-SHaSA module, 2014, NIS; authors’ calculations. The question is worded as follows: Have you been discriminated against due to your (economic status, regional origin, ethnicity or language/dialect)?
By region, almost the entire population of Douala perceives at least one form of discrimination (94.1%), followed by Adamawa (91.1%) and Yaounde (90.9%). The lowest level of perception of at least one form of discrimination (66.1%) is seen in the East region. Discrimination by level of income (against the poorest) appears to be the most widespread in all regions with the exception of the East region, where discrimination based on ethnicity is the most rampant. The Adamawa region has the highest level of perceived discrimination based on albinism and Bororo/Pygmy minority status.
Generally, the percentage of individuals perceiving the existence of this problem is higher than the number of victims, as it is not only the victims who perceive the phenomenon. This discrepancy between perception and experience is not specific to Cameroon or to the issue of discrimination. Indeed, a person may be a witness of or hear complaints and report the existence of the problem without necessarily being a direct victim. The perception (subjective) and experience (objective reality) indicators are complementary and cover two dimensions that can be disconnected and which must be taken into consideration as they have an impact on the actual dynamics at play: political, social and economic [29]. We do however see a constant: the ratio between the rate of perception and the number of victims of discrimination based on minority (Bororo/Pygmy), disability and albinism is generally much higher compared to other forms. This result could mean that the awareness-raising efforts carried out in favour of the rights of these people influences the perception of the population that believes these groups are “victims” of discrimination.
4.1.2Widespread experiences of discrimination
The very high level of perceived discrimination in Cameroon is also coupled with a high rate of victimisation. Overall, the level of experienced discrimination, measured in line with the definition of SDG Indicator 16.b.1, is very high: six out of ten (61.1%) people aged 18 or more have been victims of at least one form of discrimination.77 Adults in the Southwest (70.2%) and West (70%) regions and the city of Douala (68.8%) are the most affected. The high level of experienced discrimination is mainly due to discrimination associated with economic status (poverty or wealth), which is shared by 43.7% of Cameroonians (Fig. 1). Experienced discrimination is more widespread in urban settings (65.8%) than in rural settings (57.4%) and this is similar regarding the economic status (46% and 41.9%, respectively) (Fig. 2). The problems inherent to the urbanisation of cities and to the low employment potential offered by some of these cities could explain the gap in this type of discrimination. Furthermore, those who are not poor are more likely than poor people to be victims of at least one form of discrimination (64.2% compared with 54.2%). This finding could result from composition effects, as city dwellers, for example, are richer. The analysis using the econometric models (see above) will enable us to shed light on this point. Although the levels differ by category, the extent of the phenomenon, measured through experienced discrimination, is worrying and calls for the implementation of appropriate measures to address the gaps found.
4.1.3Various forms of discrimination with that relative to economic status dominating
Using the objective approach, discrimination based on economic status has the highest level both at the national level (43.7%) and for each region. This form is followed by regional origin (26.5%), language/dialect (25.2%) and ethnicity (25.1%) (Fig. 1).
Figure 3.
Percentage of victims of certain forms of discrimination by level of education. Sources: GPS-SHaSA module, 2014, NIS; authors’ calculations. The question is worded as follows: Have you been discriminated against due to your (regional origin, ethnicity or language/dialect)?
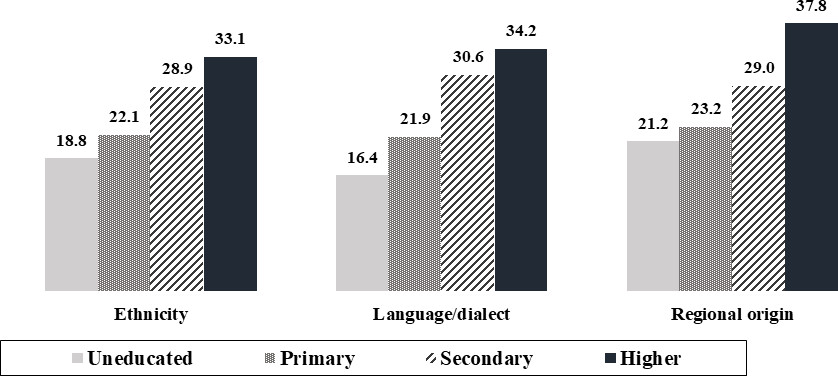
Figure 4.
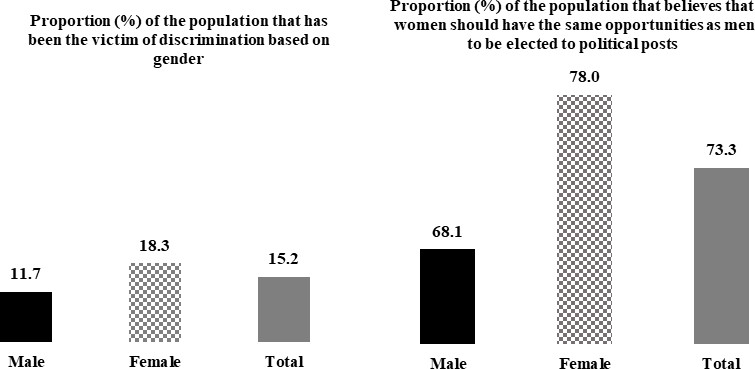
Discrimination by gender, equal opportunities to be elected at political positions by gender. Sources: GPS-SHaSA module, 2014, NIS; authors’ calculations. Questions are worded as follows: Have you been discriminated against due to your (economic status, regional origin, ethnicity or language/dialect)? In your opinion, should women have the same opportunities as men to be elected to political posts?
These four forms of discrimination are the most widespread, in terms of both lived experience and perception. This therefore represents a real societal problem. Indeed, although the Growth and Employment Strategy Paper (GESP) aims to fight poverty, strengthen national unity and consolidate the democratic process, the forms of discrimination that may jeopardise cohesion and national unity are the most widespread among victims. This situation therefore deserves solutions. The creation of the National Commission for the Promotion of Bilingualism and Multiculturalism88 in 2017 by the President of the Republic and the tasks that were assigned to it could work to achieve this.
Table 1
Percentage of the population that have been victims of general discrimination based on various aspects
| Aspect | Not discriminated against | Discriminated against | Total |
|---|---|---|---|
| Respect of equal rights (police, Court of Justice) | 38.3 | 24.7 | 30.0 |
| Victim of corruption | 8.1 | 19.5 | 15.1 |
| Thinks that law enforcement discriminates | 53.2 | 67.3 | 61.8 |
| Poverty is a threat | 79.9 | 87.1 | 84.3 |
| Unemployment is a threat | 79.5 | 85.5 | 83.2 |
| Hunger is a threat | 69.1 | 75.4 | 72.9 |
Sources: GPS-SHaSA module, 2014, NIS; authors’ calculations. Questions are worded as follows: Have you been discriminated against due to your economic status? Democracy is often associated with the following characteristics: each person is treated equally by the police and courts (equality in the eyes of the law) and the rights of each individual are respected equally by the government and in day-to-day life (absence of discrimination). Are they respected in Cameroon? Over the last 12 months, have you been forced to give a gift, favour or money to a government official in exchange for a service? Is poverty (or unemployment or hunger) a current worry for you in your day-to-day life? Do you think that law enforcement in our country discriminates against certain people?
Both in terms of economic status (poverty or wealth) and the other three most widespread forms, the level obtained among the victims of these forms of discrimination is always higher in each case in urban settings than in rural areas, as well as among those who are not poor than among those who are poor (Fig. 2). This priori paradoxical situation could be explained by the fact that the poor populations and those in rural areas are less exposed to these forms of discrimination, due to ignorance of their rights or their resignation in the face of the phenomenon. Conversely, those who are not poor may be more inclined to report the phenomenon. The percentage of people who have been victims of discrimination based on their ethnicity, the language they speak or their regional origin rises with their level of education. Less than 2 in 10 people who have never been to school experienced one of these three types of discrimination, while this is the case for 3 to 4 persons among those with higher education (Fig. 3). By way of explanation, the higher the level of education, the better people are able to understand their rights and, therefore, to feel aggrieved or to demand the application of the law or respect for the principle of equality of citizens. Symmetrically, these results seem to indicate that the less educated an individual is, the lower the likelihood of recognising the discrimination of which they are victims or of reporting it. This would therefore suppose a form of resignation or a lack of awareness of rights among the poorest.
More women report being victims of discrimination (18.3%) than men (11.7%) (Fig. 4). This discrimination against women can also be seen in the reluctance of men to see women have the same opportunities as them to be elected at political positions. While 78% of women responded positively to this concern, only 68.1% of men shared this view. However, in terms of the other forms of discrimination, men are more likely to be victims than women.
Discrimination based on disability, certain minorities (Bororo or Pygmy) or albinism have lower levels of experienced discrimination. This marginal level is mainly explained by the size of these categories within the population. However, this finding does not question the existence of these forms of discrimination, which are experienced more in rural areas than in urban settings, and among poor people more than among those who are not poor.
4.1.4Discrimination, inequalities and economic risks: Combined effects
Figure 5.
Perception and experience of discrimination caused by law enforcement (%). Sources: GPS-SHaSA module, 2014, NIS; authors’ calculations. Questions are worded as follows: Do you think that law enforcement in our country discriminates against certain people? Is there discrimination by law enforcement based on (economic status, regional origin, religion, etc.). Have you ever been discriminated against by law enforcement due to your (economic status, regional origin, religion, etc.).
The principle of equality in the eyes of the law presupposes that the law treats people in the same way. Consequently, any failure to respect the principle of equality promotes discrimination. Victims of discrimination are particularly attentive to this. For example, people who suffer discrimination are less likely to validate the idea that the principle of equality before the law is respected (Table 1). A similar result is obtained with regard to corruption and discrimination on the part of law enforcement: those who are victims of general discrimination are more inclined to report these problems compared with those who have not been victims. Furthermore, victims of discrimination more persistently highlight the “Sword of Damocles” represented by poverty, unemployment or hunger.
4.2Perceptions and experiences of discrimination caused by law enforcement
4.2.1Lower level of discrimination from law enforcement
At least one of the nine forms of discrimination (ethnicity, language/dialect, religion, regional origin, foreign nationality, poverty or wealth, gender, disability or political affiliation) attributable to law enforcement is perceived by 54.5% of people aged 18 or over (Fig. 5). More people living in urban areas (62.1%) perceive this discrimination than in rural areas (48.5%). The same can be seen when comparing those who are not poor (58.8%) against those who are (44.5%). Furthermore, the level of perception of this discrimination increases in line with an individual’s level of education: rising from 43.9% among those who did not attend primary school to 52.7% among those who have completed primary education and reaching 61.1% among those with higher education. The proportions are similar when we look at gender, both when we consider at least one form of discrimination and when we consider each one taken in isolation.
The regional analysis shows that individuals living in the Southwest (71.2%), Northwest (67.6%), Douala (65.7%), Central (57.2%) and South (57.2%) regions are more likely to report that law enforcement is a source of at least one of the nine forms of discrimination.
The level of experienced discrimination attributable to law enforcement (30.1%) is lower than that measured by population perception (54.5%). Here, it is worth taking some time to look at the difference observed between the level of discrimination attributable to various sources (or general discrimination) and that attributable to law enforcement (source).
Indeed, in terms of perception and victims, the rates are 86% and 61% for general discrimination (Fig. 1) and 54.5% and 30.1% for discrimination attributable to law enforcement (Fig. 5). These differences may mean that discrimination could be more attributable to inequal treatment in society by the population itself than by the State through those in charge of performing sovereign missions or of applying the law.
The regions that are more affected by at least one form of experienced discrimination attributable to law enforcement are: Southwest (48.1%), Central excluding Yaounde (40.1%), Northwest (39.4%) and South (38.9%). While the Southwest and Northwest regions have fairly high levels of perception for this form of discrimination, it should be noted that this is not always the case among victims. This result could mean that discrimination is not one of the factors behind the Anglophone crisis. To this end, Razafindrakoto and Roubaud [30]99 noted that: “While the economic and security situation is varied and does not enable us to identify the existence of an “Anglophone problem” entrenched in systematised discriminatory practices, it is, however, accompanied by a feeling of profound dissatisfaction in the two English-speaking regions towards the country’s authorities and the State apparatus”.
As stated above, discrimination based on level of income is also the most widespread form. It affects relatively more individuals among those who are not poor than those who are poor. Corruption (which has relatively more direct victims among those who are not poor) could well influence the level of experienced discrimination attributable to law enforcement.
In terms of economic status (poverty or wealth), more than one in five people (21.1%) report being the victim of discrimination by law enforcement. This is followed by people who suffer discrimination based on their ethnicity (10.3%), the language they speak or their regional origin (10.2%). The other forms of discrimination are marginal and do not exceed 5.0%. People living in urban areas report a slightly higher rate of victimisation due to at least one form of discrimination by law enforcement (31.3%) than those living in rural settings (29.1%).
4.3Explanatory factors of experienced discrimination
Table 2
The determining factors of experienced discrimination: results of logistic regression models
| Variable | Experienced discrimination – general (odds-ratio) | Experienced discrimination – law enforcement (odds-ratio) | Experienced discrimination – economic status (odds-ratio) | Experienced discrimination – gender (odds-ratio) |
|---|---|---|---|---|
| Gender (ref. Female) | ||||
| Male | 1.058 | 1.205 | 0.992 | 0.580 |
| Area of residence (ref. Rural) | ||||
| Urban | 1.016 | 1.187 | 0.973 | 0.821 |
| Age group in years (ref. 18–29) | ||||
| 30–39 | 1.051 | 1.043 | 1.057 | 1.046 |
| 40–49 | 0.961 | 1.058 | 0.967 | 0.911 |
| 50–59 | 0.889 | 1.005 | 1.002 | 0.978 |
| 60 or over | 0.973 | 0.863 | 1.034 | 0.971 |
| Well-being quintile (ref. First) | ||||
| Second | 0.833 | 1.039 | 0.976 | 1.223 |
| Third | 0.967 | 1.075 | 1.011 | 1.297 |
| Fourth | 0.903 | 1.045 | 0.934 | 1.239 |
| Fifth | 1.059 | 1.052 | 0.938 | 1.431 |
| Level of education (ref. None) | ||||
| Primary | 1.022 | 0.975 | 0.910 | 1.103 |
| Secondary | 1.012 | 1.019 | 0.987 | 1.124 |
| Higher | 0.783 | 0.834 | 0.609 | 1.106 |
| Survey region (ref. Douala) | ||||
| Yaoundé | 1.060 | 0.844 | 1.071 | 1.405 |
| Adamawa | 0.733 | 1.105 | 0.826 | 1.860 |
| Central (excluding Yaoundé) | 0.876 | 1.336 | 0.919 | 1.389 |
| East | 0.522 | 0.751 | 0.508 | 1.116 |
| Far North | 0.539 | 0.728 | 0.507 | 1.397 |
| Littoral (excluding Douala) | 0.546 | 1.077 | 0.682 | 0.837 |
| North | 0.611 | 0.697 | 0.477 | 0.982 |
| Northwest | 1.003 | 1.664 | 0.936 | 1.303 |
| West | 0.951 | 1.124 | 0.930 | 0.762 |
| South | 1.094 | 1.658 | 0.991 | 1.290 |
| Southwest | 1.170 | 2.268 | 0.948 | 1.538 |
| Socio-economic group (ref. Formal) | ||||
| Agricultural informal | 0.728 | 0.973 | 1.071 | 0.830 |
| Non-agricultural informal | 0.862 | 0.913 | 1.155 | 0.869 |
| Economically inactive | 0.733 | 0.936 | 0.957 | 0.961 |
| Constant | 2.592 | 0.346 | 1.066 | 0.167 |
| Number of observations | 4856 | 4856 | 4856 | 4856 |
| Classification rate/Lroc curve | 62.8/0.59 | 69.4/0.60 | 57.7/0.59 | 83.9/0.60 |
| Pseudo-R | 0.02 | 0.02 | 0.01 | 0.02 |
| GOF (P_value) table (10) | 0.39 | 0.52 | 0.15 | 0.754 |
Significance threshold:
The aim of this last part is to identify the factors that positively or negatively influence the risks1010 of being victims of discrimination. To do this, experienced discrimination is measured using four dimensions: general discrimination, which takes into account all forms of discrimination, that caused by law enforcement, that associated with economic status and discrimination based on gender. In the case of general discrimination and that associated with law enforcement, the variable to be explained is obtained by counting the number of cases of experienced discrimination. This number is then recoded to 1 in the case of one or more forms of experienced discrimination and 0 otherwise. In the case of the other forms, recoding to 1 and 0 is obtained directly based on the variable relating to experienced discrimination.
Following this, each of these indicators constitutes the variable to be explained in a regression model in order to identify, all other things being equal, the different effects of a set of individual characteristics (gender, residence stratum, income poverty quintile, level of education, region of residence and socio-economic group) on experienced discrimination. The income poverty quintile variable is obtained by grouping the population into five groups, from the poorest 20% (1
The effects of the individual characteristics are measured using logistic regressions and a test of the model’s relevance to reality using the “Goodness of Fit” (GOF) approach. The results of this test indicate that the models of gender-based discrimination and that caused by law enforcement are of better quality than the other two. They reflect reality more accurately than could be expected by chance.
4.3.1Risks that vary according to human capital, place of residence and socio-economic group
People with no education are relatively more affected by some forms of discrimination than those with higher education. The likelihood for the latter is 21.7% lower than that for a person with no education. Human capital could therefore contribute to reducing experienced discrimination. The knowledge acquired could be a factor preventing some forms of discrimination and, therefore, general discrimination. Moreover, an identical phenomenon, though with varying proportions, can be seen for the population of Douala, who are more likely to be victims of general discrimination than those in regions such as the East, Far North, Littoral (excluding Douala) and North. The fact that Douala is a cosmopolitan city with a varied population may explain why its inhabitants are more exposed to discrimination than those of other regions. On another level, people working in agricultural informal employment and those who are not working (unemployed/students/retired) are less likely to be discriminated against than people in the public or formal private sectors. This seemingly paradoxical result could be explained by the theory of discrimination based on beliefs or prejudices [31], a phenomenon that appears more prevalent in the formal sector in relationships between employers and employees.
4.3.2Specific risk factors for discrimination by law enforcement
In relation to discrimination by law enforcement, men and people living in urban areas are seemingly confronted with this problem more frequently. The more frequent presence of law enforcement in urban areas than in rural areas may, through exposure, partly explain this result. Likewise, we could possibly assume that men have more contact with enforcement authority officers.
In terms of the survey region, the populations in the Central (excluding Yaounde), Northwest, South and Southwest regions are also more likely to be victims of discrimination from law enforcement than people in Douala. Conversely, those from the Far North and North regions are less likely to be victims of this form of discrimination than those in Douala. This result may in fact reveal pockets of corruption in certain places within Cameroon. The border shared between the South, Northwest and Southwest regions and other countries could also contribute to this situation.
4.3.3The specific cases of discrimination based on economic status and gender
In relation to discrimination based on economic status, in line with what would be expected, people with higher education are less affected than those who have never attended school. The populations of the East, Far North, Littoral excluding Douala and the North are less likely to be victims of this form of discrimination than those of Douala. This result could be explained by the existence of greater social disparities in the economic capital of the country.
In terms of gender-based discrimination, men and people living in rural areas are less likely to be victims than women and people living in urban areas. The people in the poorest quintile are more likely to face this form of discrimination than those in the fifth quintile. This result reflects a certain fragility of the poor and, in particular, women. These forms of discrimination may be explained by societal stereotypes and social burdens [27]. All things being equal, people from the Yaounde, Adamawa, Central excluding Yaounde, Far North and Southwest regions are more likely to be victims of this form of discrimination than those in Douala.
5.Conclusion
The aim of this article was to evaluate the extent of discrimination phenomena in Cameroon and to identify risk factors for being victims of discrimination based on data from the GPS-SHaSA module. The analyses carried out enabled us to measure the level of discrimination using both the subjective and objective approaches. As expected, the level of perceived discrimination is higher than that of experienced discrimination. Added to this is the existence of several forms of experienced discrimination, including that based on economic status (poverty or wealth), which is more marked and more widespread among the population. This situation is worrying because it could mean that part of the population falls into the vicious circle of poverty: for those poor people who are discriminated against, it is impossible to find ways to improve their conditions. Moreover, the research into the experienced discrimination risk factors highlights various criteria (sex, residence stratum, region, level of education and socio-economic group). However, the regional particularities seem to be among the factors that have the greatest influence on the risks of all forms of experienced discrimination.
These findings highlight the need to implement specific policies or actions to eliminate or at least mitigate these phenomena. Indeed, discrimination is based on both perception and experience. Furthermore, the relatively high percentage of victims of various forms of discrimination was noted. Achieving the GESP objectives associated with promoting decent employment and reducing poverty could help to reduce discrimination based on economic status (rich or poor), which is the most widespread. In parallel, we should not lose sight of the fight against other forms of discrimination, such as gender-based discrimination.
To ensure that all the assets in the fight against discrimination are available, the National Commission for the Promotion of Bilingualism and Multiculturalism (CNPBM) could play a key role in deepening solutions and formulating and implementing recommendations. As experienced discrimination varies with individual and regional characteristics, including these characteristics would be welcome, just like the need to deepen the analysis of discrimination. To that end, the availability of data from the GPS-SHaSA module, collected during the third Survey on Employment and the Informal Sector (EESI3) conducted by the NIS in 2021, offers a real opportunity to update and deepen the analysis of discrimination in Cameroon developed in this article.
Notes
2 This dimension focuses on any distinction, exclusion, restriction or preference or other unequal treatment based on grounds such as colour, gender, language, religion, national or social origin, disability or any other status, which aims to or does cancel or violate human rights and fundamental freedoms.
3 The Governance, Peace and Security module was developed by Institut de Recherche pour le Développement (IRD-DIAL) at the request of the African Union to enable the African nations to have harmonised statistics on governance, peace and security [25].
4 Given the demographic weight of the two cities Yaounde and Douala, Cameroon, which has 10 administrative regions, is instead broken down as follows: Adamawa, Centre (excluding Yaounde), the city of Douala, East, Far North, Littoral (excluding Douala), North, Northwest, South, Southwest, West and the city of Yaounde.
6 The NIS report entitled “Tendances et déterminants de la pauvreté entre 2007 et 2014 au Cameroun” [Trends and determining factors of poverty between 2007 and 2014 in Cameroon] shows that the gaps, measured by household consumption, have widened between the poor and the non-poor, according to the Gini index.
7 SDG Indicator 16.b.1 relates to the proportion of the population reporting having personally felt discriminated against or harassed in the previous 12 months on the basis of a ground of discrimination prohibited under international human rights law.
8 Decree No 2017/0313 of 23
9 See also the article by the same authors in this issue, which complements and updates this study.
10 Here, we would highlight that we are not trying to show phenomena of causality but to highlight correlations. We cannot exclude problems of endogeneity (inverse causality or correlation due to unobservables).
References
[1] | République du Cameroun. Loi No. 96/06 du 18 janvier 1996 portant révision de la Constitution du 02 juin 1972 du Cameroun. Yaoundé: RC; (1996) . |
[2] | ONU. Déclaration Universelle des Droits de l’Homme adoptée en 1948. New York: ONU; (2015) . |
[3] | MINEPAT. Cameroun Vision 2035. Yaoundé: Ministère de l’Economie, de la Planification et de l’Aménagement du Territoire; (2009) . |
[4] | MINEPAT. Document de Stratégie pour la Croissance et l’Emploi (DSCE). Yaoundé: Ministère de l’Economie, de la Planification et de l’Aménagement du Territoire; (2009) . |
[5] | ONU. Transformer notre monde: le Programme de développement durable à l’horizon 2030, Résolution A/70/L. 1 adoptée par l’Assemblée Générale des Nations Unies lors de la 4ème session plénière. New York: ONU; (2015) . |
[6] | Roubaud F. La question ethnique sur le marché du travail à Yaoundé: Discrimination ou solidarité? Contribution pour le séminaire préparatoire au Sommet Mondial pour le Développement Social. Copenhague: Fonds documentaire de l’IRD; (1995) . |
[7] | ONUSIDA, Réseau africain des personnes vivant avec le VIH. Analyse situationnelle de la discrimination et stigmatisation envers les Personnes Vivant avec le VIH/SIDA en Afrique de l’Ouest et du Centre – considérations éthiques et juridiques. Equipe Inter-Pays pour l’Afrique de l’Ouest et du Centre. Abidjan: Organisation des Nations Unies pour le SIDA et Réseau africain des personnes vivant avec le VIH; (2002) . |
[8] | UAFA, ANAC. Etude sur les droits des personnes handicapées. Yaoundé: Union Africaine des Aveugles, l’Association Nationale des Aveugles du Cameroun; (2007) . |
[9] | CRED. Étude situationnelle sur les formes multiples de discrimination au Cameroun. Yaoundé: Cercle de Recherche sur les Droits et les Devoirs de la Personne Humaine; (2012) . |
[10] | Ekamena Ntsama SN, Abessolo YA, Ngo Tedga P. Genre et participation au marché du travail au Cameroun. International Journal of Innovation and Applied Studies. (2014) ; 3: (7): 929-940. |
[11] | Ekamena Ntsama SN. Les écarts salariaux de genre au Cameroun. Revue multidisciplinaire sur l’emploi, le syndicalisme et le travail. (2014) ; 9: (2): 124-146. doi: 10.7202/1036261ar. |
[12] | Etoundi A, Martial E, Chameni C, Meva H. Gender wage gap: Discrimination or Human Capital? A subgroup approach. Yaoundé: Université de Yaoundé II Soa; (2013) . |
[13] | Miamo Wendji C, Kouhomou CZ. Les écarts salariaux de genre dans les entreprises au Cameroun. MPRA Paper 100286, Bibliothèque universitaire de Munich, Allemagne; (2020) . |
[14] | Njifen I. Caractéristiques et déterminants du chômage des jeunes au Cameroun: le rôle prépondérant du diplôme et du sexe. Revue du développement en Afrique. (2015) ; 27: : 443-455. doi: 10.1111/1467-8268.12159 |
[15] | Abe C. Rapports inégalitaires entre Pygmées et Bantous: discriminations et inégalités scolaires au Sud Cameroun. Autrepart. (2011) ; 59: (3): 145-159. |
[16] | Becuwe A, Merle I. Pour une approche transdisciplinaire de la discrimination au travail. RIMHE: Revue Interdisciplinaire Management, Homme & Entreprise. (2013) ; 5: (2): 3-11. |
[17] | Miendjiem I. Etude nationale sur la discrimination en matière d’emploi et de profession et proposition d’un plan national d’action au Cameroun. Genève: Bureau International du Travail; (2011) . |
[18] | Delattre E, Leandri N, Meurs D, Rathelot R. Trois approches de la discrimination: évaluations indirectes, expérimentation, discriminations ressenties. Annales d’Economie et Statistique. (2013) ; 465/466: : 7-13. |
[19] | Duguet E, L’Horty Y, Meurs D, Petit P. Measuring Discrimination, an Introduction. Annals of Economics and Statistics. (2010) ; 99/100: : 5-14. |
[20] | UNSD and Praia Group. Handbook on Governance Statistics. New York: UNSD; (2020) . |
[21] | INS, DIAL and PNUD. Statistiques sur la Gouvernance, la Paix et la Sécurité (GPS) au Cameroun en 2014, Rapport d’analyse du Module GPS-SHaSA. Yaoundé: Institut National de la Statistique; (2016) . |
[22] | CUA, CEA, BAD and la Fondation pour le renforcement des capacités. Stratégie pour l’harmonisation des statistiques en Afrique 2017-2026 (SHaSA2). Addis-Abeba: Commission de l’Union Africaine; (2016) . |
[23] | CUA, CEA, BAD. Stratégie pour l’Harmonisation des Statistiques en Afrique (SHaSA). Addis Abeba: Commission de l’Union Africaine; (2010) . |
[24] | INS.Tendances, profil et déterminants de la pauvreté au Cameroun entre 2001–2014, Yaoundé: Institut National de la Statistique; 2015. |
[25] | Razafindrakoto M, Roubaud F. Les modules Gouvernance, Paix et Sécurité dans un cadre harmonisé au niveau de l’Afrique (GPS-SHaSA): développement d’une méthodologie d’enquête statistique innovante. Statéco. (2015) ; 109: : 122-158. |
[26] | Cling J-P, Razafindrakoto M, Roubaud F. L’ODD 16 sur la gouvernance et sa mesure: L’Afrique en tête. Afrique Contemporaine. (2016) ; 258: (2): 73-93. |
[27] | Afsa C. Le modèle logit: Théorie et applications. INSEE, Document de travail, Série Méthodologie statistique; (2016) . |
[28] | Kellie JA, Lemeshow S. Goodness-of-fit test for a logistic regression model fitted using survey sample data. The Stata Journal. (2016) ; 1: : 97-105. |
[29] | Assany Y, Rakotomanana F. Perceptions et expériences à Madagascar: d’où viennent les écarts lorsque l’on mesure la corruption, la violence criminelle et la discrimination. Stateco. (2022) ; 116: : 67-80. |
[30] | Razafindrakoto M, Roubaud F. Sous la crise anglophone au Cameroun: frustrations politiques et défiance à l’égard des autorités publiques. Document de travail UMR DIAL DT/2018-10. (2018) . |
[31] | Havet N, Sofer C. Les nouvelles théories économiques de la discrimination. La Découverte. (2002) ; 7: : 83-115. |


