
Public sector governance statistics in Brazil: Challenges and perspectives, and focus on transparency
Abstract
The text explores the production of statistics on public sector governance in Brazil both by the official statistical office (IBGE) and other producers, most of them control agencies. The article gives details about the main data sources. Some challenges and perspectives related to regular and comprehensive production are explored. There is also an example of analysis with data on transparency in municipal government collected using different methodologies. This exercise shows some issues faced when one tries to put together different data sources.
1.Introduction
As it has been discussed for some time and more effectively since the creation of the Praia Group and the SDG (Post-2015 agenda), governance statistics11 are still often on the margins of regular production by official statistical offices. However significant progress is being made around the world.22 At the same time, this is still an area of exploration. Brazil is no exception.
In addition to classical definitions related to the proper functioning of central, federal, and local governments, such as the definition adopted by the OECD (“Governance is the exercise of political, economic and administrative authority necessary to manage a nation’s affairs”), governance is understood here as an umbrella concept encompassing many dimensions, including those listed in the recently published handbook [1].
• Non-discrimination and equality
• Participation
• Openness
• Access to and quality of justice
• Responsiveness
• Absence of corruption
• Trust
• Safety and security
Within the official Brazilian statistics office (Brazilian Institute of Geography and Statistics – IBGE), federative issues have been a trigger for data production efforts since the 1990s. In contrast, the idea of structuring governance as a field of study is quite recent.33
Even if statistics related to governance have been produced by some institutions since the last century, the discussion on the subject gained momentum in Brazil in the early 2000s, due to efforts to rationalize the functioning of the public sector, initiatives (or reaction from the public administration at the three levels of government – federal, state, and municipal) and actions made by control bodies. New laws are also noteworthy, such as the Fiscal Responsibility Law – 05.04.2000 – and the Access to Information Law – 11.18.2011 (this law was first proposed in 2003). Brazil had a transparency portal online in 2004 and was part of the Open Government Partnership (OPG) and its implementation in 2011 [3, 4]. At the beginning of the 2010s, efforts accelerated but seem to have lost momentum due to lack of focus and funding.
This contribution aims to present some aspects of the production of statistics related to governance in Brazil. In addition to this brief introduction, the article includes three sections. The first section outlines a brief history of the production of statistics related to the topic in Brazil. The second section focuses on IBGE statistical production. It provides more details about two of the main Brazilian governance data sources: the Survey of Basic Municipal Information (aka MUNIC) and the Survey of Basic State Information (aka ESTADIC). The third section includes an analysis using different investigations (data sources) on the topic of transparency, in order to articulate opportunities and challenges in this field of investigation. At the end, final considerations address perspectives for the topic in Brazil.
2.A brief history of governance statistics in Brazil
In Brazil and in the world, audit institutions stand out with a relevant role in defining criteria for (good) public sector governance. Likewise, they evaluate the compliance with laws in favor of transparency and other dimensions of governance. In this context, the Federal Court of Accounts – TCU, the Federal Public Prosecutor’s Office – MPF and the Ministry of Transparency and Controller-General of the Union – CGU stand out. In addition to these institutions, it is worth mentioning the Regional Center for Studies on the Development of the Information Society – CETIC.br, with research related to electronic government. Next, we will summarize relevant data production from each of these institutions.
2.1TCU (Tribunal das Contas da União; Federal Court of Accounts)
As part of its mission to improve public administration for the benefit of society through external control, in 2013, TCU published a guide related to Basic Governance principles. This guide included good governance practices that could improve the performance of public bodies and entities, based on three mechanisms: leadership, strategy, and control [5].
In a progressive effort, the Court has been studying several governance dimensions, culminating in an integrated system. Between 2013 and 2018, TCU conducted surveys on governance and management in four distinct themes. The Public Organizational Governance Survey has assessed the degree of maturity (good practices) in the governance and management practice of federal public organizations. The most recent questionnaire (sent to federal public bodies) included the following dimensions: 1. Leadership; 2. Strategy; 3. Accountability; 4. People Management; 5. Information Technology Management; 6. Contract Management; 7. Core Activity Results.
Another tool on the TCU website is the Fraud and Corruption Controls Weakness Index Map (https:// meapffc.apps.tcu.gov.br/). According to available metadata, 287 institutions of the federal executive power were evaluated to define how much each institution was exposed to the risk of fraud and corruption. To measure exposure to such risks, a set of controls was divided into five categories: appointment of managers; risk management and internal controls; ethics management and integrity program; internal audit; transparency and accountability. These five categories were then mapped and related to two characteristics that enable the calculation of the exposure map: (a) economic power, based on the General Budget of the Union and the Global Expenditure Plan; and (b) regulatory power, defined as the power to create rules or oversee the private sector. Figure 1 locates a set of federal governments in these bidimensional summaries.
Figure 1.
Mapping of Weakness of controls vs economic power and regulatory power. Source: https://meapffc.apps.tcu.gov.br. Note: Horizontal Axis: Fraud and Corruption Controls Weakness Index (0 – low …1 – very high). Vertical Axis (panel a): Economic power (10 million to 1 trillion, log scale). Vertical Axis (panel B): Regulatory Power (0–100).
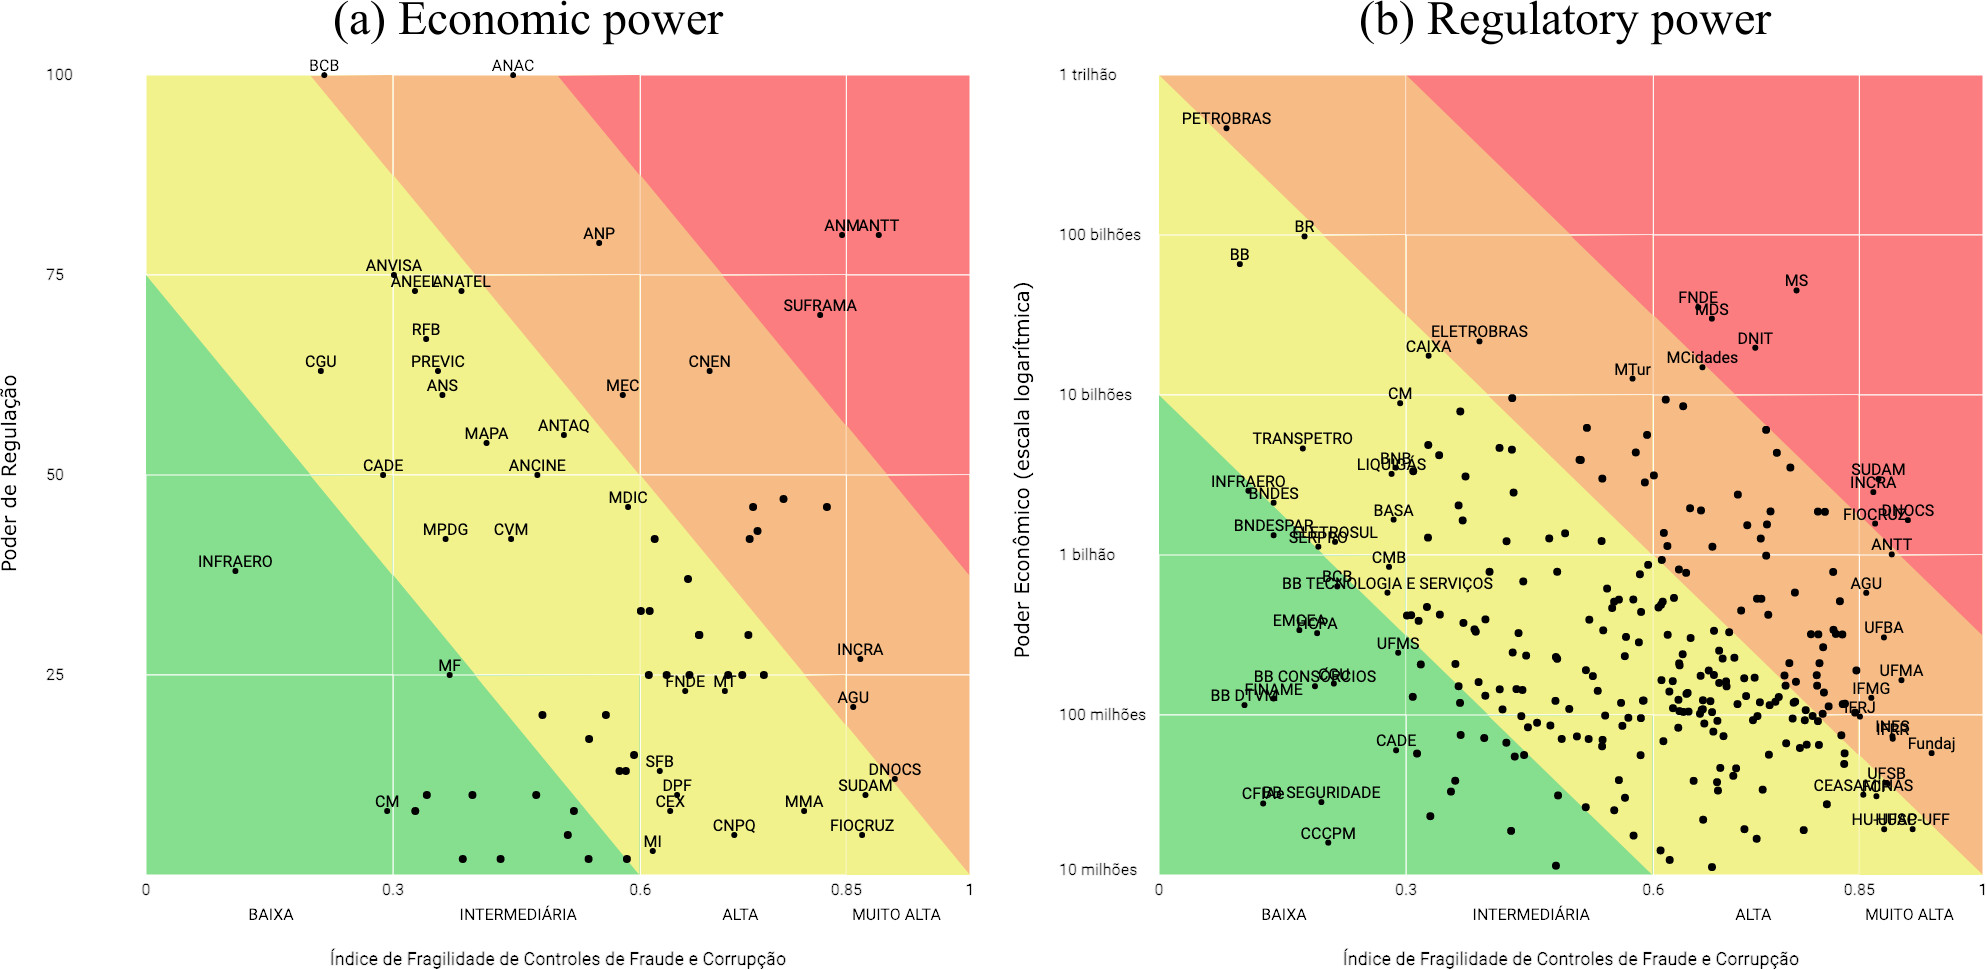
This tool does not say to which year the data refer, but from the results it seems that the mapping was done from 2016 to 2018. For example, (a) highlights Petrobras (oil company – mixed economy company under state control) with strong economic power and low values in the Fraud and Corruption Controls Weakness Index. After a series of scandals involving this company in 2015/2016, one would then question the efficiency of an evaluation based on the presence/absence of structures/procedures. That is however a general deficiency of many such indicators that have no easy task to evaluate if governance mechanisms are working in practice inside a (public or private) company/administration.
2.2CGU (Controladoria geral da União; Ministry of Transparency and Controller-General of the Union)
To fulfill its mission to promote the improvement and transparency of public management, the Ministry of Transparency and Controller-General of the Union – CGU developed, as of 2015, the Transparent Brazil Scale (Escala Brasil Transparente – EBT), an assessment of the adequacy of federated levels of government (States, Federal District and municipalities) regarding the aspects of transparency required by law, in particular the Access to Information Law [6]. There were two editions in 2015, and a third in 2016, with a sample of municipalities. In the most recent one, all states, the Federal District and 2,301 municipalities were investigated.
The Scale distinguishes between passive transparency, which is the provision of information to meet specific demands, and active transparency, when information is made available spontaneously. Each one corresponded to 50% of the value of the final grade, which ranged from 0 to 10. Passive transparency was verified through the existence of a face-to-face service unit, website(s) providing access to electronic form, if there were requirements to carry out the requests, and finally, CGU technicians made three information requests to assess service quality.
The active transparency assessment incorporated aspects such as “verification of the publication of information on revenue and expenditure, tenders and contracts, administrative structure, public servants, monitoring of public works, among others” [6], that is, mandatory information according to the Access to Information Law and other legislation (such as the Fiscal Responsibility Law). CGU published full results on its website, with rankings and breakdowns, but has not updated the study since 2016.
2.3MPF (Ministério Público Federal; Federal Public Prosecutor’s Office)
Based on the same laws that founded the Brazil Transparent Scale (EBT), the Federal Public Prosecutor’s Office – MPF developed the National Transparency Ranking (Ranking Nacional de Transparência – RNT), which assesses compliance with national legislation in the disclosure and control of public spending, including taking judicial measures to correct flaws in states and municipalities [7]. The diagnosis was carried out twice, in 2015 and 2016, and had a census nature, as it evaluated all 26 states, the Federal District and 5,568 municipalities.
The items evaluated were Internet transparency portal, revenue, expenditure, bids and contracts, reports, passive transparency, structure, and type of contact, and good transparency practices. One important aspect that has been monitored was the existence and operation of a “Citizen Information System” (Sistema de informações ao Cidadão – SIC), including its electronic version (e-SIC).
The investigations carried out by MPF (National Transparency Ranking), and CGU (Brazil Transparency Scale) have a similar methodology. Both use their central and local staff personnel to evaluate the webpages of public administrations, but they differ in some respects: the content of the questionnaires and other aspects, for example, CGU sends requests and evaluates responses. In addition, only MPF investigated all municipalities (census).
2.4CETIC.br (Centro Regional de Estudos para o Desenvolvimento da Sociedade da Informação; Regional Center for Studies on the Development of the Information Society)
Regarding information and communication technology (ICT) infrastructure and policies at the public sector, the ICT Electronic Government Survey, by the Regional Center for Studies on the Development of the Information Society – CETIC.br,44 can be mentioned. The survey has been biannual since 2013. It had the institutional support by the Ministry of Planning and various federal agencies, such as IBGE and the Institute of Applied Economic Research – IPEA.
Through telephone interviews in CETIC.br surveys, various aspects of e-government have been investigated, in federal, state, and municipal bodies. The ICT Electronic Government Survey is conducted as a census of municipalities, states, and the federal district since 2019. Response units also include a sample of other types of federal government entities, such as ministries, agencies, and the justice system. More details on methodology can be found on CGI.br [8]. At the time of writing this article, CETIC.br was collecting data related to 2021 and it was expected to keep investigating regularly. That is related to its self-sustainability and self-management. In addition, the ICT Household Survey55 investigates access to e-government services by the population annually since 2005.
2.5About data production
To summarize the production of governance statistics in Brazil, we can comment that it is generally carried out in a decentralized manner through various federal authorities and some other entities, such as CETIC.br. This disarticulated system is subject to inefficiency in the allocation of resources and work, lack of coordination and a “silo culture”, which is common in Brazilian public authorities.
In Brazil, governance indicators consist of structural indicators as well as some process ones. These are the result of studies produced by authorities on other government offices, with evaluation of administrative structures, websites, policies/laws, and, especially in the case of IBGE and CETIC.br, with structured questionnaires applied to public bodies of local (IBGE) and/or federal government (CETIC), responded by civil servants. Response units are public agencies as a whole or other units (e.g., secretariats within a state government).
Indicators in which the population is the unit of analysis are rare in Brazil. CETIC.br stands out notably, producing indicators related to e-government on the demand side. Except for aspects relating to user interaction with public services, at the level of individuals, the IBGE addresses governance tangentially and irregularly, as described in the next section, which details the production of governance statistics by the official statistical office in Brazil.
3.IBGE main data sources on governance
As said before, IBGE approaches governance (as a broad concept) with some statistical operations. The main one is the Survey of Basic Municipal Information – MUNIC, started in 1999 and applied annually, except for Demographic Census years.66 Since 2012, the Survey of Basic State Information – ESTADIC has been reproducing the same investigation as MUNIC at the level of the states and the Federal District. Although there was no specific section or supplement with the name of governance before 2019, several themes concern governance statistics at the municipal and state level, such as:
• Human resources (personnel by sex, age, education, type of contract, people with disabilities, training, regularity of entrance exams, existence of quotas to ethnic groups, persons with disabilities, etc.). Gender and education level of heads of thematic areas have been investigated since the early 2000s. In 2018, the race of these professionals began to be investigated as well.
• Material resources, computerization.
• Resources for management (tax collection, real estate registration, incentive mechanisms, etc.).
• Electronic government (communication and information technology), infrastructure, types of services and information available on webpages, etc.
• Mechanisms for contacting the population, telephone, internet, etc.
• Councils, committees, consortia, and conferences on various themes of municipal and state action; issues related to gender policies, citizen participation mechanisms and horizontal federative integration – between municipalities/states – or vertical – including municipalities, states, and the Union.
• Transparency, implementation of the Access to Information Law, type of information made available, channels etc.
• Legislative instruments, funds, hiring advisors to implement policies and social/citizen control mechanisms, social participation mechanisms.
• Human rights (human and material resources allocated to the theme, policies, funds, commissions etc.).
• Public security institutions and access to justice.
• “Governance”, investigated in 2019, included questions about Internal control together with transparency (a theme that gained substance compared to previous investigations, when it was combined with other communication and information technology issues).77
All these themes concern dimensions identified with the effectiveness of administrations, the existence of an inclusive and transparent public service, with space for social/citizen control mechanisms, social participation, etc. In other words, they concern the governance of the public sector (in this case, municipal, state and district governments) and the evaluation of mechanisms for “good governance”.
Since the 2010s, IBGE has tried to organize MUNIC and ESTADIC to rotate themes every four years, and has been successful, despite budgetary constraints. The budget of IBGE (a public foundation) is influenced by decisions of the ministry to which it is subordinate, currently the Ministry of Economy, and many investigations depend on cooperation agreements with other institutions that will then have a say on the investigation content and transfer funds to IBGE. Table 4 in appendix shows the distribution of topics (themes) investigated in MUNIC (since 1999) and in ESTADIC (since 2012).
Regarding the methodology of these surveys, it is worth discussing the collection method. Until 2019, the surveys were carried out with a paper questionnaire, either applied by IBGE interviewers going to city halls and state executives or left for self-completion. This method varied according to the practicality perceived by each IBGE state division responsible for the data collection. The advantage of the paper questionnaire comes from the fact that the survey covers several themes in the same year, so the questionnaire could “travel” among the different administrative divisions. Challenges came from transport, typing, validation.
Since 2020, and accelerated by the pandemic, the collection method was changed to online questionnaires (Computer Aided Web Interview, CAWI). This method has always raised fears, due to the issue of non-response. Some small municipalities do not even have a landline.88Table 1 shows that, in 2021, 3,770 or 68% of the municipalities had up to 20,000 inhabitants, concentrating 15% of the population. In most cases, these municipalities have few resources and administrative structure. Regional inequalities in Brazil are significant.
IBGE researchers responsible for the implementation and analysis of MUNIC and ESTADIC have the perception that these surveys are poorly under-used considering their potential (for monitoring government plans, policies, assessment of institutionalization levels of policies/themes, benchmark studies with comparison between federative entities, etc.). This situation is more a pity since the results are available in open data: the databases are available for free in xls/ods format on the IBGE website among other dissemination initiatives by IBGE.
Table 1
Municipalities in 2021
| Population strata | # of municipalities | % total | Population | % total |
| 1 – up to 5,000 | 1,250 | 22% | 4,184,620 | 2% |
| 2 – 5,001 up to 10,000 | 1,201 | 22% | 8,576,898 | 4% |
| 3 – 1,001 up to 20,000 | 1,319 | 24% | 18,861 814 | 9% |
| 4 – 20,001 up to 50,000 | 1,120 | 20% | 34,172,858 | 16% |
| 5 – 50,001 up to 100,000 | 354 | 6% | 24,498,937 | 11% |
| 6 – 100,001 up to 500,000 | 277 | 5% | 54,999,084 | 26% |
| 7 – | 49 | 1% | 68,023,428 | 32% |
| Total | 5,570 | 100% | 213,317,639 | 100% |
Source: Based on IBGE population estimates. Note: Municipalities listed in the table include two districts, one federal (Brasília) and one state district (Fernando de Noronha).
These Brazilian (establishment) surveys coincide with instruments existing in other Latin American countries. In Mexico, government censuses99 started in 2009, with different contents, initially investigating justice and security sectors and then other governments offices. This investigation includes a set of statistics with the purpose of supporting the processes of design, implementation, monitoring and evaluation of government public policies. In Peru, the National Registry of Municipalities, established in law since 2001 [11, 12], also investigates issues related to different policies in all the municipalities of the country.
Besides ‘government censuses’, Mexico (INEGI) draws up a benchmark of the production of public sectors governance statistics. The research agenda includes ‘social cohesion and delinquency prevention’ [13], ‘quality and government impact’ [14], ‘Regulatory quality and government Impact on companies’ [15], ‘victimization of companies (including corruption)’ [16]. INEGI has also had an important role in the production of a manual about corruption surveys, coordinated by UNODC and UNDP.
Peru (INEI) also has a consistent production, regarding ‘governance, citizenship perceptions, democracy and trust in institution’ [17], integrated inside a household survey about poverty and living conditions [18]; see also Herrera et al. in this issue.
Concerning other IBGE data sources, it is worth exploring its household surveys. The National Household Sample Survey – PNAD was, between 1967 and 2015, the main source of socioeconomic data for Brazil. It was a face-to-face household cross-sectional multipurpose survey.1010 PNAD focused on the labor market but included as well specific modules (which varied year after year, since they were commissioned by different ministries, after technical agreements and resource transfers).
Since 2012, a new survey (Continuous PNAD) has started with a different logic. It is a survey under a rotating panel format, in which households respond 5 times, once per quarter, before leaving the sample.1111 This investigation replaced the PNAD (annual, national) and the Monthly Employment Survey (PME, 1980–2016) which covered only the 6 main metropolitan areas). Continuous PNAD provides national estimates with more geographic disaggregation than the previous PNAD and PME. Employment statistics are disclosed by moving quarters. The research also includes modules, investigated throughout the year, such as for housing, but also in specific quarters, such as education (2
Inequalities of access to public services have been part of investigations in PNAD, Continuous PNAD and other surveys such the National Health Survey (PNS – 2013, 2019), fielded by IBGE in partnership with (and financed by) the Health Ministry. PNS is a necessary next step further (health was a module in PNAD in 1998, 2003 and 2008). The need for detailed information led to the implementation of a single purpose survey. PNS interviews can be longer than 1 hour.
Issues related to democracy, political participation, trust in institutions and civic engagement (themes closer to the core definition of governance) were investigated with PNAD in 1988 (close to the end of the dictatorial military regime in 1985) and never since.
Table 2
IBGE governance data sources at the household level
| Themes related to | Year | ||||||||||||
|---|---|---|---|---|---|---|---|---|---|---|---|---|---|
| governance statistics | 1988 | 1998 | 2003 | 2008 | 2009 | 2013 | 2016 | 2017 | 2018 | 2019 | 2020 | 2021 | 2022 |
| Political Participation | PNAD | ||||||||||||
| ICT | PNAD | PNAD | PNAD | PNAD | PNADC | PNADC | PNADC | PNADC | |||||
| ICT | PNAD | PNAD | |||||||||||
| Access to justice | PNAD | PNAD | PNADC | ||||||||||
| Victimization | PNAD | PNAD | PNADC | ||||||||||
| Health | PNAD | PNAD | PNAD | PNS | PNS | ||||||||
Note: PNAD – National Household Sample Survey; PNADC – Continuous National Household Sample Survey; 2022 investigations are estimated.
Table 3
Methodological details about data sources
| Data source/institution | Observations | Respondents | Methodology |
|---|---|---|---|
| MUNIC 2015/IBGE | 5570 | Municipal executives (division responsible for ICT and/or communication) | Paper questionnaire either self-filled or through IBGE interviewers. Method varies according to local realities in each Brazilian State. |
| ICT E-gov 2015/CGI.br | 996 | Municipal executives (division responsible for ICT and/or communication) | Telephone interview with professional responsible for ICT decisions at the municipal executive level. |
| RNT 2 | 5568 | MPF staff (observation) | MPF staff evaluate websites/portals. |
| EBT 3 | 2328 | CGU staff (observation) | CGU staff evaluate websites/portals, send request for information. |
Note: Only municipal observations were counted here, even though RNT and EBT also concerned States (
Victimization has always been a sensitive and very relevant topic in Latin America, the area of the world with the highest homicide rates. This theme was investigated in PNAD modules in 1988 and 2009. For years, high turnover in ministerial departments and changing political priorities are among the reasons for difficult negotiations between IBGE and possible sponsors (Ministry of Justice, Justice National Council, etc.). In contrast, a new victimization (and access to justice) module was commissioned by the Ministry of Justice and has been fielded with Continuous PNAD in 2021 and 2022.
Modules regarding Information Communication Technology (ICT) in PNAD (2003, 2008, 2013) and in the Continuous PNAD (annually since 2016), commissioned by the Ministry of Communications, have been linked mainly to infrastructure issues (existence of ICT equipment at the households, access to cabling, etc.). The population’s access to e-government services was investigated only in 2003 and 2008. As stated, investigations concerning the main dimensions of governance, as defined in the Praia Group Handbook [1], with persons or households as collection units are somewhat rare in Brazil. More details about perspectives will be mentioned in the closing remarks. Table 2 summarizes the main IBGE governance data sources at the household level.
4.Approaches of transparency at the municipal level
After having explored governance data sources from different producers (Section 1) and from IBGE (Section 2), here is an example of a study that uses transparency data at municipal level.
Figure 2.
Mean value of indexes based on surveys about transparency, by region and population size of municipalities (2014–2016). Source: [17, p. 206]. Notes: 1. Because of the different number of questions used to build each index, they were normalized to 100 to allow for comparison; 2. Color scale (red, orange, yellow, green) is defined in each column, from lowest to highest transparency. 3. Based on Survey of Basic Municipal Information – MUNIC (IBGE, 2015); ICT Electronic Government survey 2015 (CGI.br, 2016); National Transparency Ranking (Ranking Nacional de Transparência – RNT), 2
![Mean value of indexes based on surveys about transparency, by region and population size of municipalities (2014–2016). Source: [17, p. 206]. Notes: 1. Because of the different number of questions used to build each index, they were normalized to 100 to allow for comparison; 2. Color scale (red, orange, yellow, green) is defined in each column, from lowest to highest transparency. 3. Based on Survey of Basic Municipal Information – MUNIC (IBGE, 2015); ICT Electronic Government survey 2015 (CGI.br, 2016); National Transparency Ranking (Ranking Nacional de Transparência – RNT), 2nd edition (MPF, 2016); and Brazil Transparency Scale (Escala Brasil Transparente – EBT), 3rd edition (CGU, 2016).](https://content.iospress.com:443/media/sji/2023/39-2/sji-39-2-sji230010/sji-39-sji230010-g002.jpg)
Transparency (part of the openness dimension) is one of the main dimensions of governance and probably that with most data available in Brazil. This section retrieves then part of a previous analysis [19], which illustrates the possibility of combining different data sources. Here we try to pinpoint regularities and again additional insights from the data (triangulation logic).1212 The exercise was based on four indexes, created by the author using surveys questions from four data sources:
1. Survey of Basic Municipal Information –MUNIC – 2014 edition [8]: responses from municipal executives if there were services (e.g., access to documents and forms, debt clearance certificates, etc.) and various other information published on the municipality website, such as expenditures, bidding procedures, etc.
2. ICT Electronic Government survey – 2015 edition [6]: responses by the municipal executive to questions such as: Does the local government’s website provide information on its organizational structure, such as an organizational chart and the names of the people responsible for areas, departments, or sectors? Does the local government’s website provide services that allow users to obtain electronic invoices? Does the local government’s website provide services that allow users to schedule appointments, consultations, and services, among others?
3. National Transparency Ranking (RNT), 2
4. Brazil Transparency Scale (EBT), 3
All four indexes were a sum of positive responses to the existence of the above-mentioned transparency mechanisms. As for results, Fig. 2 shows a territorial distribution of transparency levels in the four investigations (unit of analysis is the municipal executive branch). The North and Northeast regions of Brazil are the ones with the lowest standard of living, showing lower transparency levels in rankings. The most relevant segmentation regarding levels of transparency of the municipalities is however constructed with population size of the municipalities. The larger municipalities are more structured with instruments related to transparency.
Beyond differences of questions, other challenges to the comparison can be highlighted. First, there were methodological differences (some already pointed out in Sections 1 and 2), such as the fact that some sources are the census and others are based on a sample of municipalities. Secondly, CETIC.br considers that municipalities are respondents under imperatives of confidentiality, sharing only aggregate data, not even with a cooperation agreement and guarantee of confidentiality with IBGE, which was negotiated at the time of the disclosure of the ICT Gov 2017 survey results. Data matching at the individual level (municipality by municipality) was then impossible.
In addition to the methodological differences and diverse understandings of confidentiality, the exercise shown above presented an additional difficulty. CGU data did not include municipality codes produced by the official Brazilian statistical office (IBGE). To better explore the data (merge databases) it was then necessary to edit the names of the municipalities and cope with related difficulties (names with spaces, accents, apostrophes, municipalities that have changed their names over time etc.).
5.Final considerations
In this article we present some data sources and efforts related to the production of governance statistics in Brazil, both by the official statistics agency, IBGE, and other public administrations, all linked to investigation and control purposes or the mapping of ICT in Brazil.
IBGE has a consistent production, especially on issues related to the capacity (resources, policies, etc.) of states and municipalities to fulfill their missions (MUNIC and ESTADIC surveys). Household surveys have been investigating governance issues only marginally and irregularly, mostly about inequalities of access to public services. IBGE company surveys regularly collect a series of information, but in many cases the respondent is an external accountant. That means a challenge to the investigation of issues related to practices (management, for example) for which only the top management or the company’s human resources department could properly report.
The theme of victimization of companies due to corruption (important for the monitoring of target 16.5 of the SDGs) then collides with the current structure of investigations. To advance on this research agenda, it will be necessary to innovate in terms of the structure of the surveys, with investment and tests. The production of indicators related to the connection between citizens and public services (and their quality) is also part of IBGE’s production, but it depends on agreements with Ministries (therefore political decisions) to finance the statistical operations.
In relation to other producers mentioned (CGU, MPF and TCU), there has been no recent update (since 2016 or 2018) of the studies. Specific study would be necessary, but the situation may be linked to the fact that Brazil went through its worst economic crisis in 2015 and 2016, with a slow and insufficient recovery since then. The crisis coincided with the impeachment of President Dilma Roussef (August 2016), followed by governments with high top management turnover and fiscal austerity.
Collaboration and standardization in the Brazilian statistical system could be fostered with the update of the main statistical laws (from the 1970s). Problems of data sharing are one of the major challenges, which lead to inefficiency and reengineering. One can also mention the need to invest more in promoting meetings, seminars, training of data producers to adapt them to statistical purposes, to facilitate the merging of database, etc.
The exercise of bringing together four data sources that address transparency at the municipal level disclosed some of the difficulties faced by researchers due to the lack of standardization. At the same time, results showed consistency in the approach, as the most populous municipalities have a more developed administrative structure and a structure of websites including services for e-government transactions and transparency portals (some evolving as open data projects) along with other transparency mechanisms.
In Brazil there is clearly a “lack of governance” regarding governance statistics, i.e., there is no institutional structure to orchestrate the data/indicator production. The official statistical body has a proactive role, but is faced with budgetary and personnel limitations, which make it difficult to build a comprehensive and regular research agenda.
Inter-institutional initiatives have historically brought results: surveys, studies, training of civil servants, compilation of statistics and publications, but they suffer from staff turnover and, with exceptions (e.g., ENCCLA – National Anti-Corruption and Money Laundering Strategy), do not usually reach a “critical mass” necessary to institutionalize themselves. At the same time, the participation of some organizations in international forums and the requests made in these forums and expressed by the international system also lead to data collection and/or the production of studies, however without guarantee of continuity.
In terms of new research fronts, the agenda related to companies’ victimization (including by corruption) may be promising avenues due to the interest of employers’ associations. External financing has been one important driver to innovation in the Brazilian Statistical System. Regarding perceptions (especially the trust dimension), there is still a long way to go, which may be accelerated if Brazil moves on in the project of integrating the OECD. In 2022, this country had adhered to about 44% of instruments.
Notes
1 Here only public sector governance is explored. There is however a consolidated production in Brazil and elsewhere of studies related to the governance of private institutions with focus on accountability, relationships between agent (managers) and principal (shareholders and other stakeholders), etc.
2 Refer to https://www.sdg16hub.org/ for examples.
3 One step in this direction was the production by IBGE in 2019 of a methodological publication with national and international experiences related to governance statistics [2].
4 In addition, ICT infrastructure and policies are investigated in other CETIC.br surveys, applied to different types of establishments, public and private: ICT Health, ICT Culture etc. It is noteworthy that CETIC.br has all its production published in Portuguese and English (https://www.cetic.br/en) and a part in Spanish.
5 Disclosure takes place through publications and indicator systems, and since 2018, microdata has been available free of charge to the public on the CETIC.br portal.
6 Even if it was called “survey” from the beginning, the investigation was intended to be a census and, each year, has a response rate of about 99.9%. Recent Brazilian demographic censuses took place in 2000, 2010 and was fielded in 2022–23 (delayed due to the COVID-19 pandemic).
7 IBGE publications [9, 10] explore the governance topic, along with communication and informatics (comparing with 2014 edition), respectively at the state and municipal level.
8 The 2020 survey, after study by the responsible division, showed no major non-response issues.
9 Government censuses can be found on the INEGI website: https:// www.inegi.org.mx/datos/?ps=Programas.
10 It was collected in September of each year, with national coverage between 2004 and 2015, used Computer Aided Personal Interview – CAPI from 2007 and 2017. The last edition (2015) had a sample of about 150,000 households.
11 Continuous PNAD has a higher spread of the sample than the annual PNAD and investigates about 900,000 households per year. In 2020, it was hurriedly transferred to telephone data collection. Data collection has progressively returned to face-to-face format since mid 2021. Microdata is available for free download on the IBGE website.
12 In addition to what was explored here, the source study evaluated the evolution of services offered in municipal executive websites from 2006 and 2014 and tested "the hypothesis that longer time since the implementation of complex services on the websites of the municipalities would be positively correlated with greater commitment to ICT-based transparency in recent years. To test this hypothesis, the number of services reported by the municipalities in 2006, 2009, 2012, and 2014 (according to the MUNIC) was cross-referenced with the RNT assessment about municipalities websites in 2016, based on the questions: “10. Does the page allow citizens to request information in electronic format (e-SIC)?” and “11. Does it allow citizens to follow upon requests?”. As for results “the presence of additional services on their websites impacted the likelihood of municipalities answering ‘yes’ to questions 10 and 11…” in most comparisons [17, pp. 207–8]. See as well IBGE publications about states and municipalities [9, 10].
References
[1] | UNSD and Praia Group. Handbook on Governance Statistics. New York: UNSD; (2020) . |
[2] | Athias L, Botelho L. Panorama nacional e internacional da produção de indicadores sociais: estatísticas de governança. Rio de Janeiro: IBGE; (2019) . |
[3] | Breitman K, Salas P, Casanova M, et al. Open government data in Brazil. IEEE Intelligent Systems. (2012) ; 27: (3): 45-49. |
[4] | Dos Santos Brito K, Dos Santos Neto M, Da Silva Costa M, et al. Using parliamentary Brazilian open data to improve transparency and public participation in Brazil. In: Proceedings of the 15th Annual International Conference on Digital Government Research. (2014) . pp. 171-177. |
[5] | TCU – Federal Court of Accounts. Referencial básico de governança aplicável a órgãos e entidades da administração pública e ações indutoras de melhoria. Brasília: TCU; (2013) . |
[6] | CGU – Ministry of Transparency and Controller-General of the Union. Escala Brasil transparente – EBT 3.0. Brasília: CGU; (2016) . |
[7] | MPF – Federal Public Prosecutor’s Office. Ranking nacional de transparência – RNT – 2nd evaluation. (2016) . |
[8] | CGI.br – Brazilian Internet Steering Committee. Survey on the use of information and communication technologies in the Brazilian public sector: ICT Electronic Government 2019. São Paulo: CGI.br; (2020) . |
[9] | IBGE – Brazilian Institute of Geography and Statistics. Perfil dos estados brasileiros: 2019. Rio de Janeiro: IBGE; (2020) . |
[10] | IBGE – Brazilian Institute of Geography and Statistics. Perfil dos municípios brasileiros: 2019. Rio de Janeiro: IBGE; (2020) . |
[11] | Perú. Ley n. 27.563. Ley que autoriza la creación del registro nacional de municipalidades. Lima: Congreso de la República; (2001) . |
[12] | INEI. Indicadores de gestión municipal 2017, Lima: Instituto Nacional de Estadística e Informática. INEI; (2017) . |
[13] | INEGI. Encuesta de Cohesión Social para la Prevención de la Violencia y la Delincuencia (ECOPRED), Aguascalientes México: Instituto Nacional de Estadística y Geografía. INEGI; (2015) . |
[14] | INEGI. Encuesta Nacional de Calidad e Impacto Gubernamental (ENCIG), Aguascalientes, México: Instituto Nacional de Estadística y Geografía. INEGI; (2018) ; |
[15] | INEGI. Encuesta Nacional de Calidad Regulatoria e Impacto Gubernamental de Empresas (ENCRIGE), Aguascalientes, México: Instituto Nacional de Estadística y Geografía. INEGI; (2017) . |
[16] | INEGI. Encuesta Nacional de Victimización de Empresas (ENVE), Aguascalientes, México: Instituto Nacional de Estadística y Geografía. INEGI; (2019) . |
[17] | INEI. Ficha técnica: Encuesta Nacional de Hogares sobre Condiciones de Vida y Pobreza 2018, Lima: Instituto Nacional de Estadística e Informática. INEI; (2018) . |
[18] | INEI. Percepción ciudadana sobre gobernabilidad, democracia y confianza en las instituciones, Informe técnico No1, Lima: Instituto Nacional de Estadística e Informática. INEI; (2018) . |
[19] | Athias L. Governance, transparency and ICT use in municipal administration. In: CGI.br – Brazilian Internet Steering Committee. Survey on the use of information and communication technologies in the Brazilian public sector: ICT Electronic Government 2017. São Paulo: CGI.br; (2018) . |
Appendices
Appendix
Table 4
Topics investigated in MUNIC and ESTADIC surveys – 1999–2021
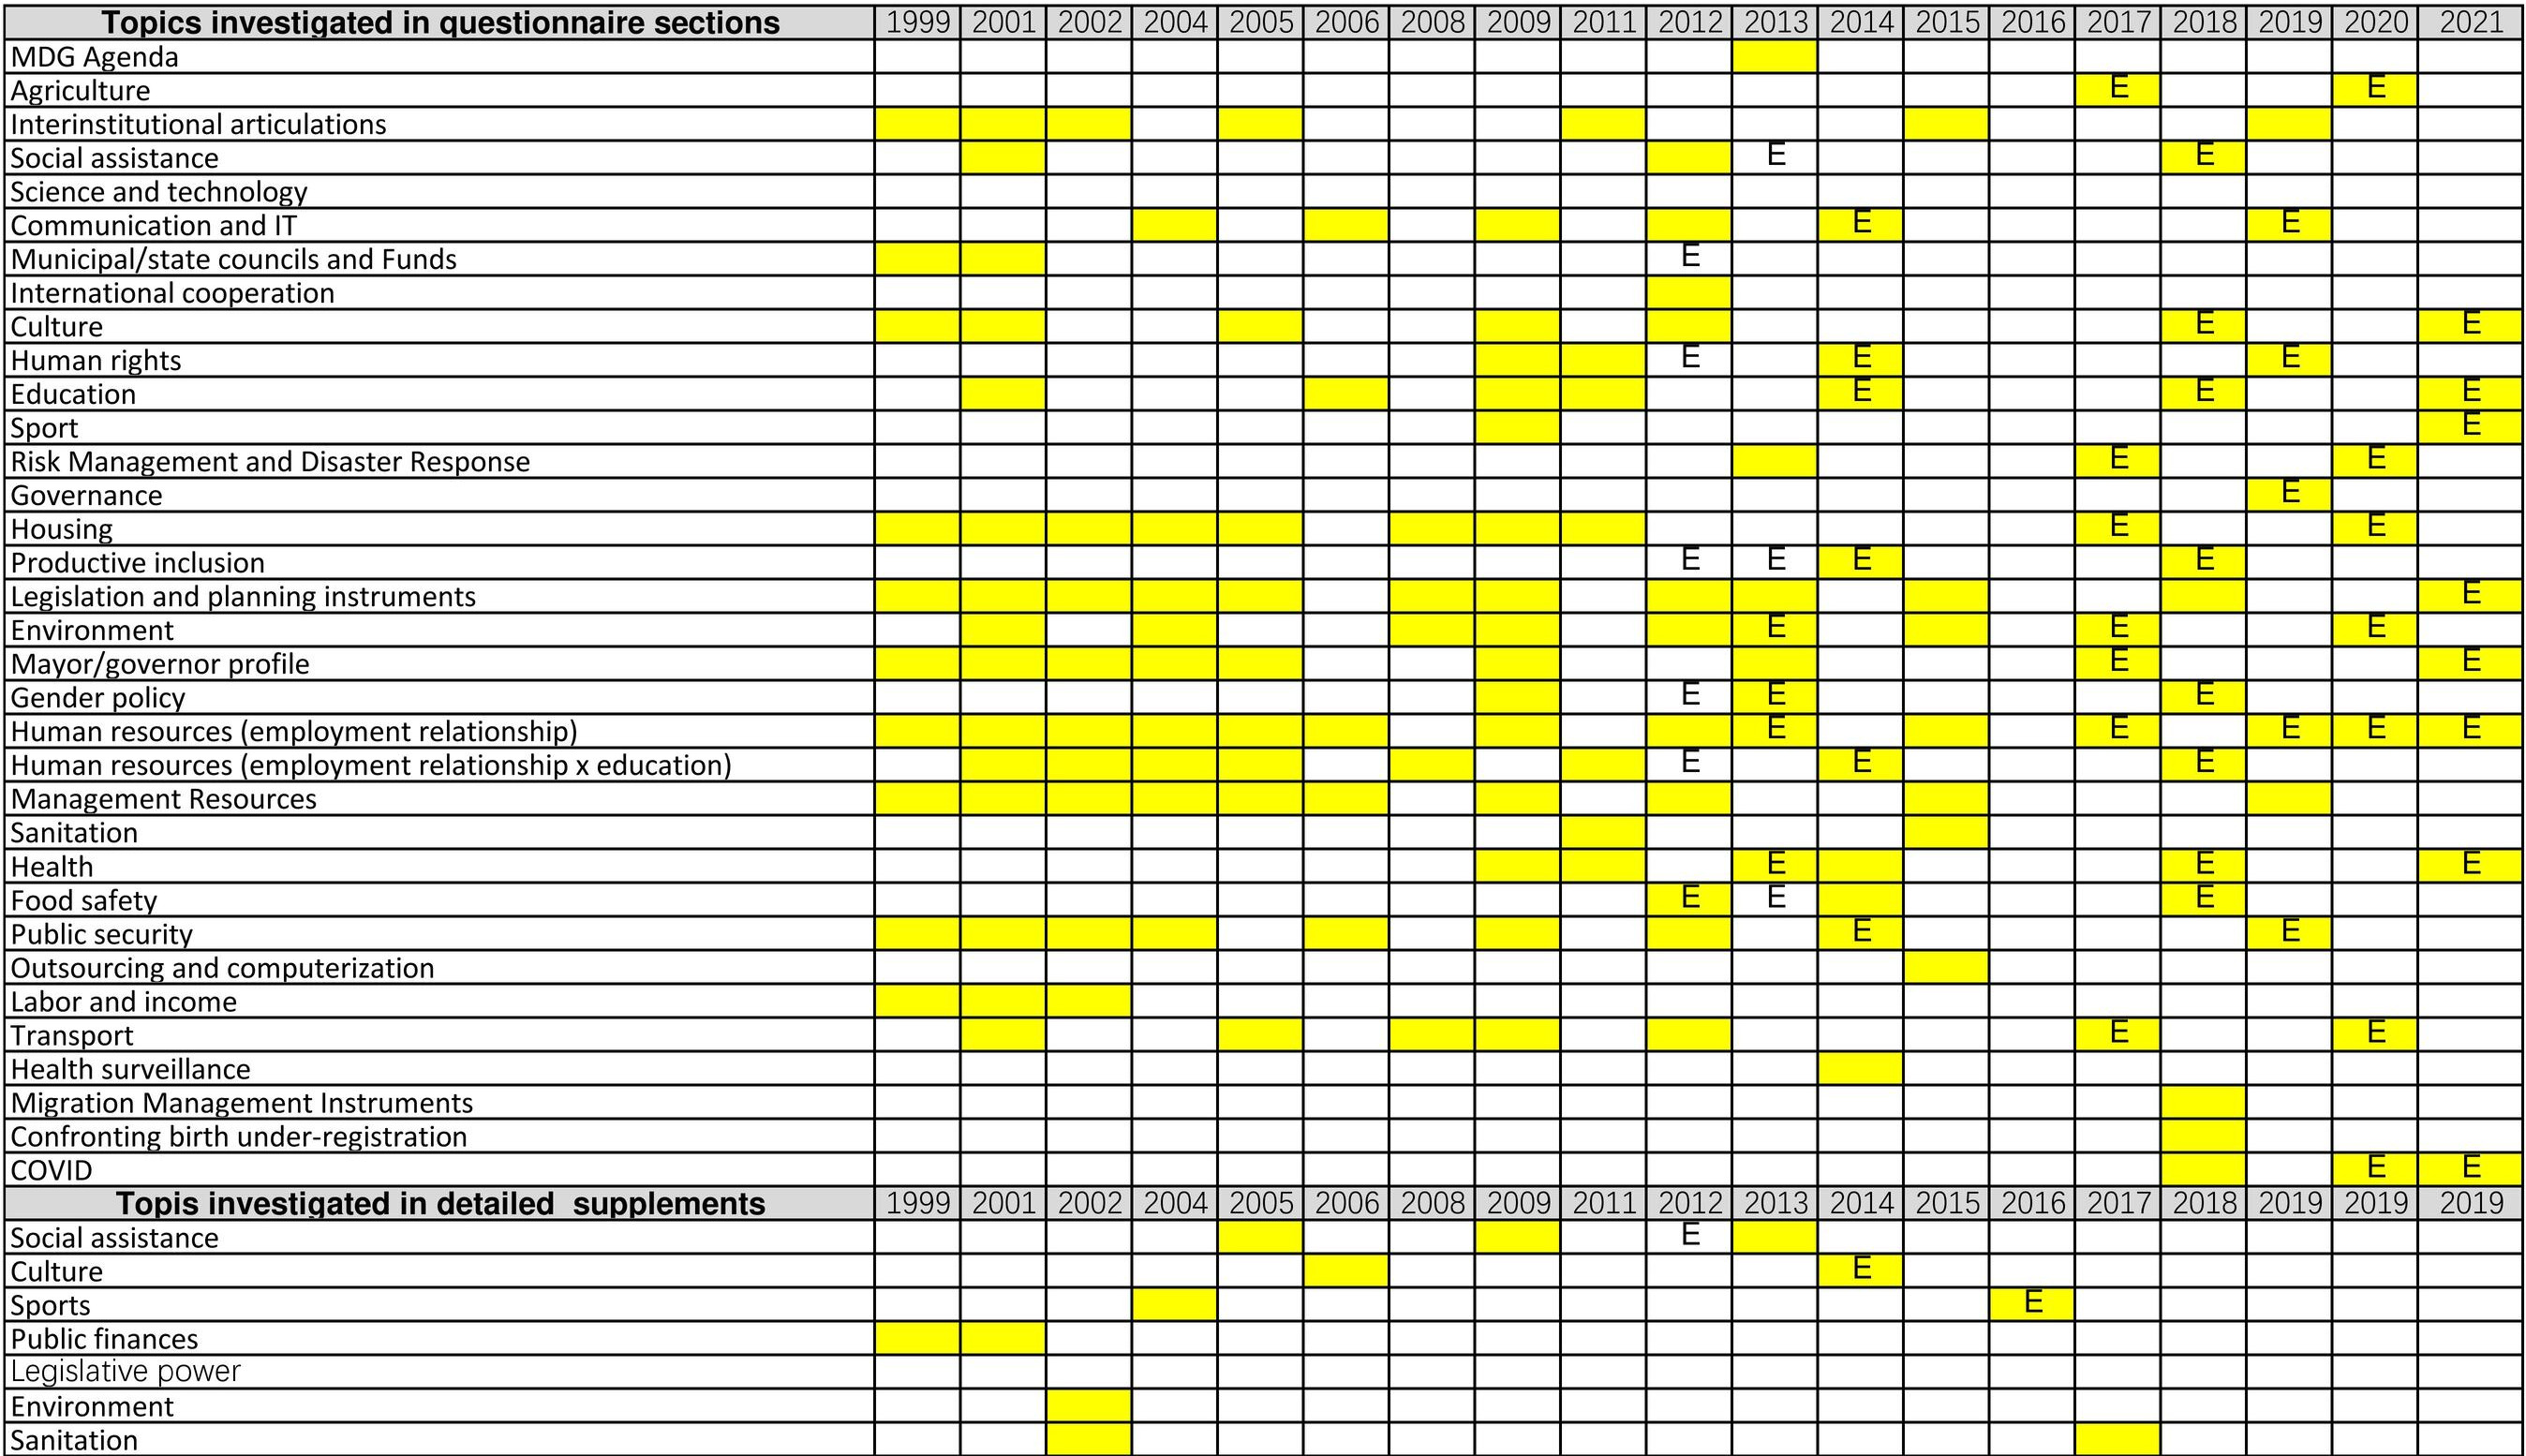
Note: Marked fields indicate the years in which the themes were investigated by MUNIC, while those marked with the letter “E” by ESTADIC. Sources: 1. IBGE, Basic Municipal Information Survey 1999/2021 and Basic State Information Survey 2012/2021.


