
Sense of insecurity and profile of crime victims in Mali from 2014 to 2020
Abstract
Coupled with both a political and a social crisis, the conflict which Mali has faced since 2012 has been the subject of many studies in the field of social sciences. Despite this, relatively little is known about non-lethal criminal violence, its evolution since the start of the crisis and how it is dealt with by the population. This article helps to bridge these gaps using data from Governance, Peace and Security (GPS) survey modules integrated into the modular and permanent household survey conducted each year since 2014. Given the unparalleled accuracy of GPS data, we are also able to establish a profile of crime victims in Mali. Despite a very high and growing sense of insecurity among the population, victimisation rates saw a steady decline in Mali up until 2019. This positive trend was brought to a halt in 2020 and set off alarm bells. Offences are rarely reported to the public authorities and we try to identify the possible reasons for this. Women, people with no formal education and members of poorer households in particular are generally less likely to be victims of crime. Residents of the regions of Mopti, Tombouctou and Gao tend to be more exposed.
1.Introduction
Africa is the continent with the highest average rate of burglaries and assaults in the world, and second in terms of armed robberies. Victimisation rates (see box with definitions) in Africa were 8% for burglaries, 6% for assaults and 4% for armed robberies [1].
The ongoing conflict in Mali since 2012, coupled with both a socio-political and territorial crisis marked by three military coups in less than ten years, has intensified the climate of insecurity. This worrying situation exposes populations to armed robberies, as well as physical and sexual assaults, thus giving rise to forced population displacement. This presents many obstacles for local development.
In view of the implications of these phenomena, the government of Mali has adopted certain measures to combat insecurity, including:
• the military orientation and programming law (loi d’orientation et de programmation militaire or LOPM) and the law on internal security planning (loi de programmation relative à la sécurité intérieure or LPSI);
• decree No. 401-P/RM of 9 June 2016 establishing the institutional framework for reform of the security sector;
• the 2018–2024 Framework on collaboration between the security forces and the population;
• the establishment of toll-free numbers for the national police and gendarmerie, and the Coordination Centre.
Nonetheless, and despite the Alger and Ouagadougou peace agreements signed in 2013 and 2015, violence has continued to increase since 2016. This has been the subject of many research studies in the fields of political sciences, sociology and economics [2, 3].
However, very little is known about the current crime situation in Mali. This is due, at least in part, to the difficulty of identifying violence of a criminal nature and differentiating it from violence of a political nature [4]. This article is intended to objectively shed light on central and local governance and civil society in terms of victimisation, the sense of insecurity and the perceived effectiveness of law enforcement in Mali between 2014 and 2020. Generally affecting a considerably wider proportion of society, this sense of insecurity has an impact on individuals’ decisions and behaviour, thus representing a much greater cost than the crime itself [5, 6]. This article follows on from a report on violence published by INSTAT, the National Institute of Statistics of Mali [7].
According to this report, the population expressed growing concern regarding crime between 2014 and 2018, while a decline in victimisation rates was observed over the same period. Victimisation affected less than 3% of adults in 2018. Thefts both inside and outside the home accounted for the most widespread offences in Mali, followed by physical assaults and acts of vandalism.
This study aims to update the results of this previous publication and to expand it to identify the victims’ profiles. The first part of this article is dedicated to a brief literature review. The second part presents the data and methodology used. The third part discusses the results. Firstly, in the form of descriptive statistics, we present the level and evolution of crime perceived and experienced; the threats and possession of weapons and the rates of offences reported to law enforcement agencies; confidence in the government as regards citizen protection; critical opinion towards law enforcement agencies on account of discrimination and corruption. Secondly, in the form of an econometric analysis, we question the main determinants of victimisation. In the final section, we discuss the results and propose avenues for future analysis.
| DefinitionsVictimisation: being a victim of an offence against your property or that of your household, or against your person. Crime/criminality: all of the crimes and offences committed in a given country or region. Offence: Article 2 of the Penal Code of the Republic of Mali divides offences into three categories: serious crimes, misdemeanours and petty offences. Misdemeanour: in the legal sense, a misdemeanour is an offence deemed as such by the criminal courts of the country (Code of Criminal Procedure of Mali). |
2.Literature review
Studies on the determinants of crime are nothing new [8] but they have seen a resurgence in economics with the emergence of the work of Becker [9]. This economist justifies his study with the fact that crime is a cost for society, from both a financial and a human point of view, and that it is worth trying to understand its foundations with a view to reducing the phenomenon. In a rational agent microeconomic model, Gary S. Becker models the decision to commit an offence as the result of a cost-benefit analysis. The low opportunity cost of committing an offence, owing to a public authority that is relatively less present, scarcely applied penalties or a failing labour market for instance, increases the probability of crime. Poverty and inequalities are therefore two determining factors of crime. Many studies have established a link between poverty and crime. the relationship between poverty and crime is still not direct, but living in poverty makes crime and the likelihood of being a victim much higher. the relationship between poverty and crime is still not direct, but living in poverty makes crime and the likelihood of being a victim much higher [10].
In sociology, two theories in particular explain victimisation: the lifestyle-exposure theory and the routine activities theory. According to the first, demographic differences between populations who have or have not been victims of crime stem from the individuals’ lifestyles, and their exposure to the most dangerous places at the most dangerous times. The second, although similar, differs from the first in its focus on explaining the changes in victimisation rates over time rather than between social groups [11]. The routine activities theories place the focus on “exposure”. The differences in the likelihood of being a victim are thus explained by the potential victims’ differing lifestyles. Individual variables such as gender, age, employment and marital status, in combination with certain characteristics specific to the head of household role are all determinants of victimisation. This “exposure” argument is supported by the work of Fajnzylber et al. [12] in economic literature on victimisation that uses individual characteristics. Men who are actively employed are more likely to be victims than those not employed. Level of education also plays a role in this regard as it influences the behaviours considered appropriate by the individuals and the structural barriers that it places on individuals’ decisions. Soares [13] finds that the level of education reduces the probability of being the perpetrator or the victim of a crime. This is consistent with the result obtained in Fajnzylber et al. [12] showing that the educational level in a society is positively associated with lower victimisation levels (even more so for assaults).
Economic literature also makes reference to the nature and quality of security measures (including populations’ distance from, therefore access to, the police) to explain victimisation. It is expected that these security measures reduce the number of offences. According to Becker [9], as an individual’s risk of being arrested increases according to the presence of the authorities, the probability of committing an offence decreases. The risk of victimisation should decrease in line with the number of members in a household and the proportion of men, as the household is considered to provide a social protection network. Furthermore, according to Delbecq et al. [14], the phenomenon of crime is the result of an absence or weakening of the social control implemented within a community due to poverty, residential instability and ethnic heterogeneity. According to the same authors, individuals are subject to the effects of neighbourhoods, in other words the place in which the individual lives has an impact on the opportunities available to them.
These studies corroborate the results of other research which highlights the influence of poverty, inequalities, family structures, unemployment [15], the types of neighbourhoods in which families live and the types of schools their children attend [16] on the crime experienced. Similarly, Cohen [17] indicates that the risk of being a victim increases in the poorest neighbourhoods. Bourguignon et al. [18] maintain that people living in areas with high unemployment rates are more exposed to the risk of being victims. However, if the offence is motivated by economic reasons, it is generally expected that the attractiveness of a target (level of income and asset ownership) increases the risk of being a victim [17, 19].
The analysis of victimisation has also been conducted by Barslund et al. [20] in Mozambique. The results of their study show that men have a higher probability of being victims, but that female heads of household are at a greater risk of victimisation than male heads of household. Moreover, the study shows that active employment and formal education increase the risk of victimisation. In addition, the probability of being a victim increases as income improves. However, the poorest bear a higher cost of crime.
3.Data and methodology
3.1Data sources
The Institut national de la statistique du Mali (National Institute of Statistics of Mali, or INSTAT), with the technical and financial support of the Swedish International Development Cooperation Agency (SIDA) through Statistics Sweden (SCB),11 has implemented a modular and permanent household survey (EMOP) system since 2011 to produce indicators for monitoring household living conditions. The EMOP’s main objective is to respond to the monitoring/evaluation of the Strategic Framework for Economic Recovery and Sustainable development (CREDD), the Sustainable Development Goals (SDGs) and the sectoral programmes implemented by Mali. It ensures the regularity and availability of indicators on household living conditions and can be pooled with other surveys of the same type. It involves providing information on the size and composition of households; identifying internal and external migration movements and urbanisation trends; making regular information on housing, health, employment, education, incomes etc. available; measuring access to the main infrastructure services; quantifying the productive activity of households and gauging their economic situation. The indicators used in the EMOP reflect international measurement standards, thus facilitating spatial comparison.
The EMOP is an annual survey conducted each year in four rounds. Each round comprises different survey modules, some of which are collected several times in the course of one survey wave. Each round of the survey covers three months of collection. Each edition generally starts in April and ends around the month of March the following year.22
Table 1
GPS-SHaSA surveys in mali between 2014 and 2020
| Number surveyed | 2014 | 2015 | 2016 | 2017 | 2018 | 2019 | 2020 |
|---|---|---|---|---|---|---|---|
| Regions (with Bamako) | 6 | 8 | 8 | 8 | 8 | 8 | 9 |
| Cercles (with Bamako) | 37 | 45 | 45 | 45 | 45 | 45 | 48 |
| Individuals | 13,835 | 15,098 | 14,312 | 14,210 | 14,610 | 14,019 | 15,631 |
Sources: 2014–2020 EMOP, INSTAT; calculations by the authors.
It is conducted on a representative sample of individuals and households (around 7000 per survey edition) at a national level, regional level and within the district of Bamako, and according to place of residence (urban and rural). The first edition of the EMOP started in April 2011. After suspension of the survey in 2012 following the institutional and security crisis, the series was resumed in 2013. For security reasons, the regions of Gao, Kidal and Tombouctou were not surveyed in the 2013/2014 edition of the survey. The regions of Gao and Tombouctou were included again in the 2014 to 2018 EMOP editions and the region of Kidal (whose population represents less than 1% of the total Malian population) has been surveyed again since 2019/2020. Currently, the EMOP is in its 10
In 2014, during the 2013/2014 EMOP edition, INSTAT administered the harmonised survey module on Governance, Peace and Security (GPS) for the first time. This EMOP survey module is now an instrument built into the Strategy for the Harmonisation of Statistics in Africa (SHaSA; CUA et al., 2010). This continental programme, coordinated by the African Union Commission, benefits from the institutional support of the UNDP and the scientific support of the DIAL-IRD research team.33 The need for reliable statistics on the quality of institutes, particularly in the framework of the Sustainable Development Goals (SDGs), makes these surveys more essential than ever. Since 2014, this survey has been an integral part of the EMOP and has been renewed annually, with a total of seven available waves. The sample and spatial coverage have been expanded (Table 1). The survey offers a unique opportunity to assess the consistency of results over time and, above all, to study trends in the security situation over a long period of seven years.
The GPS-SHaSA modules are collected during the fourth and final round of the EMOP each year between the months of January and April.44 From all the households in the EMOP, up to three adults (aged 18 and over) are randomly selected to respond to the GPS-SHaSA module. This ensures that the data collected is representative at a national level, at a regional level by area of residence (urban/rural), and of Bamako. As presented in Table 1, between 14,000 and 16,000 individuals are surveyed each year.
The purpose of the GPS-SHaSA modules is to collect the views of the population on governance, peace and security in the country. The questionnaire aims to collect three categories of information: population practices (experiences and behaviours); attitudes, norms and values; assessments and perceptions. The questionnaire collects both objective and factual information related to behaviours and experiences, and subjective information related to the survey participants’ perception or satisfaction. Capturing these two dimensions (experiences and perceptions) is fundamental to establishing a current state of play and monitoring the phenomena. In fact, perception and experience, which are not necessarily correlated, are taken into account for the evaluation and/or definition of policies. The modules gather information on attitudes towards democracy and its principles, access to and trust in institutions and individuals, exposure to and perception of corruption and discrimination, and civic and political participation. These modules also measure different aspects of exposure to political and criminal violence and the tools for their resolution, as well as the sense of insecurity.
In addition to this module-specific information, socio-economic data collected as part of the EMOP survey (gender, age group, level of education, type of integration into the labour market, level of poverty, etc.) is used. The combination of these first three categories of information provides the most complete overview of governance, peace and security in their different dimensions. Their cross-referencing with socio-economic variables makes it possible to identify the groups and sub-groups of the population most affected by dysfunctions in the governance, peace and security system, with a view to implementing policies that are appropriate, targeted and adapted to the specific context of each country.
3.2Methodology
To establish a profile of crime victims, we estimate the fact of being a victim of crime by constructing a binary variable assuming the value 1 when the individual declares to have been a victim of offences against their property or person in the last twelve months and 0 otherwise. This method will be applied to three dependent variables constructed for the purposes of the study:
i. Have been the victim of offences against property
ii. Have been the victim of offences against their person
iii. Have been the victim of at least one of the two types of offences
The estimation can be modelled as follows:
with
• Offences against property: thefts or attempted thefts in the home or outside the home (with or without violence); destruction (or damage) to personal property or property that belongs to a member of the household.
• Offences against people: physical violence excluding homicides (assault, beatings, etc.); sexual harassment; rape or attempted rape.
The explanatory variables used are the demographic and socio-economic characteristics of the individual, and geographical and temporal characteristics. These variables can be used to identify segments of the population that are potentially vulnerable to violence. Socio-economic characteristics can be used to highlight the link between individuals’ living conditions and their exposure to crime. Finally, geographical characteristics also determine the areas most exposed. In this way we control for the environment in which people live. Fafchamps and Moser (2003) have shown that isolation increases exposure to crime in Madagascar. We also control for unobservable time-invariant heterogeneity by including regional dummies.
Of these explanatory variables, we are particularly interested in the gender dimension. Women are probably more likely to experience certain types of violence, such as sexual violence. Age is a variable that should also be taken into account as it has an influence on the individuals’ lifestyle and their routine activities, and therefore on their likelihood of being a victim. It is possible that older individuals may suffer more offences against their property, simply due to the fact that younger people have fewer assets or less property of value. Level of education is a characteristic that affects both the behaviour and decisions of individuals and households in protecting themselves against violence. This characteristic is also related to individuals’ income level. To complete this profile, we include a binary variable identifying the poverty status of individuals. Whereas poorer individuals generally live in areas more exposed to violence and not as well protected, individuals who are not poor tend to have more assets and therefore the benefits for a person committing an offence by stealing from the latter rather than the former tend to be higher. Status in the labour market, namely if an individual is unemployed, inactive or actively employed and in which sector, can also have an influence on victimisation. Actively employed individuals are more likely to be potential targets, but some may benefit from the infrastructure of the institutional employment sector as additional protection or not. It is therefore possible that individuals employed in the public sector are better protected due to their status than casual workers. The latter are generally more vulnerable to shocks as they are not as well protected.
We repeat these estimations twice. First, we examine the determinants of crime between 2014 and 2019, a period during which crime followed a relatively linear dynamic over time. To control for dynamic unobservable heterogeneity at the national level, and therefore the evolution of crime, we include year variables in this. Secondly, we estimate the victimisation profile only for 2020, the last wave of data available. As observed in the descriptive analyses, this year seems unusual in the series of GPS-SHaSA data. It is therefore worth studying these two periods separately for different reasons. Firstly, the last wave of data available, which was collected in 2020, corresponds to the first year that victimisation rates increased since the collection of GPS-SHaSA began. It is possible that the profile of victims differs from that of other years when the crime rates declined on a quasi-linear basis. Moreover, 2020 was the only survey wave when the entire territory was covered, with the inclusion of the region of Kidal which was omitted from the survey up until that year.
4.Results
4.1Perceived crime
Figure 1.
Spatial and temporal dynamic of conflict events identified in mali between 1997 and 2019. Sources: ACLED, 1997–2019, produced by Thomas Calvo. Notes: Violent events include battles, violence against civilians and remote violence.
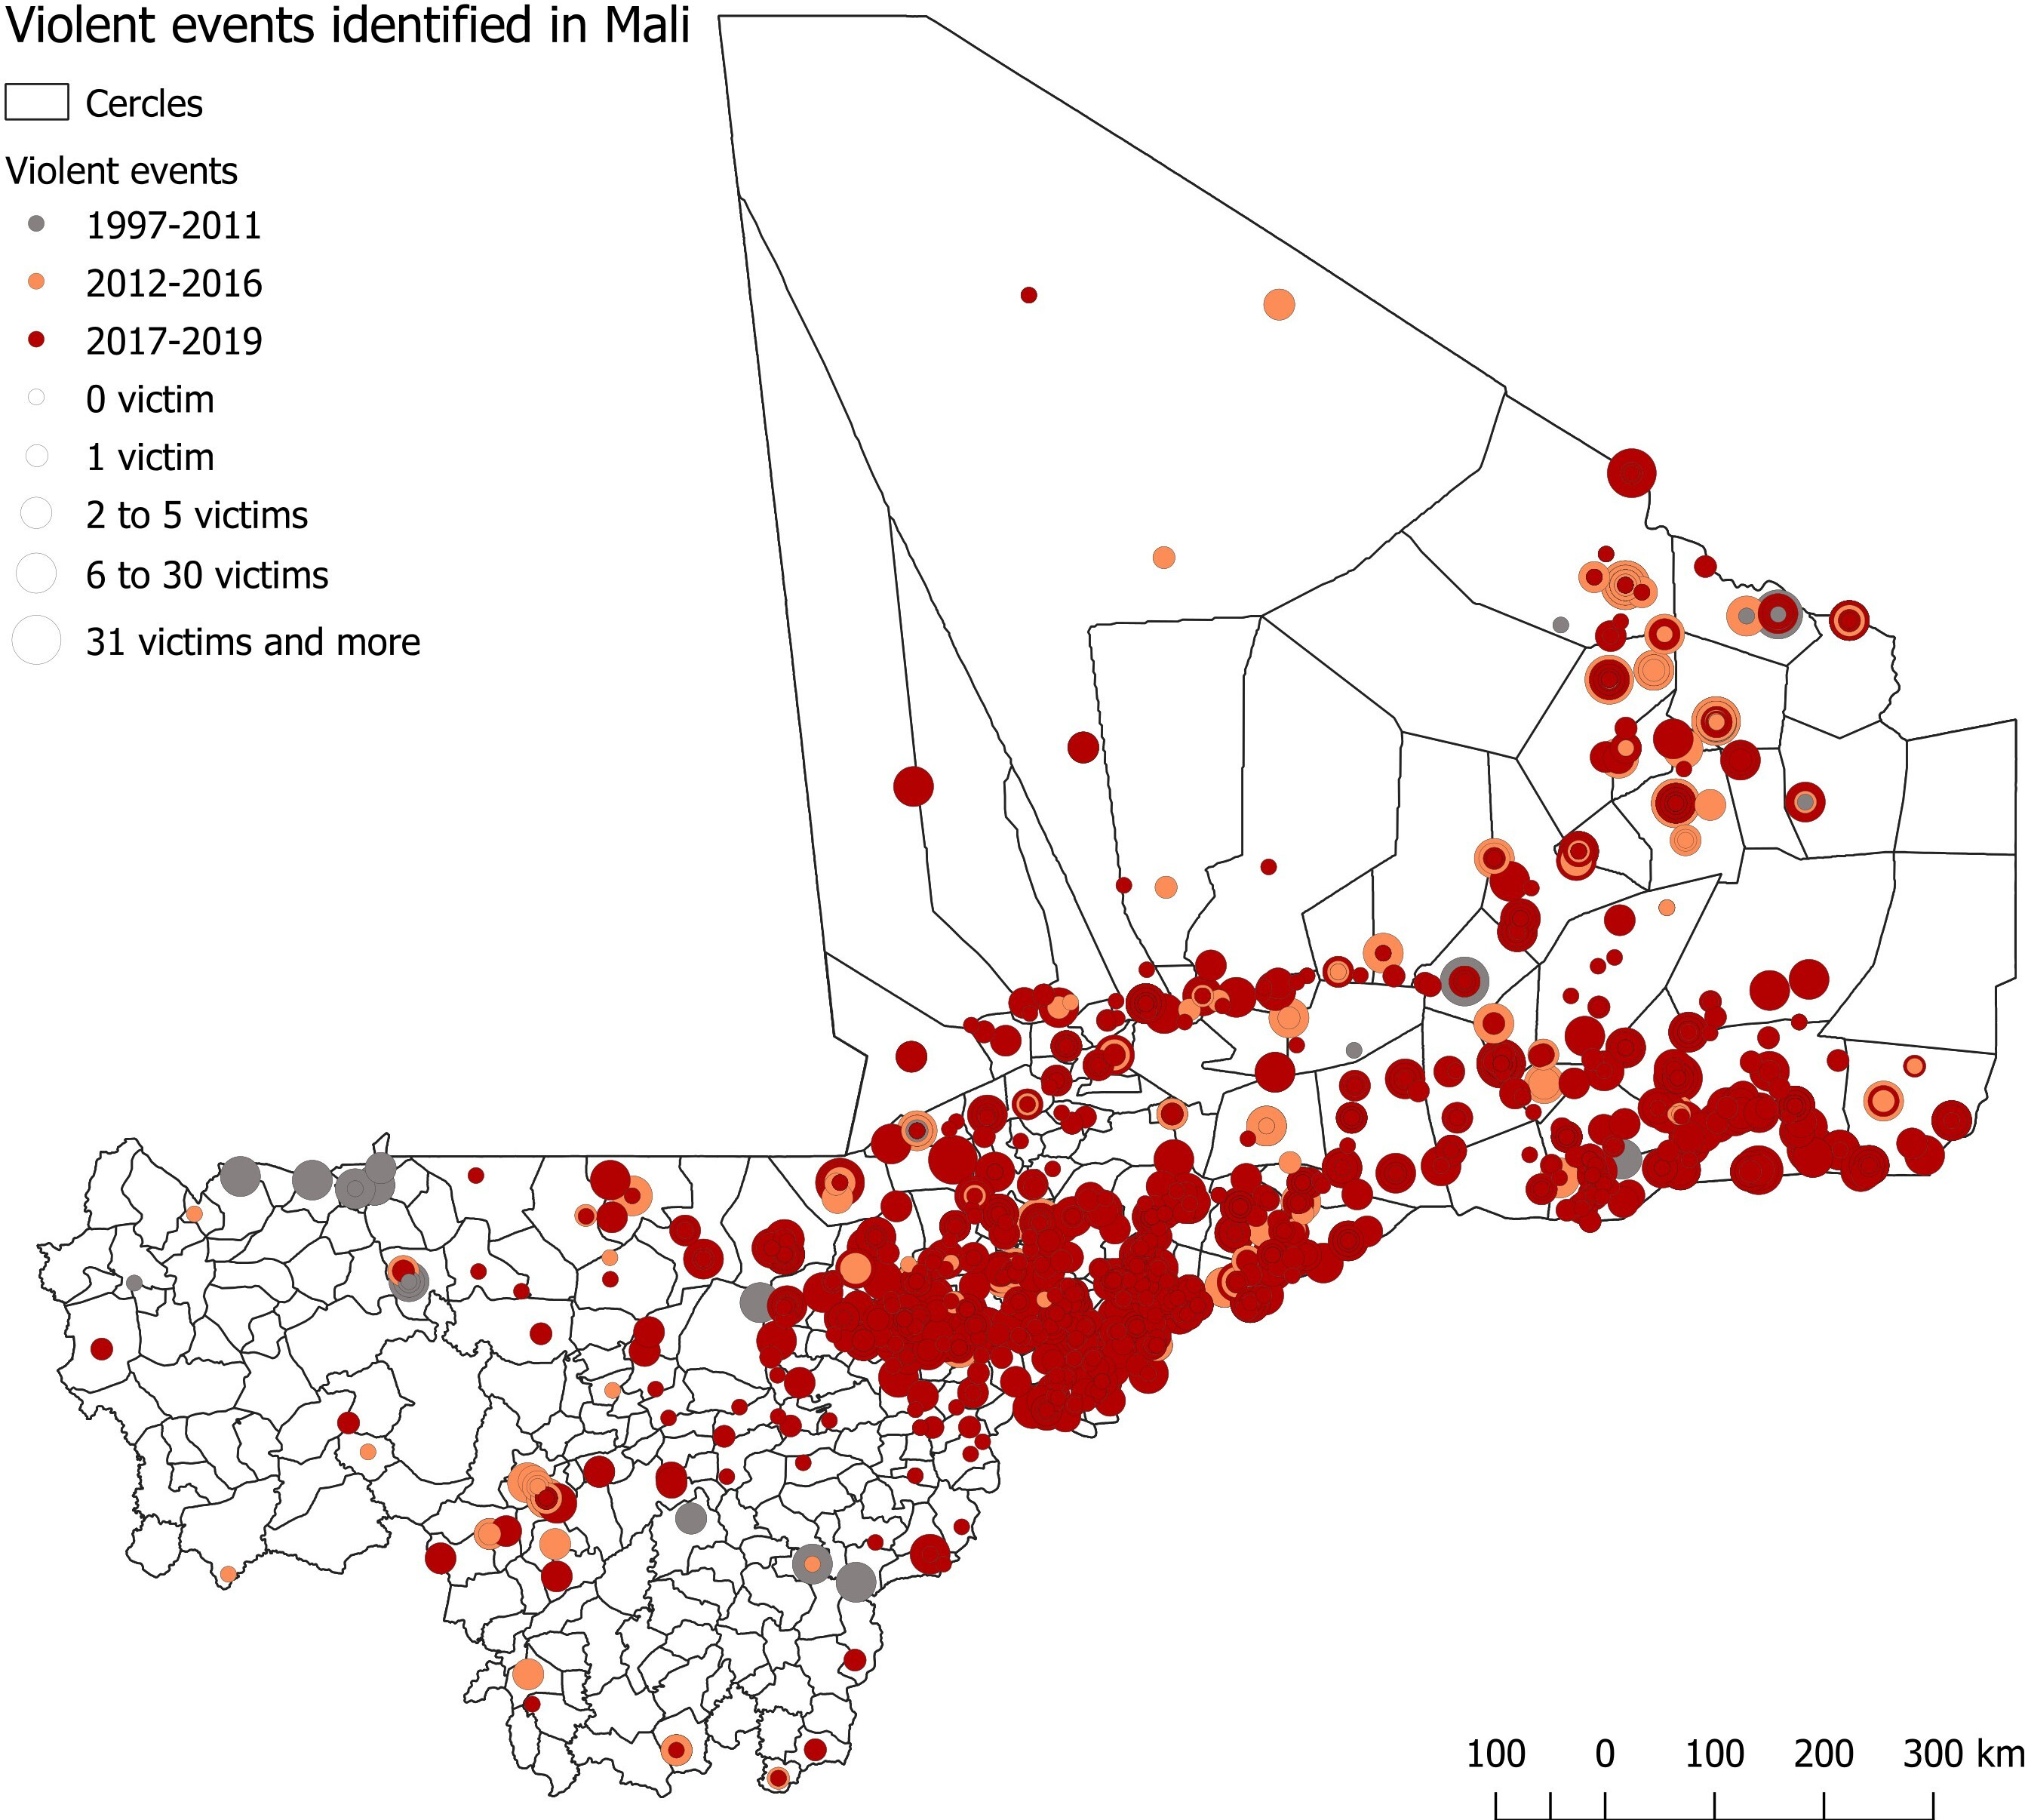
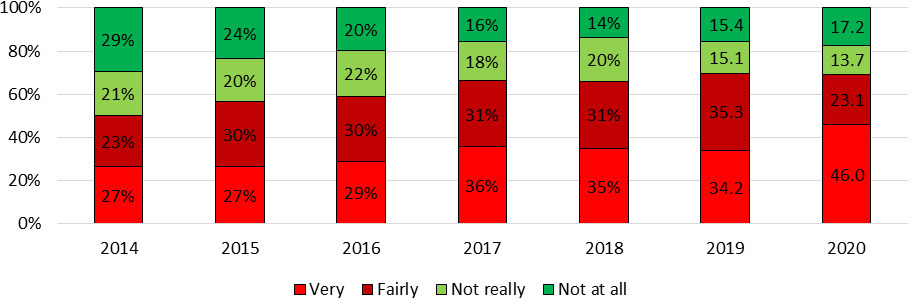
Figure 2.
Crime-related concern, 2014–2020. Sources: EMOP survey, GPS-SHaSA module, 2014–2020, INSTAT, Mali; calculations by the authors. Notes: The question is formulated as follows: In your daily life, are you currently concerned by the threat of criminal violence? Coverage: In 2014, three regions (Gao, Kidal and Tombouctou) could not be surveyed for security reasons. The regions of Gao and Tombouctou were included again from 2015, and the region of Kidal was re-included in 2020.
The violence that has affected the population and intensified in the years since 2012 in Mali (Fig. 1) largely contributed to the growing sense of insecurity shared by adults residing in Mali between 2014 and 2020. Terrorist threats were the fastest growing concern between 2014 and 2020.
Figure 3.
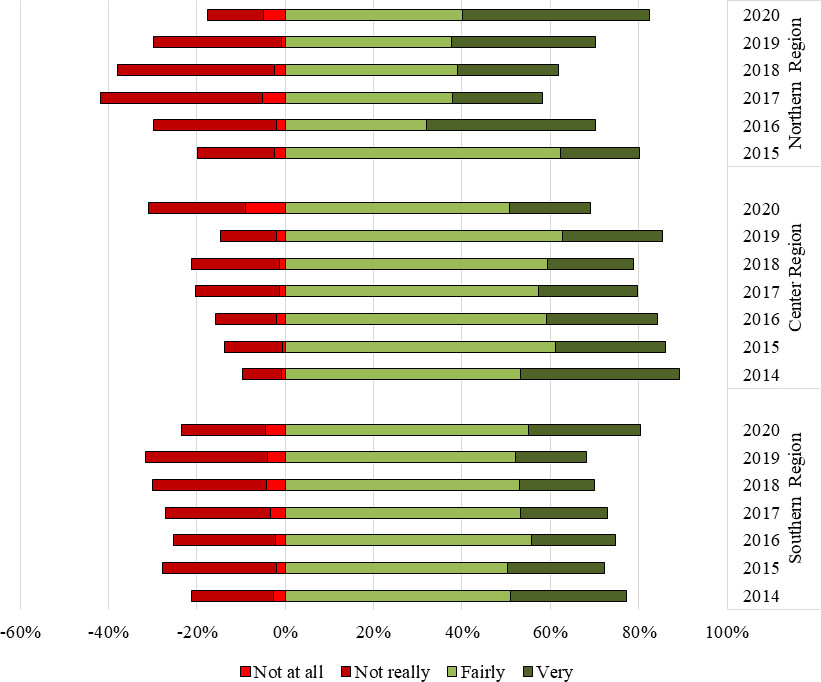
Crime-related concerns according to area of residence, 2014–2020. Sources: EMOP survey, GPS-SHaSA module 2014–2020, INSTAT, Mali; calculations by the authors. Notes: see Fig. 2.
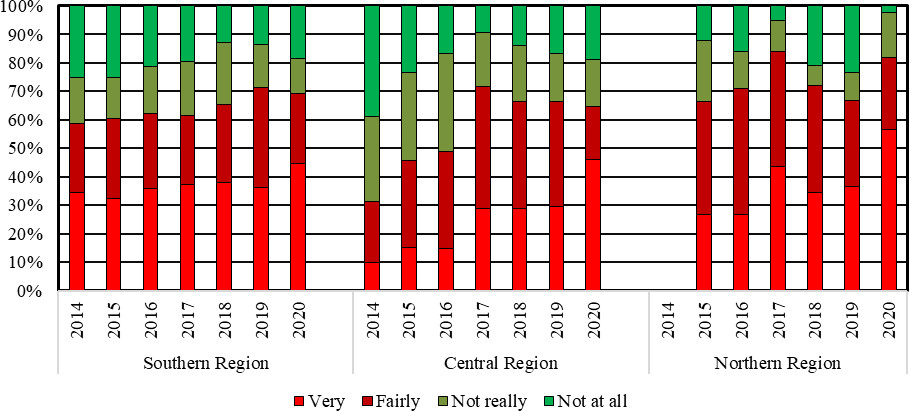
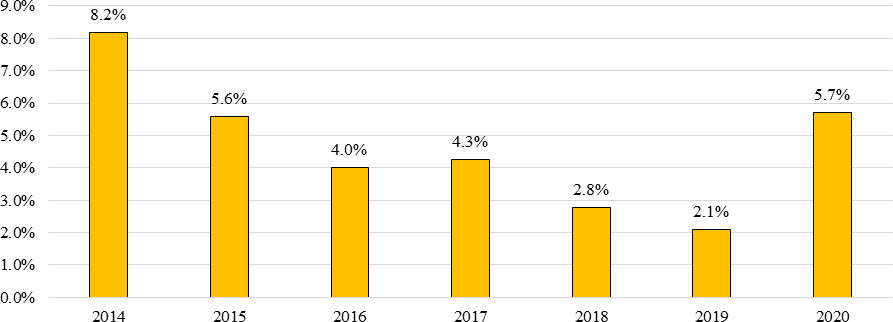
Figure 4.
Incidence of crime, 2014–2020. Sources: EMOP survey, GPS-SHaSA module 2014–2020, INSTAT, Mali; calculations by the authors. Notes: The question is formulated as follows: Over the past 12 months, have you experienced any of the following situations? Physical aggression; Theft in the home; Theft outside the home; Destruction of property; Sexual harassment; Rape or attempted rape.
The increased sense of insecurity in daily life can also be perceived across the entire country (Fig. 2). In 2020, almost seven in ten adults expressed their concern regarding crime (46% reported to be “very” concerned, and 23.1% “fairly” concerned). Less than one in five adults (17.2%) were not concerned at all and less than one in seven individuals (13.7%) were not really concerned.
Given the situation due to the complex armed conflict that has prevailed in Mali since 2012, particularly in the north of the country, the sense of insecurity was very high throughout the period studied among populations living in the regions of Gao, Tombouctou and Kidal (a region which was included in the sample once again at the end of the period under review). In 2020, more than eight in ten people declared to be “very” or “fairly” concerned (Fig. 3), which was similar to 2017 but significantly higher than the levels observed in 2018 and 2019. While the level of concern was relatively low in the central area of the country in 2014, the sense of insecurity grew substantially from 2015 and reached unprecedented levels in 2017 (with the rate rising from 30.9% to 45.6% and 71.7% respectively). This reflects the displacement of violence towards the centre of the country following the signature of the 2015 peace agreements and its intensification from 2016. As for the regions in the south of the country (Kayes, Koulikoro, Sikasso and Bamako) where the situation of conflict has gradually expanded, the sense of insecurity is also gaining ground among the population, particularly the segments declaring to be “very” concerned (33.9% in 2014 compared to 44.5% in 2020).
4.2La experienced crime (reported in the survey)
Given the sense of insecurity largely shared among the population, it is surprising to observe that the population who has been victim to crime is relatively low in Mali, irrespective of the type of offence (Figs 4 and 5).66 On the basis of a constant sample (excluding the Kidal region), i.e. between 2015 and 2019, the incidence rate even tends to decrease, falling from 5.6% to 2.1%. In 2020, this rate rose again to 5.7%.77 The considerably higher sense of insecurity since 2014, while the incident rate did not see a significant increase until 2019, demonstrates that perception and experience are two distinct phenomena that should be treated separately and in their own right.
Table 2
Evolution of the place and role of weapons (possession, threats, need) in the population, 2014–2020
| % threatened | 2014 | 2015 | 2016 | 2017 | 2018 | 2019 | 2020 |
|---|---|---|---|---|---|---|---|
| With a weapon | 0.9 | 0.5 | 0.8 | 1.2 | 0.9 | 0.9 | 2.7 |
| – Specifically with a firearm | 0.4 | 0.3 | 0.5 | 1.0 | 0.6 | 0.8 | 2.5 |
| – With other weapons | 0.6 | 0.3 | 0.5 | 0.8 | 0.5 | 0.4 | 1.6 |
Sources: EMOP survey, GPS-SHaSA module 2014–2020, INSTAT, Mali; calculations by the authors. Notes: Over the past 12 months, have you been threatened with a weapon?
Figure 5.
Experience of crime in mali by type of offence 2014–2020. Sources: EMOP survey, GPS-SHaSA module 2014–2020, INSTAT, Mali; calculations by the authors. Notes: see Fig. 4.
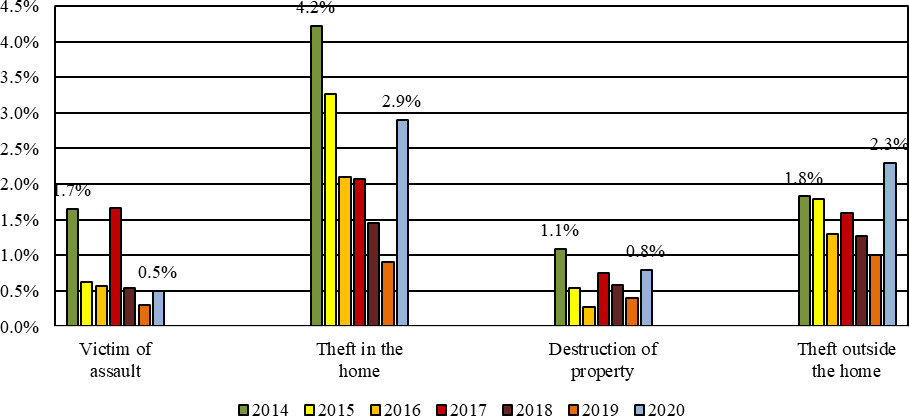
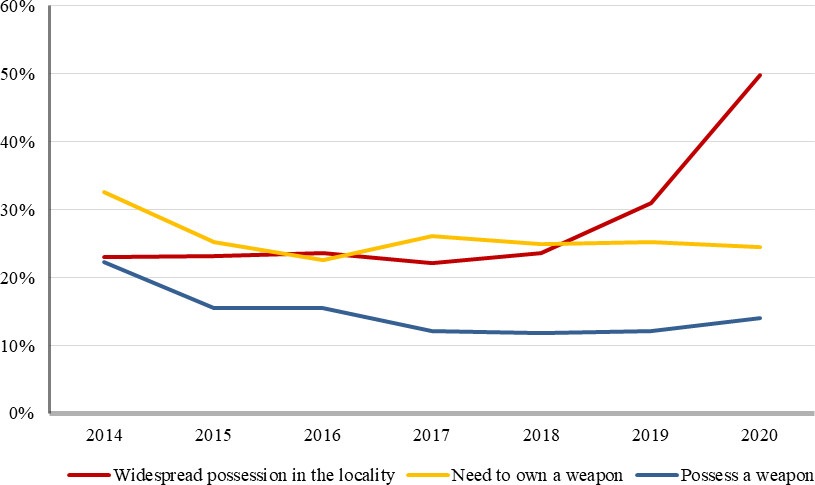
Figure 6.
Evolution of the place and role of weapons (possession, threats, need) in the population, 2014–2020. Sources: EMOP survey, GPS-SHaSA module 2014–2020, INSTAT, Mali; calculations by the authors. Notes: The question is formulated as follows: Do you (or someone from your household) possess a firearm? In your opinion, has the possession of weapons in your local community increased? Do you feel the need to possess a firearm to ensure your protection/that of your household?
The increase in crime observed in 2020 was mainly the result of an increase in thefts, both inside and outside individuals’ homes. In fact, these affected between 2 and 3% of adults in 2020 (Fig. 5). The destruction of property affected less than 1% of the population. As for physical aggression (excluding sexual harassment, rape or attempted rape), thankfully the number of victims was low, with an incidence rate of around 0.5%. By comparison, these victimisation levels are close to those observed in France (see Guedj et al. in this issue). In Mali, the situation therefore remains highly disparate between the different types of offences.
The percentages are clearly lower for people reporting to be victims of rape or attempted rape, and of sexual harassment (at 0.2% and 0.1% of the population respectively) however, they should be analysed carefully. On the one hand, the figures obtained on offences of this type in a standard survey (without a specific mechanism in place to guarantee anonymity on a delicate subject matter) are rarely high. On the other hand, the indicator used for rape or attempted rape generally refers to the individual’s entire lifetime and not only the last 12 months (less than 1% in France, see Guedj et al. in this issue).
4.3Threats and possession of weapons
The improvement in crime over the second half of the 2010s is confirmed by a series of indicators studied in the GPS-SHaSA survey. These established that the population’s firearms possession rate was down over the period (Fig. 6 and Table 2). Less than 12% of individuals in the country reported to be in possession, personally or in their household, of a firearm in 2018 compared to almost 16% in 2015 (and more than 22%, excluding the three regions in the north, in 2014). The need to possess a weapon for self-protection also declined or, at worst remained, stable (in 2018, 25% of adults felt the need). 23% reported that weapons possession was very or fairly common in their local community (as was the case in 2015).
On the contrary, from 2019 and in 2020, the situation seems to deteriorate again, as was the case with evolution of the country’s victimisation rate. Close to a third of the adult population in 2019 and half in 2020 reported that the possession of weapons is fairly or very common in their local community. The increase in the perceived proliferation of weapons in Mali is partially confirmed by the relative increase in the weapons possession rate in 2020. This figure reached 14%, i.e. an increase of two percentage points over 2018 and 2019. The fear, unease and concern taking hold among the population seem to fuel the need to possess a weapon for self-protection. This need, however, remained stable between 2018 and 2020, with one in four adults feeling the need to possess one. Furthermore, the rate of those threatened with a weapon tripled between 2018 and 2020, from less than 1% in previous years to almost 3% in 2020. The percentage of individuals threatened with a firearm was marginally higher than those threatened with other types of weapons in 2020.
Figure 7.
Reporting of offences, 2014–2020. Sources: EMOP survey, GPS-SHaSA module 2014–2020, INSTAT, Mali; calculations by the authors. Notes: The question is formulated as follows: If you have been a victim, have you or someone else reported the incident to law enforcement or to another institution?
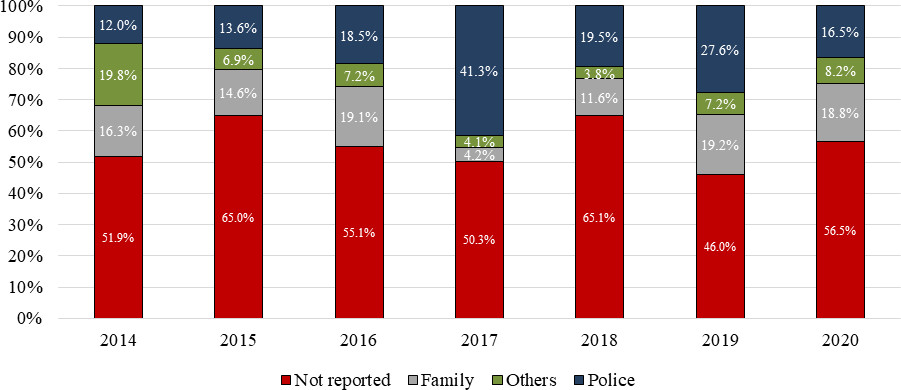
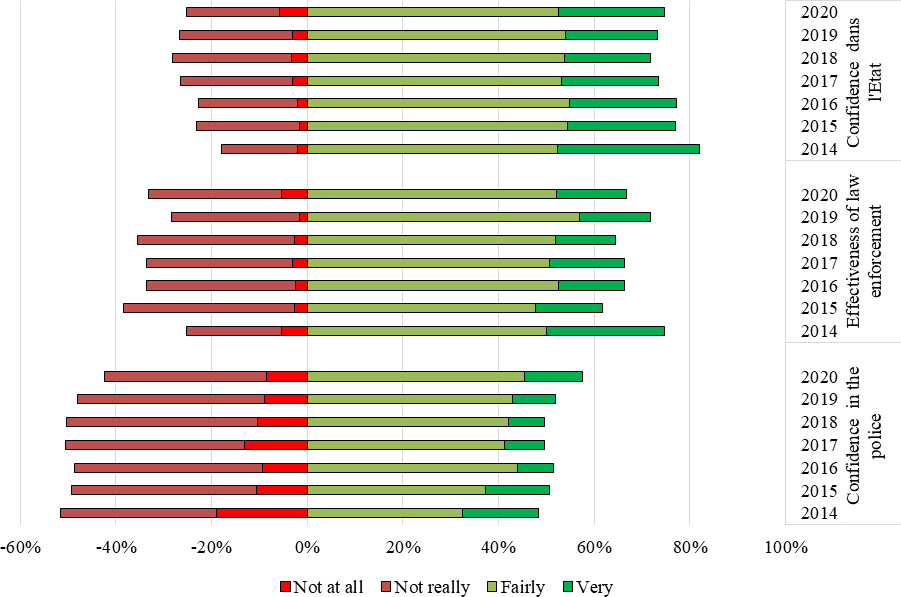
Figure 8.
Level of confidence in and effectiveness of law enforcement, and confidence in the government to ensure the safety of citizens, 2014–2020. Sources: EMOP survey, GPS-SHaSA module 2014–2020, INSTAT, Mali; calculations by the authors. Notes: The question is formulated as follows: To what extent do you have confidence in the government to ensure your protection, that of your household and your property against crime and violence? On the whole, is law enforcement effective in their handling of security problems? Do you trust the following institutions?
While Malian society does not seem to be in a phase of widespread arming, the rising trend in the indicators related to the possession of firearms highlights the need to closely monitor these indicators and to implement preventive policies on weapons possession in Mali.
4.4Rate of reporting to law enforcement
On the whole, the vast majority of crime victims do not report the events to the security forces and formal institutions (justice; Fig. 7). Less than one offence in five is reported. In more than half of cases (57% in 2020), incidents are not reported to anyone and when they are, the victims prefer to reach out to family or informal institutions. The year 2017 can be seen here as an atypical year with a particularly high rate of reporting to the police. These findings question the credibility of the public institutions in charge of ensuring citizens’ security and the approaches that can be taken to improve their image and effectiveness.
4.5Confidence in the government regarding the protection of citizens
The trend in confidence in the government remained relatively negative between 2014 and 2020 (Fig. 8) while a relative improvement was observed after 2018. While the levels of distrust have remained relatively stable since 2018, the adult population’s distrust in the Malian government to ensure their safety has increased over the years, with the proportion of adults with no trust at all in the government doubling between 2018 and 2020 (from 3% to 6%). A quarter of the population reported to have little or no confidence in the government. Despite the security situation, three quarters of adults remain confident in the government.
Figure 9.
Level of Confidence in the Government to Ensure the Protection of Citizens by Geographical Area, 2014–2020. Sources: EMOP survey, GPS-SHaSA 2014–2020, INSTAT, Mali; calculations by the authors. Notes: For the formulation of the question, see Fig. 7.
With regard to the regions, the central region of the country (Mopti and Ségou regions) has a higher level of confidence than elsewhere, with between eight and nine people out of ten expressing confidence (total or partial) in the government between 2014 and 2019 (Fig. 9). However, this confidence erodes over the years to reach 69% in 2020, making the central regions those with the least confidence in the government to ensure the security of its citizens. Close to a third of adults in the regions of Mopti and Ségou expressed their distrust in the government. Accordingly, this level of distrust reached the levels observed in the north of Mali during the period. Indeed, while 20% of the adults living in the north expressed their distrust with regard to the government’s role as protector in 2015, this number went on to double on a proportional basis in 2017 and 2018, with two fifths of adults in the north of Mali expressing their distrust. In 2020, the levels of distrust returned to those observed at the start of the period.
The feeling of distrust also saw significant growth in the southern regions (Kayes, Koulikoro, Sikasso and Bamako), increasing from 22% in 2014 to 32% in 2019.
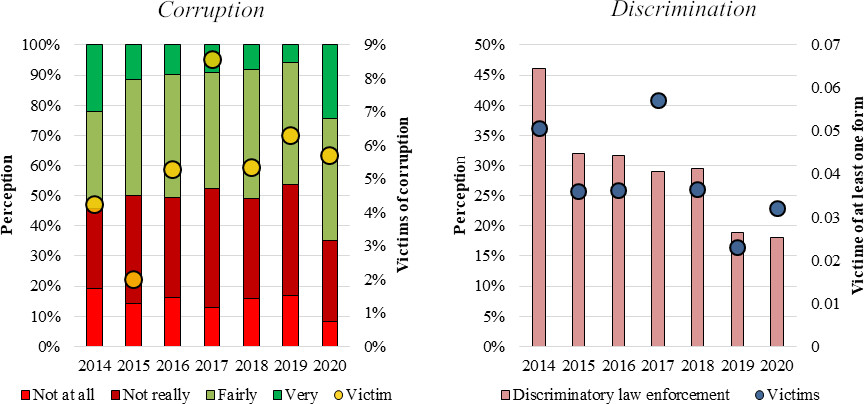
Figure 10.
Involvement of the security forces in corruption and discrimination towards the population (experiences and perceptions), 2014–2020. Sources: EMOP survey, GPS-SHaSA module 2014–2020, INSTAT, Mali; calculations by the authors. Notes: The question is formulated as follows: Is there discrimination by law enforcement based on…? Have you ever been a victim of discrimination due to your…? In your opinion, to what extent is law enforcement involved in corruption? Over the past twelve months, have you had to pay a bribe or give a gift to a law enforcement representative?
The results are more mixed with regard to the police. Over the period under review, around half of the population did not trust the police: for example, in 2018, 40% did “not really have confidence” and 10% did “not have any confidence” in them (Fig. 8). This opinion is partly explained by the population’s sharp criticism of the security forces’ effectiveness in their role of maintaining order. As a result, around a third of adults judged them negatively, with the figure peaking in 2015 (38%). The table does not paint too dark a picture however, as the vast majority continued to consider them effective (72% in 2019), while only one in twenty adults have considered them as totally ineffective since 2018.
4.6Critical judgement in terms of discrimination and corruption
Among the grievances addressed to the security forces, the survey makes it possible to examine two central issues: the discrimination they inflict on the population on the one hand and corruption on the other (Fig. 10). With regard to the first of these, between 2015 and 2018 around one in three adults believed that their practices were discriminatory, in one form or another. Moreover, each year almost 4% of the population was personally subjected to this discrimination (6% in 2017). A decline in the discriminatory phenomenon was both perceived and experienced from 2019 (18% and 3% respectively in 2020) which should be investigated further.
On the second aspect, based on people’s experiences over the past 12 months, corruption is limited: between 5% and 6% of adults said they had been victims of law enforcement corruption from 2018 to 2020, a significant improvement on the increase between 2015 (2%) and 2017 (9%). However, these rates, which are far from negligible, partly explain why the majority of the population (65% in 2020) considers that law enforcement is somewhat or very involved in corruption. At 14 percentage points higher than previous years, the police’s perceived involvement in corruption was widely shared among the adult population in 2020.
4.7Profile of victims
The estimation presented in the methodology section enables a general profile of crime victims in Mali to be established. The results are presented in Table 3 in which the first three columns establish a profile for the 2014–2019 period and the last three for 2020. The estimations differ according to the use of year dummies to control for the time-variant unobserved heterogeneity at a national level. The coefficients associated with the survey years confirm the significant decrease in crime levels over the years in comparison to 2014, irrespective of the type of offence (offences against property or the person).
Table 3
Profile of adult victims of offences (offences against property and people) (odd ratios)
| 2014–2019 | 2020 | |||||
| All offences | Offences against property | Offences against people | All offences | Offences against property | Offences against people | |
| Gender (reference: men) | ||||||
| Female | 0.787 | 0.755 | 0.901 | 0.903 | 0.737 | 1.059 |
| (0.0284) | (0.0290) | (0.0718) | (0.0520) | (0.0526) | (0.0849) | |
| Age group (reference: 15–24 years) | ||||||
| 25–34 years | 1.039 | 1.063 | 0.962 | 0.910 | 0.997 | 0.847 |
| (0.0535) | (0.0599) | (0.0964) | (0.0766) | (0.103) | (0.101) | |
| 35–54 years | 1.053 | 1.156 | 0.646 | 0.953 | 0.897 | 1.043 |
| (0.0524) | (0.0625) | (0.0669) | (0.0768) | (0.0901) | (0.117) | |
| 55 or over | 0.933 | 1.056 | 0.510 | 0.904 | 0.777 | 1.050 |
| (0.0563) | (0.0681) | (0.0693) | (0.0844) | (0.0914) | (0.134) | |
| Level of education (reference: no level) | ||||||
| Primary school | 1.192 | 1.191 | 1.083 | 1.381 | 1.230 | 1.545 |
| (0.0566) | (0.0600) | (0.115) | (0.108) | (0.116) | (0.167) | |
| Middle school | 1.150 | 1.085 | 1.266 | 1.312 | 1.127 | 1.492 |
| (0.0692) | (0.0713) | (0.151) | (0.115) | (0.122) | (0.177) | |
| Secondary school and higher | 0.972 | 0.981 | 0.822 | 1.394 | 1.416 | 1.298 |
| (0.0731) | (0.0779) | (0.142) | (0.155) | (0.192) | (0.199) | |
| Employment status (reference: employed in the private sector) | ||||||
| Employed (formal private) | 0.799 | 0.751 | 1.087 | 2.427 | 2.450 | 1.476 |
| (0.109) | (0.109) | (0.308) | (0.996) | (1.143) | (0.978) | |
| Employed (informal private) | 1.036 | 1.017 | 0.877 | 1.374 | 1.152 | 1.882 |
| (0.106) | (0.109) | (0.199) | (0.242) | (0.247) | (0.478) | |
| Employed (NGO) | 1.585 | 1.394 | 1.706 | 1.968 | 0.828 | 4.366 |
| (0.271) | (0.260) | (0.595) | (0.617) | (0.363) | (1.749) | |
| Employed, domestic worker | 0.823 | 0.812 | 1.035 | 1.018 | 1.601 | 0.378 |
| (0.0924) | (0.0960) | (0.258) | (0.201) | (0.373) | (0.125) | |
| Unemployed | 1.103 | 1.132 | 0.990 | 1.452 | 1.479 | 1.586 |
| (0.131) | (0.141) | (0.258) | (0.311) | (0.376) | (0.506) | |
| Unemployed | 0.838 | 0.838 | 0.748 | 1.088 | 1.047 | 1.173 |
| (0.0891) | (0.0936) | (0.176) | (0.197) | (0.253) | (0.310) | |
| Incidence of poverty (reference: not poor) | ||||||
| Poor | 0.881 | 0.918 | 0.723 | 0.967 | 0.805 | 1.159 |
| (0.0310) | (0.0343) | (0.0565) | (0.0673) | (0.0662) | (0.117) | |
| Living environment (reference: urban) | ||||||
| Rural | 0.875 | 0.856 | 0.831 | 1.204 | 1.274 | 1.171 |
| (0.0344) | (0.0358) | (0.0700) | (0.0860) | (0.117) | (0.115) | |
| Region (reference: Kayes) | ||||||
| Koulikoro | 0.587 | 0.537 | 1.304 | 2.829 | 3.366 | 1.077 |
| (0.0343) | (0.0335) | (0.156) | (0.317) | (0.431) | (0.195) | |
| Sikasso | 0.865 | 0.844 | 0.876 | 1.080 | 1.467 | 0.306 |
| (0.0430) | (0.0438) | (0.108) | (0.133) | (0.202) | (0.0732) | |
| Ségou | 0.382 | 0.339 | 0.717 | 0.207 | 0.258 | 0.0630 |
| (0.0244) | (0.0235) | (0.0996) | (0.0444) | (0.0607) | (0.0327) | |
| Mopti | 0.445 | 0.393 | 0.862 | 4.746 | 2.556 | 6.192 |
| (0.0279) | (0.0267) | (0.113) | (0.511) | (0.340) | (0.909) | |
| Tombouctou | 0.582 | 0.545 | 0.824 | 2.844 | 0.209 | 6.539 |
| (0.0470) | (0.0469) | (0.148) | (0.334) | (0.0620) | (0.985) | |
| Gao | 1.016 | 0.882 | 2.511 | 1.195 | 0.659 | 1.765 |
| (0.0823) | (0.0778) | (0.377) | (0.197) | (0.152) | (0.380) | |
| Kidal | 0.164 | 0.229 | ||||
| (0.0843) | (0.118) | |||||
| Bamako | 0.443 | 0.448 | 0.343 | 2.761 | 2.182 | 3.035 |
| (0.0289) | (0.0304) | (0.0597) | (0.327) | (0.327) | (0.484) | |
| Years | YES | YES | YES | NO | NO | NO |
| Observations | 83,283 | 83,283 | 83,283 | 9,512 | 9,512 | 9,512 |
Sources: EMOP survey, GPS-SHaSA module 2014–2020, INSTAT, Mali; calculations by the authors.
Table 4
Influence of individual characteristics of actively employed adults on being a victim of crime
| 2014–2019 | 2020 | |||||
| All offences | Offences against property | Offences against people | All offences | Offences against property | Offences against people | |
| Gender | ||||||
| Female | 0.746 | 0.696 | 0.911 | 0.828 | 0.657 | 1.095 |
| (0.0315) | (0.0315) | (0.0852) | (0.0620) | (0.0628) | (0.111) | |
| Age group (reference: 18–24 years) | ||||||
| 25–34 years | 1.092 | 1.118 | 0.923 | 0.912 | 1.032 | 0.826 |
| (0.0721) | (0.0806) | (0.118) | (0.113) | (0.158) | (0.142) | |
| 35–54 years | 1.103 | 1.201 | 0.664 | 1.016 | 0.968 | 1.077 |
| (0.0691) | (0.0816) | (0.0841) | (0.119) | (0.141) | (0.174) | |
| 55 and over | 0.987 | 1.104 | 0.463 | 0.993 | 0.889 | 1.057 |
| (0.0762) | (0.0909) | (0.0839) | (0.136) | (0.153) | (0.200) | |
| Level of education (reference: no education) | ||||||
| Primary school | 1.229 | 1.207 | 1.223 | 1.309 | 1.158 | 1.411 |
| (0.0663) | (0.0693) | (0.146) | (0.123) | (0.132) | (0.185) | |
| Middle school | 1.153 | 1.135 | 1.036 | 1.228 | 1.202 | 1.119 |
| (0.0885) | (0.0930) | (0.178) | (0.143) | (0.169) | (0.184) | |
| Secondary school | 0.896 | 0.946 | 0.752 | 1.197 | 1.345 | 0.888 |
| and higher | (0.101) | (0.111) | (0.196) | (0.193) | (0.265) | (0.199) |
| Institutional sector (refernce: public sector) | ||||||
| Formal private company | 0.854 | 0.814 | 0.653 | |||
| (0.189) | (0.187) | (0.287) | ||||
| Informal private company | 1.087 | 1.089 | 0.534 | 0.495 | 0.442 | 1.060 |
| (0.221) | (0.229) | (0.216) | (0.191) | (0.190) | (0.657) | |
| NGO, IO, associations | 1.730 | 1.528 | 1.104 | 0.657 | 0.310 | 2.348 |
| (0.428) | (0.403) | (0.543) | (0.307) | (0.187) | (1.616) | |
| Domestic workers | 0.902 | 0.908 | 0.676 | 0.328 | 0.518 | 0.204 |
| (0.188) | (0.196) | (0.279) | (0.131) | (0.231) | (0.134) | |
| Place of work (reference: itinerant) | ||||||
| Improvised workspace | 0.909 | 1.006 | 0.443 | 0.948 | 1.037 | 0.600 |
| on the public road | (0.0917) | (0.110) | (0.0902) | (0.157) | (0.221) | (0.132) |
| Fixed workplace on the | 0.972 | 1.055 | 0.550 | 0.695 | 0.934 | 0.421 |
| public road/public market | (0.0896) | (0.106) | (0.0954) | (0.112) | (0.191) | (0.0906) |
| Home | 1.006 | 1.155 | 0.399 | 2.044 | 1.845 | 1.131 |
| (0.105) | (0.129) | (0.0910) | (0.310) | (0.366) | (0.229) | |
| Professional workplace | 0.746 | 0.809 | 0.403 | 1.097 | 0.859 | 0.961 |
| (0.0612) | (0.0726) | (0.0592) | (0.157) | (0.157) | (0.180) | |
| Poverty status | ||||||
| Poor | 0.867 | 0.904 | 0.711 | 0.906 | 0.806 | 0.983 |
| (0.0362) | (0.0402) | (0.0675) | (0.0774) | (0.0857) | (0.116) | |
| Living environment | ||||||
| Rural | 0.964 | 0.943 | 0.903 | 1.081 | 1.184 | 1.075 |
| (0.0484) | (0.0502) | (0.0996) | (0.104) | (0.150) | (0.138) | |
| Region (reference: Kayes) | ||||||
| Koulikoro | 0.521 | 0.481 | 0.956 | 2.597 | 2.709 | 1.269 |
| (0.0391) | (0.0386) | (0.152) | (0.350) | (0.416) | (0.272) | |
| Skiasso | 0.876 | 0.876 | 0.760 | 1.085 | 1.583 | 0.224 |
| (0.0500) | (0.0522) | (0.111) | (0.148) | (0.240) | (0.0631) | |
| Ségou | 0.441 | 0.397 | 0.827 | 0.194 | 0.237 | 0.0651 |
| (0.0317) | (0.0307) | (0.129) | (0.0503) | (0.0676) | (0.0388) | |
| Mopti | 0.445 | 0.388 | 0.888 | 4.425 | 2.081 | 6.115 |
| (0.0320) | (0.0303) | (0.134) | (0.551) | (0.326) | (1.016) | |
| Tombouctou | 0.559 | 0.520 | 0.756 | 2.497 | 0.183 | 6.280 |
| (0.0551) | (0.0547) | (0.166) | (0.356) | (0.0623) | (1.152) | |
| Gao | 1.072 | 0.925 | 2.437 | 1.086 | 0.351 | 2.025 |
| (0.124) | (0.117) | (0.519) | (0.277) | (0.153) | (0.611) | |
| Kidal | – | – | – | |||
| Bakamo | 0.424 | 0.416 | 0.410 | 2.457 | 1.804 | 2.978 |
| (0.0351) | (0.0362) | (0.0841) | (0.356) | (0.319) | (0.589) | |
| Years | YES | YES | YES | NO | NO | NO |
| Observations | 55,714 | 55,714 | 55,714 | 9,017 | 9,017 | 9,017 |
Women are relatively less often victims than men. In 2020, men were 1.1 times more at risk of being victim to crime. This result was entirely driven by offences against property. It is more likely for men to be victims of a form of theft or vandalism than women. On the other hand, women are not significantly less exposed to the risk of assault than men. This result is strong regardless of the period in question.
In general, age does not seem to be one of the criteria of victimisation in Mali. However, this masks differences according to the type of offence observed. Over the 2014–2019 period, people aged between 35 and 54 were 1.15 times more at risk of being victims of offences against property than those aged 18 to 24. On the contrary, in terms of physical aggression, the probability of being a victim was lower for individuals over the age of 35. This result is relatively unsurprising considering that individuals over the age of 35 have probably accumulated more capital or assets that can be stolen than young people who have entered the labour market more recently. These individuals may also have routine activities which expose them more to physical aggression, such as going out at night or in areas that are relatively more exposed to violence. These results were not maintained in 2020.
In terms of living environment, households in rural areas were significantly less exposed to crime than those residing in urban areas between 2014 and 2019. While this result may seem contradictory with some results seen in literature, more pronounced inequalities in income in urban areas make the decision to commit an offence more profitable than in a rural setting. The potential gains of crime are higher in an urban area than in a rural one.
Moreover, despite the stronger institutional network and the resulting improvement in policing in the urban setting, arrests probably tend to be more challenging as a result of density. However, crime was less prevalent in Bamako over the 2014–2019 period than in the region of Kayes. This situation reversed in 2020, with crime in the capital becoming higher than in the latter region. It was also higher in the region of Koulikoro than in Kayes. Another remarkable development was that while offences were down in two of the regions most exposed to violence due to the armed conflicts over the 2014–2019 period, namely Mopti and Tombouctou, the populations in these regions (and the region of Gao) were more exposed to crime in 2020. In the region of Mopti, this was the case for both offences against property and physical aggression although the size of the effect was far greater in the case of offences of the latter type. In the region of Gao (from the 2014–2019 period) and the region of Tombouctou, the higher probability of being a victim of crime, all types included, was the result solely of the significantly higher likelihood of being a victim of physical aggression in these two regions compared to the region of Kayes. On the contrary, the residents of these two regions had a lower probability of being victims of offences against property. In other regions, the probability of being a victim of material or physical aggression was lower than for the residents of the region of Kayes. This may be explained by the perceived increase in crime in the uncontrolled artisanal gold mining areas, which is more widespread in the region of Kayes and fuels trafficking and local conflicts. Indeed, according to a study conducted recently by the Institut d’études de sécurité (Institute for Security Studies) (Koné and Adam, 2021), a certain number of vulnerabilities associated with the gold economy may favour the creation of violent extremist groups.
The level of education of individuals is a major factor in exposure to crime. Individuals with a primary school-level of education or higher are more exposed to crime than those with no education. This result is relatively strong regardless of the type of offence reported or the period in question. However, the probability of being the victim of crime does not seem to increase with the level of education completed. Indeed, in relation to uneducated individuals, those with a primary or middle school level of education or higher are very similar in their risk of becoming victims of crime. This result may be explained by the different routine activities of educated and uneducated individuals, but it should be explained mainly by the fact that they are likely to be perceived as having more valuable resources than those who did not attend school, and therefore the gains to the offenders would be more profitable. This interpretation is confirmed by the fact that individuals from poorer households were less exposed to crime than those in non-poor households, over the 2014–2019 period. In 2020, the results were relatively less clear-cut, but poorer households still remained significantly less exposed to offences against property. Their exposure to physical aggression, however, remained similar. However, this reinforces the idea that offences against property are more prevalent among individuals with more significant financial assets.
This result is confirmed by the fact that the economically inactive are less exposed to violence than those working in the public sector over the period 2014–2019. At only 10%, this result is significant. However, there is no significant, strong difference in the risk of being a victim of at least one form of crime according to institutional sector of activity. Indeed, those actively employed are not significantly more likely to be victims of crime depending on whether they work in the public sector, the formal private sector or on a casual basis. This does not apply to those employed by non-governmental organisations. This finding should, however, be interpreted with precaution due to the low numbers of workers in this institutional sector.
Only another series of estimations limited to the sub-sample of actively employed adults could provide a more in-depth look into the results observed for the Malian population as a whole. These results are shown in Table 4.
The overall results are very strong for this alternative specification. The main difference between these new estimates is the inclusion of the type of location where actively employed individuals carry out their occupation. Over the 2014–2019 period, workers without a fixed workplace, who are itinerant, are more likely to be victims of physical assault than other workers. This is partially confirmed in 2020, where itinerant workers are significantly more exposed to violence than those with a fixed position on the street, the differences being insignificant for the other types of workplaces. The routine of itinerant workers thus seems to expose them more to physical violence than those working in a fixed location. Adults working from home, meanwhile, had a higher probability of being victims of theft particularly in the home or vandalism. To the extent that their capital is mainly found in their home, the potential gains resulting from offences against property make them particularly vulnerable. On the contrary, individuals working in a professional setting seem to be less exposed to crime on the whole.
5.Conclusion
The results of the estimations of the probability of being a victim of crime are subject to certain biases that do not allow for a causal interpretation of the results. These include the usual estimation biases of reverse causality and omitted variables. This is especially the case for questions relating to employment status: some workers may have become itinerant after having been victims of crime. Similarly, unobserved characteristics may affect both the probability of being a crime victim and the individual characteristics observed, underestimating or overestimating the calculated effect. The estimations also do not take into account potential selection biases such as selection in migration. In order to avoid being victims of crime, some adults may have migrated to another region or even abroad. Depending on the characteristics of these emigrants, the results may again be underestimated or overestimated. More in-depth investigations could allow for these biases to be taken into account in future studies.
While the results of the estimations should be interpreted with caution, the data collected in Mali through the Governance, Peace and Security survey modules in Mali provide a very accurate analysis of the level and dynamic of crime in Mali and explain the low levels of reporting to the public authorities between 2014 and 2020. Following an ongoing decline in victimisation rates up until 2019, a sharp rise in thefts outside and inside the home was observed in 2020. At the same time, despite possession of weapons remaining relatively low over the years, their perceived ownership at the local level doubled between 2018 and 2020. This reflects a shared level of confidence in the government to ensure the safety of citizens.
The data can also be used to map out certain features of the profile of victims of offences against property and people over the same period. Women, people with no formal education and members of poorer households in particular were thus generally less likely to be victims of offences. The residents of the regions of Mopti, Tombouctou and Gao, meanwhile, were more exposed to the violence analysed in this article.
The trend observed up until 2018 came to a halt as a result of certain aspects in 2020, setting off potential alarm bells regarding crime. It is therefore vital to maintain a high level of vigilance with the results from future survey waves to ensure Malian citizens are targeted and protected as effectively as possible. Crime is a barrier to the economic development of households and local communities. It is therefore necessary to extend the study of both perceived and experienced crime and the profile of victims beyond 2020 in order to determine whether all the results presented in this article can be confirmed or not.
Notes
1 Through SIDA and SCB, Sweden funded the first year of implementation in 2011/2012, while the second edition in 2013/2014 was entirely funded by the national budget. Since the third edition, funding has been jointly provided by Mali and Sweden.
2 In 2021, the EMOP began in January and ended in December.
3 See Razafindrakoto and Roubaud (2015), Cling et al. (2016) and Calvo et al. (2019) who have demonstrated the reliability of GPS-SHaSA data.
4 See reports on the data collected published in 2015, 2016 and 2019.
5 The GPS-SHaSA modules do not allow for the collection of data on psychological violence (which requires highly specific survey mechanisms that are difficult to implement on a large scale). We also stress that the survey does not provide data on deaths resulting in particular from homicides and conflicts. However, the new questionnaire proposed in the revised version of the GPS-SHaSA module provides for the collection of data on deaths in the households surveyed (Razafindrakoto and Roubaud, 2018).
6 The low numbers of Malian crime victims call for careful interpretation of the variations between each survey wave.
7 This increase is not explained by the inclusion of the Kidal region in collection of data in 2019/2020.
References
[1] | ONUDC. Criminalité et developpement en Afrique. Vienne: Organisation des Nations unies contre la drogue et le crime. (2005) . |
[2] | Calvo T, Lavallée E, Razafindrakoto M, Roubaud F. Fear not for man? Armed conflict and social capital in Mali. J Comp Econ. (2020) ; 48: : 251-76. |
[3] | Benjaminsen TA, Ba B. Fulani-dogon killings in mali: Farmer-herder conflicts as insurgency and counterinsurgency. Afr Secur. (2021) ; 14: : 4-26. |
[4] | Pérouse de Montclos M-A. De la mesure de la violence dans les pays en crise: un enjeu politique pour le développement, la paix et la sécurité. Statéco. (2022) ; 116: : 43-52. |
[5] | Rockmore M. The cost of fear: the welfare effect of the risk of violence in northern Uganda. World Bank Econ Rev. (2017) ; 31: : 650-69. |
[6] | Tapsoba A. The cost of fear: Impact of violence risk on child health during conflict. J Dev Econ. (2023) ; 160: : 102975. |
[7] | Cissé S, Coulibaly A, Diabaté I, Ag Hamahady E, Koné A, Haïdara S, et al. Dynamiques des Violences, de la Paix et la Sécurité au Mali entre 2014 et 2018. INSTAT Mali DIAL-IRD. (2019) ; 29-46. |
[8] | Durkheim É. De la division du travail social. Paris: Presses Universitaires de France; (1960) . |
[9] | Becker GS. Crime and punishment: An economic approach. Econ Dimens Crime. Springer; (1968) . pp. 13-68. |
[10] | Sharkey P, Besbris M, Friedson M. Poverty and Crime. In: Burton L, Brady D, editors. Oxf Handb Poverty Soc. New York: Oxford University Press; (2017) . |
[11] | Meier RF, Miethe TD. Understanding theories of criminal victimization. Crime Justice. (1993) ; 17: : 459-99. |
[12] | Fajnzylber P, Lederman D, Loayza N, Reuter P, Roman J, Gaviria A. Crime and victimization: An economic perspective [with comments]. Economia. (2000) ; 1: : 219-302. |
[13] | Soares RR. Development, crime and punishment: accounting for the international differences in crime rates. J Dev Econ. (2004) ; 73: : 155-84. |
[14] | Delbecq B, Guillain R, Legros D. L’Analyse de la criminalité à Chicago: de nouvelles perspectives offertes par l’économétrie spatiale à une question ancienne. Rev d’Economie Reg Urbaine. (2015) ; 251-72. |
[15] | Sampson RJ, Laub JH. 2. Théorie du parcours de vie et étude à long terme des parcours délinquants. Sorties Délinquance, Paris: La Découverte; (2012) . pp. 20-43. doi: 10.3917/dec.moham.2012.01.0020. |
[16] | Deming DJ. Better schools, less crime? Q J Econ. (2011) ; 126: : 2063-115. |
[17] | Cohen LE. Modeling crime trends: A criminal opportunity perspective. J Res Crime Delinquency. (1981) ; 18: : 138-64. |
[18] | Bourguignon F, Nuñez J, Sanchez F. A structural model of crime and inequality in Colombia. J Eur Econ Assoc. (2003) ; 1: : 440-9. |
[19] | Demombynes G, Özler B. Crime and local inequality in South Africa. J Dev Econ. (2005) ; 76: : 265-92. |
[20] | Barslund M, Rand J, Tarp F, Chiconela J. Understanding Victimization: The Case of Mozambique. World Dev. (2007) ; 35: : 1237-58. doi: 10.1016/j.worlddev.2006.09.018. |


