The highways and side roads of statistical capacity building
Abstract
This paper proposes an approach to guide statistical capacity building in developing countries using an analysis based on components of the World Bank’s Statistical Performance Indicator on a sample of 215 countries. The approach demonstrates the importance of expanding traditional capacity-building activities to include programs to strengthen and better monitor the ability of National Statistical Systems (NSS) to respond to user data needs. Based on this analysis, the paper recommends a two-step strategy for building and enhancing the statistical capacity of national statistical systems in developing countries. The strategy creates a sustainable trajectory for developing NSSs that meets the growing demands of local and global data users. The paper emphasizes the importance of donor coordination and South-South learning initiatives for international capacity-building efforts.
1.Introduction
The national statistical system (NSS) is the ensemble of statistical organizations and units in a country that jointly collect, process, and disseminate official statistics on behalf of the government [1]. It plays a vital role in modern economies, providing a range of stakeholders with statistical information on the country’s socioeconomic evolution at the national and sub-national levels.
NSS performance is constrained by its statistical capacity, defined as “the ability of a country’s national statistical system, its organizations, and individuals, to collect, produce, analyze, and disseminate high quality and reliable statistics and data to meet users’ needs” [2]. Weak statistical capacity restricts development. Planning and monitoring progress are hampered when statistics are inaccurate, irrelevant, slow to be disseminated, or missing entirely [3]. Lack of data limits stakeholders’ ability to hold governments accountable for their actions and prevents civil society from drawing attention to gaps in government services.
Weak statistical capacity restricts innovation. Some high-capacity NSSs have developed new methods, tapped new data sources, and quickly formed strategic partnerships to produce the information necessary to understand how best to respond to the COVID-19 crisis [4]. But many others have struggled to adapt their data-collection processes in the face of quarantines and other social distancing measures [5].
Statistical systems in many developing countries rely on international support to build capacity. These efforts focus on improving the supply of data, often neglecting strengthening data demands by the country’s state and nonstate actors. State demand for data reflects the technical capacity of the bureaucracy to use data to develop programs and policies and deliver public services. This technical capacity is higher in countries where the bureaucracy can work without political interference [6] and with autonomy from pressures that might jeopardize objective policy implementation [7]. Nonstate actors – think tanks, academia, civil society, private sector actors, and the public – use data to hold governments accountable, advocate for policy priorities, make business decisions, and track socioeconomic conditions.
The share of official development assistance for data and statistics has stagnated over the last decade while data demands soared [2]. In this environment, better-targeted, smarter interventions that address both the supply of and the demand for data are needed to fully capture the potential of the data revolution to create a world of greater prosperity and sustainable development [8]. Therefore, it is critical for development institutions to allocate resources to countries that would benefit from such interventions the most.
The prioritization of interventions requires a transparent and objective metric to compare countries’ statistical capacity. The Statistical Performance Indicator (SPI), originally developed by [9], facilitates such comparisons over time and across countries.
This paper discusses the use of the SPI to guide development policies to improve and sustain statistical capacity in developing countries. With greater international attention on emphasizing the user responsiveness of national statistical systems, there is pressure to align statistical products and services to the needs of each country. The SPI can be used to evaluate the capacity of statistical systems to supply official statistics and assess how well this supply aligns with local and international demands for data and services.
Analysis of the distribution of the SPI and its components over a sample of 215 countries reveals two distinct clusters of NSSs – low and high performing – separated by a relatively wide gap in SPI scores. Furthermore, poorly performing NSSs also have high variance across SPI components. Such variance hampers the ability of poorly performing NSSs to deliver their services.
Our benchmarking regression analysis identifies three types of NSSs: a group of NSSs that under-supply the official statistics to their users; a group that seems to be producing too much data, given the country’s characteristics; and a group that appears to be at the equilibrium point in terms of demand for and supply of official statistics. These three groups motivate our proposed two-step strategy for building and enhancing sustainable statistical capacity in developing countries.
Our main proposal is to align the NSS’s capacity-building activities with the data priorities expressed by local actors and their capability to act on these data. Only when the supply of official statistics corresponds to their demand can NSSs be sustainable in the long term. Our findings emphasize the importance of coordination within the donor community and South-South learning and experience exchange initiatives. Such coordination could be especially important in helping countries that have reached middle-capacity status but are challenged to graduate to the pool of top NSSs.
One of the challenges of donor-led statistical capacity building is to develop statistical systems that can function independently. External international aid should not lead to perpetual dependency. The strategy proposed in this paper creates a sustainable trajectory for developing NSSs that meet the growing demands of local and global data users.
The paper is organized as follows. Section 2 discusses the evolution of approaches to statistical capacity building and reviews measures of statistical capacity. Section 3 discusses the main properties of the SPI and provides some descriptive results. Section 4 presents the methodology for assessing demand for and supply of data. Section 5 discusses the policy implications of our analysis. Section 6 summarizes the paper’s main conclusions.
2.Evolution and measurement of statistical capacity
Over the past 20 years, new data sources and increasing user demands have redefined what is meant by a capable NSS. As a result, assessment and measurement tools have also evolved.
2.1Evolution of statistical capacity
The Millennium Summit in 2000 triggered a new conceptual framework for improving official statistics in developing countries. Before the summit, key statistics produced by many developing countries were of inferior quality or nonexistent. Domestic resources allocated for statistics were inadequate, limiting the production of censuses and surveys. Technical and financial aid for statistics was almost exclusively bilateral and uncoordinated, often to support specific areas reflecting the priorities of donors, not countries.
The Millennium Declaration called for a new approach to statistical capacity in developing countries to improve development outcomes and track performance. The approach emphasized country-led statistical development plans, monitorable results, and coordinated donor support to address shortcomings in domestic resources for both the supply of and demand for statistics. New global institutions, such as the Partnership in Statistics for Development in the 21st Century (PARIS21) and the UN body to coordinate statistical activities, were established to promote cooperation between the international donor community and statistical producers in developing countries and advocate for improved statistics in key international forums.
The Sustainable Development Goals (SDGs), adopted in 2015, introduced a set of indicators to be produced by NSSs. Global leaders encouraged official statisticians to tap into the exponential increase in the volume and types of data available to inform their development plans, track performance, and improve government accountability to the public. New global entities, such as the Global Partnership for Sustainable Development Data and the SDSN Thematic Research Network on Data and Statistics, fostered collaborations between official and nongovernmental data producers. The expectations for official statisticians to abide by open data policies also increased.
As a result of these initiatives, measures of statistical capacity, openness, and funding modestly increased.22 The growing requirements on NSSs to tap new data sources, find ways to make data more accessible, and expand their measures of development outpaced capacity improvements, reinforcing the need for NSSs to continually engage with users – particularly state actors – to ensure that capacity improvements are made in the areas vital to fostering better development outcomes.
The UN High-Level Group for the Modernization of Official Statistics identifies trends, threats, and opportunities to modernize NSSs. For more than a decade, it has overseen the development of standards and models for describing statistical production processes, organizational structures, and metadata [10]. The group guided communication and relationship management with users, integrating data from varied sources, big data, and managing partnerships and human resources. Operations in many high-performing NSSs now conform to its standards and guidelines and develop a culture of experimentation and innovation.
2.2Measures of statistical capacity
Statistical capacity is difficult to measure because it is only partially revealed by achievements or other observable characteristics of the NSS. A system may have the capacity to produce good-quality data but not have yet done so, or it may no longer have the capacity to produce good data despite having done so in the past.
Several indicators have been developed to measure statistical capacity [13]. Most of these measures are based on data collected directly from the staff of national statistical offices (NSOs) or local experts. Although this procedure may provide more in-depth analysis and uncover finer details about the organization of an NSS, it is more expensive and far more time-consuming than measures that are publicly available and easy to access.33 In addition, these labor-intensive assessments are conducted at the request of the NSS. As such, they are infrequent and cannot be used to track country-specific or global trends in statistical capacity.
To overcome these deficiencies, the World Bank launched the Statistical Capacity Building Indicator (SCBI) in 2004. The SCBI was based on objective indicators that can be updated annually for all emerging markets and developing countries (but not for developed countries). International and national agencies have adopted it to measure progress in statistical capacity building and related investments [11].
Since the launch of the SCBI, its methodology and coverage have remained unchanged despite the marked changes in the data landscape. Open data agendas have propagated; both high- and low-capacity NSSs are modernizing. The SCBI does not capture these advances, and its lack of coverage of high-capacity NSSs means that it is impossible to track advances across the full spectrum of countries.
This paper uses the World Bank’s Statistical Performance Index (SPI), designed to assess a country’s statistical capacity, identify areas for improvement in NSSs, and monitor the progress of reforms in statistical capacity building. This index was developed to address the limitations in the SCBI and facilitate intertemporal and intercountry comparisons.44
The SPI uses publicly available data on a set of readily observable and verifiable indicators. It provides internationally comparable, objective, country-level assessments across the globe. It views statistical capacity as the range of products and processes an NSS uses to produce and disseminate data.
The index measures five dimensions:
1. Data Use pillar assesses a range of services that connect data users and producers and facilitates dialogue between them.
2. Data Services pillar provides an indicator of the quality of data releases, the richness and openness of online access, the effectiveness of advisory and analytical services related to statistics, and the availability and use of data access services such as secure microdata access.
3. Data Products pillar assesses how well the NSS covers the social, economic, environmental, and institutional domains of the Sustainable Development Goals.
4. Data Source pillar reflects the availability and frequency of major censuses and surveys mandated by national statistical acts as well as sources of data that are produced outside the NSS, such as administrative data, geospatial data, private sector data, and citizen-generated data.
5. Data Infrastructure pillar represents the institutional framework for the statistical system and includes legislation, governance, standards and methods, skills within the statistical system and among the users, and partnerships.
The SPI is constructed as an equally weighted sum of these five components. Each component consists of a set of categorical variables that ensure that the SPI is additively decomposable by subsets of variables and by subsets of countries (or regions). The total SPI score and the scores of each of the four components range from 0 to 1.
The SPI has four main advantages over the SCBI:
• It includes richer and more comprehensive dimensions, covering data generation, curation, dissemination, and data analysis.
• It has 51 indicators versus 25 in the SCBIs.
• It covers more than 200 countries. The SBCI covers fewer than 150 countries and includes no high-income countries.
• The SPI is built on a conceptual and theoretical framework. The theoretical principles of the SCI are not clearly formulated.
Because this paper focuses on the demand side issues, we assess a broad array of variables that influence the demands for national statistics. We have dropped the SPI’s first pillar – Data Use, from our analysis, given that filling data gaps in the Data Use pillar underlying the SPI remains a work in progress.55 For the remainder of the paper, we use this modified SPI comprised of the four remaining pillars that represent the supply-side activities related to NSS performance.
3.What the SPI reveals
One key improvement of the SPI over the SCBI is its ability to measure statistical capacity through a robust, internally consistent index score for any country in the world. For the first time, we can compare the strengths of well-regarded NSSs with the less-developed institutions in lower- and middle-income countries and measure the difference between low- and high-income countries in terms of their capability to produce and disseminate statistical products and services.
Figure 1 shows the histogram and nonparametric estimation of the four-pillar SPI’s density function for the sample of 215 countries. The distribution appears to be bimodal, with a group of high-capacity countries with SPIs falling in the range from 0.8 to 0.9. The remaining countries center on an SPI of 0.5. Few countries score between 0.62 and 0.75, suggesting that a discrete step may be necessary to reach the group of high-performing countries.
Figure 1.
Histogram and nonparametric density function of the Statistical Performance Indicator (SPI).
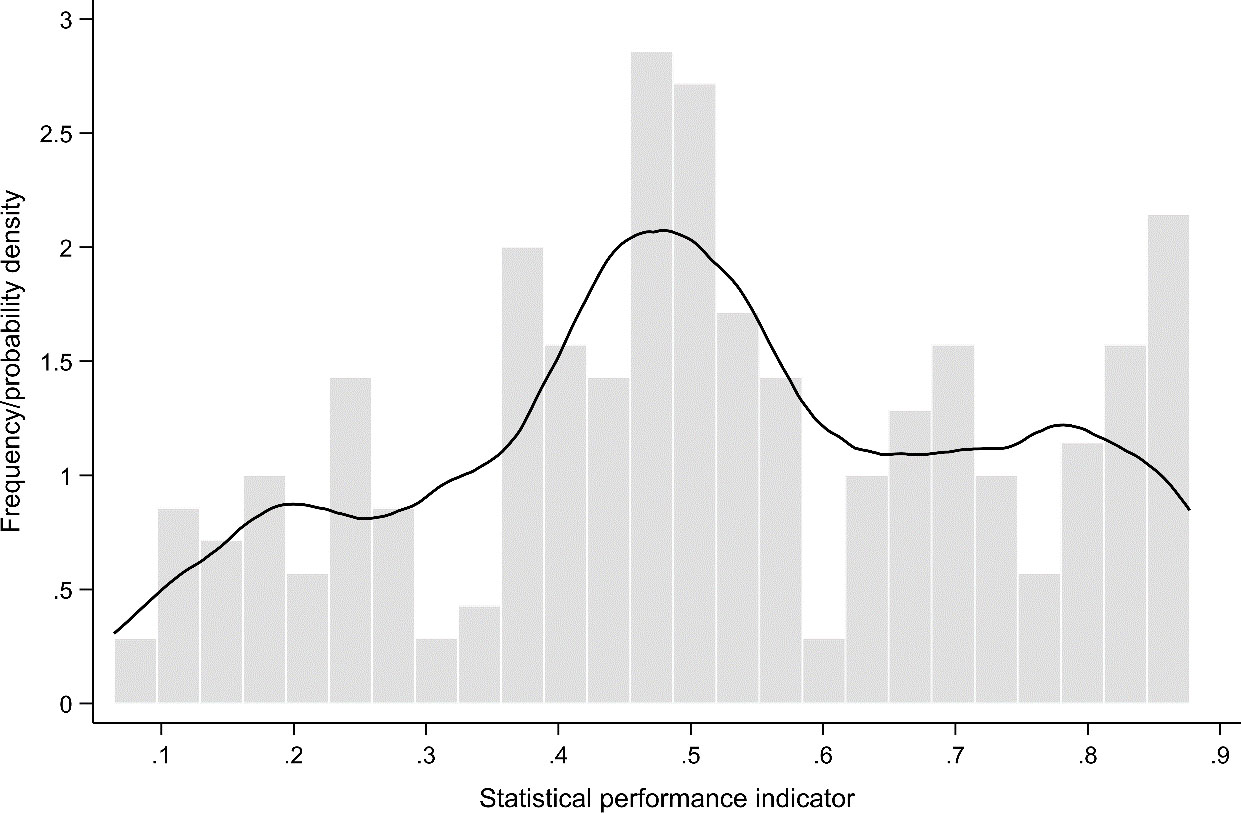
A cluster analysis of the four-pillar SPI scores indicates the presence of a stable cluster of 26 high-capacity counties with a mean SPI of 0.84 and another stable cluster of 30 low-performing counties with a mean SPI of 0.14. No clusters are identified in the region of 0.64–0.79, even when the number of clusters reaches 15.66 This “statistical performance gap” is analogous to the concept of the middle-income trap in the development economics literature [16].77 A similar gap between the top-performing NSSs and the rest of the world is evident in the Open Data Inventory (ODIN) index, which assesses the coverage and openness of the systems of official statistics in 187 countries [12].
Heterogeneity in the distribution of the four-pillar SPI used here confirms the findings and recommendations of the report on national accounts conducted by the World Bank [19]. That study concluded that “the range of developing countries is extensive, some close to economic sophistication and statistical resources to OECD countries. At the other end of the range, however, are countries with relatively small populations, economies that are concentrated in a few areas with a limited number of skilled professionals.” The guide recognized that some recommendations of the report have little effect on countries that lack other features, such as sophisticated financial markets.
The International Monetary Fund (IMF) uses different standards for the collection and provision of macro-statistics for countries that “play the leading role in international capital markets” and the rest of the world [20]. [21] emphasize that data demands in fragile states differ greatly from demands in countries where granular statistics on income, for example, are essential for maintaining an array of social and employment programs.
Figure 2 plots the coefficient of variation (CV) in the SPI components against the SPI for each country in the sample.88 The CV shows the degree of dispersion of the SPI components in a country. The maximum CV is reached when only one of the four SPI components is different from zero; the minimum CV corresponds to cases when all four components are equal.
Figure 2.
Coefficient of variation of the SPI components versus the SPI. Note: Country ISO3 abbreviations: MDG
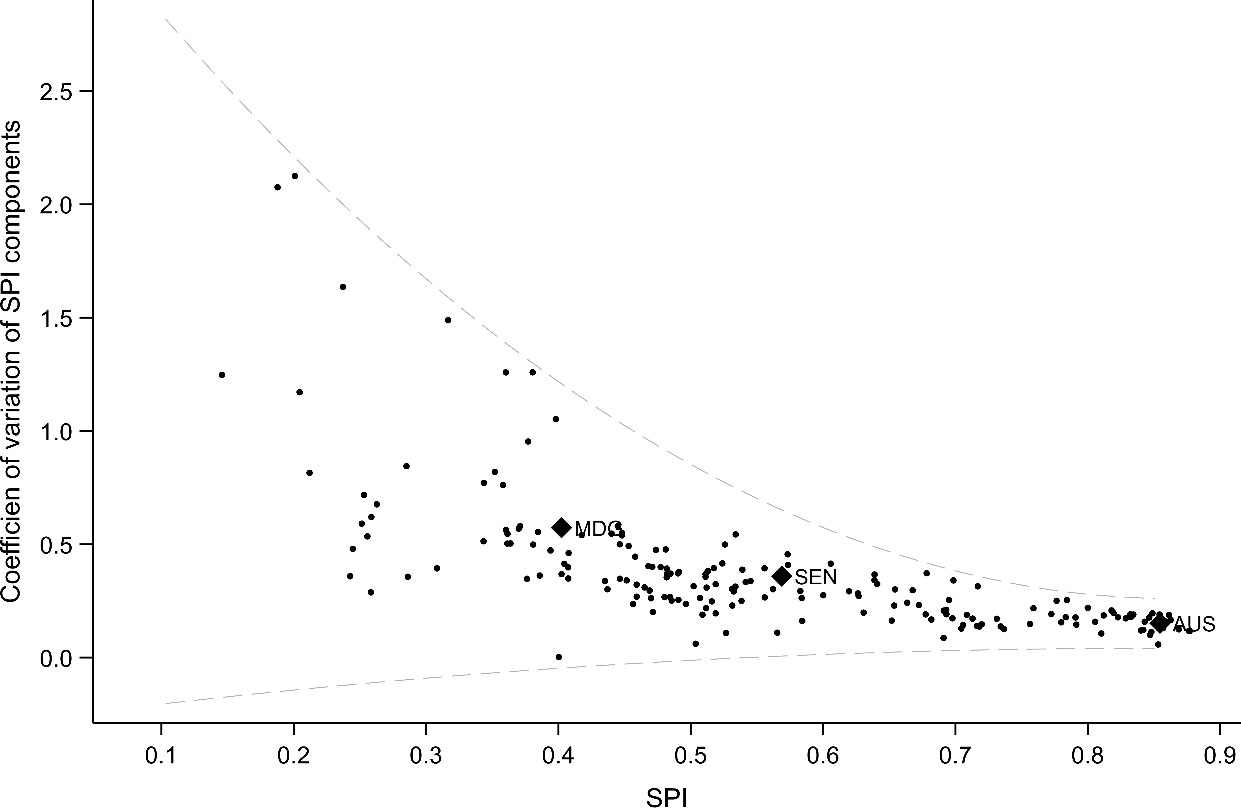
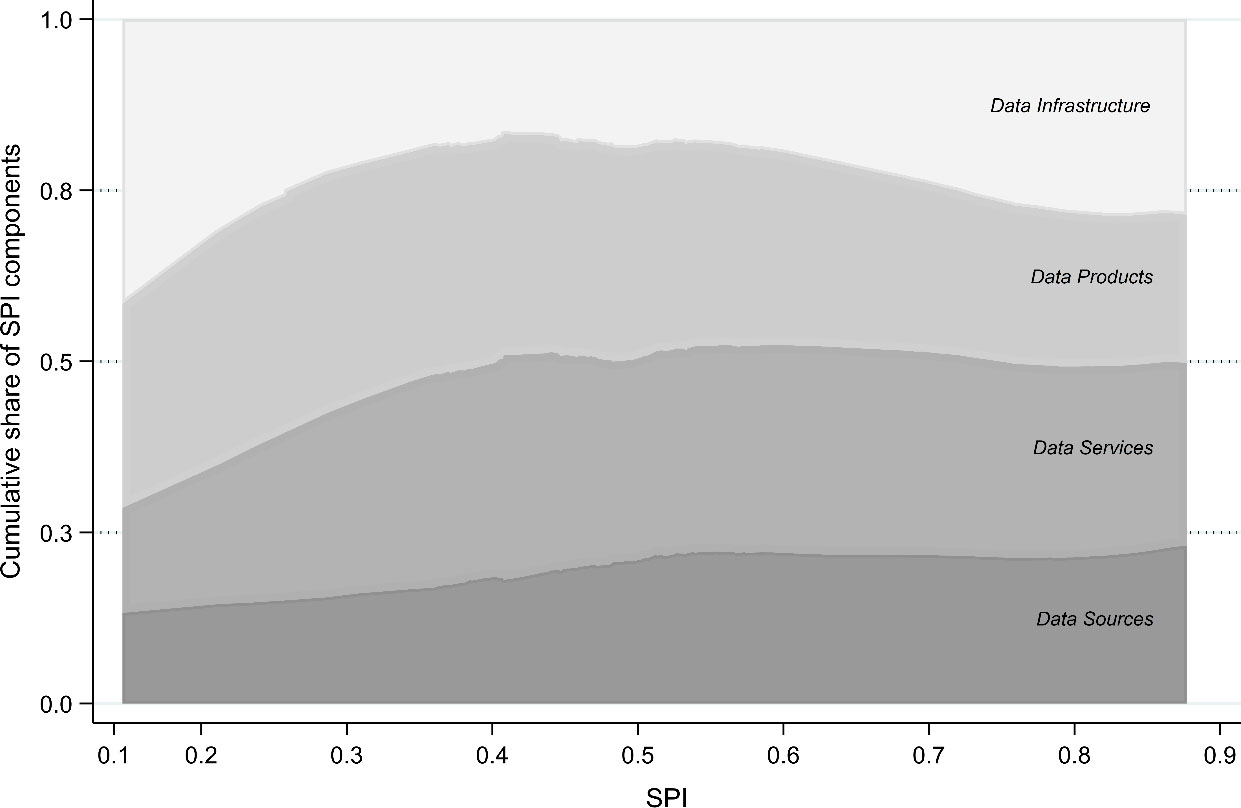
Figure 3.
Shares of SPI components by SPI.
For our sample, the CV of the SPI components decreases with the aggregate SPI. Countries with the highest SPI have the smallest CV of their SPI components (in other words, top performers are good at every dimension of the SPI). Australia, for example, has an aggregate SPI of 0.85. The Data Services pillar is 0.92, the Data Product and the Data Source components are both 0.74, and Data Infrastructure pillar is 1.0 (the highest possible value).
At the other end of the CV spectrum are countries with low SPIs. These countries have very different scores on their SPI components and, thus, high CVs. Madagascar, for example, has a low Data Source (0.12), Data Infrastructure (0.3), and a relatively high Data Services (0.56) and Data Products (0.61) components. Senegal is in the middle range in terms of the SPI distribution and CV spectrum (SPI
That pattern of variance of four SPI components, or pillars, may be explained by weak donor coordination in statistical capacity building and donors’ preferences for certain areas of the NSS. It is also likely that resource-constrained countries cannot effectively allocate resources to cover all dimensions of the SPI. The high variance in SPI components among low-capacity countries hinders their progress because components of SPI complement one another in the production and dissemination of statistical information. For example, a weak capacity to collect survey and census data adversely affects the presence of key indicators in international databases.
Figure 3 reinforces the argument that donor preferences could be driving capacity improvements in low-performing countries. Data Infrastructure and Data Products are the most significant contributors to the overall SPI scores for this group; until recently, they were donors’ preferred statistical tools, as they contribute to understanding social rather than economic performance. Low scores on Data Services and Data Sources, which are more developed for economic than social statistics, reinforce this hypothesis.
4.Assessing the demand for official statistics
We assume that in the long run, a country’s statistical capacity is determined by the interaction between the supply of and demand for data. If the demand for official statistics exceeds the supply, data users will pressure the government to increase investment in the NSS. If the NSS supplies more data than are consumed, the government will eventually reallocate resources to more urgent priorities. The steady-state equilibrium of the statical capacity is reached when the demand for data corresponds to its supply.
The government’s funding preferences for NSSs are formulated based primarily on whether the NSS mobilizes the power of data to help these actors make better decisions. However, by disseminating high-quality products, the NSS has the potential to reshape state capacity [22]. Better data from the NSS lead to improved state services. This virtuous cycle is likely left out of government funding allocations. Although the supply of and demand for data may fluctuate in the short run, gaps between demand and supply erode the long-run sustainability of an NSS.
Canada’s chief statistician, Ivan Fellegi, argues that “the greater the authority of the chief statistician, the more important it is to have a variety of mechanisms through which the different needs of different client groups can be determined” [23]. Assessments of NSSs in the Organization for Economic Co-operation and Development (OECD) identify deficiencies in understanding evolving user needs [24, 25]. Similar deficiencies are found in low- and middle-income NSSs. The AIDDATA survey of policymakers, government technocrats, and NSS staff found that the most important and frequent users of statistics were international organizations and development partners, not domestic users [26].
The four supply-side pillars of the SPI are a good proxy for the NSS’s capacity to produce and disseminate a range of data products. The empirical model presented here aims to proxy the demand for official statistics. It draws on the same criteria underlying the SPI.99 Our empirical approach is derived from the literature on inferring the “social efficiency” of economic indicators by the measured deviation of these indicators from the efficiency frontier (e.g., [27, 28, 29]). The efficiency frontier is identified from the residual of a regression of an indicator of interest (in our case, the SPI) on a set of control variables, a methodology sometimes referred to as benchmarking [30].
Table 1
Descriptive statistics for dependent and main independent variables
| Variable | Mean | Standard deviation | Minimum | Maximum | Data source |
|---|---|---|---|---|---|
| Dependent variables | |||||
| Statistical performance indicator (SPI) | 0.630 | 0.163 | 0.146 | 0.877 | 0.630 |
| Pillars of SPI | |||||
| Data services | 0.729 | 0.191 | 0.006 | 1.000 | 0.729 |
| Data products | 0.666 | 0.110 | 0.408 | 0.906 | 0.666 |
| Data sources | 0.543 | 0.179 | 0.117 | 0.875 | 0.543 |
| Data Infrastructure | 0.582 | 0.294 | 0.050 | 1.000 | 0.582 |
| Controls | |||||
| Log GDP per capita | 9.479 | 1.072 | 7.051 | 11.637 | WDI |
| Economic complexity index | 0.054 | 0.978 | 2.427 | MIT | |
| Population (millions) | 0.561 | 1.770 | 0.012 | 13.864 | WDI |
| Share of urban population | 62.760 | 21.044 | 13.102 | 100.000 | WDI |
| Secondary school enrollment (gross) | 88.823 | 28.897 | 19.930 | 158.542 | WDI |
| Voice and accountability | 0.967 | 1.692 | WGI | ||
| Fragility index | 6.602 | 5.255 | 0.000 | 21.000 | SFIM |
| Regional dummies | |||||
| Europe and Central Asia | 0.350 | 0.479 | 0 | 1 | WB |
| East Asia | 0.122 | 0.329 | 0 | 1 | WB |
| Latin America | 0.163 | 0.371 | 0 | 1 | WB |
| Middle East and North Africa | 0.122 | 0.329 | 0 | 1 | WB |
| United States and Canada | 0.016 | 0.127 | 0 | 1 | WB |
| South Asia | 0.033 | 0.178 | 0 | 1 | WB |
| Sub-Saharan Africa | 0.195 | 0.398 | 0 | 1 | WB |
Source: Authors’ calculations. Note: WB
4.1Empirical model
Our empirical model relates the values of the SPI index and its pillars with the variables that may determine a country’s demand for and supply of statistical data. This reduced-form model is represented in the following form:
(1)
where SPI
The demand for statistical information is linked to the level of education in the country (EDU
4.2Data
We use several sources of data. The first is the SPI and its component. In our sample, it ranges from 0.21 (Papua New Guinea) to 0.96 for (Australia).
An indicator of voice and accountability comes from the World Governance Indicators (WGI) database, produced by the World Bank annually since 1996 for over 200 countries [34]. This indicator ranges from
We control for a country’s secondary enrollment rates and GDP per capita (in constant 2011 purchasing power parity dollars) using data from the World Development Indicators database [35] and information from other sources. We use the economic complexity index at the MIT Lab and Harvard University [36]. We include the country fragility index produced by the Center for Systemic Peace in the State Fragility Index and Matrix (2018) dataset [37]. It ranges from 0 to 24, with higher values indicating greater state fragility. Table 1 displays the descriptive statistics for our main variables.
Table 2
Ordinary least squares estimation of the Statistical Performance Indicator (SPI)
| (1) | (2) | |||
| Item | Coefficient | Standard error | Coefficient | Standard error |
| Controls | ||||
| Log GDP per capita | 0.006 | 0.017 | 0.005 | 0.018 |
| Economic Complexity Index | 0.054 | 0.012 | 0.038 | 0.014 |
| Log population | 0.015 | 0.006 | 0.019 | 0.006 |
| Share of urban population | 0.001 | 0.001 | ||
| Secondary school enrollment (gross) | 0.002 | 0.000 | 0.001 | 0.000 |
| Voice and accountability | 0.076 | 0.014 | 0.076 | 0.019 |
| Fragility Index | 0.001 | 0.003 | 0.002 | 0.003 |
| Regional dummies | ||||
| Europe and Central Asia | Reference category | |||
| East Asia | 0.028 | |||
| Latin America | 0.032 | |||
| Middle East and North Africa | 0.039 | |||
| United States and Canada | 0.018 | |||
| South Asia | | 0.035 | ||
| Sub-Saharan Africa | 0.038 | |||
| Constant | 0.196 | 0.159 | 0.184 | 0.173 |
|
| 0.748 | 0.770 | ||
| Number of observations | 123 | 123 | ||
Note: Robust standard errors are used. The reference category for the regional dummies is Europe and Central Asia. Significance level:
Table 3
Ordinary least squares regression estimations of the components of the Statistical Performance Indicator (SPI)
| Data services | Data products | Data sources | Data infrastructure | |||||
|---|---|---|---|---|---|---|---|---|
| Item | Coefficient | Standard error | Coefficient | Standard error | Coefficient | Standard error | Coefficient | Standard error |
| Controls | ||||||||
| Log GDP per capita | 0.034 | 0.021 | 0.044 | 0.022 | 0.030 | 0.028 | ||
| Economic Complexity index | 0.052 | 0.020 | 0.016 | 0.015 | 0.033 | 0.021 | 0.051 | 0.026 |
| Population (millions) | 0.014 | 0.011 | 0.024 | 0.008 | 0.014 | 0.010 | 0.025 | 0.009 |
| Share of urban population | 0.000 | 0.001 | 0.000 | 0.001 | 0.001 | 0.000 | 0.001 | |
| Secondary school enrollment (gross) | 0.001 | 0.001 | 0.001 | 0.001 | 0.002 | 0.001 | 0.002 | 0.001 |
| Voice and accountability | 0.122 | 0.027 | 0.048 | 0.016 | 0.045 | 0.025 | 0.091 | 0.028 |
| Fragility index | 0.006 | 0.006 | 0.001 | 0.004 | 0.005 | 0.004 | 0.006 | |
| Regional dummies | ||||||||
| East Asia | 0.018 | 0.043 | 0.033 | 0.041 | 0.047 | |||
| Latin America | 0.007 | 0.044 | 0.018 | 0.036 | 0.039 | 0.049 | ||
| Middle East and North Africa | 0.001 | 0.065 | 0.039 | 0.012 | 0.047 | 0.068 | ||
| United States and Canada | 0.030 | | 0.024 | 0.120 | 0.027 | 0.030 | ||
| South Asia | 0.001 | 0.057 | 0.063 | 0.022 | 0.046 | 0.052 | ||
| Sub-Saharan Africa | 0.018 | 0.043 | 0.033 | 0.041 | 0.047 | |||
| Constant | 0.427 | 0.336 | 0.593 | 0.225 | 0.197 | 0.283 | ||
|
| 0.580 | 0.375 | 0.661 | 0.787 | ||||
| Number of observations/countries | 123 | 123 | 123 | 123 | ||||
Note: Robust standard errors are used. For comparison with SPI regression, values of the SPI components were normalized to 0–1. The reference category for the regional dummies is Europe and Central Asia. Significance level:
4.3Results
Table 2 shows the results of the OLS regression of model (1) for the aggregate SPI.1010 The estimation based on specification (1) reveals that the SPI is positively and significantly correlated with the economic complexity index. More economically complex countries have better-performing NSSs. Countries with more educated populations and countries with more developed civil society (as measured by the voice and accountability index) also tend to have higher SPIs. Overall, the regression in specification (1) demonstrates the high explanatory power of our model, which explains more than 70 percent of cross-country variation in the SPI (adjusted
Specification (2) expands the set of explanatory variables by adding a set of regional dummies. These dummies account for potential cooperation and knowledge transfer among countries in some regions. The coefficients on the regional dummies demonstrate that NSOs in the Middle East and North Africa, South Asia, and Sub-Saharan Africa do not perform as well as NSOs in Europe and Central Asia. NSOs in the United States and Canada, and East Asia have SPIs close to those in Europe. The other variables in the model have effects similar to those in specification (1). Coefficients on the economic complexity index, education, and voice and accountability are positive and significant.
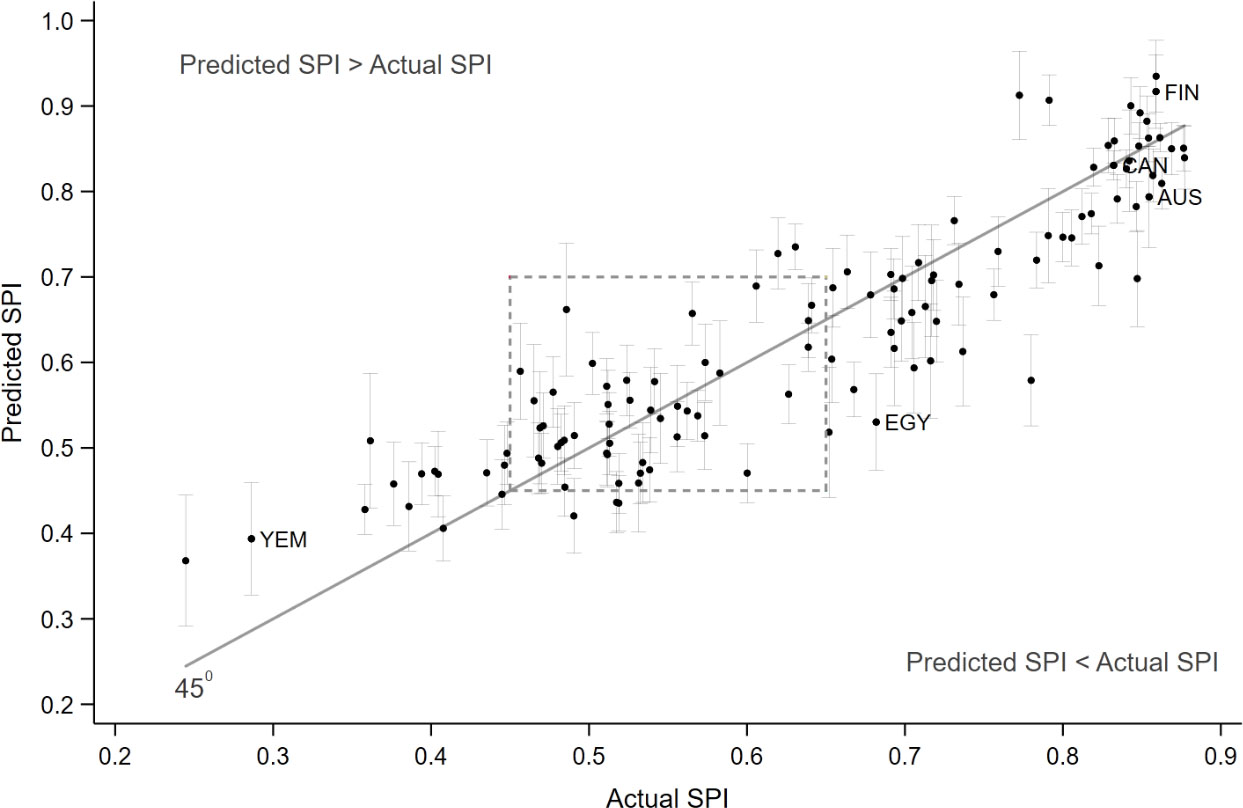
Figure 4.
Predicated versus actual Statistical Performance Indicator (SPI). Note: Country ISO3 abbreviations: YEM
In Table 3, we repeat the estimations based on specification (2) in Table 2 for each of the four components of the SPI. For comparability with the coefficients of the SPI regression, we normalized the SPI components to be between 0 and 1. The regression of the Data Services component is similar to that of the SPI (first column in Table 3). Economic complexity, voice and accountability, and education all positively affect this component. This component does not demonstrate any significant regional variation. The explanatory power of the MSC regression is lower than that of the SPI regression (adjusted
The Data Products regression has a positive and significant coefficient on the log of per capita GDP, country population, and the voice and accountability indicator. In contrast with the Data Services regression, the Data Products estimation produces significant coefficients on the regional dummies. Controlling for other covariates, scores on this component are significantly lower than average in the Middle East and North Africa region.
The log per capita GDP and school enrollment coefficients are positive and significant in the Data Sources regression. This indicator is higher in the United States and Canada than in other regions. The explanatory power of this regression is lower than the SPI, with an adjusted
The Data Infrastructure regression shows the positive impact of economic complexity, population size, the voice and accountability index, and the level of education. The regional effects demonstrate that the Data Infrastructure scores are lower in all regions except the US and Canada compared to Europe.
Figure 4 shows the scatter plot of the actual and predicted values of SPI (based on the regression in Table 2). The predicted SPI reflects the potential equilibrium supply of statistical information that a country should have, given its characteristics. Because at equilibrium, the supply of data should correspond to the demand for data, we interpret the difference between the observed and predicted SPIs as the difference between the supply of and demand for data.
The regression of the SPI has strong explanatory power, which is evident from the tight distribution of countries around the 45-degree line. That line separates countries into two zones. In countries above the 45-degree line, the predicted SPI is larger than the actual SPI. Given these countries’ characteristics, their NSSs undersupply data to data consumers, both domestic and international. The NSSs of countries below the 45-degree line oversupply data, given the profiles and characteristics of their data users.
Figure 5 presents a cut-out of the rectangle in Fig. 4. The SPI of the NSO of one of the rich countries (ORC) is comparable (actual SPI
Figure 5.
Predicated versus actual Statistical Performance Indicator (SPI) in selected countries. Note: High resolution cut-out (dash-line rectangle) from Fig. 4. Country ISO3 abbreviations: NAM
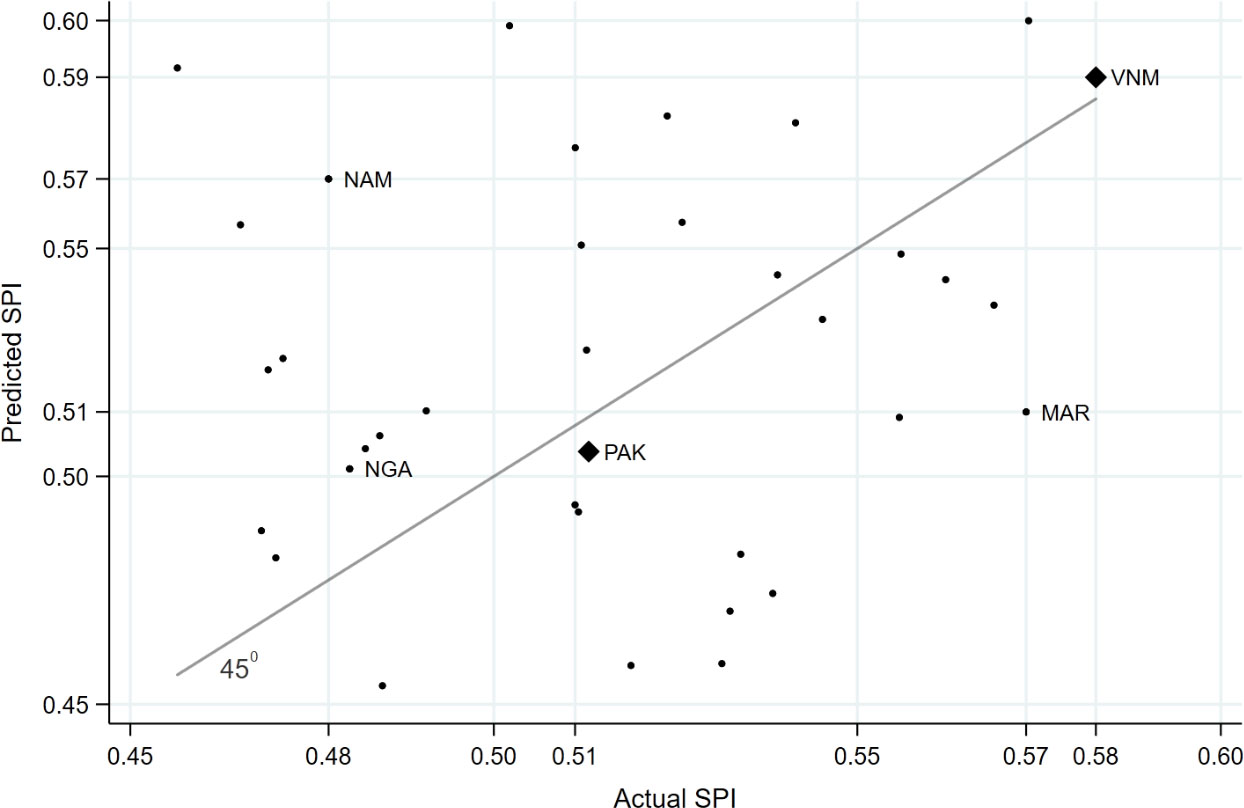
In Figs 4 and 5, NSOs above the 45
Our econometric approach could be criticized from multiple perspectives. The coefficients of our regressions could be biased because of reverse causality. One could argue, for example, that poor statistical performance negatively affects a country’s GDP or prevents it from becoming part of global value chains, reducing economic complexity. Although these concerns have merit, we think that statistical performance in many developing countries is sufficiently weak that it reflects rather than causes the factors we examine.
Some unobserved factors could affect both the SPI and our independent variables. Given our data limitation, we see no way to address such a bias. Once the next round of SPI data becomes available, some of these concerns could be addressed.
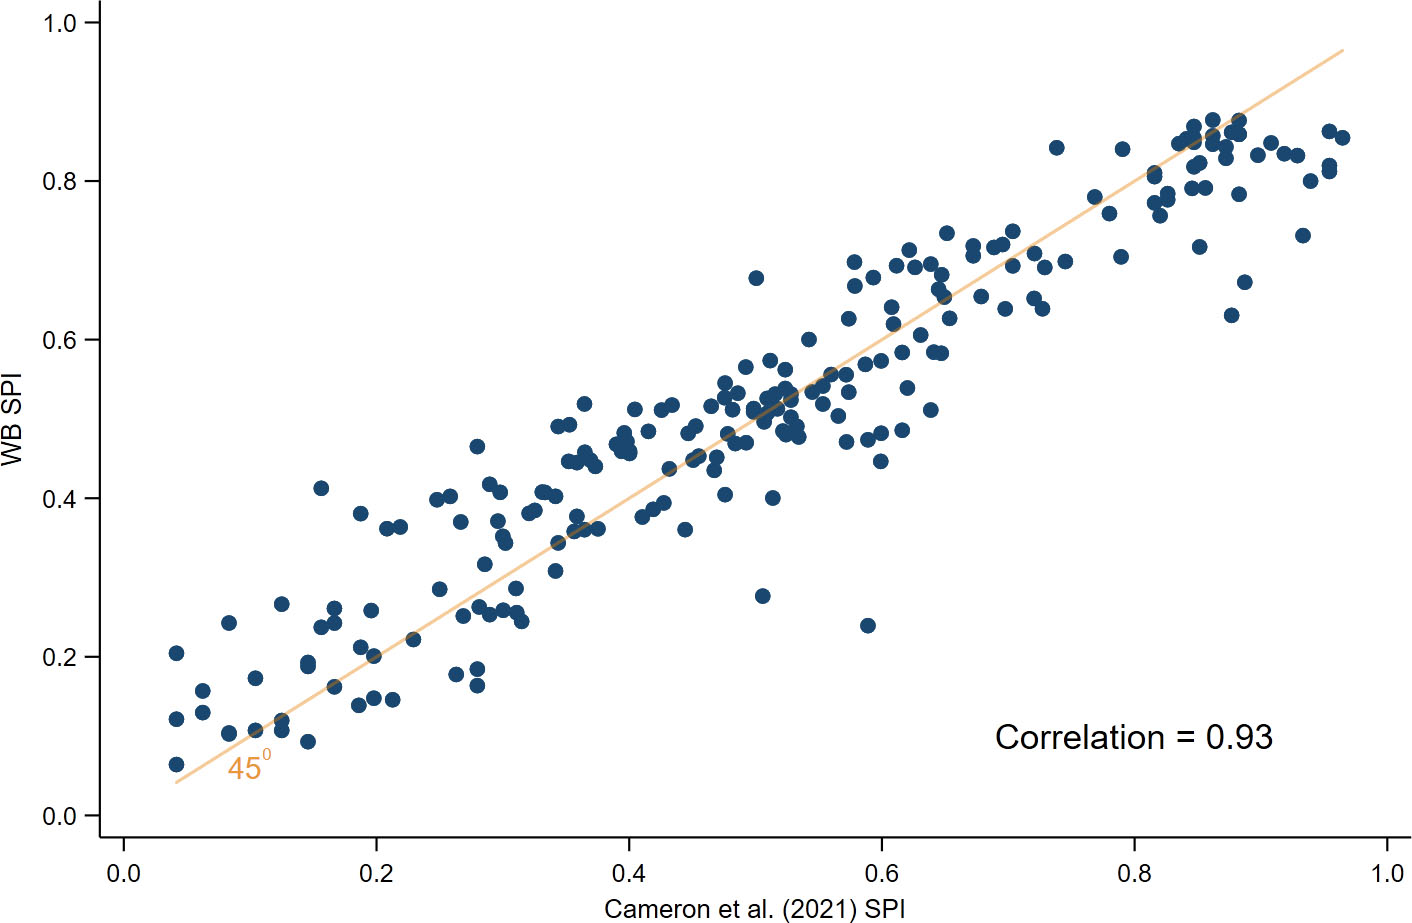
We replicate our analysis on the earlier version of SPI developed by [9]. Given the commonalities in design, both the SPI and the earlier version of the index are highly correlated (Fig. A in the Appendix), and the analysis generates qualitatively similar results.1111 The similarity of the two sets of results provides a degree of confidence in the robustness of our main conclusions.
5.Discussion
Our findings suggest three questions that could stimulate the discussion about building sustainable statistical capacity in developing countries.
Question 1: Should technical assistance delivery mechanisms change, given the marked difference between the cluster of high-supply/high-demand countries and the rest of the world described in Fig. 1?
Over the past two decades, high-performing NSSs have provided much of the technical expertise to improve developing countries’ statistics. The organization, technology, and data sources of high-performing NSSs are drastically different from those of the rest of the world, however. High-capacity countries have long been adapting their statistical production processes to accommodate the ever-expanding set of administrative data that have become the foundation of many statistical products. For example, Denmark’s 1976 population census relied on a population register, a business register, and a set of tax registers [38]. By contrast, administrative data in lower-capacity countries are just beginning to become available for statistics.
High-capacity NSSs use a variety of big data applications for official statistics.1212 With more sophisticated production processes that deliver a more comprehensive array of statistics, staff in high-capacity NSSs are highly specialized. For example, dedicated teams develop supply-use tables, the foundation for rebasing GDP estimates. In contrast, lower-capacity NSSs produce supply-use tables less frequently, and the work is done by non-dedicated teams. Unlike lower-capacity NSSs, higher-capacity NSSs also have staff devoted to developing analytical and innovative products.
These and other differences suggest that technical assistance works best when high-capacity advisors are familiar with the circumstances in low-capacity environments. The IMF Regional Technical Advisory Centers provide a range of statistical support to developing countries. In 2016, they delivered 563 technical assistance (TA) products and 120 training events [39]. These centers are typically staffed by statisticians with extensive experience in high-performing NSSs, who coordinate efforts and sensitize foreign experts to local circumstances. Relocating these statisticians to immerse them in the working circumstances in their countries likely results in better advice and more sustainable outcomes. Leading bilateral providers of TA are adopting a similar approach. The presence of in-country strategic advisors has helped improve donor coordination on NSSs and sensitize experts with little experience in low-capacity environments [40].
The gap between the cluster of high-performing NSSs and the rest of the world shown in Figs 1 and 2 also suggests that expanding South-South knowledge exchange could improve the impact of capacity building. Cooperation among developing countries is not new. The Statistical, Economic, and Social Research and Training Center for Islamic Countries (SESRIC) and AFRISTAT are examples of capacity-building programs for member states. Broadening South-South support to improve official statistics remains relevant in the face of common new challenges faced in lower-capacity NSSs.
Question 2: What factors contribute to the high dispersion across the four dimensions of the SPI in low-performing countries and the slow convergence to the fully capable systems in place in high-performing countries?
Donor coordination in statistical capacity building is weak. A 2020 report by the OECD Development Assistance Committee (DAC) noted that “challenges relating to donor coordination and alignment with country priorities can often be explained by a combination of weak in-country demand for data and statistics, unclear priorities, along with tensions created by strong donor demand for specific data and statistics for program design, targeting, monitoring and results reporting.”
Only half of DAC members make the country’s national strategy for the development of statistics the basis for their engagement. Donors are more likely to invest in point-in-time data sources, such as household surveys, which provide ready-to-use data quickly with minimal cost overruns. Household surveys are not necessarily conducive to developing sustainable statistical capacity, however, because “the role of the NSO is often reduced to recruiting and fielding enumerations while questionnaire designs are standardized and analyzed by development agencies.” In addition, only 16 percent of low-capacity NSOs cited these surveys as a strategic priority.
Donors’ poorly coordinated and survey-centric approach to country support increases scores in one dimension of the SPI (Census and Surveys) but pays little regard to the other three dimensions. It also means that NSSs accept external support if it brings additional funding. Capacity building by international donors might emphasize the need for international comparability, which may be less useful for domestic users. Thus capacity-building driven by international donors may become less effective at the national level. As countries become better at understanding (and stimulating) user demands, they are more likely to increase domestic funding for their work, which should strengthen all four SPI dimensions.
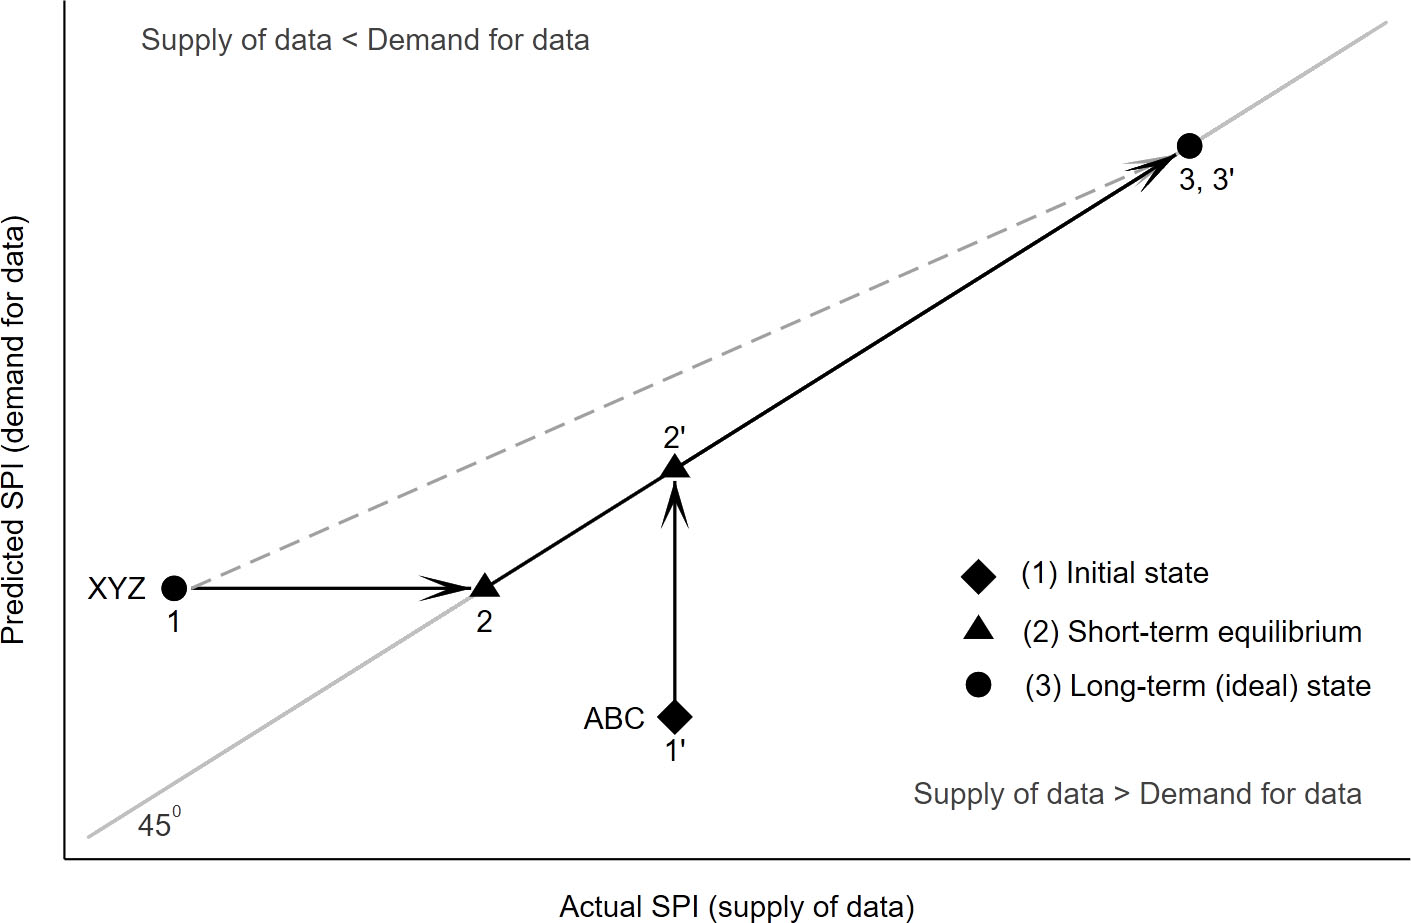
Figure 6.
Strategies for improving statistical capacity. Note: Hypothetical country XYZ suffers from a statistical deficit. Hypothetical country ABC supplies more data than data users can consume. Conventional strategies often aim to improve the capacity of XYZ along the line from point 1 to point 3. Alternatively, the country could first focus on improvements that align data supply with policy capacities, moving along the line from point 1 to point 2. Then, as the country’s data requirements expand, statistical capacity should move from point 2 to point 3. Country ABC that oversupplies statistics should aim to ensure that the supply of data remains above demand as the country evolves, moving from 1’ to 2’ to 3’.
Question 3: Should capacity-building strategies better reflect the fact that many countries provide too little data given users’ needs, as highlighted in Fig. 4?
An important implication of our theoretical framework is the existence of a steady-state equilibrium of statistical capacity that is determined by the supply of and demand for data. This equilibrium shifts in response to changes in the demand for data or changes in the technology of data production [41].
Similar to the turnpike theorem [42], we assume that there exists an efficient and optimal path for statistical capacity building. If the goal of statistical capacity building is far from the current state of the NSS, it is optimal for a country to expand its statistical capacity along the growth path that balances demand for and supply of data. McKenzie [42] provides intuition for this result:
[It] is exactly like a turnpike paralleled by a network of minor roads. There is a fastest route between any two points; and if the origin and destination are close together and far from the turnpike, the best route may not touch the turnpike. But if origin and destination are far enough apart, it will always pay to get on to the turnpike and cover distance at the best rate of travel, even if this means adding a little mileage at either end.
While the paths of statistical capacity growth vary by country, these individual paths converge to the optimal trajectory of the benchmarks of a stationary growth process.
Figure 6 describes potential paths for improving the capacity of two hypothetical countries. Country XYZ suffers from a statistical deficit. Country ABC supplies more data than data users can consume.
Conventional broad-based strategies – following the country’s national strategy for the development of statistics, for example – often aim to improve capacity along the line from point 1 to point 3. These strategies address deficiencies in legal and institutional frameworks, human resources, infrastructure, and statistical operations in order to improve statistics across a wide array of topics. However, the conventional strategy often lacks a clear picture of domestic development priorities and the government’s capacity (and willingness) to act on evidence.
Developing a greater understanding of the state of a country’s policy priorities and policy formulation capacity allows NSS strategies to follow a two-step path. Country XYZ could first focus on improvements that align its data supply with policy capacities, the line from point 1 to point 2. Step 1 moves the country to the statistical capacity optimal growth path. This step would result in an NSS that supplies statistics that address the country’s current data needs and analytic abilities to use them.1313 Point 2 is on the statistics supply-demand equilibrium – the short-term steady-state, given the country’s current characteristics, reflected by the 45-degree line.
Once the country’s production of statistics meets existing country demands, capacity-building strategies should aim to align statistical products and services as the country’s data needs evolve (movement along the optimal expansion path). As the country’s data requirements expand (i.e., move along the 45-degree line away from the origin), statistical capacity should move from point 2 to point 3 (step 2). Aligning NSS capacities to meet evolving needs and policy capabilities is a challenge. Higher levels of policy capability will require a broader set of statistics at more fine-grained levels of detail. Strategies will need to focus on how user needs are evolving and identify data production processes that can adapt to meet these needs.
Two developments in the literature could help implement the two-step path. The first is the framework for tracking the evolution of user demands [43, 44]. This work recognizes the strategic and operational approaches to managing the user relationship. In the strategic approach, NSS management participates in meetings with leaders of government institutions, represents the NSS at international meetings, and/or participates in other high-profile meetings. The operational approach involves establishing and maintaining relationships with statistical experts at other institutions. The UNECE framework also emphasizes the importance of user segmentation in engagement strategies.
The second is the general framework for assessing a government’s policy development capacity, as described in [45]. This framework includes a skill dimension (analytical competencies, managerial competencies, political competencies) and a resource dimension (individual capabilities, organizational capabilities, and system capabilities) that can be useful in determining how to align NSS improvement priorities with policy-making capabilities.
Countries may oversupply statistics for three reasons:
• In countries with a weak ability to control donors, donors may increase supply to meet their own needs.
• Oversupply may reflect strategies to overshoot demand in order to provide sufficient flexibility to adapt to user needs.
• Oversupply may be temporary, as aspects of improvements are discrete. For example, an NSS may have recently invested in systems to facilitate the dissemination of statistical products that outstrip current demand.
For a country that oversupplies statistics, such as country ABC in Fig. 5, capacity-building strategies should ensure that supply remains above demand as the country evolves.
6.Conclusion
In this paper, we propose an approach to operationalizing the newly developed Statistical Performance Indicator (SPI) as an instrument to guide the development of statistical capacity-building strategies in developing countries. Our analysis of the distribution of the SPI and its components over a sample of 215 countries uncovers several important results.
The distribution of SPI scores appears to be bimodal, with two distinct clusters (of low- and high-performing NSSs) separated by a wide gap in SPI scores – a situation similar to the middle-income trap phenomenon in economic development. Poorly performing NSSs have high variance across the four components of the SPI. Because of the interdependence of the SPI components in the production and dissemination of statistical products, the disparity in the levels of individual components hampers the ability of NSSs to deliver services.
Our regression analysis reveals that the country’s per capita GDP, the complexity index, the population’s level of education, and regional characteristics are good proxies for the country’s demand for data. Comparing the measured supply of data with the predicted demand for data shows three types of NSSs: NSSs that undersupply data, oversupply data, or produce the right amount of data. These three groups motivate our two-step strategy of building and enhancing the sustainable statistical capacity of NSSs in developing countries.
Our main proposal is to align capacity-building activities to the data priorities expressed by local actors and their capability to act on these data. NSSs that undersupply data should first bring their data production and dissemination practices in line with their country’s characteristics. After they do so, they should evolve their operations by monitoring and responding to changing demands for their products. Only when the supply of data corresponds to the demand for data are operations sustainable in the long term.
Coordination within the donor community and South–South learning and experience exchange initiatives are critical to increasing the statistical capacity of NSSs. Such coordination can help countries that reached middle-capacity status but have not graduated to the pool of top NSSs bridge the “statistical performance gap.” Placing national policymakers at the heart of measuring capacity and promoting donor coordination with national stakeholders and capacity development driven by national users can help better address the demand-side of statistical capacity building.
The future empirical analysis would benefit from using annual data on the SPI. A panel dataset of SPI would allow researchers to refine the estimates of demand for and supply of data by controlling for country-specific, unobservable effects that might be correlated with statistical performance.
SPI methodology is driven, to a large degree, by the views of data producers and donors. The methodology could be developed further to consider the broader user perspective, particularly at the national level. The future updates of the SPI would also benefit from streamlining metrics based on subjective assessments of complicated issues.
The changes in expectations about the possible future role of NSSs in terms of their capability to provide data stewardship and other relevant services in the new digital data landscape could stimulate new research in measuring capability in this potential new area of user demand [46]. Many developing countries are already adapting their capability in readiness (beyond some more ‘advanced’ NSSs).
The results of our findings should be treated as the first step of this analysis. More in-depth research that relies on detailed country data is required to understand the interplay between the supply of and demand for official statistics in determining the capacity of an NSS. We hope this paper will stimulate research on the optimal path for improving statistical capacity in developing countries.
Notes
2 The Statistical Capacity Building Indicator (established by the World Bank in 2004) increased by about 2 percent between 2004 to 2017 [11]. The Open Data Inventory Index, which assesses the coverage and openness of official statistics, increased by 9.4 points between 2016 and 2020 [12]. Total funding commitments to statistics more than tripled between 2014 and 2017, rising from $214 million (0.14 percent official development assistance) to $689 million (0.34%) [13]. There is also some anecdotal evidence that domestic resources in low-income countries increased in recent years [14].
3 Even the best evaluator can bring personal biases, nonuniform conceptions of capacity, or other subjective elements. Interviewing government officials might bias responses and complicate comparability across countries.
4 The World Bank SPI [15] used in this paper for the analysis was an extension of one developed by [9]. The 2021 indicator used added an additional component to reflect activities by NSS to promote and generate demand for data from the users of official statistics.
5 See [17].
6 We used the Stata cluster kmean routine to perform this analysis [18].
7 The term middle-income trap refers to countries that experienced rapid growth and quickly reached middle-income status but then failed to catch up to high-income countries. Statistical capacity may exhibit the same phenomenon. The SPI, the first capacity building indicator to measure all countries, is in its infancy. It will be some years before there are sufficient time series data to robustly test the statistical performance gap hypothesis.
8
9 The criteria are as follows: Simple: It must be understandable and easy to describe. Coherent: It must conform to a common-sense notion of what is being measured; Motivated: It must fit the purpose for which it is being developed. Rigorous: It must be technically solid. Implementable: It must be operationally viable. Replicable: It must be easily replicable. Incentive consistent: It must respect country incentives.
10 We also estimated model (1) by adding an indicator of a country’s trade openness. This variable is strongly correlated with economic complexity indicator and inclusion of this variable fail to produce qualitative changes in the estimation.
11 The results of this analysis are available from the authors on request.
12 For examples from Statistics Netherlands, see https://www.cbs. nl/en-gb.
13 NSSs should aim to slightly oversupply country demands, to reflect the endogenous growth role of data to the economy. Data are a foundation of the knowledge that is essential for economic transformation. However, it is difficult to measure data’s contribution to growth and thus reflect it in NSS capacity-improvement plans.
References
[1] | OECD. Measuring the non-observed economy: A handbook, OECD, IMF, ILO, Interstate Statistical Committee of the Commonwealth of Independent States, 2002. |
[2] | PARIS21. Proposing a framework for statistical capacity development 4.0, PARIS21, Paris. (2017) . |
[3] | Devarajan S. Africa statistical tragedy. Review of Income and Wealth, (2013) ; 59: : 9-15 |
[4] | UNECE. How are national statistical offices contributing to managing the COVID-19 disaster? Virtual Discussion. June 10, (2020) . Accessed at: https://unece.org/statistics/events/how-are-national-statistical-offices-contributing-managing-covid-19-disaster. |
[5] | UNDESA. Monitoring the state of statistical operations under the COVID-19 pandemic. UN Department of Economic and Social Affairs, World Bank. December (2020) . Accessed at: https://unstats.un.org/unsd/covid19-response/covid19-nso-survey-report-3.pdf. (2020) . |
[6] | Fukuyama F, What is governance? in: Governance: An International Journal of Policy, Administration, and Institutions, (2013) ; 26: (3): 347-368. |
[7] | Bersch K, Praa S, Taylor M. Bureaucratic capacity and political autonomy within national states: Mapping the archipelago of excellence in brazil. in: States in the Developing World. New York, NY: Cambridge University Press. Centeno M, Kohli A, Yashar D. (2017) . |
[8] | Badiee S, Klein T, Appel D, Mohamedou E, Swanson E. Rethinking donor support for statistical capacity building. in: Development Co-operation Report, OECD, (2019) . |
[9] | Cameron G, Dang H, Dinc M, Foster J, Lokshin M. Measuring statistical capacity of nations. Oxford Bulletin of Economics and Statistics, (2021) ; 83: (4): 870-896. |
[10] | UNECE. Modernization of official statistics, Accessed at: https://unece.org/statistics/modernization-official-statistics for more information. (2020) . |
[11] | World Bank. Statistical Capacity Building Indicator. Accessed at https://datatopics.worldbank.org/statisticalcapacity/. (2020) . |
[12] | ODW. Open Data Inventory by Open Data Watch. Accessed at https://odin.opendatawatch.com/. (2020) . |
[13] | PARIS21. Measuring Statistical Capacity Development: A review of current practices and ideas for the future, Accessed at https://paris21.org/sites/default/files/inline-files/Measuring-Statistical-Capacity-Development_draft_0.pdf. (2019) . |
[14] | GPSDD. Five-year strategy 2019–2023. Global Partnership for Sustainable Development Data. Washington DC, USA. (2019) . |
[15] | Dang HAH, Pullinger J, Serajuddin U, Stacy B. Statistical performance indicators and index: A new tool to measure country statistical capacity. Policy Research Working Paper; (2021) ; No. 9570. World Bank, Washington, DC. |
[16] | Gill I, Kharas H. An east asian renaissance: ideas for economic growth. World Bank, Washington DC. (2007) . |
[17] | World Bank. Measuring the statistical performance of countries: An overview of updates to the world bank statistical capacity index. Technical Note. World Bank SPI Team. March 2021. |
[18] | StataCorp. Stata Statistical Software: Release 16. College Station, TX: StataCorp LLC. (2019) . |
[19] | World Bank. The 2008 SNA - concepts in brief. World Bank. Accessed at https://unstats.un.org/unsd/nationalaccount/docs/2008SNA-ConceptsBrief.pdf. (2008) . |
[20] | IMF. Special Data Dissemination Standard Plus, IMF.2020. |
[21] | Hoogeven J, Pape U. Data Collection in Fragile States: Innovations from Africa and Beyond, World Bank, Accessed at https://www.worldbank.org/en/topic/poverty/publication/data-collection-in-fragile-states.2020. |
[22] | Taylor M. The political economy of statistical capacity: A theoretical approach. Inter-American Development Bank, Discussion paper number: IDB-DP-471. (2016) . |
[23] | Fellegi I. Characteristics of an effective statistical system: Morris hansen lecture washington statistical society, Accessed at http://citeseerx.ist.psu.edu/viewdoc/download?doi=10.1.1.200.301&rep=rep1&type=pdf.1995. |
[24] | PACAC. Governance of official statistics: redefining the dual role of the UK Statistics Authority; and re-evaluating the Statistics and Registration Service Act 2007 HC 1820, House of Commons Public Administration and Constitutional Affairs Committee (PACAC). Accessed at https://publications.parliament.uk/pa/cm201719/cmselect/cmpubadm/1820/1820.pdf. (2019) . |
[25] | APSC. Capability Review: Australian Bureau of Statistics. Australian Public Service Commission. Accessed at https://www.apsc.gov.au/capability-review-australian-bureau-statistics. (2020) . |
[26] | Sethi T, Prakash M. Counting on statistics: How national statistical offices and donors increase use? AIDDATA, October (2018) . |
[27] | Sen A. Public action and the quality of life in developing countries. Oxford Bulletin of Economics and Statistics. (1981) ; 43: : 287-319. |
[28] | Moore M, Leavy J, Houtzager P, White H. Polity qualities: How governance affects poverty. Working Paper no. 99, University of Sussex, Institute of Development Studies. http://www.ids.ac.uk/ids/bookshop/wp/wp99.pdf. (2000) . |
[29] | Wang J, Jamison D, Bos E, Preker A, Peabody J. Measuring country performance on health: Selected indicators for 115 countries. Health, Nutrition and Population Series. Washington, DC: World Bank. (1999) . |
[30] | Ravallion M. On measuring aggregate “social efficiency. Economic Development and Cultural Change. (2005) ; 53: (2): 273-292. |
[31] | De Vries W. Are we measuring up? Questions on the performance of national statistical systems. CES/1999/15. |
[32] | Schield M. Statistical literacy: A new mission for data producers. Statistical Journal of the IAOS, (2011) ; 27: (3-4): 173-118. |
[33] | Gray J, Lmmerhirt D, Bounegru L. Changing what counts: How can citizen-generated and civil society data be used as an advocacy tool to change official data collection? Accessed at SSRN: https://ssrn.com/abstract=2742871. (2016) . |
[34] | Kaufmann D, Kraay A, Mastruzzi M. Measuring governance using cross-country perceptions data. in: International Handbook on the Economics of Corruption, ed. S Rose- Ackerman. Cheltenham, UK: Edward Elgar. (2006) . |
[35] | World Bank. World Development Indicators. (2022) . |
[36] | Hausmann R, Hidalgo C. The Atlas of Economic Complexity. Puritan Press, Cambridge MA. (2012) . |
[37] | Marshall M, Cole B. State Fragility Index and Matrix 1995–2010. Center for Systemic Peace. Accessed at http://www.systemicpeace.org/inscrdata.html. (2018) . |
[38] | Jensen P. Towards a register-based statistical system- some Danish experience. Statistical Journal, (1983) ; 1: (3): 341-365. |
[39] | IMF. Statistical department at a glance, IMF. Accessed at https://www.imf.org/external/np/sta/pdf/aglance.pdf. (2016) . |
[40] | UK Foreign, Commonwealth, and Development Office. Strategic partnership with UK office for national statistics, annual review of project performance and evaluation, Accessed at, https://devtracker.fcdo.gov.uk/projects/GB-GOV-1-300443/documents. (2020) . |
[41] | Solow R, Solow R. A contribution to the theory of economic growth. Quarterly Journal of Economics. (1956) ; 70: (1): 65-94. |
[42] | McKenzie L, McKenzie L. Optimal economic growth, turnpike theorems and comparative dynamics. in: Handbook of Mathematical Economics, Arrow KJ, Intrilligator M, eds, (1986) ; 3: : 1281-1355. New York: North-Holland. |
[43] | UNECE. Modern Stats by HLG-MOS, Strategic Communications: Frameworks for Statistical Institutions Phase. Accessed at: https://statswiki.unece.org/display/DIS/Dissemination+and+Communication?preview=/100305463/256970294/Strategic%20Communications%20Framework%20-%20Phase%201-final.pdf. |
[44] | UNECE. Modern Stats, Strategic Communications Framework for Statistical Institutions: Phase 2 – Stakeholder Engagement, 12 November (2019) , Accessed at https://statswiki.unece.org/display/DIS/Dissemination+and+Communication?preview=/100305463/269484040/Stakeholder%20Engagement-draft-November%2012%202019.pdf. |
[45] | Wu X, Howlett M, Ramesh M. Blending skill and resources across multiple levels of activity: Competences, capabilities and the policy capacities of government. Policy and Society. (2015) . |
[46] | Schweinfest S, Jansen R. Data science and official statistics: Toward a new data culture. Harvard Data Science Review, (2021) ; 3: (4). doi: 10.1162/99608f92.c1237762. |
Appendices
Appendix
Figure 7.
Correlation between Cameron et al. (2021) and the World Bank Statistical Performance Indicator (SPI).