
Data and AI literacy for everyone
Abstract
The framework for data and AI literacy proposed in this contribution aims to create a common understanding of data and AI literacy so that it can be systematically included into curricula and educational standards of schools, teacher training, higher education, and further education. The purpose of the framework is to facilitate the respective set of skills and competencies to be taught as a transdisciplinary competence across all subjects from three perspectives: the application-oriented, the technical-methodological, and the socio-cultural perspective. The framework provides a pathway to establishing basic data literacy for everyone, to enable 21st Century citizens to deal with data and AI in a conscious and ethically sound manner.
The framework can also serve as a reference for data and AI literacy programs for extracurricular and vocational training, to enable lifelong learning of data and AI literacy. Therefore, it can be a useful template for public statistical institutions planning to offer data literacy trainings for the public, responding to the challenges resulting from the changing roles and expectations of actors in a data-driven society. A detailed example for such an application, the app “Stadt | Land | Datenfluss”, demonstrates the benefit of the framework for the purpose of adult education.
1.Introduction
The professional statistician working in public statistics is faced with the challenges of an ongoing democratization of data and statistics. We observe fundamental changes in the needs and behaviours of societal actors: Citizens who were merely observers or consumers of statistics and data-driven decisions in their daily lives become collaborators who actively use and interact with data – or even produce data as so-called “citizen scientists”. Collaborators and decision-makers turn into producers, which is facilitated and reinforced by open data movements. The professional statistician needs to understand those changes in roles, tasks and resulting requirements for public statistics. On the other hand, consumers and collaborators need data literacy to develop awareness and confidence in public statistics, a willingness to make data-driven decisions, and – in the case of political decision-makers – a minimum understanding of the needs of public statistics.
There are several examples for public statistical institutions reacting to those competence gaps by offering statistical trainings for users of their products. For example, the German Federal Office for Statistics provides e-learning courses on statistics available for everyone [1]. But data and AI literacy is more than a certain understanding of statistical definitions and techniques.
To date, there is no universally accepted definition of data and AI literacy, especially as distinct from statistical literacy. It can help to start with the purpose of data and AI literacy. Data and AI literacy as a future skill of the 21st century serves to promote autonomy in a modern world shaped by data and its application as well as new technologies like AI and is therefore important for all people – not only for specialists. Data and AI literacy therefore encompasses a set of cognitive, meta-cognitive, affective, and socio-emotional competencies, which are grounded in universal moral values and enable individuals to face the challenges of digital life and adapt to its demands. This approach goes far beyond a set of technical skills, such as skills for data management and analysis and for the development and application of algorithms. There is also a need for a standardized framework to capture at least a minimum set of foundational and cross-cutting data literacy competencies relevant for an individual, an organisation, or a system. This will help to identify clear data literacy needs, support the effective targeting of policies and programs to enable data literacy, and provide a benchmark to assess the impact of such efforts. Developing a suitable standard and measures that allow for a fit-for-purpose tracking of progress on data literacy will bolster the case for investing in data literacy beyond ad-hoc programming.
2.Background and methodology
There is little doubt regarding the importance and role of data literacy as a key competence of the 21st century. Given that, a common basic understanding which serves as a stimulus to jointly shape educational processes in a future-oriented way is needed.
Data literacy enables successful and sustainable action that is based on evidence and that adequately considers uncertainty and change in our living environment. This can only be achieved if data literacy is taught throughout life in all areas of education and is part of general education. Data literacy must be anchored in all formal and non-formal education sectors. To this end, learners must continuously be how data relates to their respective everyday lives: Data represents digital images of real phenomena, objects, and processes – this applies to all fields of implementation. How to collect or provide, evaluate, apply, and interpret data appropriately for the respective application must be systematically learned and practised. The basic concept of data literacy and its sub-areas therefore applies to all educational fields and levels, even if the desired level of competence may differ in each case.
In concrete terms, this requires the inclusion of data literacy in the curricula and educational standards of schools, teacher training and higher education. Learners should not only be addressed as passive consumers of data. Rather they must be enabled to actively shape data-related insights and decision-making. To make lifelong learning of data literacy possible, data literacy programmes for extracurricular and vocational training are also needed. The development and promotion of such programmes is required, for example in cooperation with adult education centres or public libraries.
Data can be seen as abstractions of the real world. By cleaning up and linking data, information is created. Organising, i.e., analysing data creates knowledge. Finally, applied knowledge that is meaningfully interpreted and used, constitutes wisdom or – as the French philosopher Michel Foucault calls it “power” [2]. To obtain a framework for data literacy, this process of creating value from data needs to be described and the respective competencies that facilitate the process flow must be derived and structured.
2.1Review of existing frameworks
Heidrich et al. [3] present a competence matrix based on Ridsdale [4] with five areas of competence, individual competences, and an evaluation according to degree of difficulty. The competence framework on digital competences of the EU Science Hub (DigComp 2.0), on the other hand, places data and information literacy as one of four sub-competences of digital literacy [5]. In this context, the terms data and information literacy are not differentiated from each other, and some skills that are defined as core competencies listed by Heidrich et al. are missing.
In contrast, the ProCivicStat project developed a far more extensive conceptual model [6]. It relates data literacy or statistical literacy to contextual knowledge and differentiates more strongly between data forms that occur in the scientific environment and data forms, with which the citizen comes into contact. This leads to the question of the purpose of education (imparting skills for the responsible educational citizen or for specialist disciplines) that the framework should reflect.
Data literacy skills should enable their critical adopter to address and solve real problems, which means, context is important. In technical environments, where data is used, for example, to ensure the quality of production processes. In contrast, problems with a societal dimension require additional skills and attitudes like data ethics, measurability of phenomena, classification of results in contextual knowledge, or derivation of recommendations for action. The mechanism of collecting or procuring, evaluating, applying and interpreting the data appropriately regarding the relevant usage needs to be internalized.
“To collect, manage, evaluate and apply data in a critical way”, in Ridsdale’s words, defines a process that requires data literacy to master. This process should be represented as a cycle: the application of data often leads to new questions. Specific tasks can be arranged along the different steps of the process cycle. Data literacy can then be seen as a set of competences or, in other words, a cluster of effective behaviours and attitudes towards the fulfilment of a certain task.
Competence frameworks often follow a thematic order; for example, the OECD Competence Framework groups various key competences into competence categories [7]. The European eCompetence Framework (e-CF) [8] arranges competences in fields of competence, defining levels in each case in accordance with the European Qualifications Framework for Lifelong Learning (EQR) [9] and gives examples of knowledge and abilities or skills. In addition to knowledge (theoretical and factual knowledge) and skills (cognitive and practical skills or abilities), the EQR distinguishes between actual competences (responsibility and autonomy). The German Qualifications Framework (DQR), on the other hand, distinguishes between technical competences (knowledge and skills) and personal competences (social competence and independence) [10].
This already reveals the problem of differentiation: responsibility and autonomy in the sense of motivational, volitional, and social skills are represented in the EQR and DQR as a competence category, but in the e-CF they are represented by the description of competence levels. In the field of competence “planning”, for example, performance level 5 is shown in that someone that “uses far-reaching leadership strength to achieve consensus and commitment of the company’s management to the ITK strategy”. Such a level description does not distinguish precisely between ability and willingness, but rather assumes both. The ESCO (European Skills and Competencies of Occupations) project of the European Commission, on the other hand, defines “attitudes” or “attitudes and values” as independent, general competencies [11].
While EQR and DQR propose “knowledge”, “skills” and “values” as different categories of a competence, the KSAVE model [12] proposes them as different dimensions. The latter perspective is also the one of this paper. It has become increasingly common in international digital competency frameworks, as for example in the DQ Framework [13], which aggregates more than 25 prior leading frameworks about digital literacy and skills. The DQ framework lists Data and AI Literacy as one of 24 digital competencies.
The competence framework proposed in this article is very detailed and complex in relation to the examples found in the literature, but the ambition was to create a framework comparable to the standardised European competence framework. The procedure for developing the competence framework was therefore based on the methodology used in comparable projects of the European Commission, such as e-CF or ESCO.
2.2Justification for another data literacy competence framework
The following sections summarize in short, several requirements for a data literacy framework that are not fully met by existing frameworks. In particular, this is true for the focus on interdisciplinarity and the competence dimension of attitudes and values.
Ridsdale defines data literacy as the ability to collect, manage, evaluate, and apply data in a critical manner. If data is to support decision-making processes, competent answers to four basic questions are needed:
• What do we want to do with data? Data and data analyses are not an end in themselves but serve a concrete application in the real world.
• What can we do with data? Data sources and their quality, as well as the state of technical and methodological developments open possibilities and set limits.
• What are we allowed to do with data? All legal regulations of data use (e.g., data protection, copyrights, and licensing issues) must always be considered.
• What should we do with data? Because data is a valuable resource, a normative claim that it should be used for the benefit of individuals and society can be derived from this.
2.2.1Reflection of interdisciplinarity
As those four questions clearly suggest, data literacy must be taught with a trans- and interdisciplinary approach from four perspectives, which must be reflected in the respective competence framework:
• What is to be done? This question refers to the application-oriented perspective (for example, applications from the natural and engineering sciences, economics, medicine, psychology, sociology, linguistics, media studies, and many more).
• How is it to be done? This question is related to the technical-methodological perspective (for example, from the point of view of statistics, mathematics, computer science, and information science).
• What is it to be done for? This question describes the socio-cultural perspective (for example, reflection of legal, ethical, philosophical, ethnological, and inequality aspects).
• Finally, what is the best way to teach it? This question refers to the perspective of education (for example on the part of teaching, methodology, and educational science).
This requirement is closely related to the aspect of lifelong learning of key competencies: How can or should data literacy be taught at school and later in the working world and adult education? In any case, one needs didactic approaches regarding the interdisciplinarity of the task. Complex data projects are executed in teams, they require multi-professional work that includes the ability to manage projects as well as in-depth knowledge of organisational, legal, and ethical framework conditions.
2.2.2Coverage of the competence-defining process
Public statistics provides facts, but if those facts are not understood by consumers or if they are questioned and even “disproven” by citizens who create their own facts by analysing data from “alternative” sources or with “alternative” methods, this may lead to serious problems. We must face the situation that trust in public statistics cannot be taken for granted any more.
On the one hand, data literacy is needed to use data professionally within a specific subject area. This may be a problem in academic research or in companies transforming into data-driven organizations. For public statistics, data literacy as the ability of a citizen to find his way through an overabundance of data and information and to make informed decisions is crucial, as the public attitude and opinion towards data, statistics and data-informed political decision-making affects political decision-makers, at least indirectly. The readiness to trust in producers of public statistics and in data-informed decision-making requires the willingness and the ability to distinguish data and information from interpretations and opinions.
Not only data literacy, but also “information literacy”, “statistical literacy” and recently also “data science literacy” are terms that are repeatedly mentioned as essential competencies in relation to digitisation. Obviously, the delimitation of the terms is by no means conclusively clarified.
Even the question of how concepts of data, information and knowledge should be distinguished can no longer be answered so clearly, at the latest since “big data” also includes images or entire texts under the data term. Finally, the rapid development of technologies and tools for the automated collection, storage and analysis of such semi- and unstructured data contributes to the fact that these are fluid concepts: What is already information in the first context, i.e., data filled with meaning, may be a piece of data in the second context – it depends on the research question.
This aspect becomes even clearer with Rainer Kuhlen’s definition of information as “knowledge in action” [14]. For the design of a competence framework and the derivation of learning objectives for the teaching of data literacy – which is critically if a framework is translated into a curriculum – first (at least) information literacy and data literacy should therefore be considered convergent. All stages of the process of creating value from data or decision-making with data must be mapped.
That means, any competence framework needs to be aligned with the competence-defining process(es): a framework for data literacy must systematically cover the entire process of insight and decision-making with data. Data literacy ensures that answers to real-world problems are found using data in a structured and quality manner. Several models for that process exist; what they mostly have in common is the representation of the process as a cycle: framing the issue and asking the right questions, planning the analysis, data collection, data analysis, data interpretation, decision making and communication. That means, the process starts with real-world objects, whose characteristics are measured and thereby represented in the form of data. Analysed data becomes information, whereas their relationships are revealed. To this point, one can speak of a coding process where context is removed. Then, information is re-contextualized in a decoding process. By a synthesis with other information, larger structures appear, and information turns into knowledge. If knowledge is evaluated and interpreted, general principles can be learned, and the result is wisdom or action, i.e., applied knowledge.
2.2.3Covering competence dimensions
Finally, a competence framework for data literacy must include knowledge, skills, and values for a conscious and ethically sound handling of data. Data literacy as a so-called “key competence” comprises three competence dimensions as described in the KSAVE model mentioned above, that must be mapped in all three competence areas. Each competence area is characterised by
• specific knowledge (dimension “knowledge”),
• the skills and competencies to apply this knowledge (dimension “skills”) and
• the willingness to do so, i.e., the corresponding ethics, values, and attitudes (dimension “values”).
Examples for knowledge, skills, and attitudes related to data and AI literacy are given by the DQ framework, as presented in Table 1.
Table 1
Examples of knowledge, skills, and attitudes/values related to data and AI literacy [13]
| Knowledge | Skills | Attitudes/values |
|---|---|---|
| Individuals understand the theory of data analysis, statistics, and AI-related mathematical concepts and computer programming. They understand how data are generated, to process data based on statistical understanding, and to create and/or use AI algorithms (e.g., machine learning, neural networks, deep learning) to recognise significant patterns and to improve decision-making processes. They understand concepts across multiple disciplines and identify the benefits, limits, and risks brought about through big data, AI, and related technology. | Individuals develop efficient and stable processes to collect, store, extract, transform, load, and integrate data at various stages in the data pipeline. They read, manage, analyse, and process data from a variety of sources, and prepare data in a structure that is easily accessed and analysed according to specific requirements. They create and build knowledge by analysing data, communicate its meaning to others with various data visualization tools (e.g., infographics, dynamic, illustrative, and interactive graphics), and present patterns, trends, analytical insights from data or new concepts in a strategic manner for the intended audience. In turn, they communicate the limitations of data by telling when data is being manipulated to support a limited or false narrative. With understanding of AI, they develop, select, and apply relevant algorithms and advanced computational methods to enable systems or software agents to learn, improve, adapt, and produce desired outcomes or tasks. They use it as a tool to enhance efficiency in creative processes, and develop strategies on how they utilise it in optimizing their own work performance (e.g., predictive behavior analytics, pattern recognition, and decision-making processes). They understand how data and AI may affect one’s perception and reasoning. Individuals are also able to leverage AI to augment their own intelligence while remaining aware of how human value judgements play into the applications of big data and AI in society. | Individuals are confident in pursuing innovative and analytical careers. They are also proactive in applying their knowledge of data and AI into evaluating whether broader systems are acting in ways aligned with community values that promote well-being. |
Data ethics is a central component of any set of data-related skills and competencies and is reflected in all sub-areas of data literacy. This means that when data is collected, managed, evaluated, and applied, in a critical manner, ethical aspects always play an important role. Data ethics, values, and attitudes contribute significantly to ensuring that not only the right means are used to solve problems with the help of data, but above all that the right goals are pursued: Data should make a sustainable positive contribution to society and therefore be used responsibly, context-sensitively, and with an ongoing reflection of possible future consequences.
Given all those requirements discussed above, a competence framework must be transferrable into proposals for curricula, i.e., into concrete and testable learning or competence objectives. This applies “not only to knowledge and skills/abilities, but especially to motivational orientation and values” [15]. For this purpose, the competences must be sufficiently operationalised and formulated, ideally with an initial classification into competence levels or performance levels. This is a prerequisite for selecting and developing measurement and testing instruments for data literacy.
3.The HFD data literacy framework
Data literacy covers both the creation of data products by the methodically experienced specialist as well as the competent handling of data by the end user, i.e., the critical and adequate interpretation and application of the data. The HFD (Hochschulforum Digitalisierung, “German University Forum on Digitization”) Data Literacy Framework was designed primarily for universities and other educational institutions, but also for managers and human resources departments in private and public sector organisations and for political decision-makers. In addition, it is intended to be used to formulate data literacy for the responsible citizen, whereby in this case rather low competence levels should be aimed for.
3.1Definition of “Data Literacy”
Therefore, the HFD Data Literacy Framework defines the term “data literacy” very comprehensively:
Data Literacy is the cluster of all efficient behaviours and attitudes for the effective execution of all process steps for creating value or making decisions from data.
“Effective execution” is one that is target-oriented with respect to the target of the whole process, which is creating value or knowledge from data, i.e., it answers the question of what needs to be done to achieve this goal (“doing the right things”). “Efficient behaviour and attitudes” allow to achieve this target with the least possible use of resources, answering the question of how the target can be achieved in the best possible way (“doing things right”). The explicit highlighting of attitudes is in accordance with Seidl et al. who emphasize the importance of attitudes, values, and ethics for key competences [15].
3.2Structure of the framework
The HFD Data Literacy Framework is structured in four outline levels. They reflect the different levels of the process and its six steps as follows:
Outline level 1 determines 6 fields of competence, derived from the process steps:
(A) Establish data culture (B) Provide data (C) Evaluate data (D) Interpret results (E) Interpret data (F) Derive actions.
The competence fields (A) to (C) correspond to the production process (“coding” from the real world to data and then to data products, the competence fields (D) to (F) correspond to the reception process (“decoding”) from data products to data and then to the real world.
Outline level 2 describes essential competencies for each field, each with a generic description. A further subdivision is made in competence field (B).
Outline levels 1 and 2 of the data literacy framework are summarised in the following Table 2.
Table 2
Overview of the data literacy framework [23], shortened and slightly modified
| Process | Competence field | Competencies | Description |
|---|---|---|---|
| Coding | (A) Establish data culture | (A1) Identify data applications | Identifies knowledge gaps and background information, identifies on this basis a concrete task that can be solved with the help of data, has an idea of the possible value contribution of the data |
| (A2) Specify data applications | Defines minimum and optional requirements, defines delimitations to other tasks, structures the process flow into objects and their relationships, derives measurable objects and hypotheses about their relationships, communicates the requirements to an expert | ||
| (A3) Coordinate data applications | Plans and coordinates a data project, if necessary, with participation of further individuals (from interdisciplinary areas) | ||
| Coding | (B) Provide data | (B1) Plan – (B1.1) Model data applications | Maps the measurable objects into variables with definable properties and their relationships in a model structure |
| (B1) Plan – (B1.2) Comply with data protection/security | Observes guidelines for secure and ethically sound data processing and implements it accordingly where no clear guidelines are defined | ||
| (B2) Obtain – (B2.1) Identify data sources | Identifies various common and novel data sources (internal, external) and evaluates their accessibility, relevance, and usability | ||
| (B2) Obtain – (B2.2) Integrate data | Automatically reads data in various formats, integrates it and documents the integration | ||
| (B3) Prepare – (B3.1) Verify data | Checks the data quality regarding various criteria (correctness, relevance, representativeness, completeness) and documents the audit systematically | ||
| (B3) Prepare – (B3.1) Pre-process data | Cleans data, corrects errors, imputes missing values, standardises, and transforms data, filters relevant data for a given question, links data | ||
| Coding | (C) Evaluate data | (C1) Analyse data | Uses analysis methods from various disciplines (statistics, analytics, machine learning), with the help of suitable tools in a factual and purpose-oriented manner |
| (C2) Visualise data | Utilises static and dynamic visualisations with the help of suitable tools in an appropriate and purpose-oriented manner | ||
| (C3) Verbalise data | Verbalises the results of data analyses in various text forms in a factual and purpose-oriented manner | ||
| Decoding | (D) Interpret results | (D1) Interpret verbalisations | Interprets verbal descriptions of data (analyses) to draw conclusions about underlying data and results, and critically examines interpretations given explicitly or implicitly |
| (D2) Interpret visualisations | Interprets visual descriptions of data (analyses) to draw conclusions about underlying data and results, and critically examines interpretations given explicitly or implicitly | ||
| (D3) Interpret data analyses | Interprets results of data analyses, e.g., statistical parameters, to draw conclusions about underlying data points and relationships or to make forecasts | ||
| Decoding | (E) Interpret data | (E1) Decode transformations | Recognises and assesses the (statistical) methods used; recognises and interprets transformations of the data |
| (E2) Trace back data sources | Can trace back, based on the analyses and information provided, how the data was obtained, from which source it originated and how much confidence can be placed in the data | ||
| (E3) Reconstruct data concept | Can draw conclusions about the data basis and potential fallacies resulting from the process of mapping objects into data | ||
| Decoding | (F) Derive actions | (F1) Identify potential actions | Identifies concrete options for action and for the assessment of which can be evaluated with data; has an idea of the possible value contribution of the data when deriving possibilities for action |
| (F2) Act data-driven | Integrates results into the decision-making process and acts based on these results | ||
| (F3) Evaluate impact | Evaluates data-based actions based on their effectiveness for solving the task, identifies positive and negative outcomes, both anticipated or not |
Outline level 3 gives examples of knowledge, skills/abilities, and motivation and (value) attitudes. The dimension “knowledge” refers to the knowledge needed to master the respective process step. This dimension deals with the (complex technical) knowledge. The dimension “skills” describes the corresponding abilities. It refers to the application of knowledge, i.e., the abstraction of what has been learned. The dimension “Attitudes, Values, Ethics” (AVE) describes motivations and values that an individual should possess. It covers ethical requirements, e.g., to enable objectivity and to avoid misuse of data and analyses. In addition, it is about motivation, openness, and the willingness to learn from mistakes. The AVE dimension is often neglected in competence frameworks. Although values and ethics are sometimes formulated as separate competences or as competence bundles, the personal attitude of the individual is rarely the focus of attention.
For competence “C1: Analyse data” in the decoding subprocess of the value creation process, the framework gives, among others, the following examples:
• Knowledge: knowledge about estimation methods and algorithms; knowledge about possible causes of artifacts
• Skills: Ability to represent measurable relationships in models; ability to anticipate future uses of analysis results
• Attitude: “analytical fairness” as a basic attitude, i.e., the willingness not to perform certain analyses if the risk of misuse is high.
Knowing that statistical artifacts do exist is a necessary precondition to anticipate how they could be misleading when results are used in data-driven actions. This ability in turn is a necessary precondition to decide which and how respective analyses should be performed, interpreted, and eventually provided with a warning notice.
For the corresponding competence “D3: Interpret analyses” in the coding subprocess, the framework gives, among others, the following examples:
• Knowledge: knowledge of statistical terminology; knowledge of statistical fallacies (e.g., correlation vs. causality)
• Skills: Ability to draw conclusions about which characteristics of data a key figure makes statements about; ability to question to what extent the interpretation of results depends on one’s own contextual knowledge
• Attitude: openness to new findings, even if they contradict previous convictions.
Again, the dimensions are closely related. Being aware that previous knowledge about the context of a problem affects one’s perspective on the results to be expected or their meaning, respectively, is a prerequisite to critically question their interpretation.
Outline level 4, finally, specifies competence levels that represent a simplification of the EQR levels. They provide European references for the levels of complexity to which a competence applies. Here, the competences have been specified at three levels of complexity of the underlying requirements, which are to roughly outline a “basic level”, an “advanced level” and an “expert level”. They are defined via requirement levels that build on each other.
These specifications must be worked out in detail to enable the derivation of concrete learning objectives. The following section shows how such learning objectives were derived for a learning application in adult education and how the framework was adapted accordingly.
4.The learning app “Stadt | Land | Datenfluss”
4.1Target groups and approach
The D21 Digital Index, co-funded by the German Federal Ministry for Economic Affairs and Energy, has been providing a comprehensive annual picture of the state of digital society in Germany since 2013. For the year 2021/22, the study shows that the group of users over 50 has increased, digital progress is viewed more positively than in previous years, and access to digital infrastructure has improved significantly. 80% of the population also have mobile access to the internet [16].
There is also a need for action regarding the confident use of digital technologies: A total of 15% of the German population consists of “digital keepers” (40%) and “digital laggards” (15%), while only 46% are “digital pioneers”. In 2016, 31% were classified “digital pioneers” and 26% “digital laggards”. This means that the “digital skills gap” is closing but still, most Germans are at risk of being left behind in the process of the digital revolution – or already are. People with a low level of education are particularly hard hit: across all age groups, there is a sharp drop in the use of digital technologies compared with people with a formally higher level of education (Internet use: 70% vs. 98%). This goes hand in hand with a low awareness of the problem and great carelessness regarding personal data. But the “digitally literate” also have some catching up to do in terms of digital competence: they often tend to underestimate the socio-economic impact of the digital revolution and are hardly or only hesitantly expanding their digital skills. This is especially true for data literacy.
Creating data literacy for all, raising awareness of data handling issues and establishing a confident approach to new technological developments such as AI, IoT or Big Data and one’s own data – these are some of the goals that the German Adult Education Association DVV (“Deutscher Volkshochschul-Verband”) is pursuing with the app “Stadt | Land | DatenFluss” SLDF (“City | Country | Data Flow”, which is a word game in relation to the famous game “Stadt Land Fluss”, known as “Categories”, “Tutti Frutti” or “Jeu du Baccalauréat” in other languages) [17].
SLDF therefore addresses both “digital keepers” and “digital outsiders”. It must be considered that these groups are characterized by a high degree of heterogeneity in terms of their digital preferences and interests, competencies, expectations, experiences, habits, and demands – a “one size fits all” offering is not appropriate under these conditions. That is why the app takes a modular approach.
The first target group can be described as citizens who are in general interested in the topic of digitization and datafication, but struggle with some basic terms and concepts. Their thoughts and needs could be described by questions such as:
• Data is used everywhere – but what do I get out of it?
• Data and information … aren’t they the same thing?
• I’m constantly reading AI, IoT, Big Data … What is that actually?
A second target group can be characterized with the question:
• I know what Big Data and AI are … but how do they affect my life and my job?
For both target groups, it can be assumed that digitization has already changed (and is still changing) their learning habits. Attention spans are getting shorter, the desire for entertainment is growing. Numerous offers compete for the attention of learners. This requires new didactic concepts include playful learning with digital formats, especially if target groups are focused that have unlearned how to learn during their lives or have never learned how to learn.
The workload of the app takes these considerations into account. For the first version, 12 lessons of 3 learning units each, one basic module on fundamental knowledge and several outlooks were developed. With 15 minutes workload on average, each learning unit can easily be completed on the way to work or during a short break. This results in a total workload of 10 weeks when working on one learning unit per (work-)day, which is a sufficient period to establish a new habit of self-directed learning.
4.2Derivation of learning objectives
According to the tradition of empirical research, learning from data starts with one or more research questions (“science starts with a question”) and models a hypothesis-driven or confirmatory approach. To answer that question, data is acquired, prepared, evaluated, and interpreted according to the respective purpose of analysis. In public statistics, the process starts with a need for information brought forward by political decision-makers.
Digitisation, however, creates data “purposelessly” in large quantities and heterogeneity and even raises new questions (“data science starts with the data”). Data-driven or explorative procedures are becoming increasingly widespread in practice, so that new skills are needed in dealing with new forms of data – text, sound, image – beyond the familiar scale levels and forms of storage. An explorative approach of “letting the data speak for itself” is becoming more popular. However, the risk of drawing wrong conclusions is high if there is a lack of a basic understanding of statistical errors such as the confusion between correlation and causality, or if there are unrecognised shortcomings in the quality of the data (e.g., a bias). Additionally, ethical literacy is required when data is freely combined and analysed for purposes other than its original purpose of collection. Regarding public statistics, those developments need to be reflected in regulations that define outputs (= information needs) instead of inputs (= data).
University curricula for undergraduates and graduates traditionally still focus on the “coding side” of the value creation process, for example in statistics courses, as researchers need to learn how to formulate hypotheses, how to collect and manage data, e.g., by conducting surveys, and how to analyse that data statistically and to present it for the scientific community, even though it is likely that this will change in the near future, due to the possibilities of such a “datafication”. The HDF Data Literacy Framework aims to integrate both perspectives.
With respect to the target groups described above, it seems obvious that the HFD Data Literacy needed to be adapted for the purpose of adult education. Its objective is neither the acquisition of expert knowledge nor the ability to apply statistical methods or work with data management and data analysis tools. Those are not the tasks at hand to be performed in everyday life by the average citizen or employee. To them, data literacy should rather provide orientation in a world where “we are drowning in information and thirsting for knowledge”, as futurologist John Naisbitt puts it [18], and be part of a general education for everyone. “If we want responsible citizens in a modern technological society, we have to teach them three things: Reading, writing and statistical thinking, that is, the rational management of risk and uncertainty”, which is a famous (but false) quote by science fiction writer Herbert G. Wells [19].
For this reason, the six original competence fields were renamed and clustered into three competence areas. For each of the competence fields, a leading question was formulated to derive the corresponding learning goals, which was done by answering the question as follows: What does one need to know, to be able to, and to be willing to, so that they can solve the problem(s) described by the respective leading question?
The most central competence area, “Act on data”, groups the fields “(A) Establish data culture” and “(F) Derive actions”. Reflecting the needs of the target groups, they were renamed into “Data culture” and “Data sovereignty”. This area covers the chances and risks arising from novel applications of data, but also the relationship between human and artificial intelligence. A second area, “Use and protect data”, combines the fields “(B) Provide data” and “(C) Evaluate data”. They were renamed into “Consciously share data”, which puts emphasis on data protection issues, and “Gain data and information”, which gives an overview how data is transformed into information by using various analysis techniques. The third area, “Classify data and information”, aggregates the fields “(D) Interpret results” and “(E) Interpret data”, to raise awareness for the need of contextualizing information, so that knowledge and action can be derived.
The following Table 3 summarizes competence areas, leading questions, and respective learning objectives on competence levels L1 as a basic level for the first target group, and L2, an advanced level for the second target group. For each of the dimensions: knowledge (“understand”), skills (“apply”), and attitude (“evaluate”), one learning objective was formulated. Dimensions were renamed as well, so that they can be mentioned in the app without using scientific terms.
Table 3
Learning objectives covered by Stadt | Land | Datenfluss
| Competence area | Leading question | Understand [knowledge] | Apply [skills] | Evaluate [attitude] |
|---|---|---|---|---|
| Act on data | What can, should, may happen with my data? | [L1] Knows opportunities for using data in various application areas | ||
| [L2] Knows details of current developments in data use | [L1] Identifies obvious opportunities for data use in the work environment and in private life | |||
| [L2] Identifies innovative opportunities for data use in the w.e. and in private life | [L1] Is critical-open-minded about data use in the application areas | |||
| [L2] Reflects on data use regarding several criteria (e.g., benefits and costs) | ||||
| What does data do, how can humans and machines complement each other? | [L1] Knows basics of current technologies and methods | |||
| [L2] Knows central strengths and weaknesses of the technologies | [L1] Finds out about new technologies in a targeted manner | |||
| [L2] Develops first own ideas for the use of new technologies | [L1] Shows interest in the opportunities of new technologies | |||
| [L2] Questions technologies regarding potential risks | ||||
| Classify data and information | Which information is in the data, which is not? | [L1] Differentiates key terms (e.g., date vs. information) | ||
| [L2] Differentiates a wider range of technical terms | [L1] Can assess the significance of data in simple cases | |||
| [L2] Can assess the significance of data also in more complex situations | [L1] Reflects on and evaluates the significance of data | |||
| [L2] Distinguishes clearly between facts and interpretations | ||||
| What do results mean in context? | [L1] Recognizes that data and analysis must always be viewed in context | |||
| [L2] Knows different techniques of contextualization | [L1] Can classify data and evaluations in the obvious context | |||
| [L2] Classifies data and evaluations in a diff. manner in various contexts | [L1] Questions evaluations in front of the respective context | |||
| [L2] Questions evaluations in different contexts, according to several criteria | ||||
| Use and protect data | How do I decide about my data on my own responsibility? | [L1] Knows the basic principles of data protection | ||
| [L2] Knows essential rules of data protection | [L1] Detects privacy compliance in simple cases | |||
| [L2] Anticipates impending, more subtle privacy issues | [L1] Recognizes the value of data privacy and security | |||
| [L2] Weighs where the release of own data is justified | ||||
| How do you learn from data? | [L1] Knows basic principles of how knowledge is created from data | |||
| [L2] Knows possible causes of erroneous conclusions during evaluation | [L1] Can find and use nearby data sources | |||
| [L2] Combines data and recognizes correlations | [L1] Reflects on the strengths and weaknesses of data sources | |||
| [L2] Reflects on possible fallacies from data |
4.3Structure and content of the learning app
As a starting point, the app provides a virtual “adult education centre” that contains a glossary and six lessons covering the three competence areas with two leading questions each, i.e., the process steps of learning from or decision making with data. Four additional lessons deal with key drivers behind digitization and datafication: big data, artificial intelligence, internet of things, data flows and digital communication. The purpose of that virtual centre is to understand what the key technologies behind digitization are. In upcoming versions of the app, other technologies like robotics, virtual/augmented reality and others can be included. In terms of competence dimensions, it is the place where “knowledge” is stored and can be explored, comparable with a library or a museum. The learnings paths can be followed according to individual preferences, lessons may be left out or completed only in parts.
To apply that knowledge in concrete problems and to evaluate potential solutions, real-world situations seem a more appropriate environment: “skills” and “attitudes” should be practiced where the change through digitization takes place. The app presents three fields of application: health, mobility & smart city, work & economy. In the future, more fields can be added, for example leisure, education, energy, or sustainability. Within each field of application, users can work (or play) their way through four learning stories, two on competence level L1 (basic) and two on competence level L2 (advanced). Table 4 gives an overview of the stories.
Table 4
Learning stories included in Stadt | Land | Datenfluss
| Health | Mobility and smart city | Work and economy | Competence level |
|---|---|---|---|
| Monitoring of body data | Dynamically optimized traffic flow | The flexible workplace | L1 |
| Health information on the net | Dynamically optimized public transport | Digital learning in the work process | L1 |
| The digital health system I | The smart public space | Intelligent recruiting | L2 |
| The digital health system II | Assistance systems in the car | Smart factory | L2 |
Figure 1.
Typical learning path in Stadt | Land | Datenfluss.
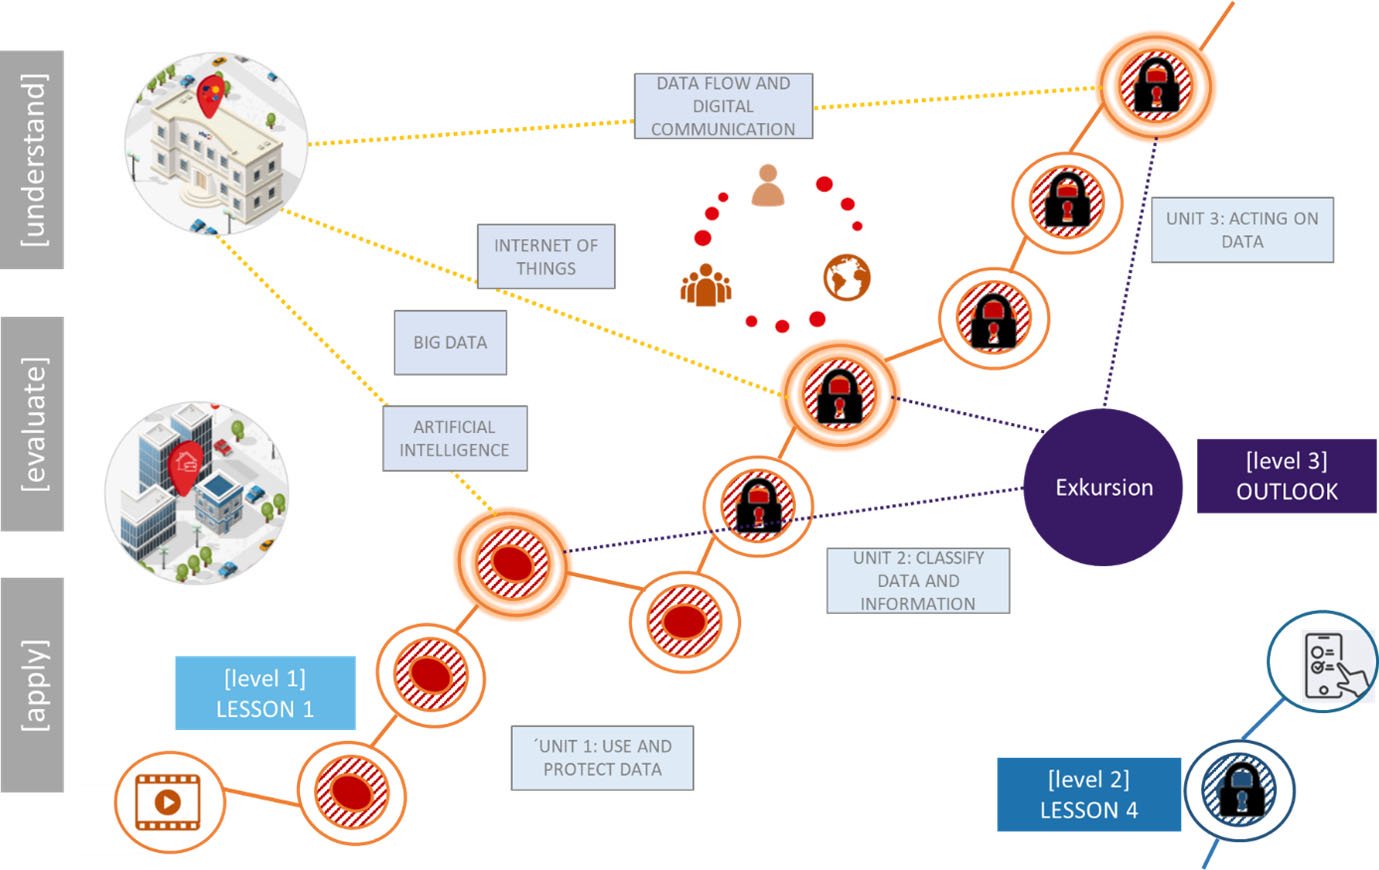
One story, “Monitoring of body data”, describes a conversation of Timm and Martin on a bike trip, where one of them frequently monitors his heart rate, calory burning rate, and other measures with the help of his smart watch and an app. Several simple statistical concepts like the average are explained, as well as some basic chart types. Also, the difference between a measurement (the reflection of a light signal in a person’s blood) and a key figure (percent of oxygenic saturation, calculated with an algorithm) is discussed to clarify the relationship of data and information. It is mentioned that both during the measurement and the calculation, errors may happen, so that results may show random variation.
Or there is Mara, a young employee who works in her home office and reflects on how video conferencing has changed the way she interacts with her colleagues. Privacy and security issues of dataflows caused by the digitization of communication are in the centre of the story “The flexible workplace”. Later that day, Mara will apply online for a job and experience AI-assisted “Intelligent recruiting” – and find out about chances and risks of algorithms in digital recruiting. Then the user meets Lena, the 16-years-old trainee in car mechanics, who is curious about the large amount of sensor data that is collected in a car and can be analysed to identify potential problems. In the story “Digital learning in the work process”, she talks about digital learning approaches in dual education. Visiting the “Smart factory” where her uncle works, she gets deeper insights into the use of data and algorithms to monitor, control, and optimize production processes with so-called statistical process control.
Whenever a specific term such as “AI”, “internet of things” or “wearable” appears in one of the stories, a link to a glossary is provided. Additional elements used to build the bridge to real-world applications are short videos (excursions), where experts from different research fields describe their work with respect to data literacy. One of the videos for instance deals with robotics, another one with urban planning. Figure 1 schematically shows a typical learning path.
4.4App and MOOC as complementary offers
SLDF can be accessed via two different channels. On the one hand, it is implemented as an app for iPhone and Android phones. Both app versions are available for free and can be downloaded from the respective app stores. They do not require a log in, and the learning status is stored on the user’s device.
A second way of accessing is the browser version, hosted by KI-Campus, the German learning platform for artificial intelligence, which is founded by the German ministry of education and research (Bundesministerium für Bildung und Forschung, BMBF). KI-Campus offers courses in German and English, most of them on university level. SLDF can be reached on the KI-Campus website and is fully integrated into its learning management system. A login is optional but required if users want to save their learning status, because it is stored centrally on the platform.
Regarding the expected learning situation, the app allows an approach that can be described as “affective”, that means, the primary desire is one for entertainment and users want to play. Short learning units that can be completed in approximately 15 minutes allow that content is learned selectively. Learning units within a lesson or learning story of a field of application must be completed one after another on a predefined learning path. The approach of the browser version addresses a more cognitive learning situation where users primarily want to learn in focused, probably longer sessions that require more concentration. Content is linked to context, which means that no strict learning paths are given. Users can decide by themselves where they want to start, stop, or continue.
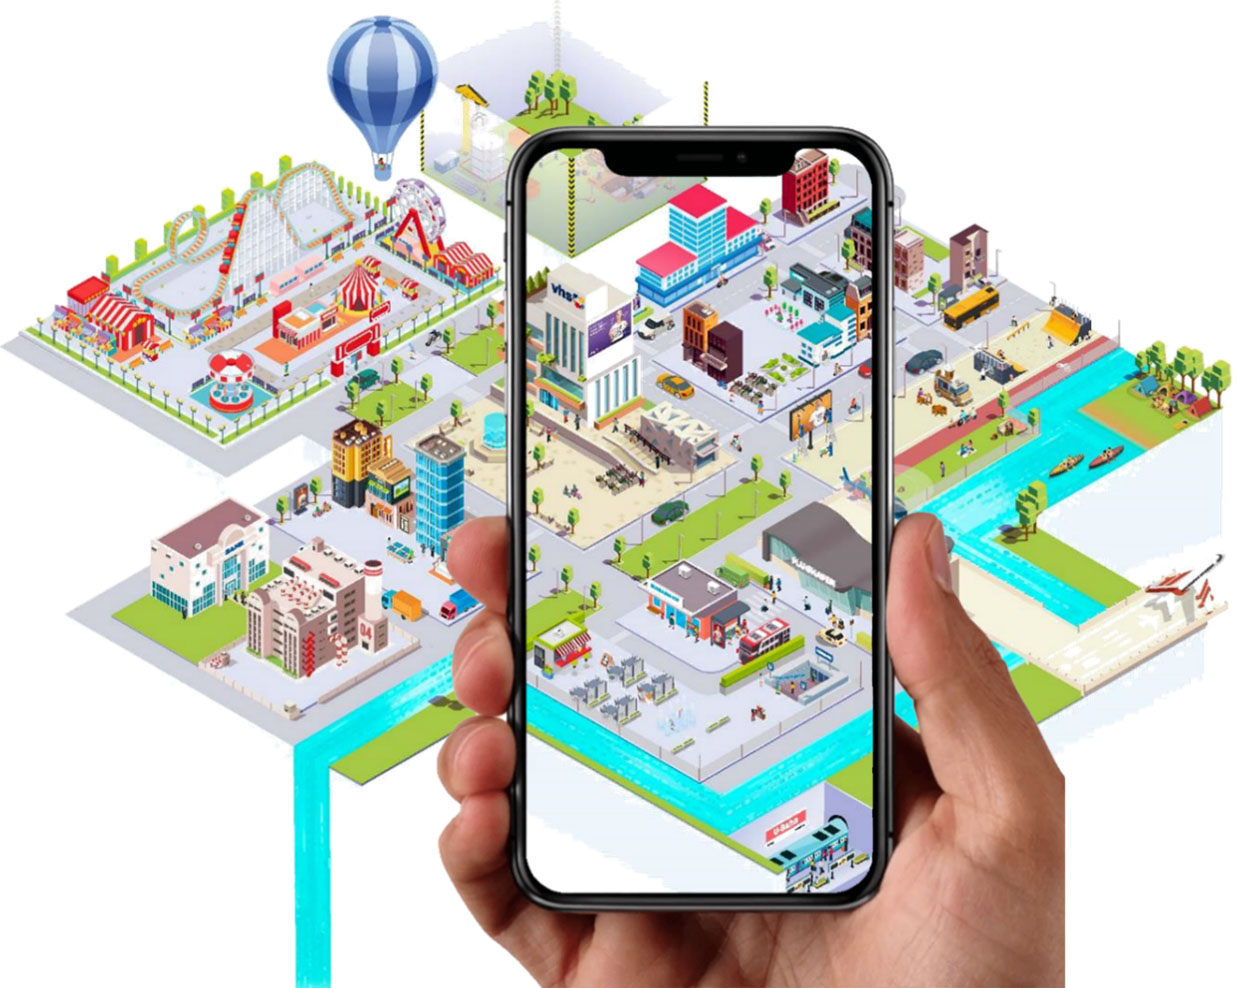
All that is reflected in the functionality of the two different versions. “Everyday life” is the principle behind the app’s design and approach. Short texts are optimized for smartphone displays, animations and short quizzes are included regularly, and the graphical design reminds of a mobile game. Also, one can earn bonus points that can be exchanged for short and entertaining games on the virtual city’s “playground” which is shown in the northwest of the map (see Fig. 2). The browser version, in contrary, is designed as a classical Massive Open Online Course (MOOC). Reduced graphical design prevents distraction, there are links to additional content on the internet, or external content is embedded, e.g., articles from Wikipedia. Advances courses that are available on the platform can be taken to broaden or deepen the topics where the course itself can only give a first insight. Furthermore, the MOOC can be extended with other didactic scenarios, such as tutoring or peer-learning. The two offerings, app and MOOC, are intended to complement each other.
Figure 2.
Map of Stadt | Land | Datenfluss.
5.Data and AI literacy for everyone: The Data Literacy Charter
“The Internet is new territory for all of us” – this is what the German Chancellor Angela Merkel said at a joint press conference with Barack Obama in 2013. At the beginning of February 2021, the Stifterverband and numerous partners published a Data Literacy Charter [20]. Its signatories express their common understanding of data literacy in the sense of comprehensive data literacy and its importance in educational processes.
If educational processes for the 21st century are to be driven forward together, a long journey lies ahead. The charter intended to guide such a journey is an initial, rough map of the paths ahead. The longer one is on the road, and the more one has explored and built on these paths, the more accurately one will be able to draw the map in the future.
To characterize the importance and role of data literacy as a key competence of the 21st century, the Data Literacy Charter focuses on five guiding principles as waymarks:
1. Data literacy must be accessible to everyone.
2. Data literacy must be taught throughout life in all areas of education.
3. Data literacy must be taught as a transdisciplinary and interdisciplinary skill.
4. Data literacy must systematically cover the entire process of knowledge and decision-making with data.
5. Data literacy must encompass knowledge, skills, and values for the conscious and ethically sound handling of data.
The Data Literacy Charter is a first sketch of a map that is urgently needed in a world characterized by digitization. It provides orientation for a path that needs to be travelled and explored further. The latest step on this path was the establishment of a working group to develop an IEEE standard for data and AI literacy, skills, and readiness in September 2021 [21]. Following the DQ framework, data and AI literacy is defined as: “The ability to generate, process, analyse, present meaningful information from data and develop, use, and apply artificial intelligence (AI) and related algorithmic tools and strategies in order to guide informed, optimized, and contextually relevant decision-making processes.”
To coordinate global data and AI literacy building efforts, the standard intends to establish an operational framework and associated capabilities for designing policy interventions, tracking their progress, and empirically evaluating their outcomes. The standard will provide a common set of definitions, language, and understanding of data and AI literacy, skills, and readiness.
The purpose of the standard is to enable that the respective set of skills and competencies are widely taught as a transdisciplinary competence across all subjects from three perspectives (application-oriented, technical-methodological, and socio-cultural) and can be acquired by all people so that every individual, and our society as a whole will be enabled to deal with data and AI in a conscious and ethically sound manner. The standard creates a common understanding of data and AI literacy so that it can be systematically included into curricula and educational standards of schools, teacher training, higher education, and further education. Furthermore, the standard shall serve as a reference for data and AI literacy programs for extracurricular and vocational training, to enable lifelong learning of data and AI literacy. Given that, such a standard can serve as a basis for eventually developing a convergent, coherent data literacy assessment, measurement and impact evaluation framework for the national, regional, and global levels that can help to fill the empirical evidence gap on outcomes from data literacy interventions and programs.
The standard will be developed over the next two to three years by an international working group chaired by the author of this article. It builds on the HFD Data Literacy Framework presented above.
6.Discussion and conclusion
Since its first release in German [22], the HFD Data Literacy Framework has been implemented in over two dozen curricula of data literacy programmes at German universities. Furthermore, it has been adapted to derive the curriculum for an app for adult education in Germany: “Stadt | Land | DatenFluss” SLDF. The app is under the patronage of the German Chancellor Angela Merkel, who gave the following testimonial: “New technologies mean new opportunities, but also new challenges. Of course, this also applies in the digital world. To feel secure here, digital skills are needed – especially data skills. Whether communication or consumption, e-health, or e-mobility – with more networking, more data is in circulation, including sensitive personal data. This makes it even more important to be able to use and share data confidently and securely. The app SLDF from the German Adult Education Association DVV helps people strengthen their own data literacy. This makes learning fun.”
In a playful way, the topics of work/economy, smart city/mobility and health are addressed in a virtual city. To this date, the app has been awarded “App of the month July 2021” by the Deutsche Akademie für Kinder- und Jugendliteratur (German Academy for Children’s and Youth Literature) and has been put on the shortlist of the Deutsche Preis für Online-Kommunikation 2021 (German Award for Online-Communication) in the category “innovation of the year”.
This demonstrates the flexibility and practical usefulness of the data literacy framework, both in academic and non-formal education. It also supports the thesis that the basic concept of data literacy and its sub-areas applies to all educational fields and levels, even if the desired level of competence may differ in each case.
On the other hand, the curriculum of SLDF extends the framework presented here by examples of knowledge, skills, and attitudes, that could also be associated with AI literacy – a concept not systematically described in detail so far, even though it is mentioned in the DQ Framework. This is subject to further research.
It should be beyond question that data (and AI) literacy must be anchored in all formal and non-formal education sectors and thus established as part of general education. In concrete terms, this requires the inclusion of data literacy in the curricula and educational standards of schools, teacher training and higher education. To make lifelong learning of data literacy possible, data literacy programmes for extracurricular and vocational training are also needed. Public statistical institutions can play an important role in providing such training, especially if they cooperate with other educational actors.
Acknowledgments
I would like to express my very great appreciation to Gabi Netz and the whole DVV team, as well as to Florian Rampelt, Henning Koch and Laura Wibbe for their valuable feedback and support. My special thanks go to Georg Fahrenschon.
References
[1] | Destatis. E-Learning Statistik. [Online].; n.d. [cited 2022 03 31]. Available from: HYPERLINK “https://www.destatis.de/DE/Service/Statistik-Campus/E-Learning/eLearning-statistik.html” https://www.destatis.de/DE/Service/Statistik-Campus/E-Learning/eLearning-statistik.html. |
[2] | Foucault M. Power/knowledge: Selected Interviews and Other Writings, 1972–1977 New York: Pantheon Books; (1980) . |
[3] | Heidrich J, Bauer P, Krupka D. Future Skills: Ansätze zur Vermittlung von Data Literacy in der Hochschulbildung. Arbeitspapier Nr. 37. Kaiserslautern; (2018) . |
[4] | Ridsdale C, Rothwell J, Smit M, Al-Hassan H, Bliemel M, Irvine D, et al. Strategies and Best Practices for Data Literacy Education: Knowledge Synthesis Report; (2015) . |
[5] | European Commission. The Digital Competence Framework 2.0. [Online].; (2018) [cited 2022 03 31]. Available from: HYPERLINK “https://ec.europa.eu/jrc/en/digcomp/digital-competence-framework” https://ec.europa.eu/jrc/en/digcomp/digital-competence-framework. |
[6] | Nicholson J, Gal I, Ridgway R. Understanding Civic Statistics: A Conceptual Framework. A product of the ProCivicStat Project; (2018) . |
[7] | Organisation for Economic Co-operation and Development. Definition and selection of competencies (DeSeCo): Theoretical and conceptual foundations: Strategy paper; (2002) . |
[8] | European Commission. European e-Competence Framework 3.0. Ein gemeinsamer europäischer Rahmen für ITK-Fach-und Führungskräfte in allen Branchen. CWA 16234:2014 Teil 1; (2016) . |
[9] | European Commission. Der Europäische Qualifikationsrahmen für lebenslanges Lernen. Luxemburg; (2008) . |
[10] | Deutscher Qualifikationsrahmen. DQR-Niveaus. [Online].; n.d. [cited 2022 03 31]. Available from: HYPERLINK “https://www.dqr.de/content/2315.php” https://www.dqr.de/content/2315.php. |
[11] | European Commission. ESCO – Skills/Competences – European Commission. [Online].; n.d. [cited 2022 03 31]. Available from: HYPERLINK “https://ec.europa.eu/esco/portal/skill” https://ec.europa.eu/esco/portal/skill. |
[12] | Binkley M, Erstad O, Herman J, Raizen S, Ripley M, Miller-Ricci M, et al. Defining Twenty-First Century Skills. In Griffin P, McGaw B, Care E. Assessment and Teaching of 21st Century Skills. ordrecht: Springer; (2012) . |
[13] | IEEE Standards Association. Standard for Digital Intelligence (DQ) – Framework for Digital Literacy, Skills, and Readiness. IEEE 3527.1-2020; (2020) . |
[14] | Kuhlen R. A 1 Information – Informationswissenschaft. In Kuhlen R, Semar W, Strauch D. Grundlagen der praktischen Information und Dokumentation. Berlin: De Gruyter Saur; (2013) . |
[15] | Seidl T, Baumgartner P, Brei C, Gerdes A, Lohse A, Kuhn S, et al. (Wert-)Haltung als wichtiger Bestandteil der Entwicklung von 21st Century Skills an Hochschulen (AG Curriculum 4.0). Diskussionspapier Nr. 3. Berlin; (2018) . |
[16] | Dahte R, Jahn S, Müller LS, Exel S, Fröhner C, Herrmann A. D21 Digital Index 2021/2022. Jährliches Lagebild zur Digitalen Gesellschaft. Berlin; (2022) . |
[17] | Deutscher Volkshochschul-Verband. Stadt | Land | Datenfluss. Die App für mehr Data Literacy. [Online].; (2021) [cited 2022 03 31]. Available from: HYPERLINK “https://stadt-land-datenfluss.de/” https://stadt-land-datenfluss.de/. |
[18] | Naisbit J. Megatrends: Ten New Directions Transforming Our Lives New York: Grand Central Publishing; (1982) . |
[19] | Tankard JW. The H.G. Wells quote on statistics: A question of accuracy. Historia Mathematica. (1979) . |
[20] | Schüller K, Koch H, Rampelt F. Data Literacy Charter. Berlin; (2021) . |
[21] | IEEE Standards Association. Standard for Data and Artificial Intelligence (AI) Literacy, Skills, and Readiness – Active PAR. P7015; (2021) . |
[22] | Schüller K, Busch P, Hindinger C. Future Skills: Ein Framework für Data Literacy. Arbeitspapier Nr. 47. Berlin; (2019) . |
[23] | Schüller K. Future Skills: A Framework for Data Literacy. Working Paper No. 53. Berlin; (2020) . |
Data and AI literacy for everyone
What is it about?
The framework provides a pathway to establishing basic data literacy for everyone, to enable 21st Century citizens to deal with data and AI in a conscious and ethically sound manner. The framework can also serve as a reference for data and AI literacy programs for extracurricular and vocational training, to enable lifelong learning of data and AI literacy. Therefore, it can be a useful template for public statistical institutions planning to offer data literacy trainings for the public, responding to the challenges resulting from the changing roles and expectations of actors in a data-driven society. A detailed example for such an application, the app “Stadt | Land | Datenfluss”, demonstrates the benefit of the framework for the purpose of adult education.
Why is it important?
The framework for data and AI literacy proposed in this contribution aims to create a common understanding of data and AI literacy so that it can be systematically included into curricula and educational standards of schools, teacher training, higher education, and further education. The purpose of the framework is to facilitate the respective set of skills and competencies to be taught as a transdisciplinary competence across all subjects from three perspectives: the application-oriented, the technical-methodological, and the socio-cultural perspective.

