
Localizing the Sustainable Development Goals: A case for investment in data and impact evaluation
Abstract
This paper describes data collection and analytics challenges at the sub-national level related to measuring SDG indicators and the attribution of government expenditure to the SDGs. The analytical work assessed the quality of sub-national data using Demographic and Health survey (DHS) and its suitability for analysing the impact of local government expenditure on SDG indicators in the Philippines.
Our findings suggest that national level surveys lack sufficient granularity to allow for a reliable and accurate measurement of progress over time at the subnational level. In addition, many of the SDG indicators could not be approximated at the local government level. At the same time, data on local government expenditure are in many cases too aggregated to be able to identify causal effects of education or health expenditure.
In a best-case scenario, a design of multipurpose household surveys representative at the subnational levels would allow for timely collection, analysis and monitoring of progress over time and would allow for a more tailored modules that focus particularly on the measurement of SDG indicators. At the same time, the creation of data ecosystems at the municipality level through open data portals would enable the timely collection of government expenditures.
1.What is SDG localization?
Localization of the Sustainable Development Goals (SDGs) is the process of defining, implementing and monitoring strategies at the local level to achieve global, national and subnational sustainable development goals and targets [1]. More specifically, it considers the vital role of subnational and local governments in the quest to deliver the 2030 Agenda [2]. The United Nations Secretary-General’s Synthesis Report [3] on the Post-2015 Development Agenda states that “many of the investments to achieve the Sustainable Development Goals will take place at the subnational level and be led by local authorities”. This role ranges from setting goals and targets to determining the best means of implementation and using indicators to measure and monitor progress [4]. Without the involvement of the local government, it is likely that 65 percent of the SDG targets may not be achieved [5].
The adoption of the 2030 Agenda and the SDGs initially involved global efforts emphasizing the implementation at the national level; however, most of the Agenda’s 169 targets rely on the contributions and responsibilities of subnational governments. Complex challenges such as eradicating poverty, reducing inequalities and achieving environmental sustainability require the active involvement of local and regional governments. As essential service providers in health, education, housing, food systems, and water and sanitation, they play an important role in delivering on the SDGs. Local governments are often in a solid position to identify and respond to gaps in and needs of successful implementation of the SDGs. Since local governments frequently interact with their citizens, they are better positioned to understand their needs, identify gaps and vulnerable groups, and facilitate awareness on the SDGs [6]. SDG localization not only concerns setting goals and applying indicators, but it is also an opportunity to make development more inclusive and participatory by including people in decisionmaking and strengthening local institutions and processes.
National governments are also actively promoting initiatives aimed at localizing the SDGs [7]. Further, local initiatives relating to implementing the 2030 Agenda are being promoted at the global scale through Voluntary Local Reviews and recent initiatives by the Organisation for Economic Co-ooperation and Development [8] for promoting cities’ peer learning.
The concept of localization is far from new. Local Agenda 21 was adopted at the United Nations Conference on Environment and Development held in Rio de Janeiro, Brazil in 1992. A voluntary process was introduced that required local governments to consult with the local community, minority groups, and the private sector to develop local environmental plans, policies and programmes. Localization was also promoted to achieve the Millennium Development Goals (MDGs). Embodying the localization in the SDGs and its targets was initiated by the United Nations Development Group, which identified several aspects that were instrumental for SDG localization. As part of the consultation process, it was concluded that SDG localization requires a multilevel governance approach and inclusion of local stakeholders to create a sense of ownership, and instil commitment and accountability.
Moreover, a strong commitment to SDG localization by national governments is considered critical for providing the legal frameworks and the institutional and financial capacity needed for localizing the SDGs [6]. For local governments to be the catalyst of change their full participation is required in implementing, setting the agenda for, and monitoring the SDGs. To achieve this, they need to have financial means and effective measures to ensure the accountability of all relevant actors for the implementation of policy decisions and the use of fiscal resources [10].
Although the concept of localization is critical in achieving the SDGs, at least in theory, to date, the evidence-based research has not gained prominence. Assessments have mainly been based on national SDG review reports such as the Voluntary National Reviews (VNRs). Recently, [11] found that a key barrier to effective localization is often found in weak institutions and systems of governance. In many cases, the coordination of SDG implementation is led mainly by the national government due to low engagement and participation of local governments. In cases where local government is committed to SDG agenda there is no specific budget allocation to the SDGs; instead, local authorities map percentages of the traditional municipal budget to the SDGs.
Crucial for the successful implementation of the SDGs is data availability and the analytics to support effective planning and acceleration.11 There is a need for reliable and evidence-based data and analytics at the local scale that can be used as a baseline to ascertain SDG gaps at the local level and actions needed to meet the SDG targets. The SDGs can be monitored through several indicators, many of which can be adapted to local contexts. Therefore, data collection initiatives can also promote broad stakeholder engagement, thus contributing to inclusive SDG implementation. Data collection at the local level and analysis can enable a better understanding of the local realities and the needs of vulnerable groups, thus contributing to 2030 Agenda’s principle of ‘leaving no one behind’.
2.What is needed to push the frontier on SDG localization?
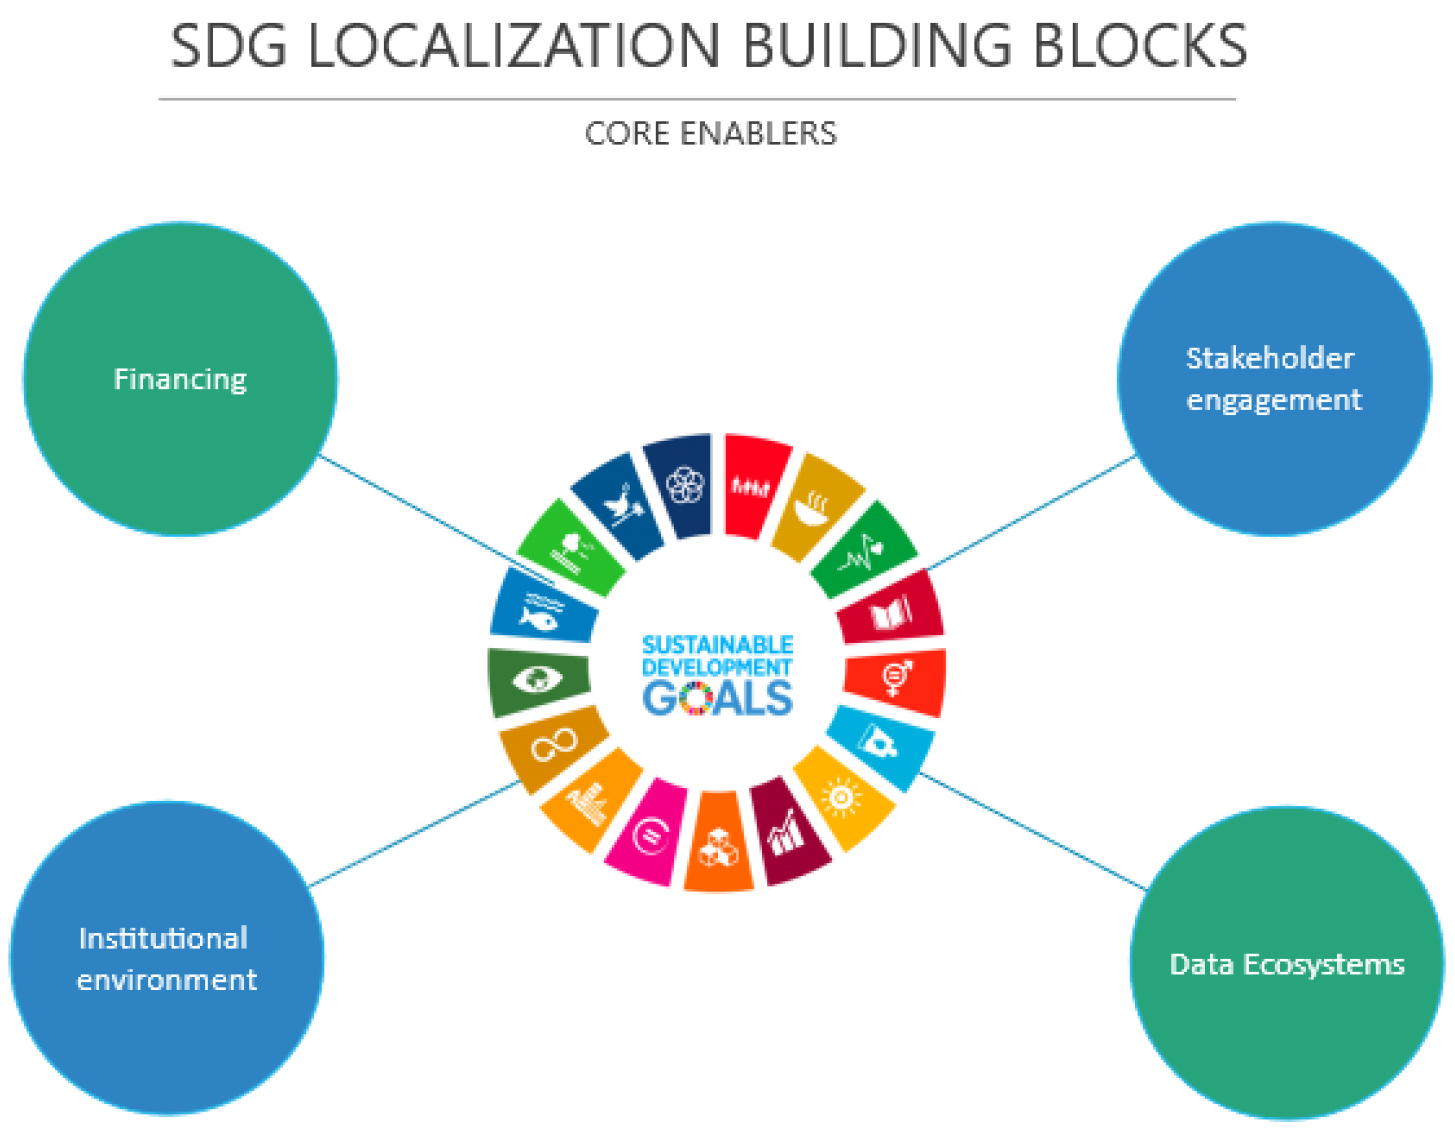
Localization of the SDGs can be challenging and complex globally, and even more so in developing countries. The challenges include: fragmented responsibility and weak local governance and accountability; limited availability of data sets for conducting monitoring and evaluation activities, including setting indicators; evident capacity gaps in human and financial resources; and a lack of multi-stakeholder partnerships and consideration of synergies and trade-offs [12, 13]. Discussed below are some of the major challenges in the SDG localization process; recommendations are provided on how to overcome them. These recommendations are also the building blocks for creating the necessary conditions for SDG localization. Figure 1 shows the key enablers on the path of achievening SDG at subnational level.
Figure 1.
SDG Localization core enablers.
2.1Policy coherence
To accelerate the necessary progress on SDG implementation a systems approach needs to be in place where there is a strong commitment to SDG localization evident in collaboration at all levels of government. Policy integration has been earmarked as a critical enabler for achieving the SDGs [14]. Achieving a policy coherence at all levels is not an easy task. Horizontal and vertical intersectoral integration needs to be developed by adjusting existing or adopting new institutional structures and decision-making processes [6].
In order to create a conducive environment for achieving the SDGs the efficiency and effectiveness of governance systems need to improve through national policies and coordination mechanisms as well as measures that can be used to achieve a specific SDG target [15] suggested practical guidelines for local stakeholders, entailing four initial steps for mainstreaming the SDGs: (i) developing a participatory process; (ii) setting the local agenda; (iii) planning for implementation; and (iv) monitoring and evaluation. To achieve policy coherence local authorities can link different development plans to the SDGs or systematically align local action and policies with the SDGs and address all local action with a development element [16].
2.2Stakeholder engagement
The 2030 Agenda for Sustainable Development recognizes that no actor can achieve the scale and ambition of the SDGs. Therefore, it requires wide stakeholder engagement, including civil society, the private sector, academia, philanthropic organizations, research foundations and technical experts [17]. Stakeholder engagement calls for the active engagement of all partners in providing inputs to problemsolving and decisionmaking. It also entails enabling public oversight, transparency and accountability of local governments. For example, the use of social media platforms can increase the active participation of civic society and citizens and therefore lead to design of new polices and the delivery of public services by local governments. Similarly, private sector involvement in public infrastructure projects through public-private partnerships, in addition to providing the necessary financial resources for the project, can also reshape business practices and promote inclusive development [17]. However, changes in legal and regulatory environment are needed to enable this collaboration. In addition, the private sector needs to look beyond financial results and incorporate other metrics to measure social impact which requires the support of local governments.
The notion of equal participation must also be factored in any discussion on the implementation of the SDGs at the local level. Therefore, a stronger presence of women in local government will ensure more effective and full participation politically, socially and economically, which will have a major and very positive impact on local policy-making and decision-making In addition, young people will inherit the development challenges. Youth participation also reflects local diversity in terms of socio-economic, religious, ethnic, cultural and gender dimensions of local development. There is potential for including youth in the political process through different engagements, such as lobbying and activism rather than elections [10].
2.3Decentralization
The level of political and fiscal decentralization is crucial in achieving an enabling institutional environment that strengthens the ability of local governments to set priorities in line with the SDGs. However, many decentralization attempts have been afflicted by insufficient management and administrative capacity. An enabling environment should constitute the basis for the devolution of power and enable local government to discharge its obligations, efficiently and effectively. Consideration must be given to fiscal transfer instruments ensuring that local planning and budgeting feed into the national budgeting and planning process [18].
In addition, fully integrating the SDGs at local levels requires subnational governments to have the public sector capacity to engage in planning, monitoring and evaluating of SDG progress. Improving the quality of local human resources, management and technical capacities of local governments to mobilize local resources, deliver services and engage citizens in planning and decision-making is crucial in promoting ownership and facilitating sustainable development and ultimately, enhancing service delivery at the local level.
2.4Data ecosystem
In addition to investing in human resources’ capacity, strengthening statistical capacities is key to effective SDG localization. Capacity to collect, monitor and analyse data on various indicators are critical elements of successful SDG implementation. In addition to methodological difficulties in measuring some of the SDG indicators, there are also capacity challenges. While at the national level, national statistical offices are usually responsible for collecting data, at the local level, the management systems either do not exist or are not suitable for using quantitative indicators to measure progress. Therefore, significant investment in data management systems is needed accompanied by investments in capacity to analyse and share data among different levels of governments. This would allow local governments to monitor progress on the SDGs and become more transparent and accountable. This will require not only significant financial outlays, but also a strong cooperation between different stakeholders such as local and national governments, NGOs, civil society and the private sector. Having accurate statistics is a necessary condition to collect, monitor and evaluate SDG indicators. In addition, it is also critical that different stakeholders can provide inputs when adapting indicators to the local level. Furthermore, to encourage a wider participation it is necessary that information collected at the local level is included in nationallevel reporting and in SDG progress reports.
2.5Financing development
In addition to statistical capacity and broad stakeholder engagement, local governments need to have the financial capacity to take on increasing responsibilities. Even before the COVID-19 pandemic, local governments faced challenges in meeting recurrent expenditure and make long-term investments in support of sustainable and inclusive development [19]. While greater decentralization has led to increasing responsibilities of local governments, in many cases an increase in budgets has not followed suit. A recent survey by the Emergency Governance Initiative encompassing 33 territories from 22 countries across all continents found that in addition to having insufficient budgets, many local governments have been grappling with an overreliance on central governments, lack of access to new sources of revenue, limited autonomy to change/introduce taxes, and low levels of taxpayer compliance. The ongoing pandemic has exacerbated some of these challenges because local governments have had to increase the budgets of their social, health and public services and to support local businesses that were unable to trade due to the pandemic. Therefore, it is to be expected that infrastructure development and interventions to promote gender equality and investment in education will be postponed.
Given the limited fiscal capacity of local governments, the Financing for Development: Progress and Prospects 2018 report underscores the importance of: (i) the strengthening of national and subnational institutional frameworks to include formal and clear assignment of functions and revenue generation responsibility; (ii) transparent and accountable financial management; (iii) incentives to function effectively; and (iv) predictable and flexible intergovernmental transfers. This would allow local governments to respond to local needs better.
Table 1
Potential sources of finance for achieving SDGs
| Instrument | Description |
|---|---|
| Blended finance | Concessional public finance blended with non-concessional public aid or private philanthropic |
| funds | |
| Green and blue bonds | Bonds where proceeds are used for environmentally friendly investments |
| Islamic financing | Islamic bonds such as sukuk, which are asset-backed risk/reward-sharing contracts |
| Guarantee schemes for development | A policy that insures governments or other investors against investment risks in development |
| Diaspora financing schemes | Bonds, investments or foreign direct investments that are raised from the diaspora for |
| development funding | |
| Impact investment | Investments that aim to create positive social or environmental returns in addition to a financial |
| return for investors | |
| Crowdfunding | Funding a project or venture by raising monetary contributions from a large number of people |
| Social impact bonds | A pay for success scheme where investors are repaid by donors/government if the desired social |
| impact of the financed project is achieved | |
| Countercyclical loan contracts | A loan where debt service automatically falls when a major shock occurs |
| Weather and disaster insurance schemes | Products that provide pay-outs to sovereigns or farmers when a major weather disaster strikes |
Source: Reedy (2018); UNDP (2018).
To facilitate the attainment of the SDGs at local levels local governments should be able to raise revenues through tax collection and from new sources outlined in Table 1 that complement traditional forms of financing and can create new partnerships that can leverage the expertise for achievement of the SDGs [19]. The new forms of financing are especially important for developing countries and subnational governments whose local budgets are being affected by the pandemic. In addition, the availability of new forms of financing can enable local governments to take an integrated approach to development and strengthen multistakeholder engagement [17].
To effectively finance development, the budgeting process at the national and local levels needs to be aligned with development priorities. Preferably, the SDGs are incorporated within local government budgets. Further, public expenditure capacities need to improve via financial and technical support provided by national governments or international organizations. The reliability and timeliness of fiscal transfers must be increased to support localization of SDGs, especially in the most remote areas or regions affected by natural disaster or conflicts. There should be mechanisms in place that determine allocations to prevent inequality in the access and distribution of funds from national to local governments.
While COVID-19 poses a challenge, it also provides an opportunity to re-emphasize the importance of the SDGs and to put in place monitoring and evaluation procedures that would allow to identify which SDGs have been hit the hardest and therefore need support. Recovery thus represents an opportunity to redirect development that relies on principles put forward in the 2030 Agenda.
3.Data and models for SDG localization
Reliable and disaggregated data are imperative at the national and local levels to monitor, track, evaluate and report on SDG indicators. There needs to be a balance between adopting indicators to fit the local context, and universalizing and harmonizing indicators for comparability of data within and between countries. Proxy indicators can provide a solution and can help to measure the achievement of SDG targets at the local level.
Two types of data are required to monitor and measure the impact of local SDG investments. This section describes the types of data that can be used to measure the SDGs at the local level, including primary and secondary data through surveys and local government actions.
3.1SDG measurement at the local level
The core principle of the SDGs to leave no one behind requires disaggregated data (by age group, ethnicity, income group, and at different geographical levels), particularly for local development planning and programme implementation. Since most of the SDG indicators are not routinely collected within the national statistical system, local information could be obtained either through primary data collection or from existing large-scale (household) surveys. Also, ideally, panel data would be available to monitor progress over time. However, until such data ecosystems are in place, progress on the SDGs is measured by representative household surveys.
Primary data collection would have the advantage of permitting more tailored questionnaires that focus particularly on the measurement of SDG indicators. When secondary data sets are used, the appropriateness depends on the purpose of the statistical analysis. Should the aim be to learn about the effects of local spending on local SDG progress within a single country, then focus should be placed on the various data sets available within the respective country. In contrast, to estimate impacts for several countries, there is preference for household surveys conducted in several countries with the same or very similar methodology to permit cross-country comparability of the estimates. Wellknown examples of these multipurpose large-scale household surveys are Demographic and Health Surveys (DHS), Multiple Indicator Cluster Surveys (MICS), Living Standard Measurement Surveys (LSMS) and others which have been implemented in many countries and several points in time with similar methodology. However, current general purpose national household surveys have shortcomings: they have not been tailored particularly to the SDG indicators and would therefore also introduce measurement error. These surveys have often been conducted only very infrequently, which precludes timely measurement of progress or lack of progress in certain sectors. The household survey should ideally be repeated every two or three years to measure progress more quickly.
In addition, the empirical analysis requires data on all villages, counties or districts where outcome data is available for (at least) two points in time. Since datasets such as MICS, LSMS and DHS have been developed as multi-indicator nationally representative surveys, they will not include every county. In addition, for each new wave, these surveys normally draw new samples of enumeration areas, i.e. they do not target the same counties/districts. From each wave of MICS, LSMS and DHS a data set with countylevel averages of outcome variables would thus have to be constructed.
Nationally representative data sets are usually not geared towards very precise measurement at the local level. One solution is to apply techniques such as small area estimation techniques to improve the measurement of SDG indicators at the local level. The technique improves the level of granularity without necessarily collecting additional data in the field. This methodology integrates existing surveys with other auxiliary datasets such as census or administrative data and capitalizes on the strengths of each source. Survey data allow for the collection of detailed information on household characteristics but not the collection of information from every unit of its target population. In contrast, census data may completely enumerate all units within the target population but may lack detailed information about the characteristics of the unit. Small area estimation therefore yields estimates that are reliable even at granular geographical locations (municipality) for which the survey was not originally designed. There are two approaches used to generate small area estimates: a ‘direct approach’, which uses observations for the small area gathered via nationwide survey; and an ‘indirect approach’, which uses observations and auxiliary data in mathematical and statistical models. These models provide the functional relationship between the data obtained directly from the nationwide survey and a set of auxiliary data.
Small-area estimation techniques could also combine data from other sources in order to increase precision of local SDG indicators. For instance, one might have detailed data sets on sales of contraceptives for each pharmacy in the country and combine this with DHS data on family planning to make better model-based local prediction for family planning. Alternatively, one might have very detailed data on violence reported to the police and combine with DHS data for better local predictions on gender-related violence.
Another alternative is to use phone surveys that could also support such small area estimations, e.g. higher-frequency intermittent phone surveys. Phone surveys alone, however, are prone to attrition and non-response, as well as selection bias due to incomplete coverage. In addition, SDG indicators required face-to-face interviews due to their complex definitions.
However, it is possible to consider combining phone surveys with the household survey so that the face-to-face household survey would be considered the error-free data and the phone survey the response- and selection-bias affected sample. At each point of time when both surveys are conducted, correction factors are computed and applied to the phone survey data so that the corrected phone survey data would produce the same numbers. In these points of time, when only the phone surveys are conducted, the correction factors are applied. The phone survey could be conducted every six months to obtain updated measurements at higher frequency.
3.2Local government data
Although household surveys focus on outcome variables in terms of the SDGs, they do not include where investments have taken place. Therefore, existing secondary data on a community or district level on local development investments are required.
Ideally, the number of investments dedicated to development by various social sectors (education, health, etc.) for each county/district would be measured Investments into development could stem from three sources:
• private investments
• public investments
• international investments, e.g. UNDP funds or other United Nations agencies
Most likely, data on private investments by county will not exist. Therefore, the focus is on public investments at the district/provincial level, from national budgets and/or from international development assistance sources.
Although nationallevel data have been harmonized according to the System of National Accounts and have become widely available for empirical analysis, this is less the case with local government expenditure. If at all, public figures were collected for the official statistical reporting at the provincial level, but often not at the district or municipality level.
It would be ideal to know the amount of investment for each county by various social sectors (education, health, etc.). It would be expected that investments into for example education are closely aligned with SDG targets related to education. In recent years, there have been efforts in various countries to improve the accuracy of sub-nationallevel data.
However, local government expenditures are not typically aligned with the national systems of accounts and public financial classification system. For example, if the public financial system has an account number for funding for education, which includes primary, secondary and university funding, then local government spending would capture total education funding and it would not be possible to separate investments into schools from investments in university education. However, it would be difficult to compare such analyses between countries it different countries use different classification schemes for public funds.
In addition, it would be desirable to capture funds that actually have been disbursed (i.e. actual expenditures) in a given year and not only allocated to a particular project; i.e. for large infrastructure investments, the public budget usually allocates total required funds for planning but disbursement may be several years later Availability of such data is countryspecific. There are two types of public budgets: ex ante planned public budgets for the next fiscal year, i.e. the budget approved by parliament for spending by the government. These may be public, but are only planning figures, i.e. maximum budget ceilings for spending and public debt. On the other hand, realized spending would be more appropriate, but rarely available. Given these caveats, local government spending may have to be aggregated over several years.
One of the major requirements for local government expenditure is similar to the one discussed above for SDG indictors at the local level and refers to geographical distribution. The measurement of local government spending for the geographic unit would require that spending data can be precisely allocated to each unit. In addition to detailed levels of local government spending data that are separated according to categories of spending, data would be needed on actual (not planned) national government expenditure corresponding to different geographical units. For example, if investment in hospitals in a specific county/municipality falls under national or federal government spending, ideally these expenditure/investments made at lower levels should add up to total national government investments. These data would allow a more robust analysis on how government expenditure contributes to the 2030 Agenda for Sustainable Development at the local level. This is because it would minimize the measurement errors and would allow policymakers to monitor the progress against different indicators and when necessary, adjust government expenditure to areas where progress is not sufficient or not in line with national targets.
3.3Models to evaluate SDG localization
In addition to having appropriate and reliable data disaggregated at local level, for example, the district, county and village level, it is necessary to carefully choose the appropriate modelling approach that allows to identify the causal effects as opposed to pure correlations or predictive relationships. In the absence of controlled intervention, analysis will mostly rely on secondary data available from household surveys with the same or very similar methodology to permit cross-country comparability of the estimates. In addition, using these surveys limits the number of SDG indicators that can be obtained because they are not designed for precisely measuring.
The above caveats limit the type of econometric models that can be used to evaluate the impact of local government expenditure on SDG outcomes. The baseline econometric equation is as following:
Where
While this model is simple to estimate, it presents various issues. First, it is highly plausible that some other factors may be driving local government expenditure and affecting SDG outcomes at the same time. Therefore, this would lead to omitted variable bias, thus violating the statistical properties of the estimator. Second, measurement would lead to biased and less statistically precise estimates. The extent of bias depends on the quality of data used to measure local government expenditure as well as SDG outcomes. As mentioned, both the construction of SDG indicators and local government expenditure require sufficient sample size, i.e. the number of geographical districts available to estimate the model.
While it is generically unknown which variables could be confounders, as a minimum there may be concern that past values of SDG indicators could have affected spending patterns, while expecting the past SDG situation to be correlated with the future SDG situation. Therefore, the previous model is augmented by including past values of SDG outcomes and other control variables that may influence current SDG outcome.
In the case study described in more detail in Section 5 data were used from two waves of the Demographic and Health Surveys 2017 and 2013, which allowed to control for past values of SDG outcomes and add control variables from 2013. The estimated model takes the following form:
where
The choice between using aggregate data and more detailed disaggregation of expenditures by sector is driven by how well the data source can be used to construct accurate SDG outcomes and local government expenditure data as well as the sample size. Having a small number of geographical units and estimating a model with several categories of local government expenditure or disentangling them according to temporal variation would result in less precise estimates. Summing up the local expenditures over several years helps to average out part of the measurement error.
In addition to linear models, it is possible to incorporate non-linearities. However, sample size might be too small to permit extensive specification modelling together with control variable selection. Controlling for confounders is a key priority from a statistical point of view.
If panel data is accessible, then the estimation of panel data models and difference in difference (DiD) models could shed more light on the impact of local government expenditure on SDG outcomes in specific geographical units. However these models are only feasible when both current and past SDG outcomes are measured in the same way. This requires that construction of SDG indicators over time is based on the same questionnaire, interviewing technique, survey methodology and sampling approach. The basic structure of these models consists in allowing that geographical units with different levels of local spending may differ in some unobserved way but that this difference is constant over time. In addition, if in time considerable effort has been made to collect better data on local government expenditure, there may be a limitation to using fixed effects approach for panel data. In these cases, it is possible to resort to a controlling-for-confounders approach described above.
Finally, with respect to observational data, the previous models examined the relationship between local government spending and SDG outcomes in the same geographical unit, e.g. district, county or village. The analysis could be extended to analyse whether there are externalities/spillovers to adjacent geographic areas. Spatial econometric models can be added to learn about spillovers to neighbouring districts, e.g. whether investments in education in some districts also affect other districts.
4.What role does IE play in the process?
Going beyond a pure correlational or predictive analysis which is possible using linear regressions models requires primary data collection and rigorous evaluation of causal effects. An impact evaluation provides information on the casual effects of the intervention and includes a large variety of methods for causal attribution. Impact evaluation in the context of SDG localization can inform policymakers whether to continue, reorient or scale up the intervention in terms of government expenditure. As such, an impact evaluation not only provides information of what works but also answers normative questions on what is needed to make the intervention work. Thus, an impact evaluation for SDG localization aims to inform decisions about future interventions in terms of government expenditure, understand the effects on SDG indicators and link the findings to local and national government strategies.
In general, there are several design options that can be used to assess causal attribution, such as:
• experimental design in the form of a randomized control trial (RCT);
• quasi-experimental design, which uses control group to evaluate the effects of treatment by using matching or regression discontinuity design.
The RCT methodology resolves the concern over omitted variable bias (i.e. potential correlation between local expenditures and unobserved variables) through a controlled variation of local spending and is the preferred method for impact evaluation.
An RCT for SDG localization could be constructed in two ways:
• Local government expenditures are randomly set to low or high levels between different geographical units.
• Randomly allocate increases in local spending.
While the former approach may be difficult to implement in a complex political environment, the latter approach may be implementable if large additional funds for public expenditures were to become available and could be distributed across the country. These may apply in scenarios when large international aid flows enter a country and where a randomized allocation could be feasible. Large parts of development assistance are often implemented via targeted programmes in pilot districts, and such approaches could be embedded within a more rigorous evaluation framework. In such a scenario, it is possible to consider combining an impact evaluation of a large (international) development assistance programme with an analysis of the effects of local expenditures on SDG outcomes. Often, UNDP in cooperation with other donors initiates a large project in some of the domains of the SDGs. The overall funding of such a project is usually sizeable but insufficient to cover the entire country; hence, only a fraction of the geographical areas of the country, for example, counties or districts can only be covered.
For such a large investment project, consideration could be given to combining an impact evaluation of the project with household surveys that serve the dual purpose of permitting an impact evaluation and eliciting detailed information about SDG indicators at the local level.
Although impact evaluations allow to estimate the causal effects of development projects on specific outcome measures, they are narrower in scope. Surveys conducted as part of project impact evaluations are often not nationally representative since they are geared to allocate sample size in such way as to maximize statistical power for the estimation of treatment effects of the intervention. Rigorous impact evaluation projects often include three household surveys: baseline, midline and endline. Ideally, impact evaluations should employ an RCT design, to permit the most credible evaluation designs.
It is therefore possible to combine a systematic approach with nationally representative household survey data collection with impact evaluations of interventions and local government expenditure/investments into development. Embedding nationally representative household surveys with impact evaluations of large-scale development projects would allow for a more efficient allocation of resources and to learn more about the effectiveness of interventions while having a national SDG-progress-monitoring. This combination is only sensible, however, if the development project covers a large geographical area of the country so that the sampling areas of the nationally representative survey and the project areas have a large overlap. Naturally, a larger fraction of the overall sample would be allocated to the project areas than to the rest of the country and use survey weights to calculate nationally representative figures.
The impact evaluation would thus consist of two components. First, specific details of intervention implementation would be conducted through a randomized controlled trial approach. Second, one would also consider the local project in monetary terms, i.e. the amount of additional money spent in the local geographic area (in addition to the local government spending that would have occurred without the intervention). The treatment variable is thus the amount of money invested between the first survey and the current survey wave. This analysis would lump all programmes into a one-dimensional scale: money spent.
For this approach, the household samples serve as unifying instrument. Large-scale nationally representative multipurpose household surveys repeated every few years would serve simultaneously for country-wide measurement of SDG progress. In addition, they would be used to assess the progress through baseline and follow-up surveys for RCT impact evaluations and cross-country panel data econometric analysis for estimating the effects of district-wise development money on local SDG progress.
Table 2
SDG indicators based on DHS data
| Goal | Indicator | |
|---|---|---|
|
| Proportion of births attended by skilled health personnel. Under-five mortality rate. Proportion of women of reproductive age who have their need for family planning satisfied with modern methods. Adolescent birth rates per 1,000 women aged 15–19. | |
|
| Proportion of ever-partnered women and girls aged 15 years and older subject to physical, sexual or psychological violence by a current or former intimate partner in the previous 12 months. Proportion of women aged 20–24 who were married or in a union before age 18. Proportion of women aged 15–49 who make their own informed decisions regarding sexual relations, contraceptive use and reproductive health care. | |
|
| Proportion of population using safely managed drinking water services. Proportion of population using safely managed sanitation services and a hand-washing facility with soap and water. | |
|
| Proportion of population with access to electricity. Proportion of population with primary reliance on clean fuels and technology. |


The multipurpose household survey should thus cover many people to obtain representative data on SDG measurement and cover a large number of villages and enumeration areas in order to permit panel-data analysis using regional variation in development funding. A sample size of, for example, 500 to 1000 villages or enumeration areas would allow to exploit cross-sectional variation in development funds and allow for spatial econometrics in order to estimate spatial transmission patterns of development spending on neighbouring villages and towns. Clearly, in pursuing both goals, i.e. serving as a generalpurpose sample covering the entire country and as a baseline, midline and endline for the impact evaluation of the development projects the combined sample size needs to be larger than separate samples, since it requires some oversampling of the development project areas (and their control regions). This implies that the sample will need to cover each geographical area while having sufficient power for the targeted impact evaluation. Typical sample sizes of multipurpose household surveys have been about 15000 to 20000 households.
5.Pilot case study – Philippines
Recently, UNDP conducted a pilot study on SDG localization in the Philippines together with the Center for Evaluation Design (C4ED). The advantage of carrying out this analysis for the Phillipines rather than other countries is the availability of secondary data sets.
For the pilot study, two data sources were used for the pilot study:
• National Demographic and Health Surveys (NDHS) carried out by the Philippine Statistics Authority;
• Statements of Receipts and Expenditures (SRE) published by the Department of Finance’s Bureau of Local Government Finance.
These two data sources were used to approximate and measure SDG indicators at the local level and to identify local government expenditure at the provincial level.
5.1Identification and measurement of SDG indicators
The 2013 and 2017 NDHS for the Philippines were used to estimate SDG indicators or their proxies at the provincial level, including three special areas (Pateros, Isabela City and Cotabato City).
Both NDHS employed a stratified two-stage design. The Philippines is divided into 17 administrative regions. Each region is further divided into provinces, which are divided into cities, municipalities and barangays. Barangays are classified as either rural or urban.
The 2013 NDHS was stratified by region and each region was stratified by rural and urban barangays. This resulted in 34 strata, and the survey was designed to provide representative results at this level. Within each stratum, enumeration areas were implicitly stratified by province. In total, the 2013 NDHS included 14,804 household respondents and around 16,437 women respondents. This resulted in an average of 176 household respondents per sampled province. However, because provinces were only implicitly stratified, the number of household respondents per province varies widely. Ten percent of sampled provinces include fewer than 39 household respondents and one province only includes 16 household respondents. Two of the smallest provinces were not sampled (Batanes and Camiguin). There are no estimates for Davao Occidental since it became a separate province from Davao del Sur only after sampling for NDHS 2013 was completed.
In comparison, 2017 NDHS employed a much larger sample than 2013 NDHS (27,496 household respondents), and the sample was stratified across a much larger number of sampling domains. Each province (80 provinces plus the new province of Davao Occidental) constituted a domain as well as 33 highly urbanized cities and three special areas (Pateros, Isabela City, and Cotabato City). This resulted in 117 sampling domains.
For several provincial-level estimates, more than one sampling domain were combined. On average, each province included 316 household respondents with 90 percent of provinces including more than 255 household respondents. The province with the lowest number of household respondents included 116 household respondents.
The 2013 and 2017 NDHS allowed to estimate the number of SDGs provided in Table 2. Although, local level poverty indicators for SDGs are already available for many cities and municipalities in the Philippines, they represent a very small proportion of 231 indicators used to monior the progress towards sustainable development.
For this analysis, we focus on 13 SDG indicators, for which the estimates across 74 provinces are provided in Table 3.
Table 3
Summary statistics (mean values) for selected set of SDG indicators
| 2013 | |||||||||||||
|---|---|---|---|---|---|---|---|---|---|---|---|---|---|
| 3.1.2 | 3.2.1 | 3.7.1 | 3.7.2a | 3.7.2b | 5.2.1 | 5.3.1a | 5.3.1b | 5.6.1 | 6.1.1 | 6.1.2 | 7.1.1 | 7.1.2 | |
| Province name | |||||||||||||
| Abra | 77.7 | 0. | 51.6 | 0. | 109.09 | 12.8 | 20 | 0. | 81.8 | 100. | 93.5 | 90.6 | 15.8 |
| Agusan del norte | 64.1 | 0. | 55.0 | 0. | 86.5 | 25 | 10.1 | 0. | 87.7 | 100. | 96.6 | 89.7 | 21.2 |
| Agusan del sur | 37.9 | 0. | 59.6 | 0. | 102. | 15.9 | 27.8 | 2.81 | 93.4 | 84.9 | 96.5 | 73.3 | 1.28 |
| Akla | 71.4 | 0. | 51.5 | 0. | 69.8 | 22.5 | 12.4 | 6.21 | 92.9 | 89.0 | 94.0 | 83.7 | 7.16 |
| Alba | 76.4 | 0. | 37.5 | 0. | 23.7 | 18.1 | 5.23 | 0. | 92.3 | 94.6 | 83.5 | 91.4 | 22.9 |
| Antiqu | 25.9 | 0. | 44.4 | 0. | 0. | 0. | 0. | 0. | 92.3 | 96.5 | 94.3 | 75.3 | 5.63 |
| Apayao | 100. | 0. | 53.3 | 0. | 0. | 5.88 | 0. | 0. | 93.7 | 80 | 100. | 95.7 | 28.5 |
| Aurora | 83.3 | 0. | 40 | 0. | 44.1 | 40 | 20 | 0. | 94.7 | 96.6 | 95.2 | 72.1 | 40.1 |
| Basila | 16.3 | 0. | 28.5 | 0. | 26.8 | 10.2 | 30 | 0. | 75.4 | 76.3 | 16.2 | 20.8 | 1.62 |
| Bataan | 100. | 0. | 43.7 | 0. | 47.5 | 8.14 | 10.1 | 0. | 95.2 | 97.9 | 92.2 | 95.1 | 52.6 |
| Batangas | 78.3 | 0. | 45.7 | 0. | 51.1 | 7.71 | 16.5 | 2.13 | 95.6 | 98.7 | 99.3 | 97.6 | 51.8 |
| Bengue | 88.7 | 0. | 60.5 | 0. | 23.9 | 13.0 | 6.74 | 1.32 | 92.2 | 95.5 | 94.3 | 96.5 | 83.3 |
| Bilira | 100. | 0. | 40 | 0. | 0. | 25 | 100. | 100. | 64.9 | 94.7 | 1.75 | ||
| Boho | 96.4 | 0. | 43.9 | 0. | 67.1 | 29.3 | 15.9 | 0. | 91.3 | 98.2 | 93.9 | 94.2 | 4.86 |
| Bukidnon | 55.8 | 0. | 52.2 | 0. | 111. | 28.9 | 19.2 | 0. | 94.7 | 94.5 | 96.8 | 61.1 | 5.15 |
| Bulaca | 95.4 | 0. | 61.3 | 0. | 80.3 | 15.2 | 16.4 | 4.84 | 91.1 | 99.7 | 96.7 | 96.9 | 64.8 |
| Cagaya | 60.5 | 0. | 63.5 | 0. | 89.9 | 13.3 | 20.2 | 4.49 | 97.2 | 98.2 | 96.7 | 88.8 | 20.1 |
| Camarines nort | 62.2 | 0. | 40.8 | 0. | 36.3 | 22.0 | 7.64 | 0. | 94.6 | 92.4 | 86.9 | 94.9 | 14.9 |
| Camarines su | 60.3 | 0. | 15.4 | 0. | 75.6 | 18.8 | 17.6 | 0. | 93.6 | 96.7 | 86.1 | 85.7 | 14.8 |
| Capi | 77.4 | 0. | 52.2 | 0. | 61.9 | 23.4 | 5.56 | 0. | 93.8 | 95.8 | 93.8 | 91.6 | 3.82 |
| Catanduane | 87.5 | 0. | 25 | 0. | 163.27 | 11.1 | 16.6 | 0. | 100. | 100. | 93.4 | 83.2 | 20.3 |
| Cavite | 91.1 | 0. | 49.5 | 0. | 77.0 | 11.9 | 14.2 | 0. | 91.4 | 98.9 | 98.0 | 97.8 | 74.2 |
| Davao del nort | 74.4 | 0. | 55.3 | 0. | 51.6 | 20.8 | 25.0 | 6.25 | 93.2 | 98.4 | 96.8 | 84.9 | 19.1 |
| Davao del su | 72.9 | 0. | 56.2 | 11.9 | 63.6 | 17.0 | 21.9 | 5. | 90.4 | 91.3 | 90.0 | 80.2 | 34.1 |
| Davao oriental | 50 | 0. | 42 | 47.4 | 25.9 | 23.8 | 23.0 | 7.69 | 95.5 | 83.6 | 87.5 | 65.5 | 6.31 |
| Dinagat island | 91.6 | 0. | 55.5 | 0. | 0. | 44.4 | 100. | 0. | 100. | 85.8 | 100. | 92.9 | 5.88 |
| Eastern sama | 93.3 | 0. | 45.4 | 0. | 0. | 12.1 | 9.09 | 0. | 94.5 | 94.1 | 94.7 | 94.4 | 28.3 |
| Guimaras | 50 | 0. | 60 | 0. | 150.94 | 0. | 100. | 74.7 | 85.7 | 75.8 | 5.49 | ||
| Ifugao | 72 | 0. | 63.3 | 0. | 26.7 | 6.25 | 0. | 0. | 97.2 | 94.6 | 98.5 | 82.3 | 19.6 |
| Ilocos norte | 96.8 | 0. | 32.3 | 0. | 48.8 | 15.9 | 14.2 | 0. | 95.6 | 94.5 | 94.2 | 97.0 | 39.5 |
| Ilocos sur | 91.0 | 0. | 50.1 | 0. | 72.7 | 21.6 | 21.6 | 0. | 97.2 | 99.3 | 95.5 | 97.0 | 37.2 |
| Iloilo | 69.3 | 0. | 37.3 | 0. | 49.6 | 6.57 | 5.88 | 0. | 94.5 | 92.7 | 95.4 | 90.3 | 11.9 |
| Isabel | 71.0 | 0. | 74.7 | 0. | 66.9 | 29.4 | 15.4 | 0. | 95.6 | 92.2 | 92.6 | 85.5 | 31.2 |
| Kaling | 80.7 | 0. | 51.8 | 0. | 95.6 | 11.1 | 0. | 0. | 96.8 | 97.3 | 73.7 | 88.8 | 6.06 |
| La union | 93.0 | 0. | 70.2 | 0. | 50 | 3.92 | 33.3 | 0. | 96.4 | 93.9 | 97.3 | 95.3 | 16.5 |
| Laguna | 89.6 | 0. | 47.3 | 0. | 49.7 | 12 | 14.4 | 0. | 97.1 | 99 | 99.2 | 94.7 | 55.7 |
| Lanao del nort | 56.4 | 0. | 46.8 | 0. | 59.0 | 19.8 | 16.6 | 0. | 87.4 | 98.9 | 85.5 | 68.8 | 10.5 |
| Lanao del su | 27.3 | 0. | 15.4 | 0. | 75.1 | 4.29 | 19.5 | 4.35 | 95.6 | 50.9 | 35.0 | 89.9 | 11.3 |
| Leyt | 76.3 | 0. | 52.0 | 0. | 37.0 | 18.0 | 10.5 | 0. | 94.2 | 98.7 | 85.3 | 88.6 | 23.0 |
| Maguindana | 30.3 | 0. | 45.3 | 0. | 63.4 | 20.7 | 31.9 | 11.2 | 90.3 | 68.8 | 62.9 | 37.4 | 4. |
| Marinduque | 61.1 | 0. | 27.2 | 0. | 114.29 | 20.6 | 42.8 | 14.2 | 89.2 | 97.9 | 85.3 | 79.5 | 8. |
| Masbat | 49.6 | 0. | 35.7 | 0. | 97 | 16.0 | 14.3 | 7.07 | 89.9 | 81.6 | 70.8 | 62.8 | 3.52 |
| Misamis occidental | 66.6 | 0. | 44.8 | 0. | 35.6 | 16.6 | 0. | 0. | 94.7 | 88.2 | 98.0 | 82.0 | 11.7 |
| Misamis oriental | 81.8 | 0. | 62.4 | 0. | 41.5 | 31.0 | 11.2 | 1. | 93.2 | 99.3 | 96.7 | 94.1 | 25.8 |
| Mountain provinc | 87.4 | 0. | 62.1 | 0. | 131.99 | 2.96 | 10.0 | 0. | 81.9 | 100. | 83.5 | 98.3 | 51.5 |
| Negros occidenta | 70.4 | 0. | 44.9 | 12.8 | 59.2 | 22.2 | 20.9 | 3.22 | 91.8 | 87.4 | 71.8 | 76.2 | 8.76 |
| Negros orienta | 66.0 | 0. | 49.0 | 0. | 101.54 | 15.7 | 19.9 | 4.99 | 85.4 | 83.5 | 72.8 | 63.6 | 4.88 |
| Northern samar | 38.7 | 0. | 45.2 | 0. | 109.09 | 11.1 | 33.3 | 8.33 | 87.9 | 97.7 | 82.9 | 88.2 | 3.98 |
| Nueva ecij | 79.9 | 0. | 68.4 | 16.3 | 53.1 | 15.2 | 13.3 | 0. | 98.2 | 99.6 | 99.0 | 95.4 | 28.2 |
| Nueva vizcay | 70.5 | 0. | 56.1 | 0. | 53.8 | 27.0 | 7.83 | 0. | 85.3 | 80.8 | 89.0 | 76.9 | 40.9 |
| Occidental mindoro | 22.8 | 0. | 41.5 | 0. | 162.77 | 9.46 | 41.0 | 8.13 | 94.4 | 88.8 | 73.9 | 65.8 | 3.08 |
| Oriental mindoro | 57.0 | 0. | 60.6 | 0. | 33.1 | 29.7 | 7.68 | 0. | 92.6 | 97.9 | 89.3 | 90.8 | 11.3 |
| Palawa | 31.6 | 0. | 64 | 0. | 58.2 | 9.26 | 27.7 | 10.4 | 97.3 | 68.5 | 78.5 | 73.0 | 6.79 |
| Pampanga | 100. | 0. | 61.7 | 0. | 60.1 | 4.62 | 8.35 | 2.16 | 86.9 | 99.8 | 95.2 | 99.0 | 78.4 |
| Pangasinan | 87.8 | 0. | 49.6 | 0. | 92.5 | 17.6 | 7.74 | 0. | 98.1 | 99.0 | 98.2 | 89.7 | 21 |
| Quezon | 78.6 | 0. | 56.8 | 0. | 44.2 | 5. | 8.51 | 0. | 85.8 | 96.3 | 87.8 | 91.5 | 37.5 |
| Quirin | 40 | 0. | 82.7 | 64.1 | 33.9 | 15.3 | 33.3 | 0. | 97.1 | 41.3 | 90.0 | 76.2 | 1.29 |
| Riza | 82.2 | 0. | 47.2 | 0. | 56.9 | 11.8 | 4.01 | 0. | 92.2 | 100. | 100. | 94.1 | 68.4 |
|
Table 3, continued | |||||||||||||
| 2013 | |||||||||||||
| 3.1.2 | 3.2.1 | 3.7.1 | 3.7.2a | 3.7.2b | 5.2.1 | 5.3.1a | 5.3.1b | 5.6.1 | 6.1.1 | 6.1.2 | 7.1.1 | 7.1.2 | |
| Romblo | 67.7 | 0. | 52 | 0. | 33.3 | 27.2 | 20 | 0. | 90.3 | 82.3 | 78.5 | 74.8 | 3.42 |
| Sarangan | 55.5 | 0. | 55.5 | 0. | 23.5 | 26.8 | 11.1 | 11.1 | 93.3 | 98.4 | 98.1 | 90.8 | 3.35 |
| Siquijor | 57.1 | 0. | 22.2 | 0. | 0. | 10 | 0. | 0. | 80 | 77.3 | 90.6 | 86.6 | 0. |
| Sorsogon | 77.1 | 0. | 34.0 | 0. | 36.4 | 10.5 | 18.1 | 0. | 96.4 | 95.0 | 79.1 | 85.0 | 6.13 |
| South cotabato | 66.3 | 0. | 62.2 | 0. | 68.1 | 22.6 | 22.4 | 3.45 | 90.8 | 97.6 | 95.7 | 83.5 | 12.5 |
| Southern leyte | 96 | 0. | 50 | 0. | 89.7 | 18.1 | 0. | 0. | 91.6 | 100. | 99.3 | 90.7 | 13.2 |
| Sultan kudarat | 47.0 | 0. | 62.6 | 0. | 56.7 | 9.46 | 37.5 | 6.27 | 88.2 | 80.7 | 75.0 | 60.1 | 1.42 |
| Sulu | 5.26 | 0. | 21.3 | 0. | 45.0 | 1. | 25.7 | 3.21 | 92.4 | 76.4 | 26.0 | 41.3 | 2.82 |
| Surigao del nort | 80.0 | 0. | 62.0 | 0. | 55.4 | 24.1 | 20.7 | 0. | 92.0 | 95.9 | 91.8 | 93.9 | 19.3 |
| Surigao del su | 76.9 | 0. | 48.4 | 0. | 105.39 | 19.1 | 22.2 | 3.69 | 84.8 | 89.5 | 89.9 | 79.9 | 7.56 |
| Tarlac | 72.2 | 0. | 45.3 | 0. | 69.7 | 10.7 | 33.2 | 3. | 94.7 | 98.8 | 93.8 | 88.1 | 26.8 |
| Tawi-taw | 0. | 0. | 9.77 | 0. | 25.7 | 2.69 | 41.6 | 0. | 97.7 | 82.5 | 15.7 | 48.4 | 0. |
| Zambales | 92.3 | 0. | 59.2 | 0. | 60.0 | 19.7 | 22.0 | 11.0 | 100. | 97.1 | 98.3 | 94.8 | 52.8 |
| Zamboanga del nort | 57.0 | 0. | 54.1 | 0. | 43.7 | 22.6 | 15.3 | 2.56 | 89.4 | 85.4 | 85.8 | 75.6 | 5.37 |
| Zamboanga del su | 52.0 | 0. | 52.2 | 0. | 32.6 | 17.9 | 18.3 | 1.03 | 87.5 | 93.5 | 83.6 | 77.2 | 12.1 |
| Zamboanga sibuga | 43.6 | 0. | 55.9 | 0. | 82.7 | 19.4 | 9.52 | 0. | 96.2 | 85.7 | 95.2 | 84.4 | 7. |
| 2017 | |||||||||||||
| 3.1.2 | 3.2.1 | 3.7.1 | 3.7.2a | 3.7.2b | 5.2.1 | 5.3.1a | 5.3.1b | 5.6.1 | 6.1.1 | 6.1.2 | 7.1.1 | 7.1.2 | |
| Province name | |||||||||||||
| Abra | 94.3 | 0. | 63.3 | 24.9 | 15.1 | 11.2 | 28.7 | 4.96 | 91.3 | 95.1 | 98.7 | 94.1 | 23.1 |
| Agusan del norte | 89.9 | 0. | 62.0 | 0. | 42.4 | 37.5 | 22.5 | 3.58 | 97.5 | 97.5 | 96.8 | 92.1 | 30.6 |
| Agusan del sur | 62.0 | 0. | 75.5 | 0. | 70.3 | 47.2 | 41.5 | 3.96 | 89.0 | 92.6 | 94.7 | 76.6 | 9.86 |
| Akla | 81.6 | 0. | 53.0 | 0. | 13.1 | 6.99 | 11 | 2.18 | 86.2 | 97.1 | 94.2 | 99.1 | 21.0 |
| Alba | 90.8 | 0. | 39.0 | 0. | 40.3 | 13.8 | 17.3 | 0. | 94.8 | 92.7 | 89.7 | 88.4 | 28.1 |
| Antiqu | 79.5 | 0. | 54.3 | 0. | 50.5 | 21.5 | 13.5 | 0. | 92.0 | 94.2 | 90.0 | 92.8 | 7.03 |
| Apayao | 84.7 | 0. | 82.6 | 0. | 65.2 | 22.2 | 4.86 | 0. | 84.9 | 92.1 | 88.9 | 82.3 | 16.8 |
| Aurora | 62.2 | 0. | 52.6 | 0. | 67.0 | 10.9 | 24.9 | 2.51 | 97.6 | 99.8 | 99.8 | 94.2 | 33.4 |
| Basila | 29.5 | 0. | 41.6 | 0. | 73.4 | 8.28 | 25.8 | 4.06 | 99.1 | 80.6 | 57.0 | 80.3 | 3. |
| Bataan | 96.6 | 0. | 54.0 | 0. | 70.9 | 21.6 | 12.4 | 3.09 | 99.1 | 100. | 94.0 | 94.7 | 76.5 |
| Batangas | 87.4 | 0. | 55.0 | 0. | 47.9 | 18.0 | 9. | 0. | 97.5 | 98.9 | 98.5 | 98.2 | 59.2 |
| Bengue | 97.3 | 0. | 60.0 | 10.3 | 18.2 | 4.06 | 3.58 | 1. | 92 | 96.1 | 96.1 | 98.3 | 93.8 |
| Bilira | 97.6 | 0. | 52.7 | 0. | 40.5 | 36.0 | 14.7 | 3.99 | 96.3 | 99.4 | 92.5 | 98.1 | 19.7 |
| Boho | 95.1 | 0. | 51.8 | 0. | 68.2 | 28.4 | 6.97 | 2. | 88.3 | 98.3 | 96.0 | 94 | 17.5 |
| Bukidnon | 74.3 | 0. | 65.5 | 0. | 104.69 | 14.1 | 30.3 | 3.46 | 97.5 | 97.4 | 94.2 | 79.6 | 19.5 |
| Bulaca | 95.2 | 0. | 51.2 | 0. | 46.5 | 6.41 | 5.87 | 0. | 97.4 | 100. | 97.6 | 97.3 | 87.3 |
| Cagaya | 83.7 | 0. | 73.8 | 0. | 17.6 | 2.73 | 30.7 | 2.99 | 94.6 | 99.3 | 99.3 | 95.0 | 23.3 |
| Camarines nort | 76.7 | 0. | 51.6 | 0. | 31.0 | 34.4 | 36.9 | 3.93 | 94.0 | 96.7 | 96.6 | 94.8 | 25.3 |
| Camarines su | 80.9 | 0. | 35.8 | 0. | 24 | 29.5 | 9.92 | 0. | 95.0 | 99.3 | 95.0 | 91.6 | 30.8 |
| Capi | 79.2 | 0. | 74.0 | 0. | 57.6 | 18.9 | 18.7 | 3.07 | 93.2 | 95.0 | 99.8 | 90.3 | 14.0 |
| Catanduane | 91.4 | 0. | 47.1 | 0. | 53.5 | 23.8 | 17.8 | 0. | 91.6 | 88.8 | 97.8 | 96.2 | 24.3 |
| Cavite | 93.3 | 0. | 42.4 | 0. | 34.6 | 4. | 13.5 | 0. | 95.2 | 100. | 98.2 | 99.4 | 90.9 |
| Davao del nort | 96.4 | 0. | 63.8 | 0. | 45.9 | 16.9 | 23.7 | 4.53 | 82.0 | 98.9 | 99.4 | 94.1 | 45.3 |
| Davao del su | 82.4 | 0. | 57.1 | 0. | 80.0 | 22.1 | 21.7 | 5.84 | 81.7 | 97.8 | 91.9 | 90.7 | 35.3 |
| Davao oriental | 75.2 | 0. | 70.8 | 0. | 92.1 | 13.6 | 22.6 | 4. | 97.6 | 96.2 | 95.9 | 89.9 | 15.3 |
| Dinagat island | 77.2 | 0. | 65.7 | 0. | 43.1 | 48.2 | 33.7 | 0. | 92.9 | 90.1 | 92.1 | 93.5 | 20.8 |
| Eastern sama | 85.6 | 0. | 47.6 | 0. | 58.6 | 20.4 | 17.3 | 1.37 | 97.1 | 99.1 | 96.0 | 97.4 | 23.8 |
| Guimaras | 95.5 | 0. | 63.5 | 0. | 20.3 | 4.99 | 18.1 | 3.35 | 92.9 | 96.5 | 95.8 | 92.2 | 6. |
| Ifugao | 80.3 | 0. | 69.5 | 0. | 46.3 | 2.51 | 17.2 | 0. | 53.5 | 90.1 | 87.0 | 98.2 | 28.4 |
| Ilocos norte | 99.0 | 0. | 60.9 | 0. | 44.6 | 9.86 | 10.1 | 0. | 96.8 | 98.7 | 100. | 98.6 | 60.0 |
| Ilocos sur | 100. | 0. | 63.7 | 0. | 30.7 | 7.67 | 10.1 | 1.45 | 99.5 | 100. | 99.1 | 99.2 | 52.1 |
| Iloilo | 93.7 | 0. | 55.5 | 0. | 30.2 | 18.1 | 11.9 | 0. | 95.5 | 97.8 | 96.0 | 93.5 | 12.5 |
| Isabel | 96.4 | 0. | 76.2 | 0. | 55.7 | 17.3 | 24.8 | 0. | 96.5 | 90.1 | 95.9 | 98.3 | 39.0 |
| Kaling | 87.5 | 0. | 64.2 | 0. | 33.2 | 4.79 | 16.7 | 3.09 | 96.4 | 98.5 | 85.5 | 93.4 | 45.6 |
| La union | 98.2 | 0. | 54.4 | 0. | 110. | 35.4 | 15.4 | 1.61 | 91.0 | 95.8 | 99.1 | 94.7 | 49.5 |
| Laguna | 88.0 | 0. | 49.1 | 0. | 26.0 | 9.88 | 15.5 | 3.29 | 97.9 | 100. | 99.4 | 95.5 | 80.7 |
| Lanao del nort | 63.7 | 0. | 50.8 | 0. | 97.6 | 6.76 | 31.5 | 6.05 | 97.5 | 88.5 | 77.5 | 83.9 | 22.5 |
| Lanao del su | 39.0 | 0. | 38.6 | 0. | 83.4 | 0. | 20.4 | 3.99 | 94.8 | 76.6 | 39.6 | 95.6 | 7.49 |
| Leyt | 97.8 | 0. | 60.3 | 0. | 56.1 | 22.9 | 25.0 | 6.64 | 89.9 | 96.7 | 93.3 | 92.7 | 31.6 |
| Maguindana | 34.6 | 0. | 41.8 | 0. | 52.0 | 11.4 | 17.3 | 1.53 | 74.3 | 80.4 | 61.9 | 81.3 | 4.08 |
|
Table 3, continued | |||||||||||||
|---|---|---|---|---|---|---|---|---|---|---|---|---|---|
| 2017 | |||||||||||||
| 3.1.2 | 3.2.1 | 3.7.1 | 3.7.2a | 3.7.2b | 5.2.1 | 5.3.1a | 5.3.1b | 5.6.1 | 6.1.1 | 6.1.2 | 7.1.1 | 7.1.2 | |
| Marinduque | 82.7 | 0. | 40.8 | 0. | 26.2 | 13.9 | 7.81 | 0. | 97.4 | 98.7 | 92.9 | 90.6 | 29.6 |
| Masbat | 76.8 | 0. | 58.2 | 0. | 38.2 | 18.2 | 39.0 | 0. | 93.8 | 74.8 | 69.4 | 71.0 | 6.26 |
| Misamis occidental | 74.3 | 0. | 63 | 0. | 64.9 | 16.9 | 23.1 | 6.86 | 96.8 | 97.6 | 94.6 | 87.1 | 15.4 |
| Misamis oriental | 91.3 | 0. | 65.2 | 0. | 73.4 | 10.7 | 21.1 | 2.03 | 60.1 | 99.7 | 93.9 | 91.2 | 30.2 |
| Mountain provinc | 93.0 | 0. | 83.9 | 0. | 26.9 | 6.74 | 27.7 | 15.6 | 97.0 | 7.43 | 79.7 | 100. | 57.5 |
| Negros occidenta | 75.0 | 0. | 48.9 | 0. | 43.3 | 19.5 | 25.0 | 2.73 | 90.8 | 92.5 | 74.6 | 93.9 | 20.6 |
| Negros orienta | 71.0 | 0. | 62.8 | 0. | 37.2 | 12.2 | 16.3 | 0. | 95.4 | 97.1 | 90.5 | 80.9 | 22.8 |
| Northern samar | 70.9 | 0. | 40.7 | 0. | 33.2 | 21.1 | 28.3 | 12.9 | 96.7 | 96.4 | 85.4 | 88.6 | 21.4 |
| Nueva ecij | 92.2 | 0. | 72.5 | 0. | 57.3 | 7.94 | 33.5 | 2.45 | 91.7 | 100. | 100. | 95.5 | 61.6 |
| Nueva vizcay | 85.7 | 0. | 58.6 | 0. | 99.2 | 30.9 | 30.2 | 6.09 | 88.1 | 84.3 | 93.1 | 97.1 | 44.4 |
| Occidental mindoro | 61.2 | 0. | 58.0 | 0. | 82.5 | 21.0 | 24.0 | 7.43 | 97.8 | 93.8 | 84.6 | 79.5 | 10.2 |
| Oriental mindoro | 84.6 | 0. | 59.8 | 0. | 24.1 | 7.73 | 16.1 | 3.96 | 98.5 | 99.4 | 98.2 | 95.2 | 31.3 |
| Palawa | 55.8 | 0. | 70.6 | 0. | 61.1 | 17.4 | 15.2 | 5. | 96.6 | 90.6 | 85.5 | 82.2 | 21.4 |
| Pampanga | 95.5 | 0. | 50.2 | 0. | 59.9 | 3.98 | 23.5 | 9.47 | 93.7 | 100. | 99.6 | 99.1 | 95.2 |
| Pangasinan | 97.2 | 0. | 58.8 | 0. | 40.8 | 14.6 | 13.1 | 0. | 99.6 | 100. | 98.9 | 97.1 | 41.9 |
| Quezon | 74.0 | 0. | 51.8 | 0. | 18.1 | 9.74 | 26.4 | 0. | 98.3 | 85.1 | 86.7 | 91.6 | 39.0 |
| Quirin | 88.1 | 0. | 70.9 | 0. | 65.1 | 12.0 | 20.0 | 0. | 95.1 | 99.5 | 99.9 | 94.8 | 42.2 |
| Riza | 91.7 | 0. | 49.6 | 0. | 53.1 | 19.2 | 15.5 | 0. | 96.4 | 100. | 100. | 95.8 | 86.0 |
| Romblo | 94.1 | 0. | 48.9 | 0. | 39.6 | 24.0 | 23.6 | 0. | 95.9 | 92.8 | 97.1 | 91.7 | 16.2 |
| Sarangan | 64.7 | 0. | 70.9 | 0. | 84.3 | 18.6 | 43.8 | 12.6 | 97.1 | 86.7 | 94.2 | 78.7 | 12.4 |
| Siquijor | 98.5 | 0. | 53.2 | 0. | 32.8 | 20.4 | 3.02 | 0. | 74.3 | 99.8 | 93.5 | 92.3 | 11.5 |
| Sorsogon | 95.1 | 0. | 49.2 | 0. | 55.2 | 26.6 | 7.46 | 2.21 | 92.8 | 99.0 | 91.6 | 95.8 | 21.1 |
| South cotabato | 89.4 | 0. | 64.3 | 0. | 47.9 | 17.7 | 19.0 | 0. | 85.9 | 95.5 | 92.6 | 95.0 | 18.9 |
| Southern leyte | 92.5 | 0. | 57.2 | 0. | 39.4 | 39.3 | 12.8 | 0. | 96.3 | 97.9 | 97.7 | 97.2 | 17.4 |
| Sultan kudarat | 62.1 | 0. | 67.9 | 15.6 | 133.07 | 8.44 | 39.3 | 8.76 | 97.5 | 87.4 | 84.2 | 83.7 | 8.09 |
| Sulu | 18.9 | 0. | 46.4 | 0. | 19.1 | 0. | 9.45 | 2.75 | 99.7 | 67.2 | 30.9 | 72.2 | 0.52 |
| Surigao del nort | 86.6 | 0. | 56.4 | 0. | 66.8 | 38.6 | 11.4 | 0. | 91.7 | 100. | 98.0 | 96.6 | 27.5 |
| Surigao del su | 86.8 | 0. | 57.7 | 0. | 88.6 | 33.2 | 31.4 | 6.45 | 97.7 | 97.1 | 82.8 | 90.8 | 18.4 |
| Tarlac | 87.0 | 0. | 54.0 | 0. | 91.7 | 16.5 | 26.9 | 6.22 | 97.7 | 100. | 98.6 | 97 | 48.9 |
| Tawi-taw | 39.5 | 0. | 49.0 | 0. | 30.9 | 0.95 | 14.8 | 2.42 | 99.4 | 95.4 | 27.1 | 81.2 | 12.2 |
| Zambales | 91.5 | 0. | 56.5 | 0. | 50.2 | 6.67 | 21.5 | 3.53 | 71.4 | 96.2 | 95.3 | 93.7 | 65.1 |
| Zamboanga del nort | 68.0 | 0. | 58.2 | 0. | 89.7 | 31.1 | 34.9 | 7.61 | 82.4 | 84.2 | 86.7 | 75.9 | 8.35 |
| Zamboanga del su | 78.4 | 0. | 51.0 | 0. | 34.5 | 23.9 | 13.9 | 0. | 76.9 | 95.0 | 87.9 | 85.4 | 21.3 |
| Zamboanga sibuga | 87.6 | 0. | 66.6 | 0. | 79.5 | 26.5 | 34.0 | 3.76 | 92.1 | 91.0 | 93.1 | 84.7 | 10.0 |
5.2Local government expenditure
To obtain data on local government expenditures, the authors used SREs published by the Department of Finance’s Bureau of Local Government Finance. The SREs include Total Current Operating Expenditures for each province and for each municipality in each province. Expenditures are categorized as (i) General Public Services; (ii) Education, Culture and Sports/Manpower Development; (iii) Health, Nutrition and Population Control; (iv) Labour and Employment; (v) Housing and Community Development, vi) Social Services and Social Welfare (vii) Economic Services; and (viii) Debt Services. Focus was placed on fiscal years 2011 to 2016. For these years, General Public Services typically accounted for the largest share of reported expenditures followed by Economic Services and Health, Nutrition, and Population Control; Labour and Employment account for the smallest share of reported expenditures.
5.3Applied methodology
The primary goal of the pilot study was to explore data availability in existing surveys and seek to provide proxy indicators that would reliably reflect official SDG indicators as well as to explore the relationships between SDG indicators and local government expenditures. While several estimation techniques were applied, these results are best understood within the framework of exploratory analysis rather than as a rigorous attempt to establish causal inference.
6.What did we learn from this work? – Key takeaways
The results described are subject to several caveats:
• The dataset used for constructing SDG indicators is not very well suited for subnational analysis when applied to the provincial or district level.
• Several SDG indicators for which data were collected could not be utilized. For example, neonatal mortality rates could not be estimated at the provincial level because many provinces recorded no neonatal mortalities for the reference period. Where SDG indicators were estimated at the provincial level, their estimated standard errors were too large to be considered reliable.
• Non-sampling errors such as coverage errors, non-response and measurement error also add noise to the provincial-level estimates.
• Estimates on local government expenditure were frequently aggregated to smooth expenditures and to mitigate the effect of any reporting errors. In addition, aggregation increase the statistical power by decreasing the number of covariates in the model and reduces heterogeneity caused by differences in reporting practices between different provinces and municipalities. However, due to aggregation, any casual interpretation of how a certain type of government expenditure, such as health expenditure, influences healthrelated SDG indicators may lead to biased estimates and introduce noise.
• One of the key limitations was the small sample size. For most estimations, only 74 observations were included, thus limiting the statistical power to detect actual relationships but also more likely to identify spurious relationships.
Based on the above-mentioned caveats, several recommendations are provided, aimed at national and international bodies responsible for supporting SDG localization, national and international entities that carry out large-scale household surveys, and subsequent researchers who might also explore the relationship between local government expenditures and SDG indicators.
6.1Key recommendations
6.1.1Better data collection – SDG indicators
Although the NDHS provides very detailed data on certain issues relevant to local and national governments, it is less suitable for indepth analysis of SDG localization primarily due to the sampling method which does not allow for detailed geographical analysis. While NDHS 2017 is a better resource for provincial-level analysis than NDHS 2013 with its larger sample size and was explicitly stratified at the provincial level (and below in some cases), this is rather an exception than a rule. In cases where SDG indicators are constructed from existing surveys that are not explicitly stratified at the desired geographical level, one approach would be to utilize small area estimation techniques to improve provincial-level estimates.
In addition, some Association of Southeast Asian Nations (ASEAN) countries rely on community-based monitoring systems (CBMS) to track information such as socio-economic indicators at the local level and established agencies that coordinate data collection and harmonization. CBMS allows for data collection on household, individual and geospatial data through a questionnaire. Recently, the government of the Philippines adopted An Act Establishing a Community-Based Monitoring System and Appropriating Funds Therefore [20]. CBMS is to be used for planning, program implementation and impact monitoring at the local level (cities and municipalities). It involves the generation of data at the local level which serves as basis in targeting households in the planning, budgeting and implementation of government programs geared towards poverty alleviation and economic development.
Disaggregated data facilitate local planning and programme implementation for meeting SDGs [17]. These data can be used to construct SDG indicators at the local level and to generate an SDG profile of each region/province/district. More importantly, these systems can generate panel data that can track progress over time.
Therefore, significant effort needs to be made to collect more accurate data on local levels through primary data collection and/or cooperation with private sectors and civil society. This requires, for example, leveraging data from telecom companies, satellite imagery, and social media.
6.1.2Better data collection – Local government expenditure
With respect to local government expenditure, ideally disaggregated expenditure data by SDG indicator is needed. However, this would be a major undertaken even at the national level. The secondbest solution would be to establish a better governance system and institutional framework where local governments are encouraged to be transparent about their budgets by creating an open data portal where local government data can be downloaded. In addition, where federal government allocates a small portion of their spending to local governments, this open data platform could include federal spending on different categories disaggregated by geographical units. To establish such a system, a uniform system of reporting public revenues and expenditures that is in line with system of national accounts would be required.
7.Conclusions and call for action
This report highlights the importance of SDG localization and an integrated approach to development where all stakeholders have an important input, but are also accountable in achieving the goals envisaged by the 2030 Agenda for Sustainable Development. To accelerate the implementation of SDGs a more holistic approach is required. This entails vertical and horizonal coordination among different stakeholders as well as vertical and inter-sectoral integration. To this end, a strong policy coherence accompanied with mechanism that support the alignment of national and local goals must be in place. At the national level, this requires commitment and continuous support in terms of legal and regulatory frameworks, policy documents aligned to the SDGs and financial resources available to support inclusive development within country. At the local level, stakeholders are required to effectively engage with the 2030 Agenda by increasing awareness of the SDGs which can facilitate the alignment of local developmental needs with the global ones.
Effective SDG localization requires clear institutional mandates, functional and fiscal decentralization, and the capacity to implement SDG strategies and plans. To inform development efforts, data ecosystems need to be developed which contain highly disaggregated data on government expenditure as well as SDG indicators for planning, implementation, and monitoring purposes. Creation of open platforms that show different categories of government expenditure aligned with SDGs would enable policy makers to adequately monitor the achievement of SDGs at local level and identify activities that accelerate progress. Accompanied with micro data such as surveys or collection of new data a database of SDG indicators at the local level can be developed. Thus, impact evaluation can be used to inform policymakers whether to continue, reorient or scale up the government expenditure.
In addition, human and technical capacity needs to improve to enable the collection of highly disaggregated data, their analysis and evaluation. In this respect, digital readiness of public institutions must be prioritized because it would enable not only greater stakeholder participation and engagement, fiscal transparency and accountability, but would also improve the local government’s ability to improve data collection for enhanced design, delivery and monitoring of government services and programmes.
Notes
1 Section three covers a detailed description of data at the local level and describes the kind of local data that currently exists and why they may not be sufficient.
Acknowledgments
This work builds on the collaboration with colleagues from Center for Impact Evaluation (C4ED) and benefitted with substantial discussions and support from UNICEFs data team especially the MICS. We are grateful to Markus Frölich, Attila Hancioglu and Turgay Unalan.
References
[1] | United Nations Development Programme. Localizing the Post-2015 Agenda: Dialogues on Implementation. New York: UNDP; (2014) . |
[2] | Satterthwaite D. Successful, safe and sustainable cities: Towards a New Urban Agenda. Commonwealth Journal of Local Governance. (2017) ; 19: : 3–18. doi: 10.5130/cjlg.v0i19.5446. |
[3] | United Nations General Assembly. The road to dignity by 2030: Ending poverty, transforming all lives and protecting the planet – Synthesis report of the Secretary-General on the post-2015 sustainable development agenda. New York: United Nations; (2014) . |
[4] | Global Taskforce of Local and Regional Governments, UNDP, and UN-Habitat. Roadmap for Localizing the SDGs: Implementation and Monitoring at Subnational Level. Barcelona: (2016) . |
[5] | Misselwitz P, Villanueva JS. The Urban Dimension of the SDGs: Implications for the New Urban Agenda. Paper presented at: UNESCAP 6th Regional Workshop of Integrated Resource Management in Asian Cities: Urban Nexus; (2016) Jun 22–23; Santa Rosa, Philippines. |
[6] | Oosterhof PD. Localizing the Sustainable Development Goals to Accelerate Implementation of the 2030 Agenda for Sustainable Development: The Current State of Sustainable Development Goal Localization in Asia and the Pacific. Asian Development Bank; (2018) . |
[7] | Allen C, Metternicht G, Wiedmann T. Initial progress in implementing the sustainable development goals (SDGs): A review of evidence from countries. Sustainability Science. (2018) ; 13: : 1453–1467. |
[8] | Morita K, Okitasari M, Masuda H. Analysis of national and local governance systems to achieve the sustainable development goals: Case studies of Japan and Indonesia. Sustainability Science. (2019) ; 15: (1): 179–202. |
[9] | Organisation for Economic Co-ooperation and Development. A territorial approach to the SDGs. Paris: OECD; (2019) . |
[10] | United Nations, Department of Economic and Social Affairs, Financing for Development Office. Report of the Inter-agency Task Force on Financing for Development – Financing for Development: Progress and Prospects. New York: UN; (2018) . |
[11] | Orozco EH, Cárdenas M, Lobos Alva I, Guerra A, Gerger Swartling J, Betancur S, Melati JK, Otieno Opiyo R, Kim D, Pearson L, Esquivel NN, Kabue Njoroge G, Ek F. SDG localization baseline: How local-level actors are driving change and advancing the achievement of the 2030 Agenda. SEI report. Stockholm Environment Institute, Stockholm. doi: 10.51414/sei2021.026. |
[12] | Krellenberg K, Bergsträßer H, Bykova D, et al. Urban sustainability strategies guided by the SDGs – a tale of four cities. Sustainability. (2019) ; 11: (4): 1–20. doi: 10.3390/su11041116. |
[13] | Masuda H, Okitasari M, Morita K, et al. SDGs mainstreaming at the local level: Case studies from Japan. Sustainability Science. (2021) ; 16: : 1539–1562. doi: 10.1007/s11625-021-00977-0. |
[14] | Breuer A, Janetschek H, Malerba D. Translating Sustainable Development Goal (SDG) interdependencies into policy advice. Sustainability. (2019) ; 11: (7): 1–20. doi: 10.3390/su11072092. |
[15] | United Nations Sustainable Development Solution Network. Getting started with the SDGs in cities – a guide for stakeholders. New York: SDSN; (2016) . |
[16] | City of Bonn. Voluntary Local Review: Agenda 2030 on the local level implementation of the UN Sustainable Development Goals in Bonn. (2019) . |
[17] | Reedy P. SDG Localization in ASEAN: Experiences in Shaping Policy and Implementation Pathways. Paper presented at: ASEAN-China-UNDP Symposium on the Localization of the Sustainable Development Goals; (2018) Aug 21–22; Siem Reap, Cambodia. |
[18] | Reedy P. Localising the sustainable development goals (SDGs): The role of local government in context. African Journal of Public Affairs. (2016) ; 9: (2): 1–15. |
[19] | United Nations Development Programme Financing the 2030 Agenda – An Introductory Guidebook for UNDP Country Offices. New York: UNDP; (2018) . |
[20] | The Republic Act No. 11315, An Act Establishing A Community-Based Monitoring System and Appropriating Funds Therefore. (2019) . |


