
The FAO Data Lab on statistical innovation and the use of big data for the production of international statistics
Abstract
Data is an extremely important intangible good, but official data is not always available. It may be scarce for many reasons, among which: low statistical capacities, poor funding for data and statistics, weak data dissemination and use culture. A solution to fill data gaps needs to consider that there is data made available on the web, usually coming in an unstructured way, that can be combined with innovative methods to generate relevant information. National and international organisations need to engage with new data sources and methods considering the crisis of traditional data collection systems that causes data gaps. In this light, FAO created in 2019 the “Data Lab for statistical innovation” to fill such gaps by modernising the Organization’s statistical business, which means improving the timeliness and granularity of data collection, providing automated analysis, and capturing early warning signals. It does so through the use of cutting-edge technologies (such as web scraping, text mining, geo-spatial data analysis and artificial intelligence) and by introducing nonconventional data sources (social media, online newspaper articles). This article summarises the experience of the FAO Data Lab and how it has been useful for the Organization to fulfil its mandate.
1.Introduction
Understanding the world requires data. Unfortunately, while for some domains we live in an era of data deluge (e.g. realtime interactions and activities on social networks, smart devices connected to the internet), for other types of phenomena getting information is much more difficult and/or expensive. For instance, if a country wants to know how much of its agricultural production does not reach consumers because it gets lost along the value chain (e.g., due to bad storage conditions), it requires to design a survey (create a representative sample, decide the method of data collection, etc.), compile all required information, standardise and aggregate results. This is not a trivial exercise, as it needs coordinated efforts, financial inputs, and human and technical capacities. It is not uncommon that one or more of these resources are missing in some countries, and, as a consequence information may be collected infrequently, or may not be available. In some cases, this situation has worsened because of different factors: decreased statistical capacities and reduced budgets (limited number of staff, low technical and managerial skills, poor statistical infrastructures, poor coordination among data producers, and weak regulatory framework); poor funding on data and statistics; weak data dissemination and use culture (e.g., the vast majority of data on food and agriculture collected through national surveys or censuses remains locked in institutional silos, often available only in paper or PDF formats that limit or prevent their re-use); increased non-responsiveness to surveys/questionnaires.
Figure 1.
On the left panel, number of articles on “machine learning” and “big data” along with the term “official statistics” on Google Scholar (as on 2022-02-11); on the right panel, the percentage over the total number of results once “official statistics” is removed from the query on Google Scholar.
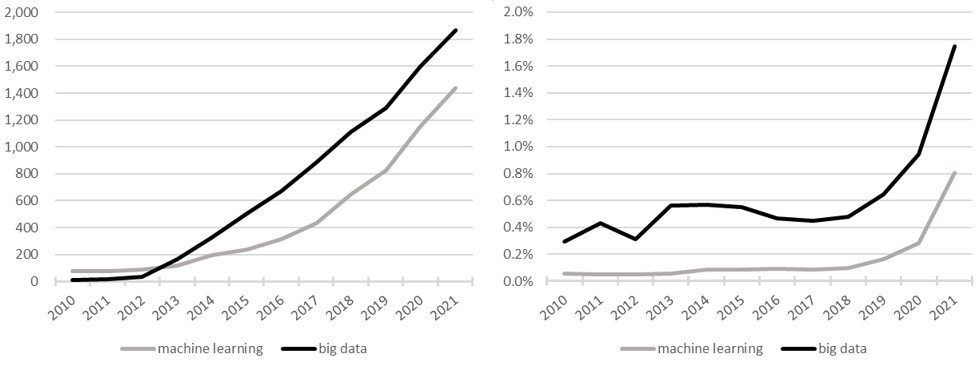
In contrast to the issue highlighted above is the need for more timely information to support decisions; and a possible response is an increased use of methods and technologies to extract data from unstructured sources. In this context, official statistics are benefitting from the use of nonconventional data sources and new statistical methodologies that can exploit these. To have an idea of how official statistics are adapting, we report in Fig. 1 the evolution in the number of papers that mention “official statistics” and either “machine learning” or “big data”. As it can be seen on the left-side panel (that reports the absolute number), in both cases the increase is impressive, however the right-side panel is more telling: it normalises the absolute counts by the total number of papers that mention either “machine learning” or “big data” without “official statistics”, and shows a remarkable increase after 2019/2020 in the number of articles that deal with novel methods.
When the Covid-19 pandemic hit the world in 2020, it became clear that nonconventional data sources and new methods that could improve coverage and provide quick insights on given subjects were essential. However, there were already some efforts going on in that direction. For instance, at the end of 2019 the Food and Agriculture Organization of the United Nations (FAO) created the “Data Lab for Statistical Innovation” with the aim of finding ways to fill official data gaps by modernising the Organization’s statistical business, which means improving the timeliness and granularity of data collection, providing automated analysis and capturing early warning signals. Covid-19 in a way accelerated the transformation and made these activities gain higher priority. As for data needs of FAO specifically, the activities carried out by the Data Lab have been useful to help the Organization to increase its statistical coverage by filling data gaps. The scope of this paper is to illustrate the steps undertaken by the Data Lab, provide examples of activities that have been successful, and discuss possible directions.
The remainder of this article is structured as follows. After this introduction, Section 2 provides some context on the “data revolution” and tries to summarise how it has been used in the context official statistics. Section 3 introduces the Data Lab, its goals, and activities. Section 4 gives some examples of how the Data Lab has helped in filling data gaps. Section 5 concludes and provides a possible roadmap for future activities.
2.The data revolution and official statistics
Before discussing what the Data Lab experience has been in trying to improve the statistical coverage of official statistics within FAO, it seems worth giving an overview of what is called “data revolution” and of its effects on official statistics.
New technologies such as smartphones, the “internet of things” (IoT), and cloud computing are leading to a tremendous increase in the volume of data creating outstanding opportunities for informing and transforming society through the data revolution. From the statistics perspective, the high data volume may improve the accuracy of the estimates of a given phenomenon and provide more detailed information. At the same time, statistical forecasts may be more frequent and timelier due to their speed. Furthermore, the wide variety of data may raise opportunities for integrating new data sources and opening new statistical areas. These three main features of the data age, also known as “big data”, meet the National Statistics Institutes’ goals, as they are responsible for producing official statistics used by policymakers and other essential players in society.
In 2014, the Secretary-General’s Independent Expert Advisory Group on a Data Revolution for Sustainable Development published the report entitled “A World That Counts: Mobilising the Data Revolution for Sustainable Development”11 encouraging the national statistical institutes, the private sector and governments to incorporate new data sources, methods and technologies in their analysis for achieving and monitoring sustainable development. The report emphasised that invisibility and inequality are the two significant global challenges for the current state of data. Invisibility is when there are gaps in data for some group of individuals or geographic regions systematically. For instance, in most data sets indigenous populations and favela residents are left out. Inequality refers to the access to, and use of, information, for instance, between developed and developing countries and between data-poor and data-rich communities.
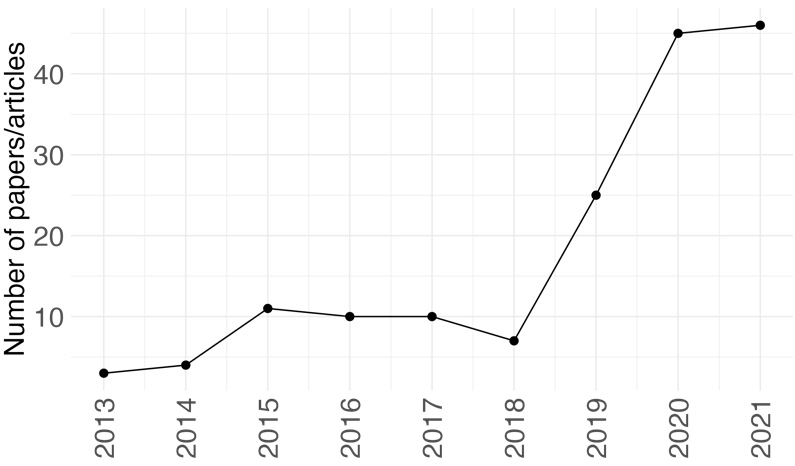
To measure the impact of the data revolution on official statistics, we collected all abstracts from the Statistical Journal of the International Association for Official Statistics (SJIAOS) that contain the keywords “official statistics” and either “big data” or “machine learning”. As a result, we found 161 abstracts written in English and published between 2010 and 2021. Figure 2 shows the number of articles found and their year of publication.
Figure 2.
Number of articles by year published on SJIAOS journal that co-occurred either “big data” or “machine learning” and “official statistics” in their content from 2010 to 2021.
To understand and summarise the abstracts’ content in a comprehensive way, the well-known topic model Latent Dirichlet Allocation (LDA) – which is a generative statistical model proposed by [1] – was estimated. This method requires to set in advance the number of topics to be found in the set of documents (abstracts). However, several metrics are proposed in the literature to select the optimal number of topics in a data-driven way, i.e., without imposing the number a priori, such as those presented in [2, 3], based on the topic similarities and density-based, respectively. In this work, we used the semantic coherence and exclusivity metrics proposed in [4, 5] to find the most suitable number of topics. The number of topics suggested by the metrics is 3 or 4. By using human judgment of topic quality, the value selected for this exercise is 4. To get better and more interpretable results we included compound keywords in the model that were extracted through the “Rapid Automatic Keyword Extraction” (RAKE) algorithm [6]. RAKE is a keyword extraction method which uses word frequency and co-occurrence to detect the most relevant words or phrases in a document. The RAKE algorithm uses a list of stop words and a set of phrase delimiters to split up the document text into candidate keywords, which are contiguous sequences of words as they occur in the text. After every candidate keyword is identified and the graph of word co-occurrences is complete, a score is calculated for each candidate keyword based on the co-occurrence and the frequency of the individual words that compose the keyword. For instance, the frequency of the word “big” is 62, and it co-occurred with other words 77 times, so the word’s score is 1.24, while the word “data” co-occurred 71322 times and its frequency is 625 giving a score of 1.14. Therefore, the score for the keyword “big data” is 1.24
Table 1
Top 5 terms ordered by the expected proportion in each topic
| Topic 1 | Topic 2 | Topic 3 | Topic 4 |
|---|---|---|---|
| Official statistics | Data science | Data collection | Big data |
| New data source | SDGs | Administrative data | Data source |
| Data analysis | Statistical data | Statistical literacy | Data revolution |
| Official statistician | National statistical system | Statistical production | National statistical office |
| Statistical method | Experimental statistics | Machine learning | Survey data |
Table 1 shows the top 5 terms with the highest probability of occurrence in each topic. Note that the keyword “data source” appears in two topics reflecting the importance of this concept. Topic 1 can be summarised as the possibility of using new data sources and big data in official statistics. The articles on this topic propose guidance and perspectives on big data in official statistics. An example of an article in this topic is “Big Data: What can official statistics expect?” by Hackl [7]. Topic 2 highlights the new skills in statistics needed to handle big data, which implies the emergence of the Data Science field and the importance of democratising the data understanding. In addition, the topic also highlights the Sustainable Development Goals (SDGs) in the context of the data revolution, and an example of this is “Improving the quality of disaggregated SDG indicators with cluster information for small area estimates” by Zulkarnain et al. [8]. Topic 3 focuses on data management, such as data acquisition and integration. For instance, Fayyaz and Hadizadeh [9] present the integration of data sources such as administrative and big data to resolve quality of linkage methods. Finally, topic 4 is the use of big data in a practical way in official statistics. For example, Pramana et al. [10] provide a comprehensive review of practical experiences in exploiting several Big Data sources for price statistics. In a nutshell, the four topics summarise the traditional dataflow in the statistical analysis: (i) planning and measuring the impacts of new approaches; (ii) developing new skills to overcome the new challenges; (iii) data collection; (iv) application of the methods.
A good overview of how organisations at the international level are employing these new methodologies is reported in the latest United Nations Activities on Artificial Intelligence report [11], which showcases 228 projects by 40 entities. We are now going to describe how FAO is handling the process of innovation of its methodological practices that incorporates new data sources and methods.
3.The FAO Data Lab
The FAO Data Lab was created at the end of 2019 with the goal of providing support to the modernisation of statistics of the Organization and increasing the data coverage by using new methods and technologies to extract data from unstructured sources. The first application of these new methods was the extraction of subnational data from official statistical websites to fill data gaps in the national agricultural production dataset or validate its content. This application will be explained in the next section.
As Covid-19 spread around the world in 2020, it was clear that timely information was required to support decisions. In times of emergency, the timeliness of data and the capacity to quickly and automatically draw insights from data for policymaking become essential. The pandemic has generated an increased need for timely, possibly real-time, information from nonconventional sources and its automated analysis. To cover these new data needs, the Data Lab for Statistical Innovation has been building and maintaining different databases; among these: tweets from newspapers worldwide, news about food value chains and related matters from Google News, daily food prices information on food loss and waste extracted from scientific articles and other documents. While the latter will be presented in a subsequent section, let us briefly mention the others.
The Data Lab has been building since January 2020 a comprehensive and up-to-date database with tweets collected from more than 500 newspaper accounts worldwide (as on 28 May 2022) on any topic. The text from the tweets and the article associated with them are extracted jointly when both are available. Therefore, this database covers the tweets and the articles, which makes the analysis more precise. After the extraction, the texts pass through several NLP algorithms to enrich them. For example, methods to identify countries, geographic areas, and food commodities cited in each text are applied, as well as, part-of-speech tagging, sentiment computation, and language detection. Another important analysis is topic identification. In the topic identification, the tweets and articles are classified into topics like “food value chain”, “food prices”, “climate change”, “food security”, “covid19 pandemic”, and other topics. The NLP processes applied in the tweets are almost the same as in the Google News data source. The main difference is that the articles are searched and collected using pre-defined keywords associated with the target topics.
For food prices, we provide two complementary products: a nowcasting model of monthly food inflation, and a daily price monitor. Both use information that is updated daily and obtained from Numbeo,33 a “crowdsourced” database. Crowdsourcing means that ordinary people update the information on the website. The site contains different types of data: property prices, crime, pollution, and food prices. It tracks daily food prices for fourteen food products: bread, milk, rice, eggs, cheese, chicken, beef, apples, bananas, oranges, tomatoes, potatoes, onions, lettuce. The daily food price monitoring tool checks whether the growth rate in any of these commodities exceeds some given threshold created on statistical grounds and provides alerts in abnormal cases. The nowcasting model for food price inflation, estimates the indices up to the current month by using averages of Numbeo’s food prices and other types of updated frequently variables: the Twitter sentiment index that is calculated by using the dataset of tweets mentioned before, the price of oil, and local currency unit exchange rates to the US dollar. Both products are publicly available in a friendly, yet powerful, dashboard at https://www.fao.org/datalab/website/web/food-prices.
We will now provide information on how the Data Lab has specifically addressed the issue of filling data gaps in official statistics.
4.Filling data gaps in official statistics
Here we will not mention all the projects and collaborations of the Data Lab, but for space constraints (and to be consistent with the article’s topic) this section will cover the following topics: 1) scraping subnational data from the internet in order to fill data gaps in FAO’s agriculture production dataset; 2) using several non-conventional sources to estimate the number of vulnerable people in a country; 3) text mining from literature, reports, and other documents, to create a structured global dataset of food loss and waste.
4.1Using “web scraped” information for agricultural statistics
Hand-in-Hand (HiH) is an evidence-based, country-led and country-owned initiative of the Food and Agriculture Organization of the United Nations (FAO) to accelerate the agricultural transformation and sustainable rural development to eradicate poverty (SDG 1) and end hunger and all forms of malnutrition (SDG 2). In doing so, it contributes to the attainment of all the other Sustainable Development Goals.44 The Initiative prioritises countries where national capacities and international support are most limited or where operational challenges, including natural or man-made crises, are greatest. It uses the most sophisticated tools available, including advanced geo-spatial modeling and analytics, to identify the biggest opportunities to raise incomes and reduce the inequities and vulnerabilities of the rural populations, who constitute the vast majority of the world’s poor. It also uses these tools to improve the targeting and tailoring of policy interventions, innovation, finance and investment, and institutional reform. For this, the Data Lab conducts agricultural production data collection by means of artificial intelligence in contexts where little data are available, typically in the HiH priority countries and at a sub-national level (different types of administrative divisions). This process allows the Data Lab to fill data gaps for the countries that are part of the HiH initiative; it also serves as a way to validate official data, creating a mechanism for data quality control and supporting governments to improve the quality of their work.
While the response rate to Agricultural Production Questionnaires (APQ) has shown an overall increase during recent years, as can be seen from Fig. 3, there are some areas for which it is well below 50% (Oceania) or consistently slightly below it (Africa).
Figure 3.
Average response rate to FAO’s Agricultural Production Questionnaire.
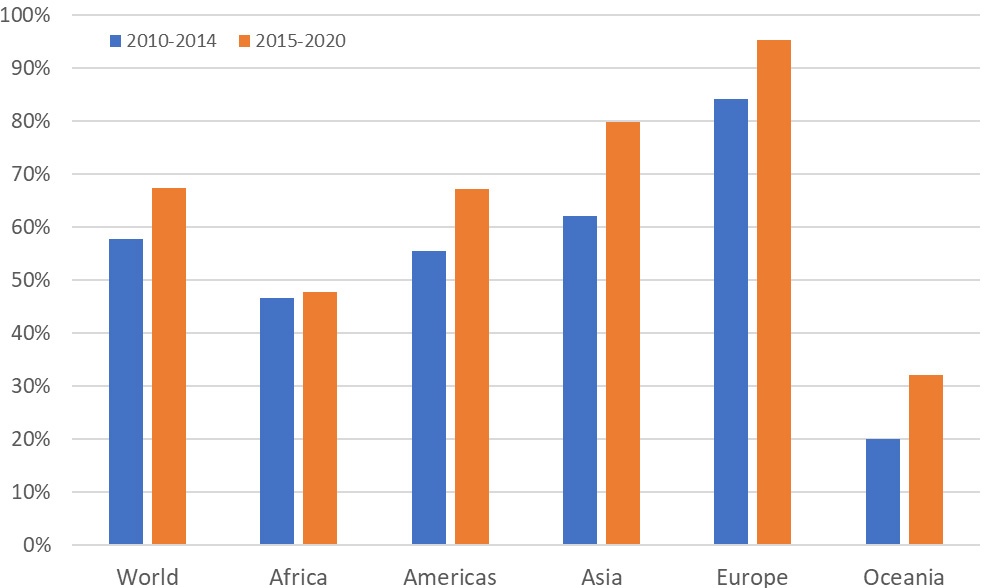
Figure 4.
Completeness indicator for Agricultural Production Questionnaires (see text for definition of “completeness”).
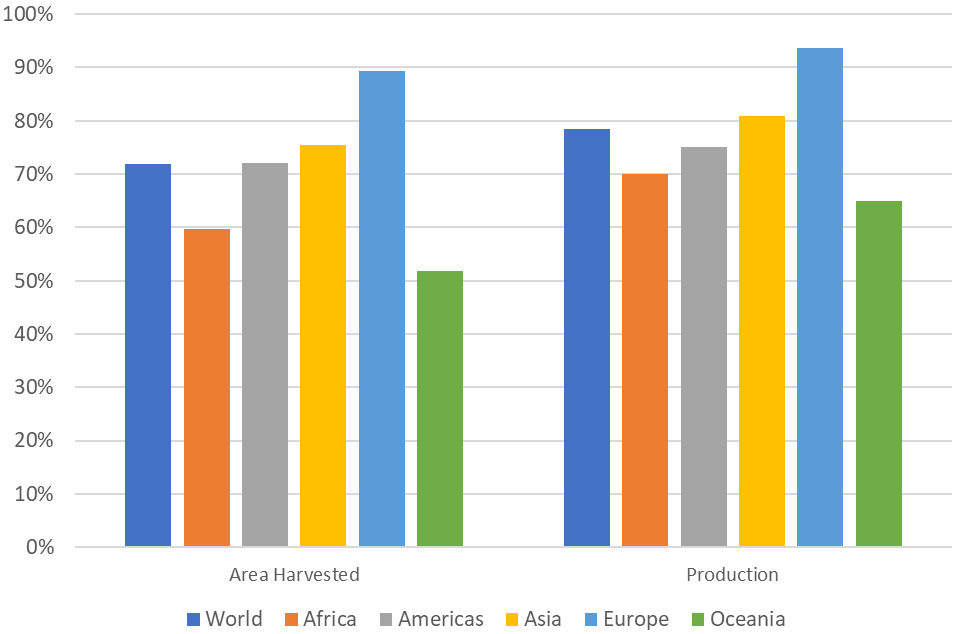
A similar picture can be obtained once we compute an APQ “completeness indicator”, calculated as the percentage of official data points over the total number of possible country/commodities combinations for which at least one official data point was ever provided by the country in one APQ.55 Results are reported in Fig. 4, and along with the previous Figure, shows that there is space to improve the statistical coverage.
Increasing the statistical coverage can be done mainly through two channels: there is a stronger collaboration with countries so that they produce and/or provide more data; or alternative data sources are used.66 Now, FAO has been collaborating closely with countries over the last few decades, and a possible outcome of recently renewed efforts may be the increased response rate reported in Fig. 3. However, the coverage can still be improved as shown in Fig. 4. Thus, this is the channel that is pursued by the Data Lab: obtaining data not included in the APQs by consulting sources available online.
Table 2
Statistics on information “web scraped” by the Data Lab in the context of the hand in hand initiative
| Administrative level | Data points | Countries | Commodities | |||
|---|---|---|---|---|---|---|
| Total | Production | Area harvested | Other | |||
| National | 20,666 | 9,933 | 9,223 | 1,510 | 23 | 566 (165) |
| First subnational | 194,478 | 92,260 | 83,063 | 19,155 | 25 | 592 (166) |
| Second subnational | 149,314 | 76,033 | 71,257 | 2,024 | 6 | 216 (97) |
| Third subnational | 20,801 | 10,382 | 10,419 | 0 | 1 | 9 (9) |
The process for getting data from alternative online sources consists in “web scraping”77 the information by following these steps: 1) searching for information on the internet, mainly from National Statistical Offices or Ministries websites;88 2) extracting the data from its original source (e.g., PDF documents, Microsoft Excel files) and transforming it to a common format (a SQL table); 3) standardising the data, with respect to commodity names (converted to the Central Product Classification, CPC99) and administrative area names (converted to GADM1010); 4) comparing to FAOSTAT data; 5) saving consistent data to the agricultural production database or analysing discrepancies. Though this process seems relatively straightforward, it is indeed plagued with several difficulties. For instance, documents downloaded in step 2) are unfortunately never ready-to-save into a database: there are different types of formats with their own peculiarities; the most difficult cases are those where the original document is a scanned copy where information needs to get extracted by OCR (Optical Character Recognition). For this step, a series of heuristics is applied and documents are passed through scripts that use information extraction techniques to obtain as much information as possible in a way that it is easy to export it in a tabular format; besides this, documents are usually in local languages, thus they need to be automatically translated to English. Another time-consuming step regards the standardisation of commodity and administrative units; for this, we have developed a strategy that attempts to link names by a fuzzy matching strategy that uses pre-built regular expressions1111 for all commodities and region names. For commodities or regions with no matches, a classification expert from FAO is consulted to help assign the correct link.
As on 23 May 2022 the Data Lab has collected 385,259 data points referring to different administrative levels (national and/or subnational) of 25 countries1212 that include information on 592 different agricultural commodities that, after a standardisation process, are converted to 166 different commodities classified according to CPC.1313 The majority of data regards production and area harvested, which are the main variables of interest for the FAO agricultural domain, though during the collection also other types of information are collected (e.g., tree count, sown area, average yield, etc.).
Not all collected data, as presented in Table 2, is used to integrate the data obtained from questionnaires. Subnational data needs first to be aggregated at the national level as FAO’s production dataset contains information on country data, and commodities are aggregated at the CPC sub-classes level. Additionally, many of the data points were already obtained from the APQs; when this happens, the web scraped data is used to cross-check the data already available. Indeed, this has already been useful to find some discrepancies as, e.g., a country was reporting data for one of the two crop seasons (thus underreporting total production), and another one was not including data for a disputed region (though it was included in trade data). Once the proper aggregations are done, 11,159 data points are candidates for inclusion. Of these, 1,039 data points (9.3% of scraped data) have been used to fill data gaps in the agricultural production dataset. The remaining data points are still being analysed to check whether they are consistent with available data and/or they can be incorporated in the dataset.
4.2Creating vulnerability maps
Determining the living conditions of the inhabitants of a country at the sub-national level is of great importance for many purposes, including for policymaking, investment, urban planning, administration, risk management in hazardous areas as well as planning humanitarian intervention. To estimate living conditions, standard statistical methods make use of censuses and surveys organised at regular intervals in time. However, surveys and censuses are complex exercises that are time-consuming, labour intensive, and expensive [12]. Therefore, countries that are characterised by events that impact social and economic relations (like violent conflicts), often cannot carry out sample-based data collection that allows quantifying sub-national living conditions.
In recent years different approaches were proposed to estimate living conditions in data-poor regions. These methods make use of cheaper alternative sources of data that are available in a timelier manner, therefore helping to bridge existing data gaps. The most promising methods involve the use of remote sensing [13, 14], whereby a statistical model learns the relationship between remote sensing derived variables and a target variable [15]. A popular approach involves the use of satellite images from which specific features can be extracted and used to estimate sub-national living conditions and population levels. These features include among others, the number and density of buildings, the prevalence of shadows, the number of cars, the density and length of roads, different types of agriculture, roof materials, bodies of water, etc. For example, [13] aims at explaining poverty variations at the village level in developing countries such as Sri Lanka, and shows a strong correlation between predicted poverty and spatial imagery variables, indicating a 40% to 60% variation in village-level poverty as explained by the national model. [16] analyses rural India by means of a trained convolutional model using satellite imagery data on the roofing material, sources of lighting and drinking water, roads, farms, and bodies of water.
The Data Lab has developed and implemented a method that leverages these innovative methods for estimating living conditions at the sub-national level. Specifically, it makes use of deep learning models to estimate a country’s land cover from satellite images. This data is then combined with ancillary variables (for example night lights, meteorological data, atmospheric data etc.) to estimate population levels. Scraped socio-economic data, which varies by country, are then used to calculate through factor analysis, the vulnerability score of a region. Finally, this vulnerability score is projected on a map that helps to visually identify those areas in which interventions should be prioritised. Presenting these detailed estimates in maps is a powerful communication tool because the maps summarise living conditions for hundreds or even thousands of towns, villages, or urban neighbourhoods on a single page and in a visual format that is readily understandable by a wide audience. Moreover, such maps enhance the interpretation of the data by preserving the spatial relationships among different areas, something that simply is not possible in a tabular data format.
Figure 5.
Vulnerability maps for Yemen: Vulnerability score in the top panel, vulnerable population in the lower panel.
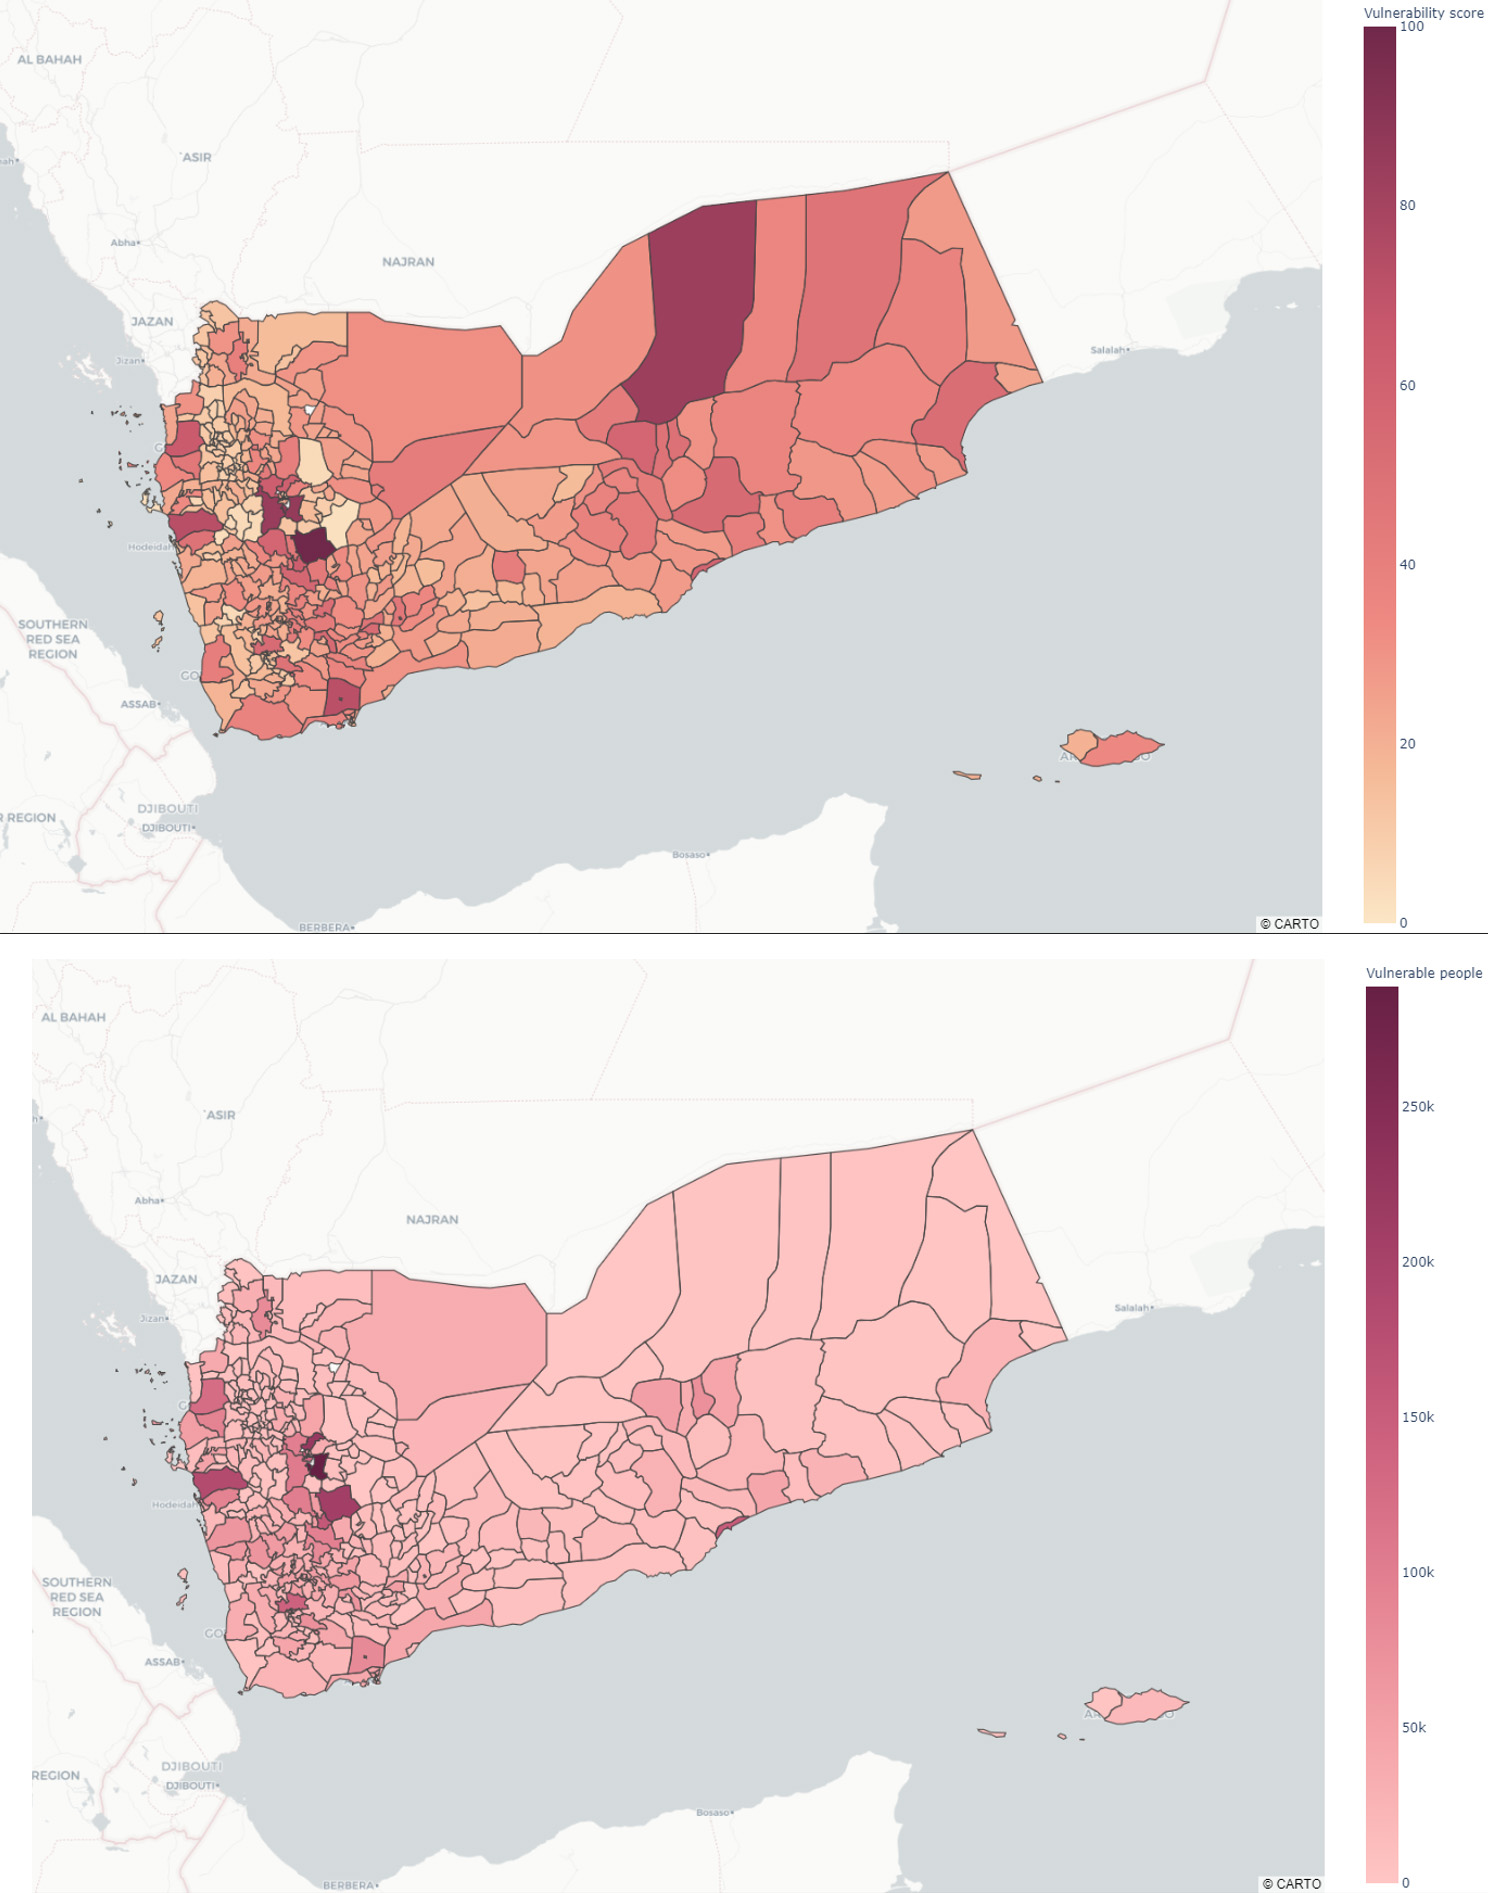
Figure 5 reports two vulnerability maps for Yemen: one shows a “vulnerability score” ranging from 0 to 100, to be used to provide an easy way to compare different regions; the other shows the amount of vulnerable people, and it thus indicates the magnitude of the problem in absolute terms.
This approach relies on two key aspects: the validity of the underlying model, as well as the degree of representativeness of these alternative data sources. In terms of validity, the model might face shortcomings if perturbing factors occur (such as economic or social shocks) that effectively change the context in which the model was trained. Additionally, if the model is too context-specific, the relations estimated from the model for a given country cannot be applied to another country, making the model useless (not generalisable). Having made these remarks, though, we believe that the methodology can foster a cheaper and timelier estimation of living conditions at sub-national level that can complement – and in some cases substitute –, censuses or surveys.
4.3Expanding knowledge on food loss and waste
SDG Target 12.3 states that “By 2030, halve per capita global food waste at the retail and consumer levels and reduce food losses along production and supply chains, including post-harvest losses.”1414 To measure and monitor food loss and waste (FLW) two indicators have been proposed: the Food Loss Index1515 and a Food Waste Index,1616 under FAO’s and the UN Environmental Program’s custodianship respectively. The Food Loss Index [17] requires data on the share of agricultural products that gets spilled, spoilt or otherwise lost, or incurs a reduction of quality and value during its process in the food supply chain before it reaches the retail stage (typically takes place at production, post-harvest, processing, and distribution stages in the food supply chain). The Food Waste Index requires information on food that completes the food supply chain and is available at the retail stage, of good quality and fit for consumption, but still does not get consumed because it is discarded, whether or not after it is left to spoil or expire (typically at retail and consumption stages in the food supply chain). These two types of data are scarce. To have an idea of its scarcity, and focusing only on food loss from now on, as on 24 May 2022 there is a percentage of official data points on this issue ranging from 7% that is obtained by questionnaires sent by FAO to countries (for the period 2015–2020). This means that the vast part of this phenomenon is not officially reported. However, there is a relatively good amount of literature on this topic that reports estimates of food loss for various products and stages of the value chain for one or more countries. On this premise, and with full commitment on calculating a Food Loss Index that is evidence-based, FAO has developed a semi-automated text-mining process to extract data on food loss from articles, reports, and grey literature.1717
The information extraction system consists of three main steps: 1) automated document collection and pre-processing; 2) modelled statistical assessment of the relevancy of documents; 3) guided extraction of data.
In the first step, we query different sources to obtain documents related to food loss by using generic loss-related keywords (e.g., “post-harvest food losses”, “post-harvest loss”, “food loss”). Scientific articles are obtained through the FAO library subscriptions. Other types of documents, such as working papers, conference proceedings, or technical notes, are harvested with several scripts that were designed to query specific websites such as the World Bank and World Food Program document repositories, among others. Once the documents are downloaded and saved locally, several data extraction steps are run to obtain metadata such as authors’ names, article’s title, date of publication, and language. Other useful information is also extracted or computed: a text summarisation routine based on Natural Language Processing (NLP) steps is performed to get a short summary of the document; keywords used in identifying loss factors for countries and commodities are retained.1818 All the extracted information is then stored into a NoSQL datastore (Solr)1919 to be used in later processing steps and to be displayed to the user into a user-friendly web interface.
The second main step of the process consists in checking if the document is likely to contain actual numbers of losses, i.e., checking its relevancy for the task. For this task, different machine learning classifiers were trained on a set of nearly 330 documents pre-validated by an expert (28% were considered relevant) by using as features different sets of word types and relations extracted from them2020 We considered 14 alternatives: AdaBoost, Decision trees, Gradient Boosting, Gaussian Naive Bayes, Gaussian Process Classification, K-Nearest Neighbors, Logistic regression, Multi-layer Perceptron, Perceptron, Quadratic Discriminant Analysis, Random Forests, SVM with SGD training, Support Vector Classification, Complement Naive Bayes. We compared results on different criteria (accuracy, recall, precision, Matthews correlation coefficient, area under the Receiver Operating Characteristic curve, and balanced F-score) by 10-fold crossvalidation on 67% of the complete sample, keeping the remaining 33% as a testing set. We decided to keep the Random Forests model because for most of the metrics it gave a better result for basically all criteria (and less variability across criteria). Each document is then passed through the implemented classifier, which returns a probability of it being relevant or not. This probability is stored into Solr and shown to the analyst in a web user interface – along with other details about the document – so that they can sort documents by decreasing degree of relevancy when they start the guided extraction.
The last step consists in a manual intervention by the analyst that needs to assemble and validate the information automatically retrieved in the previous steps. A copy of the document is shown to the analyst with the extracted information highlighted with different colours according to the typology of keywords (countries, commodities, percentages). The tool has some pre-compiled selection inputs with the information extracted from the text, so that the user can validate the extracted information and eventually add more details (e.g., food chain stage, sample size, methodology). When each set of information is saved, it is sent to a standard SQL database, which is linked to the documents stored in Solr by means of a key so that it is always possible to retrieve the document from which the information was taken.
Figure 6.
Data points by value chain stages contained in the food loss and waste dataset. “Other stages” refer to different stages of the value chain as grading, processing, wholesale, etc., which are recorded separately in the dataset, but the number of observations is less than 1,000 per stage.
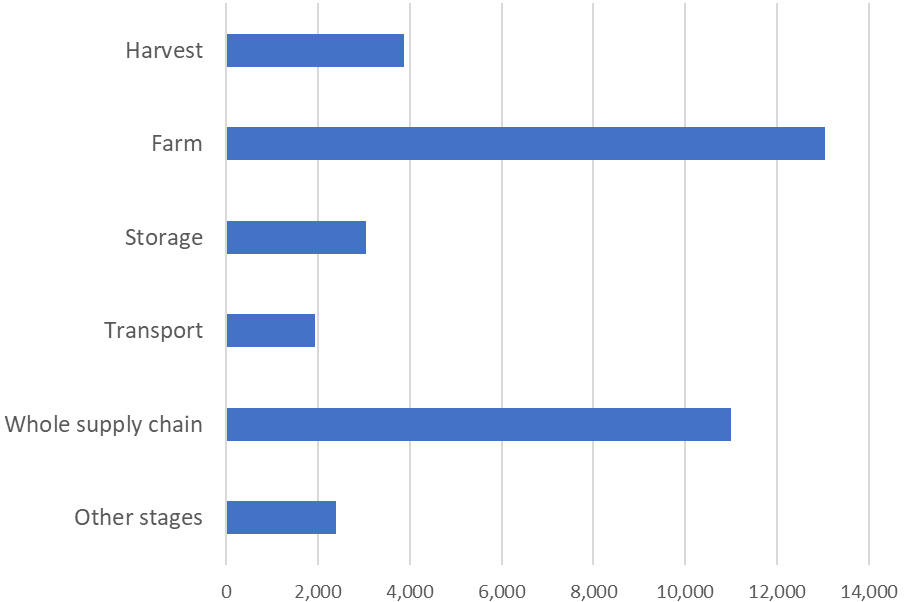
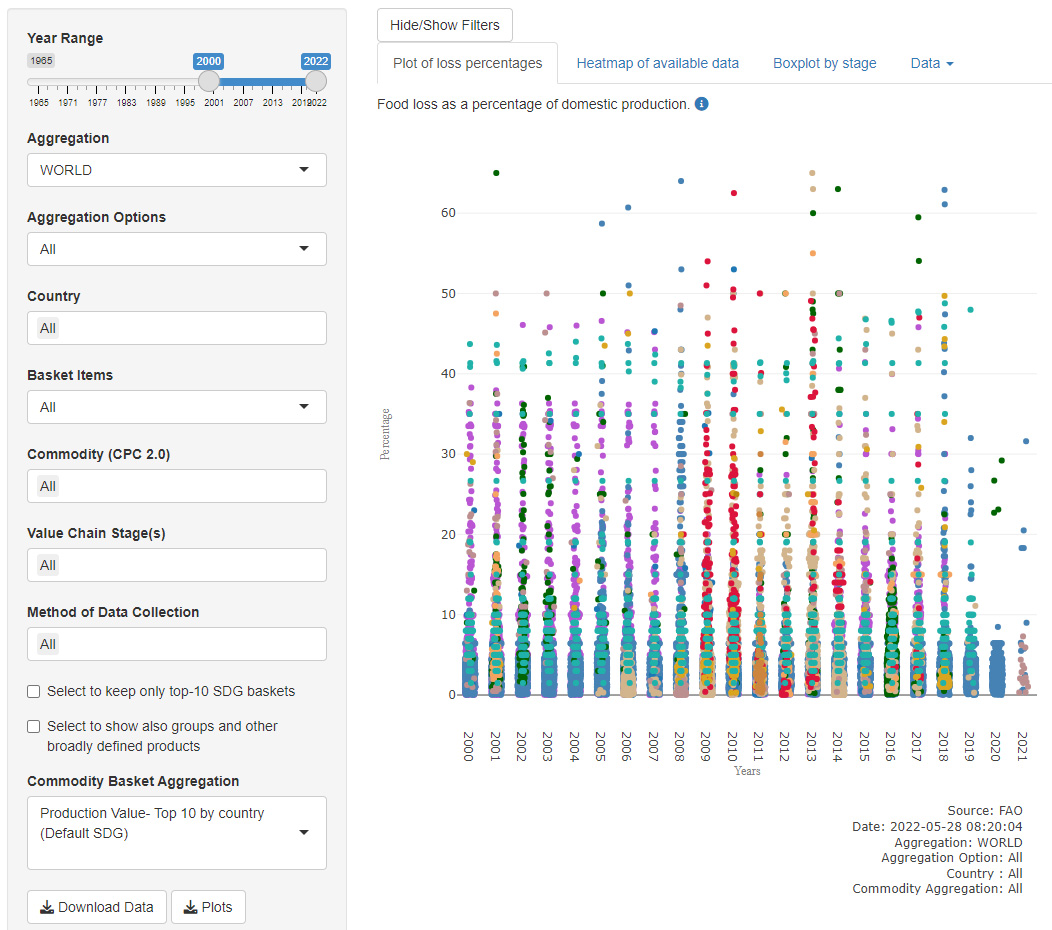
Figure 7.
Interactive tool to visualise and extract information on food loss and waste. Available at https://www.fao.org/platform-food- loss-waste/flw-data/.
As of 28 May 2022, the published dataset is made of 35,284 data points extracted from several hundreds of different sources. It covers 161 countries and 267 commodities. While it contains data ranging from 1945 to 2022, the vast majority of figures are for relatively recent years: 84% of observations are from 2000 and after, while 44% are for 2010 and after. Besides information on aggregated losses (i.e., for the whole supply chain), it also contains data for different stages of the supply chain. Figure 6 reports some selected stages (those with a number of data points greater than 1,000), as well as “Other stages” for which there are less observations (e.g., grading, processing, wholesale).
The FLW dataset is disseminated to the public by FAO at https://www.fao.org/platform-food-loss-waste/flw-data/ so that it can be used by anyone who wishes to know more about food losses and waste. Data can be queried, downloaded, and plotted in an interactive and structured way. A screenshot of the interactive tool that displays the data is reported in Fig. 7.
All the data collected for the FLW dataset serve a twofold scope. On the one hand, the dataset wants to be an instrument for researchers and analysts to understand better a domain for which official data is scarce and unofficial data is sparse and not systematised, so that they can study the phenomenon and reach their conclusions. On the other hand, it is exploited by FAO to impute missing data for losses on primary products for all countries. While describing the details of this imputation process is out of scope for the current paper ([17] and a forthcoming FAO/ESS Working Paper), it may suffice to say that all the information available on losses (official and collected through the text-mining process described before), is used in a random effects model that considers as explanatory variables many factors that are deemed to have some effect on food losses (e.g., electricity prices, oil prices, fertilizer prices, weather, rainfall, agricultural investment); the resulting model is used to provide yearly estimates of losses for every country/commodity combination where data is not available. By aggregating official and imputed data, the magnitude of food loss has been found to be of around 14% at the global level [18].
5.Conclusions
When Covid-19 unfolded in early 2020, the need for innovative data and methods to have quick insights became crucial. We have shown that the use of “machine learning” and “big data” increased visibly in official statistics, relatively to other fields. However, while Covid-19 accelerated the process, there were already signals showing data science tools gaining popularity across National Statistical Offices and International Organisations.
In this paper, we have given an overview of this process by discussing how the Food and Agriculture Organization of the United Nations acknowledged that data science is opening new ways to do old things and adaptation to the new framework are required. In this light, FAO created the “Data Lab” at the end of 2019 in the Statistics Division (ESS) aiming at modernising the Organization’s statistical business by improving the timeliness and granularity of data collection, providing automated analysis, and capturing early warning signals. ESS identified some immediate ways of using data science for official statistics. One example is structuring unstructured disaggregated data scraped from the internet on agricultural production, harvested area, and related concepts to fill in data gaps present in official data collected by FAO through questionnaires compiled by countries. The new database has been very well accepted and the scraped data after a validation process is part of the official dissemination in FAOSTAT. Besides this first application, this data has been used along with satellite imagery, other web scraped data, and factor analysis to compile a proxy indicator for poverty that is being used in highly vulnerable countries for humanitarian planning and interventions. Another reported example of methods used to fill data gaps is the Food Loss and Waste database that contains data obtained from scientific articles (or other types of specialised documents) through a combination of text-mining techniques, semi-automated extraction, and machine learning methods. This dataset is currently the largest on the subject, and is used as input into an estimation model for official reporting on SDG 12 Target 12.3. This dataset is also released to the public for research and analysis.
While the emphasis of this article has been centred on activities related to activities aiming at filling data gaps, the Data Lab has participated and is currently involved in several other projects that, for the sake of space, cannot be detailed here. For instance, it is also implementing several text mining projects that analyse/systematise documents that have attracted great attention in the organisation, such as an analysis of the pathways texts created for the 2021 Food Systems Summit to summarise and find commonalities across country programmes2121 an indicator on the use of statistics for policy making, and methods to automatise the classification of legislation and policy texts. These activities help address another major need which is to process documents and save the human resources necessary to carry out the work manually.
Notes
1 Available at: https://www.undatarevolution.org/wp-content/uploads/2014/11/A-World-That-Counts.pdf.
2 The word co-occurrence can be greater than its frequency because the word can be counted multiple times depending on the length of keywords. For instance, the candidate keyword “big data source” represented in the co-occurrence matrix is a 3
5 An indicator computed as such can understate the real completeness degree of APQ sent back to FAO as it would not consider commodities included in the questionnaires, but for which a given country has never provided any information. The indicator that we are using here wants to highlight that if a country has ever provided a data point for a commodity, then it means that it is relatively easy for the country to produce such information so that if it is missing, it means that there is indeed space to improve the statistical coverage concerning that country.
6 The two mentioned channels can be used complementarily of course.
7 It means programmatically extracting data from websites (from web
8 This first step is mainly done when a new country in added to the list of countries for which data is required, though it is not always possible to completely automatise the process given the different ways data can be made available on the website (e.g., different structure of the web address, different formats in which data is disseminated, etc.).
11 A regular expression is a string that uses some given pattern for matching. For instance, “[Tt]omato(es)?” can match “Tomato”, “tomato”, “Tomatoes” and “tomatoes”. See https://en.wikipedia. org/wiki/Regular_expression.
12 The most common combination of administrative levels available is national and first level subnational (18 countries); the second combination is national, first, and second level subnational (4 countries); for the three remaining, at least the first level subnational data is available.
13 There are many more single products than CPC codes, as the latter may aggregate different commodities. For instance, 01321 CPC code aggregates pomelos and grapefruits, which may be found reported under their own item in a national publication.
14 “Work of the Statistical Commission pertaining to the 2030 Agenda for Sustainable Development”, Resolution 71/313, adopted by the General Assembly on 6 July 2017, pag. 16, https:// digitallibrary.un.org/record/1291226/files/A_RES_71_313-EN.pdf.
17 This activity started before the Data Lab was created, but it was re-structured and systematised by the Data Lab.
18 We keep a list of relevant groups of keywords required for the project: countries, commodities, percentages, quantities (like tons, kilograms, etc.), and loss and post-harvest related words. Each keyword is defined as a “regular expression” so that matches allow for common variants of the keywords looked for.
20 For instance, among the features used, we included the number of percentages contained in the document and whether these appeared near the word “loss” or “losses”, given that the goal of the exercise was mainly to find if the document contained information on the magnitude of losses for some commodity/country.
21 An interactive dashboard is available at: https://www.fao.org/ datalab/dashboard/food-systems-summit/.
Acknowledgments
We are grateful to the anonymous reviewers for their comments, which made this article clearer. We are also thankful for the support that the Editor-in-Chief has provided during the review process.
References
[1] | Blei DM, Ng AY, Jordan MI. Latent Dirichlet allocation. Journal of Machine Learning Research. (2003) ; 3: : 993-1022. |
[2] | Griffiths TL, Steyvers M. Finding scientific topics. Proceedings of the National Academy of Sciences. (2004) ; 101: (suppl 1): 5228-5235. |
[3] | Cao J, Xia T, Li J, Zhang Y, Sheng T. A density-based method for adaptive LDA model selection. Neurocomputing. (2009) ; 72: (7–9): 1775-1781. |
[4] | Mimno D, Wallach HM, Talley E, Leenders M, McCallum A. Optimizing semantic coherence in topic models. In: Proceedings of the Conference on Empirical Methods in Natural Language Processing. (2011) . pp. 262-272. |
[5] | Roberts M, Stewart BM, Tingley D, Lucas C, Leder-Luis J, Gadarian SK, Albertson B, Rand GG. Structural topic models for open ended survey responses. American Journal of Political Science. (2014) ; 58: (4): 1064-1082. |
[6] | Rose S, Engel D, Cramer N, Cowley W. Automatic Keyword Extraction from Individual Documents. In Berry MW, Kogan J, eds. Text Mining: Applications and Theory John Wiley & Sons; (2010) . |
[7] | Hackl P. Big Data: What can official statistics expect? Statistical Journal of the IAOS. (2016) ; 32: (1): 43-52. |
[8] | Zulkarnain R, Jayanti D, Listianingrum T. Improving the quality of disaggregated SDG indicators with cluster information for small area estimates. Statistical Journal of the IAOS. (2020) ; 36: (4): 955-961. |
[9] | Fayyaz S, Hadizadeh R. Innovations from Iran: Resolving quality issues in the integration of administrative and big data in official statistics. Statistical Journal of the IAOS. (2020) ; 36: (4): 1015-1030. |
[10] | Pramana S, Siti M, Big data implementation for price statistics in Indonesia: Past, current, and future developments. Statistical Journal of the IAOS. (2021) ; 37: (1): 415-427. |
[11] | ITU (International Telecommunication Union). United Nations Activities on Artificial Intelligence (AI); (2021) . Available from: https//www.itu.int/dms_pub/itu-s/opb/gen/S-GEN-UNACT-2021-PDF-E.pdf. |
[12] | UNSD (United Nations Statistics Division). Principles and Recommendations for Population and Housing Censuses, Revision 3; United Nations, New York; (2017) . |
[13] | Mossoux S, Kervyn M, Soulé H, Canters F. Mapping population distribution from high resolution remotely sensed imagery in a data poor setting. Remote Sensing. (2018) ; 10: (9): 1409. |
[14] | Engstrom R, Newhouse, D, Soundararajan V. Estimating Small Area Population Density Using Survey Data and Satellite Imagery: An Application to Sri Lanka. World Bank Policy Research Working Paper. (2019) : 8776. |
[15] | Wu S, Qiu X, Wang L. Population estimation methods in GIS and remote sensing: A review. GIScience & Remote Sensing. (2005) ; 42: (1): 58-74. |
[16] | Pandey S, Agarwal T, Krishnan N. Multi-task deep learning for predicting poverty from satellite images. Proceedings of the AAAI Conference on Artificial Intelligence. (2018) ; 32: (1). |
[17] | Fabi C, English A. “Measuring food losses at the national and subnational levels: FAO’s methodology for monitoring Sustainable Development Goals”, chapter 8 in Minor T, Thornsbury S, Mishra AK, (eds), The economics of food loss in the produce industry. Routledge, London and New York; (2020) . |
[18] | FAO (Food and Agriculture Organization of the United Nations). The state of food and agriculture: Moving forward on food loss and waste reduction; (2019) . Available from: https//www.fao.org/3/ca6030en/ca6030en.pdf. |


