
UNICEF remote learning readiness index: A composite indicator to assess resilience of education sector against crises and emergencies
Abstract
The paper presents the methodological work behind production of the UNICEF Remote Learning Readiness Index, a composite indicator to assess the resilience of education sector against crises and emergencies. The index is composed of demand-side factors, such as readiness for remote learning observed at the household level, supply-side factors that are approximated by the education policy response of the governments to the COVID-19 outbreak, and systemic factors that refer to the overall preparedness of education sector to crises and emergencies. The major novelty of the adopted methodological approach to measure how national education systems can ensure every child learns refers to the emphasis put by the index on the weakest parts of the system. The adopted “weakest link” approach allows the index to guide policy-making and be sensitive to a country improvement in time. The work also accentuates the importance of the index application beyond the COVID-19 pandemic, as disruptions to education supply are not unique to the current health crisis and can happen due to the conflicts, natural or men-made disasters, or other factors.
1.Introduction
The COVID-19 pandemic has impacted national education systems worldwide. The number of students affected by school closures peaked in April 2020 at more than 1.5 billion children around the world, representing about 90 per cent of total enrolled learners in 194 countries [1]. To mitigate the effects of school closures, governments started introducing remote learning policies based on a combination of broadcast media, online platforms, and paper-based material delivery. However, country-level responses to school closures varied substantially between and within regions. Available data suggest that in about 130 countries ministries of education adopted remote learning policies to ensure continuity of learning, which included online platforms (90%), broadcast solutions using television (87%) and radio (61%), and take-home packages (85%) [2]. However, decisions regarding remote learning solutions were influenced by a country’s income, especially when it came to “differences in adoption of online learning platforms,” thus highlighting that low- and middle-income countries were “at a far more disadvantaged starting point for an effective transition to online learning platforms” [3]. Moreover, existing evidence indicates that the disparities observed in access to the internet and information communication technologies (ICTs) at home due to the differences in socio-economic standing could widen already severe learning inequities [4]. Therefore, a significant share of schoolchildren worldwide could be left behind despite the existence of remote learning policies [5]. The analysis of effective coverage of remote learning solutions, summarized by UNICEF as reachability indicator, suggested that that about 30% of schoolchildren worldwide cannot continue learning through remote channels, and approximately three out of four in this disadvantaged population come from rural areas and/or belong to the poorest strata in their countries [6, 7].
Existing research emphasizes that even prior to the pandemic, the society already was facing the learning crisis, with large gaps in skills needed for children to succeed in modern economies. Measurement of learning poverty, a concept that quantifies the share of children unable to read and understand a simple story by the age of 10, reveals stark inequities in human capital gains across the world. As such, while only 10% of children in high-income countries live in learning poverty, as many as 90% of children in low-income countries lack in the basic reading skills [8]. One calendar year since the pandemic was announced, almost 215 million schoolchildren worldwide missed at least three quarters of the intended in-person instruction time, and 168 million missed almost an entire year [9]. Together with unequal access to remote learning opportunities, this situation presents explicit consequences in terms of severe learning loss.
As even after more than two years since the pandemic was announced, very limited large-scale data are available on the actual access to learning during COVID-19, different econometric simulations were carried out to estimate the learning loss [10, 11]. A set of global estimates suggests that “COVID-19 could result in a loss of 0.6 year of schooling adjusted for quality, bringing down the effective years of basic schooling that children achieve during their schooling life from 7.9 years to 7.3 years” [12]. Other studies indicate that “learning losses due to COVID-19 school closures could continue to accumulate even after children return”, emphasizing that “a three-month school closure could reduce long term learning by a full year’s worth of learning” [13]. Accounting for this, many countries planned “initiatives to address learning loss as part of school reopening, with nearly 70 per cent intending to introduce remedial programmes” [14].
Remedial support policies aimed to help children catch up on the lost learning were facilitated by the international community in the joint initiative of UNESCO, UNICEF, and World Bank called “Mission: Recovery” and aimed at recovering education from COVID-19-caused learning loss. The initiative emphasized that it is not enough for schools to simply reopen after COVID-19, as schoolchildren “need tailored and sustained support to help them readjust and catch-up after the pandemic” [15]. While “short-term remediation when children return to school could reduce long term losses by half”, a more sustainable approach is needed, as only “long-term system improvements could surpass pre-COVID learning trajectories by ‘building back better”’ [13]. With these regards, countries need to continue investing in improvement of remote learning infrastructure as it provides a meaningful way to mitigate the learning loss. A country-level assessment of educational resilience in relation to crises is essential to accelerate the efforts of the international community and national stakeholders in “building back better,” i.e., recovering from the learning losses caused by the disruption of in-person classroom during the COVID-19 pandemic.
Overall, the problem of education system resilience against crises and emergencies was on the research and policy agenda even before the COVID-19 outbreak, with the pandemic highlighting the issues of equity in access to education in crises due to its large-scale impact on the education supply. As such, blended learning was proven to be effective as a solution to increase the educational resilience in the post-earthquake settings in New Zealand [16]. Reflecting on the experiences of the earthquakes in Japan, number of scholars highlighted the need for a comprehensive assessment tool on the school disaster resilience [17].
However, to the current moment a limited number of studies adopted an index-based approach to assess the resilience of the education sector towards crises and emergencies, which highlights a sizeble research gap in this domain. One of the examples refers to the assessment of the risk reduction strategies and readiness to mitigate the disruptions to education supply in Pakistan provinces affected by flood disasters [18]. With COVID-19 outbreak causing severe disruption to the education supply on the global scale, the discussion of resilience in the context of education in emergencies was brought on the agenda again [19]. A number of studies put a particular focus on the role of teacher readiness to move to remote learning, accentuating the aspects of instructional resilience in delivering education [20, 21].
As the end of the COVID-19 pandemic is not foreseeable, remote learning will continue to play an important role in delivering education in the near future, as well as in providing remedial support for students most affected by the learning loss. Furthermore, school closures are not unique to the COVID-19 outbreak and can take place due to natural or man-made disasters, conflicts, etc. Strengthening the resilience of the education sector against negative shocks and learning loss is essential for human capital gains and inclusive and equitable education for all [22]. Investments in the remote learning readiness of education systems can play an important role in reaching out-of-school populations, refugees, or providing education for schoolchildren in remote rural areas, and in addition to ensuring children continue learning during the school closures they can also help children get back on track when schools reopen.
In response to the growing need in evaluation of education sector resilience, UNICEF introduced a Remote Learning Readiness Index (RLRI), a new composite indicator that aims to identify the “weakest links” in a country’s preparedness to mitigate the disruptions to education supply during crises and emergencies [23]. In other words, the development of RLRI was motivated by the following research question: which part(s) of the education system should be improved to ensure continuous provision of education to all children through remote learning in emergencies that lead to school closures? Proceeding from that, the RLRI aims identify the “weakest links” in a country’s readiness for remote learning, thereby supporting targeted policymaking to improve equitable access to remote learning during crises and emergencies. Another important aspect behind this index: it should guide policy decisions in low- or middle-income settings and be to the possible extent insensitive to the country’s economic development. In other words, the methodological objective behind the assessment refers to producing an index that would not rank a country low due to the purely economic factors such as GNI per capita. The index should provide feasible and realistic policy guidelines for countries that could be affected by the crises or emergencies most, identifying the areas where urgent actions could result in systemic improvements. With that regard, while the results of the RLRI analysis are available in the UNICEF report [23], the purpose of this paper is to shed light on the methodological work that was carried out to produce the index.
2.Conceptual framework
When one talks about readiness for remote learning at home, several things observed at macro and micro levels appear to be essential. The index was developed by UNICEF as a tool that considers three domains critical for enabling remote learning:
• Demand-side factors which refer to household-level possessions of durable goods needed for remote learning (radio, television, personal computers, etc.).
• Supply-side factors that constitute a country’s education policy response to provide schoolchildren with remote learning opportunities while the schools are closed, and
• Systemic factors that are linked to the preparedness of the education sector to withstand disasters or other crises.
Demand-side factors of remote learning readiness refer to those determinants of academic achievement and learning that are found at the household level. Convincing evidence suggests that in many countries, socio-economic gradient of learning is very high, and family wealth is one of the major predictors of learning outcomes [24]. In the context of remote learning, household possessions of such information and communication technology (ICT) assets as radio, television, personal computers, mobile phones, or internet connection are key in terms of providing access to remote learning opportunities. While the possession of these assets is merely a function of household wealth, and all of them could differ in terms of efficiency as channels for acquiring skills and knowledge, existing evidence suggests that even broadcast media like radio or television help to sustain the connection to learning [25, 26, 27]. In this regard, the more ICT assets are in place at home, the lower is likelihood that a child will be affected in terms of learning loss during school closures. However, since many children who are unable to have in-person interaction with their teachers might need additional support, parental education is another critical factor in the household environment. It is assumed that more educated parents are better prepared to support their children when they learn from home [28]. As such, the share of mothers who completed at least secondary education was taken as a proxy for parental support that a child could potentially receive at home to facilitate their learning. Combined, these components allow for identifying the household-level domain in a country’s readiness for remote learning, which represents a demand side of the remote learning system.
Nevertheless, even the highest household-level readiness cannot be helpful without an effective policy response. Internet access from home is of little use in continuing to follow coursework if the government does not design a remote learning policy based on online platforms. An efficient policy response provides as many schoolchildren as possible with remote learning opportunities and mitigates the effects of socio-economic status (e.g., possession of ICT assets at home). The more remote learning policies a country deploys, the more schoolchildren have a chance to continue learning while schools are closed [5, 29]. Therefore, policies that use broadcast channels such as radio or television are as important as those that use online channels, since lower-tech options provide better opportunities to reach children from the poorest households or remote rural areas. However, a country’s policy response is not limited to the deployment of remote learning modalities. It is also very important to support teachers by providing them training on how to instruct classes through remote channels. Untrained teachers often struggle to remotely deliver materials to schoolchildren in an efficient way [30, 31, 32]. Thus, factors related to the deployment of remote learning opportunities and related training for teachers constitute the demand-side critical to a country’s remote learning readiness.
Finally, as remote learning is a measure adopted in response to crises that lead to school closures and the disruption of in-person instruction, it is essential to assess how well a country’s education system is prepared to respond to emergencies. The ability to assess and mitigate risks, and to allocate sufficient human and financial resources in response, comprise the factors related to education system-level preparedness for emergencies [33, 34, 35, 36].
While demand-side and systemic factors refer to the ex-ante readiness, i.e., pre-event resilience of education sector to emergency and crises, the supply side of the remote learning readiness is related to the ex-post readiness, i.e., it measures a capacity of a government to provide a timely policy response that ensures children can continue learning while the schools are closed. It is important to emphasize the complementary nature of the three domains of remote learning readiness, which is opposed to the substitute nature. The domains are not fungible – for example, as outlined, high readiness for remote learning is impossible to achieve by advancing household-level factors but without an efficient policy response. The complementary nature of the relationship between the remote learning readiness domains is defined by the fact that advancement in one component could not compensate for lower performance in another one. Remote learning systems must be envisioned as chains that are only as strong as their weakest link. The successful delivery of remote learning depends on a country performing well in all three domains. Otherwise, the weakest link of the chain will determine the overall effectiveness and coverage of remote learning program. The RLRI highlights the areas where a country most needs to strengthen its readiness and ensure learning continuity through remote channels.
3.Data sources and coverage
The RLRI relies on three major data sources. The data on schoolchildren who have the necessary ICT assets at home, as well as information on potential parental support expressed as the share of mothers who have completed upper secondary school, come from household surveys such as Multiple Indicator Cluster Surveys (MICS) and Demographic and Health Surveys (DHS). Survey data collected between 2010–2020 were used to produce the current set of estimates, of which two-thirds of the data refer to the 2015–2020 period. The data covers 67 mostly low- and middle-income countries.
Results of the first round of the UNESCO-UNICEF-World Bank Survey on National Education Responses to COVID-19 School Closures that took place in May–June 2020 provide information on policies that were adopted and teacher training conducted. Ministries of education were asked to indicate if radio, television, or online platforms were deployed as “education delivery systems as part of the national (or subnational) distance education strategy for different levels of education,” or if at the national level “teachers had been trained to use remote learning platforms” for different education levels from pre-primary to upper secondary school (UNESCO, UNICEF, World Bank, 2020). For future rounds of the RLRI, an ad-hoc survey of UNICEF country offices will be implemented to collect the data on how ministries of education use remote learning either during school closures or to provide the remedial support to mitigate learning loss.
Finally, the data on system preparedness for emergencies comes from UNICEF’s Strategic Monitoring Questions (SMQ), a complex assessment carried out by UNICEF HQ and country offices in consultation with ministries of education. The SMQ have a section on system strengthening, represented by indicator “2.a.2 Equitable education systems for access,” that has emergency preparedness and resilience as one of its subdimensions. This subdimension, in turn, is comprised of three core indicators: risk assessment, risk reduction strategy, and human and financial resources. UNICEF country offices are asked to rate their country’s education sector on a scale from 1 (weak) to 4 (strong) to indicate the extent to which they are implementing risk assessment and risk reduction, as well as allocating human and financial resources for these needs. An aggregated score of these three variables indicates the emergency preparedness and resilience of the education sector in a given country.
The RLRI uses 13 input variables from these three data sources and covers 67 low- and middle-income countries. The data coverage by country income group and region is presented in Table 1. Furthermore, detailed descriptive statistics of the input variables used to produce the RLRI are presented in Table 2.
Table 1
Data coverage by country income group and region
| Income group/region |
|
|---|---|
| Low income (L) | 18 |
| Lower middle income (LM) | 32 |
| Upper middle income (UM) | 24 |
| East Asia and Pacific | 11 |
| Eastern and Southern Africa | 11 |
| Eastern Europe and Central Asia | 8 |
| Latin America and Caribbean | 14 |
| Middle East and North Africa | 6 |
| South Asia | 7 |
| West and Central Africa | 17 |
| World | 67 |
Source: Authors’ calculations based on Multiple Indicator Cluster Surveys (2010–2020) and Demographic and Health Surveys (2010–2020), the first round of the UNESCO-UNICEF-World Bank Survey on National Education Responses to COVID-19 School Closures, May–June 2020, and UNICEF Strategic Monitoring Questions, December 2020.
Table 2
Descriptive statistics of the input variables
| Household level factors | ||||||||
| Variable | Min | Median | Mean | SD | Max | NAs | ||
| Share of schoolchildren with radio at home | 0.01 | 0.51 | 0.47 | 0.23 | 0.92 | 1 | ||
| Share of schoolchildren with TV at home | 0.02 | 0.68 | 0.65 | 0.29 | 1.00 | 0 | ||
| Share of schoolchildren with at least one family member having a mobile phone | 0.57 | 0.92 | 0.89 | 0.12 | 1.00 | 0 | ||
| Share of schoolchildren with PC at home | 0.02 | 0.20 | 0.28 | 0.24 | 0.92 | 8 | ||
| Share of schoolchildren with internet access at home | 0.01 | 0.34 | 0.37 | 0.29 | 0.95 | 30 | ||
| Share of schoolchildren whose mothers completed secondary education or higher | 0.02 | 0.30 | 0.39 | 0.28 | 0.94 | 8 | ||
| Policy capacity response | ||||||||
| Yes | No | |||||||
| Radio was deployed for any level of education | 44 | 30 | ||||||
| TV was deployed for any level of education | 60 | 14 | ||||||
| Online platforms were used for any level of education | 58 | 16 | ||||||
| Teachers were trained to use remote learning platforms | 37 | 37 | ||||||
| 1 | 1.5 | 2 | 2.5 | 3 | 3.5 | 4 | NA | |
| Risk reduction for education sector is implemented | 4 | 8 | 7 | 16 | 22 | 6 | 0 | 11 |
| Risk assessment for education sector is in place | 3 | 4 | 8 | 11 | 25 | 5 | 1 | 17 |
| Human and financial resources are allocated for implementing risk reduction and assessment strategies | 5 | 8 | 18 | 8 | 13 | 3 | 0 | 19 |
Source: Authors’ calculations based on Multiple Indicator Cluster Surveys (2010–2020) and Demographic and Health Surveys (2010–2020), the first round of the UNESCO-UNICEF-World Bank Survey on National Education Responses to COVID-19 School Closures, May–June 2020, and UNICEF Strategic Monitoring Questions, December 2020.
Table 3
Methodology of aggregating the final score
| Lowest domain | |||||
|---|---|---|---|---|---|
| High | Medium-high | Medium-low | Low | ||
| 2nd lowest domain | High | 5 stars | 5 stars | 4 stars | 3 stars |
| Medium-high | 5 stars | 4 stars | 3 stars | 2 stars | |
| Medium-low | 4 stars | 3 stars | 2 stars | 1 star | |
| Low | 3 stars | 2 stars | 1 star | 1 star | |
4.Methodology
The data analysis and index construction employed a sequential approach based on first- and second-stage ranking. The first-stage ranking relates to the domain-level analysis and refers to two key steps, namely, aggregation of three domains based on the input variables, and evaluation of the computed aggregated scores against theoretical benchmarks. The second-stage ranking relates to the aggregation across three domains to produce each country’s final ranking.
4.1First-stage ranking: Aggregation of the domains
The first-stage ranking started with producing an aggregated value for each domain. At this stage, the major challenge behind producing the composite indicator stemmed from the fact that all the variables represent different types and statistical distributions. Variables derived from household data are continuous; scaled between 0 to 1, they express shares of schoolchildren. The data from the policy response capacity domain present binary outcomes, i.e., a policy was either deployed (1) or not (0). Finally, SMQ data are fixed on an ordinal scale, with values varying between 1 to 4. Given the continuous nature of the underlying statistical distribution, an arithmetic mean across six quantitative variables from the household surveys was used to produce an aggregated value for the household domain. The policy response capacity domain represented by four binary variables was aggregated by counting the number of times a policy was implemented by a country. It resulted in an aggregated domain on a scale of 0 to 4, where 0 indicates that a country did not implement any remote learning policy and 4 shows that it implemented all possible policies. Since the responses were provided for each education level separately, for calculating a total value of the domain, an average was taken to keep the values for the total on the same scale as the values for each education level. Finally, a median value across three variables from UNICEF’s SMQ was calculated to represent the emergency preparedness of the education system domain. Since the variables from the SMQ represent ordinal ranks that are qualitative by their nature, the median score appears to be the optimal way to summarize the central tendency of this kind of distribution. Consequently, the aggregated score for this domain ranges from 1 to 4. In the final step of the first-stage ranking, each aggregated domain was evaluated against four theoretical benchmarks, such as “low,” “medium-low,” “medium-high,” and “high.” These benchmarks were produced in a way that divides the distribution of each aggregated score into four bins of relatively equal size in relation to the original scale.
4.2Second-stage ranking: Identification of the weakest links
The second-stage ranking started with the identification of the two weakest domains in a country’s performance. Given the complementary nature of the three domains, it is logical to assume that the overall resilience of an education system to crises is defined by the weakest links in the chain, i.e., by the domains in which a country has the lowest performance. Proceeding from this, it was essential for each country to have data for all three domains to derive a final score.
Focusing on the two weakest links is justified by several factors. First, it allows for simplicity while also capturing critical information on a country’s performance. Using two domains produces 16 possible outcomes, whereas using all three domains would produce 64 outcomes, making it difficult to summarize the results in an easy-to-understand manner. Furthermore, taking information from the best domain does not contribute to the identification of the areas where improvement is needed. Second, the complementary nature of the three domains places the focus on the weaker parts of the system. Alternatively, focusing on one – the weakest – domain could result in a loss of information on how resilient the country is toward school closures. And lastly, choosing two domains produces results which are more sensitive to improvements over time.
Each country’s two weakest domains were used to produce final scores ranging between one and five stars, with five being the best. For example, if a country scored “high” in the household domain but performed “medium-high” in the policy response and “medium-low” in the emergency preparedness domains, the combination of the latter two was used to determine the final score. Table 5 presents how the 16 possible combinations of the two weakest domains were classified into the final score. To facilitate understanding of the index, each level is color-coded.
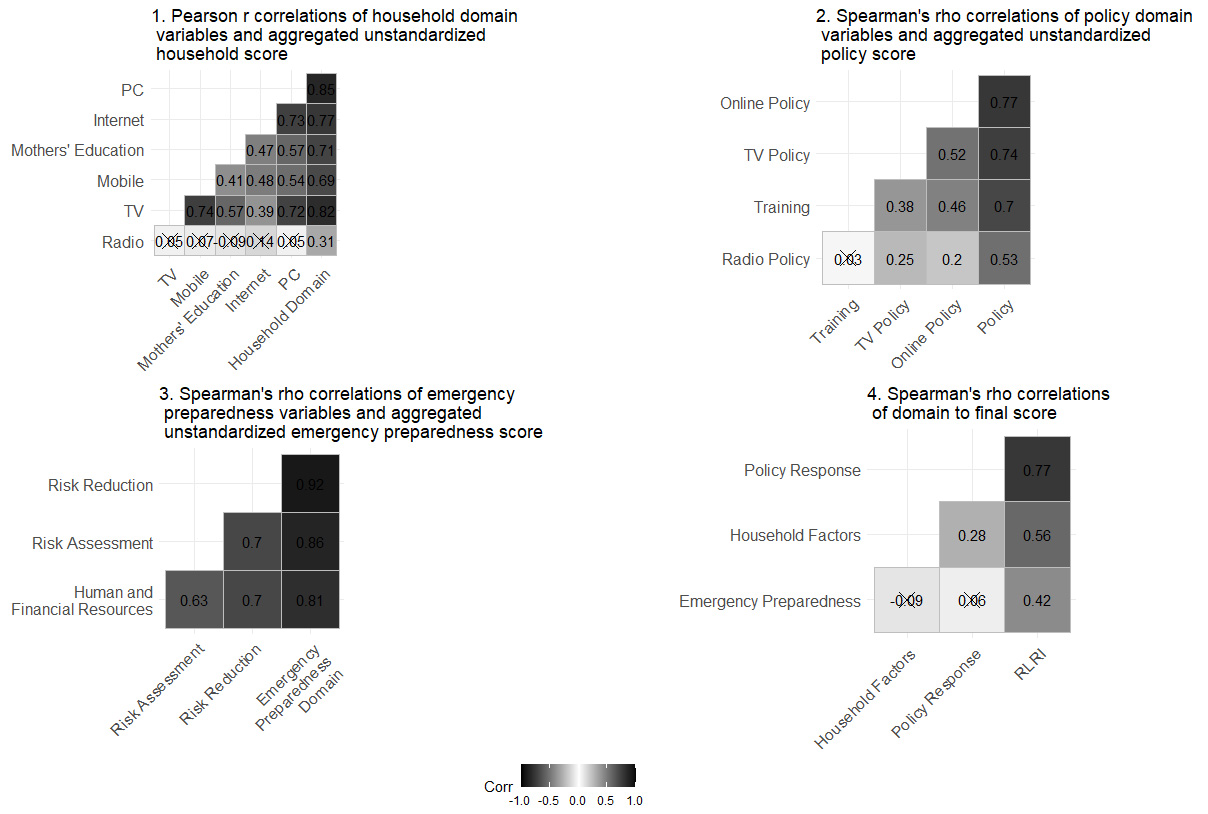
Figure 1.
Correlation matrices of the input variables, domains, and final index. Source: Authors’ calculations based on Multiple Indicator Cluster Surveys (2010–2020) and Demographic and Health Surveys (2010–2020), the first round of the UNESCO-UNICEF-World Bank Survey on National Education Responses to COVID-19 School Closures, May–June 2020, and UNICEF Strategic Monitoring Questions, December 2020.
4.3Treatment of missing values
As noted, because the RLRI is based on identification of the weakest links, (i.e., the two domains in which a country performs worst), the final rank was produced only for countries with available data across all three domains. Additional criteria were applied for producing aggregated domains at the first-stage ranking. Given that countries show different data availability (as was indicated in Tables 2–4), the aggregations of the household and policy response domains were carried out only if at least half of the variables within each domain were present. However, to avoid a loss of coverage, an exception was made for the domain of education system preparedness. The item-total correlation using the Spearman rank correlation coefficient showed high values (above 0.7) for all input variables with an aggregated domain score. This allowed for concluding that even one variable could be a meaningful proxy for the education system preparedness for emergencies. As a result, if a country had only one value across three variables from UNICEF’s SMQ, it was taken as a final score of the aggregated domain.
5.Empirical results
5.1Index properties
Statistical properties of the index were assessed by measuring the correlation between the input variables, derived domains, and the final score. When it comes to the household domain, most of 13 input variables establish positive and statistically significant, moderate or high correlation. Interestingly, the variable possession of the radio does not correlate significantly with any of other input variables. When it comes to the statistically significant correlations, the lowest one is observed between the share of children with internet and TV at home (0.39). On the other hand, share of schoolchildren with internet connection at home and personal computer at home establish the strongest correlation (0.73). When it comes to the item-domain correlation, share of schoolchildren with radio at home is the least correlated with the aggregated household domain score (0.31), whereas the highest correlation is observed between the share of schoolchildren who have PC at home. The results are presented at Fig. 1.1.
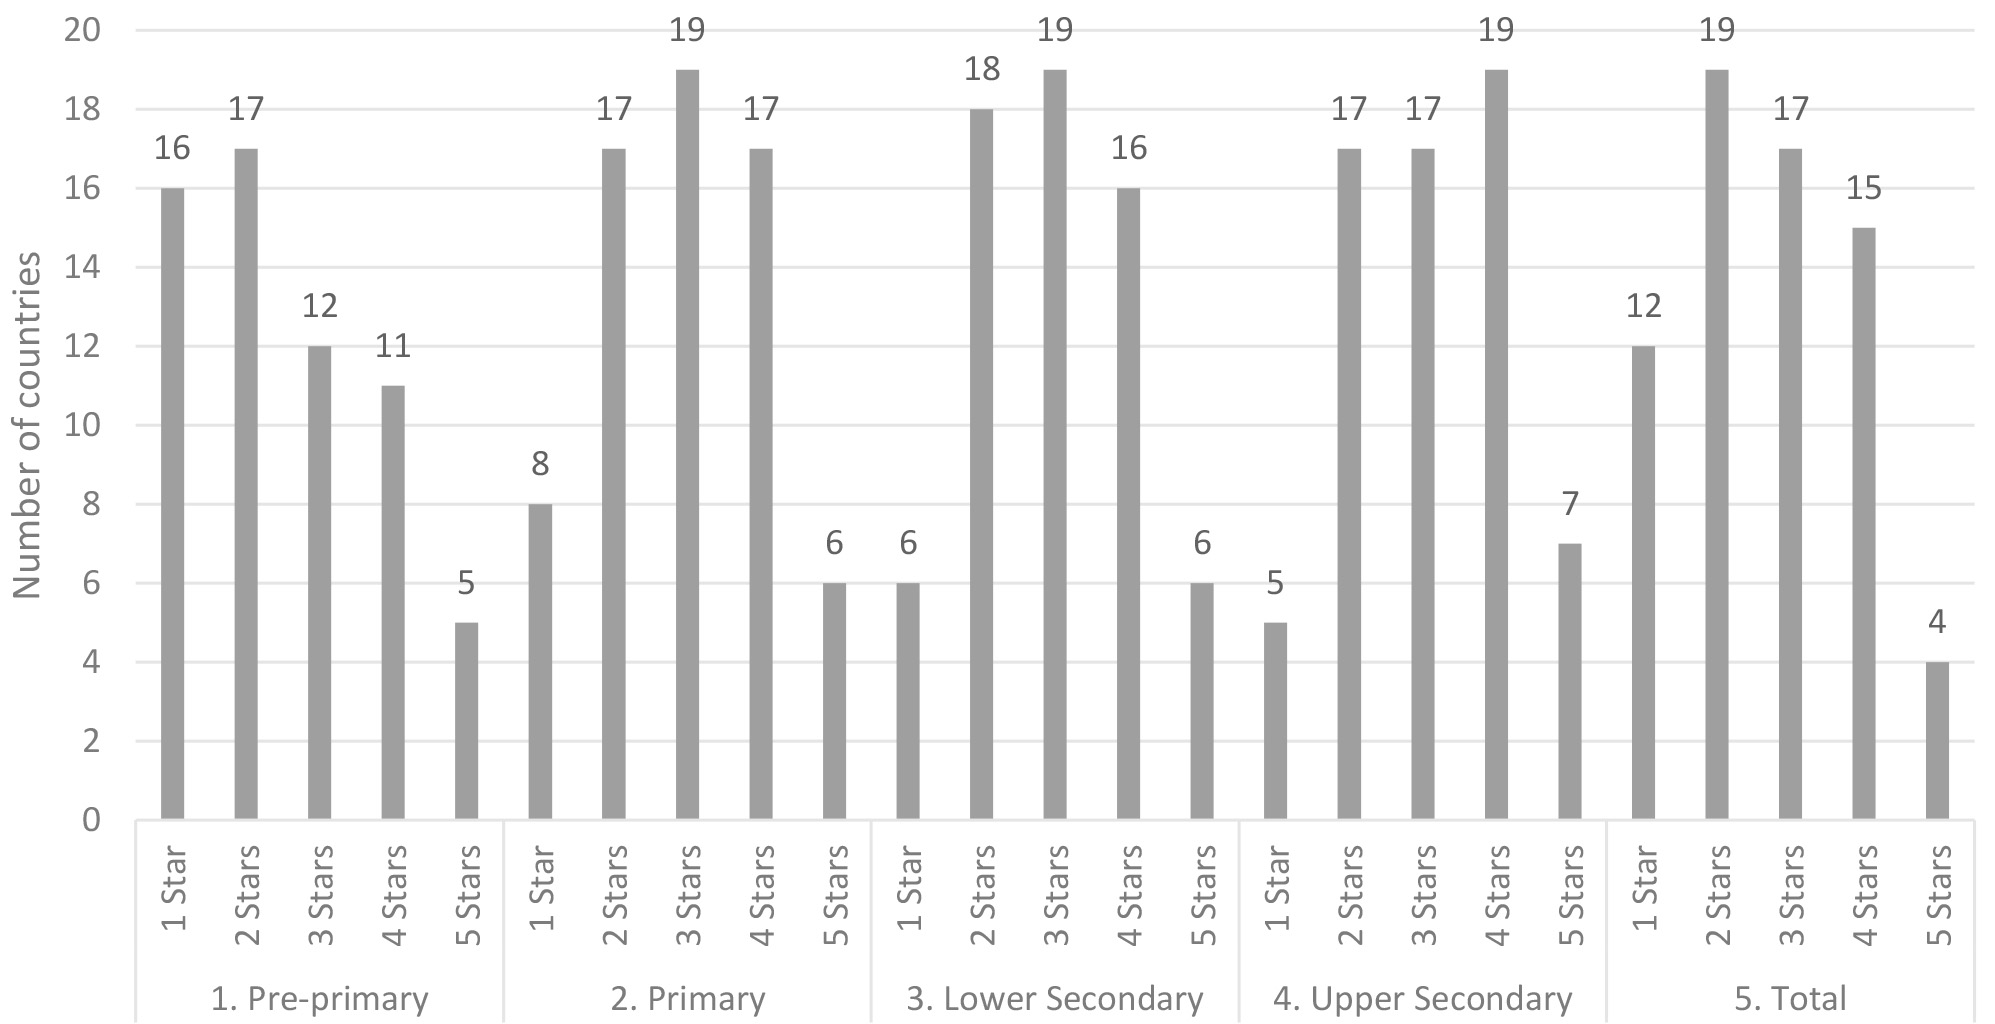
Figure 2.
RLRI by level of education (global overview)
Despite the correlations between the input variables observed at the supply side of the remote learning readiness, namely, policy response, are mostly statistically significant, they tend to be low. The highest correlations are at the moderate level and are observed between the government’s deployment of remote learning policies through TV and online channels (0.52) as well as deployment of remote learning through online channels and provision of teachers with training for remote learning (0.46). When it comes to the item-domain correlation, all of the adopted by the governments policies establish high correlation with the aggregated domain score (above 0.7), except for the deployment of the remote learning through the radio channels. This suggests that the radio-based remote learning had the least impact in defining the policy response domain. The results of the analysis are presented at Fig. 1.2. Finally, as shown on Fig. 1.3, all the input variables in the education system preparedness domain establish both high, positive, and statistically significant correlations between each other and between the aggregated domain. The results of the carried-out analysis suggest that predominantly all input variables correlate well with the aggregated domain scores, and moderately correlate between each other. The only exception refers to the variables related to the radio – both on the supply and demand side, which, on the one hand, predominantly fail to establish statistically significant correlations with other input variables within the respective domains, but on the other hand, correlate well enough with the final domains thus justifying their presence in the final index. Figure 1.4 presents the domain-to-final-score correlation, suggesting that though emergency preparedness does not form a statistically significant correlation between other aggregated domains, it is moderately correlated with the final RLRI score.
5.2Global and regional overview of the results
The index covers 67 countries (predominantly low and middle-income countries), presented in Fig. 2 by their remote learning readiness at each education level as well as globally. When looking at the RLRI for all education levels combined, nearly half of the countries (31 out of 67) have below-average remote learning readiness (i.e., one or two stars), while 19 countries have above-average remote learning readiness (i.e., four or five stars). Across different education levels, it is evident that the higher the level of education, the more countries achieve above-average remote learning readiness. This trend in remote learning readiness reveals that pre-primary education is often excluded from remote learning responses. Across all education levels, pre-primary has the highest number of countries with one star and the lowest number of countries with four or five stars, indicating that remote learning readiness is particularly weak at this level.
Table 4
RLRI results by region and level of education
| Region | Education level | 1 Star | 2 Stars | 3 Stars | 4 Stars | 5 Stars |
|---|---|---|---|---|---|---|
| East Asia and the Pacific | 1. Pre-primary | 2 | 2 | 2 | 1 | 1 |
| 2. Primary | 0 | 3 | 3 | 3 | 1 | |
| 3. Lower Secondary | 0 | 4 | 2 | 3 | 1 | |
| 4. Upper Secondary | 0 | 3 | 2 | 4 | 1 | |
| 5. Total | 1 | 4 | 1 | 3 | 1 | |
| Eastern and Southern Africa | 1. Pre-primary | 6 | 2 | 1 | 2 | 0 |
| 2. Primary | 4 | 3 | 2 | 2 | 0 | |
| 3. Lower Secondary | 3 | 5 | 1 | 2 | 0 | |
| 4. Upper Secondary | 2 | 6 | 1 | 2 | 0 | |
| 5. Total | 5 | 3 | 1 | 2 | 0 | |
| Eastern Europe and Central Asia | 1. Pre-primary | 0 | 3 | 2 | 1 | 0 |
| 2. Primary | 0 | 0 | 1 | 4 | 1 | |
| 3. Lower Secondary | 0 | 0 | 1 | 3 | 1 | |
| 4. Upper Secondary | 0 | 0 | 1 | 4 | 1 | |
| 5. Total | 0 | 0 | 3 | 3 | 0 | |
| Latin America and the Caribbean | 1. Pre-primary | 0 | 2 | 5 | 3 | 3 |
| 2. Primary | 0 | 0 | 6 | 4 | 3 | |
| 3. Lower Secondary | 0 | 1 | 4 | 4 | 3 | |
| 4. Upper Secondary | 0 | 1 | 5 | 4 | 3 | |
| 5. Total | 0 | 2 | 5 | 3 | 3 | |
| Middle East and North Africa | 1. Pre-primary | 2 | 0 | 0 | 0 | 1 |
| 2. Primary | 0 | 2 | 0 | 1 | 0 | |
| 3. Lower Secondary | 0 | 1 | 1 | 1 | 0 | |
| 4. Upper Secondary | 0 | 1 | 1 | 1 | 0 | |
| 5. Total | 0 | 2 | 0 | 1 | 0 | |
| South Asia | 1. Pre-primary | 2 | 0 | 2 | 1 | 0 |
| 2. Primary | 0 | 2 | 4 | 0 | 1 | |
| 3. Lower Secondary | 0 | 3 | 3 | 1 | 0 | |
| 4. Upper Secondary | 0 | 2 | 4 | 0 | 1 | |
| 5. Total | 1 | 2 | 3 | 1 | 0 | |
| West and Central Africa | 1. Pre-primary | 4 | 8 | 0 | 3 | 0 |
| 2. Primary | 4 | 7 | 3 | 3 | 0 | |
| 3. Lower Secondary | 3 | 4 | 7 | 2 | 1 | |
| 4. Upper Secondary | 3 | 4 | 3 | 4 | 1 | |
| 5. Total | 5 | 6 | 4 | 2 | 0 |
Source: Authors’ calculations based on Multiple Indicator Cluster Surveys (2010–2020) and Demographic and Health Surveys (2010–2020), the first round of the UNESCO-UNICEF-World Bank Survey on National Education Responses to COVID-19 School Closures, May–June 2020, and UNICEF Strategic Monitoring Questions, December 2020.
Table 4 further disaggregates the information by region,22 revealing substantial regional disparities in the number of countries scoring between one and five stars. In some regions, such as Eastern Europe and Central Asia, most of the countries with available data had fairly good remote learning readiness – all countries in this region had average or above-average scores (i.e., three stars or more). Countries in other regions, such as Eastern and Southern Africa and West and Central Africa, performed less well, with the majority of countries with available data scoring below average across almost all levels of education (i.e., one or two stars). In South Asia, for all levels of education, most countries also had average or below-average remote learning readiness, whereas remote learning readiness was more mixed in Middle East and North African countries. In Latin America and the Caribbean and Eastern Europe and Central Asia, countries tended to have average or above-average remote learning readiness.
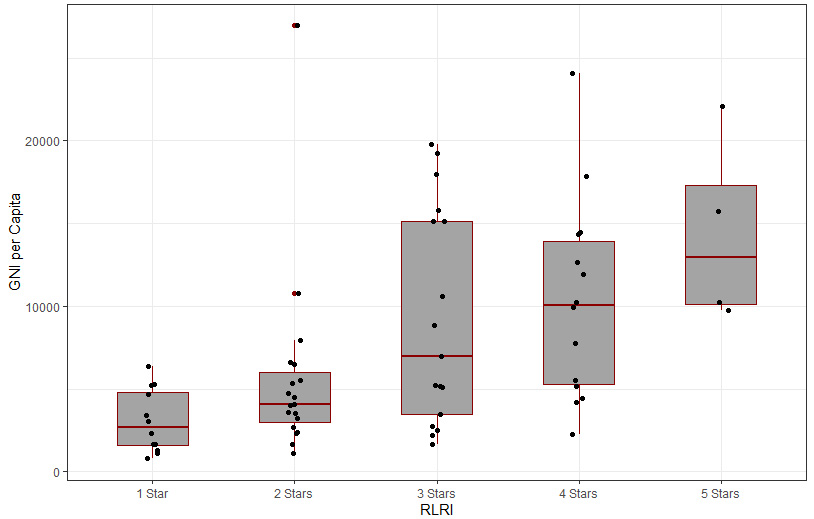
Figure 3.
RLRI by GNI per capita. Source: Authors’ calculations based on Multiple Indicator Cluster Surveys (2010–2020) and Demographic and Health Surveys (2010–2020), the first round of the UNESCO-UNICEF-World Bank Survey on National Education Responses to COVID-19 School Closures, May–June 2020, UNICEF Strategic Monitoring Questions, December 2020, and the World Bank data on GNI per capita.
5.3Economic development and readiness for remote learning
Global overview of the empirical results can mask critical differences in remote learning readiness by country’s income. This section further unpacks the relationship between economic development and the RLRI to explore the assumption of sensitivity of remote learning readiness to the country’s economic development. In Fig. 3, each dot represents a country by GNI per capita to examine the general pattern with relation to the level of remote learning readiness. Although the chart suggests that the higher average values of GNI per capita are associated with the higher ordinal score of RLRI, it is also clear that high group-level variance is observed, especially for the countries scored 3 and 4 stars. With regards to methodological discussion, the results suggest that though the produced index is not fully independent from the level of economic development, the observed group-level variance indicates the possibilities for the lower-income countries to provide the conditions necessary for resilient remote learning.
6.Sensitivity analysis
To check the sensitivity of the index, we aggregated the final score by averaging the input variables. “Following the theoretical assumption of three domains – household, policy, and systemic, we produced arithmetic means of variables by each domain. The idea was to explore how index based on the traditional approach would deviate from the weakest link approach in terms of both performance and interpretation. The average of 6 continuous variables that constitute a household domain was on the scale from 0 to 1. Though policy domain is represented by 4 binary variables, their arithmetic mean also was on the 0–1 scale. Only averaging of ordered ranks from the system preparedness domain produced the results on a 1–4 scale. To unify all the aggregated domains on the same scale, we standardized them to mean value and produced the final index by taking an aggregated average of the calculated domains. The results of association between the final and alternative indices are presented at Fig. 4. First and most surprising finding refers to the variation of the scores in the alternative index. Though the adopted approach was the parametric one, it did not produce a sufficient variation of values, with the final scores of the empirical distribution ranging approximately from
Figure 4.
RLRI and GNI per Capita. Source: Authors’ calculations based on Multiple Indicator Cluster Surveys (2010–2020) and Demographic and Health Surveys (2010–2020), the first round of the UNESCO-UNICEF-World Bank Survey on National Education Responses to COVID-19 School Closures, May–June 2020, and UNICEF Strategic Monitoring Questions, December 2020.
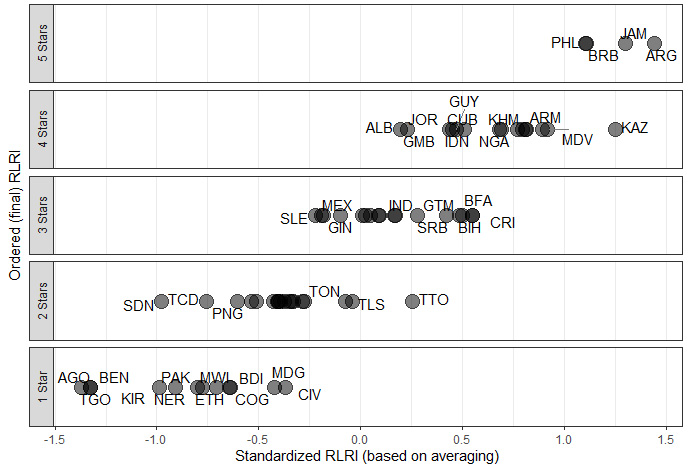
It is clear that though indeed visually higher values of the final RLRI on 1–5 stars scale generally correspond to the higher values of the index based on standardization of average values for each domain, big overlaps are present. As such, many countries in the 1-Star-box overlap with those in the 2-Star box by their alternative index. The differences in approach become explicitly clear if we compare two countries with the similar alternative score, but different original score, such as Albania and India. While the scores of the alternative index for both countries are 0.19 and 0.27 respectively, in the weakest-link-approach Albania scored 4 stars, whereas India 3 stars. Table 5 compares performance of two countries across input variables and domains.
Table 5
Comparison of performance of two approaches to calculate index for Albania and India
| Country | India | Albania |
|---|---|---|
| Household domain | ||
| Radio | 8% | 31% |
| TV | 62% | 98% |
| Mobile | 93% | 98% |
| PC | 7% | 48% |
| Internet | 9% | |
| Mother’s education | 43% | 44% |
| Policy response domain | ||
| Radio policy | 1 | 0 |
| TV policy | 1 | 0.75 |
| Online policy | 1 | 0.75 |
| Teacher training | 1 | 0.75 |
| System preparedness to emergency domain | ||
| Risk assessment | 2.5 | 2.5 |
| Risk reduction strategy | 3 | 2.5 |
| Human and financial resources | 2 | 2 |
| Original RLRI | ||
| Household factors | Medium-Low | Medium-High |
| Policy response | High | Medium-High |
| Emergency preparedness | Medium-High | Medium-High |
| Original RLRI | 3 Stars | 4 Stars |
| Alternative RLRI | ||
| Household factors | 0.654 | |
| Policy response | 1.621 | 0.088 |
| Emergency preparedness | 0.116 | |
| Alternative RLRI | 0.278 | 0.197 |
Source: Authors’ calculations based on Multiple Indicator Cluster Surveys (2010–2020) and Demographic and Health Surveys (2010–2020), the first round of the UNESCO-UNICEF-World Bank Survey on National Education Responses to COVID-19 School Closures, May–June 2020, and UNICEF Strategic Monitoring Questions, December 2020.
From the data in Table 5 it is seen that the major domain where India falls behind Albania refers to the demand-side factors observed at the household level, where India falls on 0.9 standard deviations behind the sample average. However, due to the substitute nature of the conventional approach based on averaging, it gets the score of 0.278, which puts the country above Albania with the average value of alternative index equal to 0.197. Approach that adopts the idea of a weakest link, on the opposite, puts the emphasis on the weakest part of the educational system that requires improvement. Further, while the alternative index based on the traditional approach produces the parametric value, it is hard to interpret and produce policy implications based on that. The difference of 0.08 standard deviations between the scores of two countries is hardly interpretable and cannot be translated into the meaningful policy action, as it takes the average of things which are different by nature. On the opposite, ordinal ranks produced on the weakest link have a clear implication: by investing into the household-level factors, especially, expanding digital infrastructure, India could substantially improve the readiness to remote learning. Though the changes in household-level factors need long time to produce the effect, a short-term improvement could be reached by increasing system preparedness to emergency, with specific emphasis on the risk reduction strategies.
7.Limitations
Two major limitations exist in the context of the RLRI, and both are imposed by the data. While the household domain mostly refers to issues related to the household possessions, sufficient data are not available on actual learning outcomes. Having the necessary ICT assets at home is not enough to ensure a schoolchild can actually learn. Potential obstacles can occur due to the number of assets, the size and composition of the household, stability of the home’s internet connection, and so on. Furthermore, having an educated parent does not automatically mean that a child can count on parental support. In future rounds of the RLRI assessment, when more countries participate in MICS6 and will release data, it may be possible to include parental engagement in child’s learning to account for this issue. Since data on learning outcomes are currently only available for a limited number of countries, its inclusion in the initial RLRI assessment was not feasible.
The second limitation refers to the policy response domain. For the initial RLRI assessment, the data used to produce this domain were collected in May–June 2020, at the beginning of the pandemic. As such, subsequent improvements in countries’ policy responses were not captured. More and more countries have been moving toward hybrid learning that combines in-person and remote instruction, a fact that will be reflected in future RLRI assessments.
8.Conclusions
This paper summarizes an assessment of the readiness of low- and middle-income countries to deliver remote learning in response to events that lead to school closures using a new metric called the Remote Learning Readiness Index (RLRI). By aggregating the three key domains of remote learning – household factors, policy responses, and emergency preparedness – the index offers a succinct overview of the current status of a country’s education sector in terms of its ability to provide schoolchildren with opportunities to continue their education during school closures. With new strains of virus continuing to emerge, schools in some countries could remain partially or fully closed, which suggests that remote learning will continue to play an important role in delivering education for the foreseeable future. Furthermore, remote learning opens opportunities for providing education to children in humanitarian or emergency contexts, which accentuates the relevance of the index beyond the COVID-19 crisis.
The methodology behind the index is based on the novel, innovative approach that emphasizes the weakest parts of the education system in terms of readiness to avoid disruptions in delivering education. By assuming that the relationship between the demand, supply, and emergency preparedness factors of education is not substitute but complementary, the index departs from traditional approaches based on averages of disparate things and weighting components. In a simplistic manner, it summarizes a country’s stand in terms of readiness to support learning in case of emergency by giving a stronger importance to those aspects of education, where performance of a country should be improved. That, in turn, makes RLRI suitable for a policy discussion as the focus on the weakest links also makes the index sensitive to the country’s improvement in time. Importantly, the study revealed that RLRI scores do not establish a strong association with a country’s GNI per capita, suggesting that even countries with limited resources can provide remote learning programs for most students and build a resilient system of where most of students can access education in spite of potential crises.
Notes
2 The numbers in Table 4 should not be interpreted as the aggregated regional estimates as they do not cover a sufficient number of countries.
References
[1] | UNESCO. Education: From disruption to recovery. [Online]. (2021) . Available from: https://en.unesco.org/covid19/educationresponse. |
[2] | UNESCO, UNICEF, World Bank. What Have We Learnt? Findings from a survey of ministries of education on national responses to COVID-19. (2020) . |
[3] | UNESCO. Global education monitoring report, 2020: Inclusion and education: all means all. (2020) . |
[4] | Avanesian G, Borovskaya M, Mishra S, Fedosova T, Egorova V. Economic Inequality in the Access to Remote Learning Assets Amongst Youth in BRICS Countries: What Can We Learn from Pre-COVID-19 Data? HSE Economic Journal. (2021) ; 359–378. |
[5] | Dreesen T, Akseer S, Brossard M, Dewan P, Giraldo JP, Kamei A, et al. Promising Practices for Equitable Remote Learning. Emerging lessons from COVID-19 education responses in 127 countries. UNICEF Office or Research, Research Brief. (2020) . |
[6] | UNICEF. COVID-19: Are children able to continue learning during school closures? A global analysis of the potential reach of remote learning policies. [Online]. (2020) a. Available from: https://data.unicef.org/resources/remote-learning-reachability-factsheet/. |
[7] | Avanesian G, Mizunoya S, Amaro D. How many students could continue learning during COVID-19-caused school closures? Introducing a new reachability indicator for measuring equity of remote learning. International Journal of Educational Development. (2021) . |
[8] | World Bank. ENDING LEARNING POVERTY: What will it take. [Online]. (2019) . Available from: https://openknowledge.worldbank.org/handle/10986/32553. |
[9] | UNICEF. COVID-19 and School Closures: One Year of Education Disruption. New York; (2021) a. |
[10] | Conto CA, Akseer S, Dreesen T, Kamei A, Mizunoya S, Rigole A. Potential effects of COVID-19 school closures on foundational skills and Country responses for mitigating learning loss. International Journal of Educational Development. (2021) . |
[11] | Engzell P, Frey A, Verhagen MD. Learning loss due to school closures during the COVID-19 pandemic. Proceedings of the National Academy of Sciences of the United States of America. (2021) . |
[12] | Azevedo JP, Hasan A, Goldemberg D, Geven K, Iqbal SA. Simulating the Potential Impacts of COVID-19 School Closures on Schooling and Learning Outcomes: A Set of Global Estimates. The World Bank Research Observer. (2021) . |
[13] | Kaffenberger M. Modelling the long-run learning impact of the Covid-19 learning shock: Actions to (more than) mitigate loss. International Journal of Educational Development. (2021) . |
[14] | Nugroho D, Pasquini C, Reuge N, Amaro D. COVID-19: How are Countries Preparing to Mitigate the Learning Loss as Schools Reopen? Trends and emerging good practices to support the most vulnerable children. UNICEF Office of Research, Research Brief. (2020) . |
[15] | UNESCO, World Bank, UNICEF. UNICEF. [Online]. (2021) . Available from: https://www.unicef.org/media/98861/file/Mission%20:%20Recovering%20Education%20in%202021.pdf. |
[16] | Mackey J, Gilmore F, Dabner N, Breeze D, Buckley P. Blended Learning for Academic Resilience in Times of Disaster or Crisis. MERLOT Journal of Online Learning and Teaching. (2012) . |
[17] | Shiwaku K, Ueda Y, Oikawa Y, Shaw R. School Disaster Resilience Assessment: An Assessment Tool. In Shiwaku K, Sakurai A, Shaw R, eds. Disaster Resilience of Education Systems: Experiences from Japan. Springer; (2016) . pp. 105–130. |
[18] | Shah AA, Gong Z, Ali M, Jamshed A, Naqvi SAA, Naz S. Measuring education sector resilience in the face of flood disasters in Pakistan: an index-based approach. Environmental Science and Pollution Research. (2020) . |
[19] | Shah R, Paulson J, Couch D. The Rise of Resilience in Education in Emergencies. Journal of Intervention and Statebuilding. (2020) . |
[20] | Weidlich J, Kalz M. Exploring predictors of instructional resilience during emergency remote teaching in higher education. International Journal of Educational Technology in Higher Education. (2021) . |
[21] | Badiozaman IFA. Exploring online readiness in the context of the COVID 19 pandemic. Teaching in Higher Education. (2021) . |
[22] | UNICEF Office of Research. REOPENING WITH RESILIENCE: Lessons from remote learning during COVID-19. (2021) . |
[23] | UNICEF. Ensuring equal access to education in future crises: Findings of the new Remote Learning Readiness Index. New York; (2021) . |
[24] | Jerrim J, Micklewright J. Socioeconomic Gradients in Children’s Cognitive Skills: Are Cross-Country Comparisons Robust to Who Reports Family Background? IZA Discussion Paper No. 8392. (2014) . |
[25] | Prahmana RCI, Hartanto D, Kusumaningtyas DA, Ali RM, Muchlas. Community radio-based blended learning model: A promising learning model in remote area during pandemic era. Heliyon. (2011) . |
[26] | Pregowska A, Masztalerz K, Garlińska M, Osial M. A Worldwide Journey through Distance Education – From the Post Office to Virtual, Augmented and Mixed Realities, and Education during the COVID-19 Pandemic. Education Sciences. (2021) . |
[27] | Education Development Center, Inc. TUNED IN TO STUDENT SUCCESS: ASSESSING THE IMPACT OF INTERACTIVE RADIO INSTRUCTION FOR THE HARDEST-TO-REACH. (2009) . |
[28] | Treviño E, Miranda C, Hernández M, Villalobos C. Socioeconomic Status, Parental Involvement and Implications for Subjective Well-Being During the Global Pandemic of Covid-19. Frontiers in Education. (2021) . |
[29] | Muñoz-Najar A, Gilberto A, Hasan A, Cobo C, Azevedo JP, Akmal M. Remote Learning During COVID-19: Lessons from Today, Principles for Tomorrow. (2021) . |
[30] | Zou B, Huang L, Ma W, Qiu Y. Evaluation of the effectiveness of EFL online teaching during the COVID-19 pandemic. SAGE Open. (2021) . |
[31] | Pozo-Rico T, Gilar-Corbí R, Izquierdo A, Castejón JL. Teacher Training Can Make a Difference: Tools to Overcome the Impact of COVID-19 on Primary Schools. An Experimental Study. International Journal of Environmental Research and Public Health. (2020) . |
[32] | Maity S, Sahu TN, Sen N. COVID-19 and Digital Primary Education: Impact and Strategies for Sustainable Development. Journal of Development Policy and Practice. (2021) . |
[33] | Diliberti MK, Schwartz HL, Hamilton LS, Kaufman JH. Prepared for a Pandemic? How Schools’ Preparedness Related to Their Remote Instruction During COVID-19. (2020) . |
[34] | Alsaywid B, Lytras MD, Abuzenada M, Lytra H, Sultan L, Badawoud H, et al. Effectiveness and Preparedness of Institutions’ E-Learning Methods During the COVID-19 Pandemic for Residents’ Medical Training in Saudi Arabia: A Pilot Study. Frontiers in Public Health. (2021) . |
[35] | Seetal I, Gunness S, Teeroovengadum V. Educational disruptions during the COVID-19 crisis in Small Island Developing States: Preparedness and efficacy of academics for online teaching. International Review of Education volume. (2021) . |
[36] | UNESCO. Building back resilient: how can education systems prevent, prepare for and respond to health emergencies and pandemics? (2021) . |


