
From local prices to the global economy: A unique global collaboration that underpins the International Comparison Program
Abstract
The International Comparison Program (ICP) is a unique example of enduring statistical cooperation and collaboration across national, regional, and global agencies. For over fifty years, the Program has delivered a vital public good: purchasing power parities (PPPs) and price level indexes (PLIs) for economies across the globe. PPPs enable a wealth of metrics on economic output, material well-being, and consumption, as well as a host of PPP-based indicators across the socioeconomic spectrum, many of which are used for monitoring progress towards the Sustainable Development Goals. Fundamental to these data and metrics is cross-country comparability, and the ICP’s multi-agency partnership ensures that this is achieved through agreement on common statistical standards and methods in price data collection, in national accounts expenditure data compilation, in quality assurance, and in the calculation and dissemination of results. Working within a comprehensive governance structure overseen by the United Nations Statistical Commission, the ICP Global Office at the World Bank, and five regional agencies, together with Statistical Office of the European Union (Eurostat) and Organisation for Economic Co-operation and Development (OECD), collaborate with over 170 national agencies to ensure that the work carried out across all economies adheres to these established benchmarks and processes, resulting in both bespoke ICP price collections that reflect both nationally relevant and globally comparable goods and services, and expenditure data that follow international standards. This paper presents an overview of this unique global partnership and highlights how different challenges and processes are addressed by stakeholders working with shared knowledge towards a common goal.

1.Introduction
In the last few years, it has become increasingly apparent that local events can have global economic repercussions. To assess and react to these dynamics, comprehensive and consistent data are needed from countries across the world, requiring close collaboration and cooperation between national, regional, and multilateral agencies to ensure data comparability and relevance. The International Comparison Program (ICP)22 is an exemplar of this type of global statistical partnership, producing a global public good of cross-country comparable economic data using the concept of purchasing power parities (PPPs), as well as enabling a host of essential indicators and data across the socioeconomic and policy-making spectrums.
The comparability of results between economies is the fundamental tenet of the ICP and thus requires collaboration and agreement by all the Program’s stakeholders throughout its statistical value chain: from conducting research into what needs to be measured to establishing methodology and common standards and guidelines; identifying, collecting, and compiling appropriate price and expenditure data and validating those data; processing and calculating results; carrying out quality assurance; to analyzing results and disseminating them to users with appropriate guidance.
A previous paper published by the Statistical Journal of the International Association for Official Statistics (IAOS) [1] “Lessons learned about global statistical initiatives from the International Comparison Program”, reflected on the elements crucial to an effective global statistical system – namely governance, standards and methodology, coordination, resources, and communication. The author examined these in the context of the ICP 2005 cycle and went on to propose modifications and enhancements for future cycles. Since then, the ICP has completed two more cycles – in 2011 and 2017 – and is currently conducting the 2021 cycle. This paper reviews how the ICP, as one of the largest international statistical collaborations in the world, relies on inter-agency cooperation, working under a robust governance framework and to common standards within an agreed methodology, to meet its objectives today, and looks towards how the ICP will adapt to the changing landscapes of data availability, technology, and retail to consumer dynamics.
2.Background
2.1Objectives and outputs
The main objectives of the ICP are to (i) produce PPPs and comparable price level indexes (PLIs) for participating economies and (ii) convert volume and per capita measures of gross domestic product (GDP) and its expenditure components into a common currency using PPPs.
PPPs provide a measure of what an economy’s local currency can buy in another economy and are calculated based on the prices of items within a common basket of goods and services in each participating economy and the share of expenditure made on each of these items within the economy. PPP-based conversions of expenditures eliminate the effect of price level differences between economies and hence reflect only differences in the volume of expenditures. The alternative – market exchange rate-based conversions – reflect both price and volume differences in expenditures and are thus inappropriate for volume comparisons. The spatial PLI for each economy is the ratio of its PPP to its market exchange rate.
Results for the ICP 2017 cycle are available for 176 economies and cover 44 expenditure headings. Indicators for each heading include PPPs (based upon the United States dollar set equal to 1), PLIs, national accounts expenditures and per capita expenditures in both PPP and market exchange rate-based terms. Furthermore, each economy’s share of global expenditure within a heading and the share of a heading’s expenditure within GDP are provided. These 2017 results, results for previous benchmark years, and annual PPPs for interim years are available through the World Bank’s databank.33
2.2Methodology and processes
The crux of the ICP is the provision of economic output data that are comparable across economies. This is enabled by the consistent and universal adoption of the same methodology for data collection, compilation, and the subsequent calculation of PPPs for all economies in each region. The current standards and procedures agreed by the governance bodies (see Section 3) are the result of evolving methodological innovations over the last few decades, and are inclusive of modern markets and service delivery, and contemporary methods of purchasing, as well as reflecting more traditional consumer structures across the world.
Overall, the ICP methodology has three major components. The first is the System of National Accounts (SNA) definition of final expenditures on GDP. The second is the basket of goods and services from which items are selected for pricing: these items should be comparable across economies and, at the same time, represent an important part of each economy’s final purchases. The national annual average prices or related data collected for these goods and services must be consistent with the underlying values in the national accounts. The third component is the methodology used to compute PPPs, first within regions for the regional comparisons, and then across regions for the global comparison.
2.3Uses
PPPs are used to establish a wealth of comparable cross-country indicators on expenditure, consumption, and income which span a wide range of themes under the economic, environmental, and social development umbrellas. The 2021 World Bank publication “Purchasing power parities for policy making: a visual guide to using data from the International Comparison Program” [2] provides an illustrative overview of the policy areas that rely on PPP-based indicators. These include the size of the economy and price levels; poverty and inequality; trade and competitiveness; labor costs, wages, and social safety nets; food and nutrition; health, education; energy and climate; infrastructure; human development; and administrative uses. Examples of applications by the Statistical Office of the European Union (Eurostat), the Food and Agriculture Organization (FAO), the International Energy Agency (IEA), the International Labour Organization (ILO), the International Monetary Fund (IMF), the International Telecommunication Union (ITU), the Organisation for Economic Co-operation and Development (OECD), the United Nations Development Program (UNDP), the United Nations Educational, Scientific and Cultural Organization (UNESCO), the World Economic Forum (WEF), the World Health Organization (WHO), and the World Bank are provided in the publication. Many regional organizations also apply PPPs in their monitoring of their member economies’ development and region-specific analysis.
Many PPP-based indicators are used in monitoring progress towards the Sustainable Development Goals (SDGs). One of the most high-profile uses of PPPs is the establishment of the international poverty line, based on daily income or consumption expressed in PPP dollars. As of June 2022, it stands at $1.90 a day in 2011 PPP dollars and was originally based on national poverty lines found in some of the poorest countries. The proportion of people living below this line in each country is used to monitor progress towards both SDG target 1.1 and the World Bank’s goal of eradicating extreme poverty. Two other lines based on the national poverty lines in countries classified as lower-middle-income ($3.20 2011 PPP) or as upper-middle-income ($5.50 2011 PPP) are also used in many analyses looking at relative poverty.
Turning to SDG 2, PPP-based measures of the revenue of small-scale producers and agricultural output are used to compare agricultural productivity across countries. In SDG 3, target 3.1 seeks to reduce the proportion of mothers who die in childbirth, and the modeled indicator used to monitor this across the world uses PPP-converted GDP. Target 3.8 looks at achieving universal health coverage, and analyses exploring this apply PPPs to compare out-of-pocket expenditures on health in different countries as well as the number of people pushed below the poverty line by catastrophic expenditures. At the same time, SDG 4 compares expenditures by both government and households on education using PPPs while SDG 7 tracks energy efficiency by measuring the amount of energy used to produce one PPP dollar’s worth of goods and services. SDG 8 uses PPP-based GDP per person employed to monitor economic productivity across countries and, in SDG 9, target 9.4 monitors progress toward sustainable, efficient, and clean industry and measures carbon dioxide emissions per unit of PPP-converted GDP, while target 9.5 encourages scientific innovation and monitors spending on research and development using PPP dollars. Additionally, an indicator used to monitor progress towards SDG 11 expresses total expenditure on the preservation, protection, and conservation of all cultural and natural heritage in PPP dollar terms.
Beyond the SDGs, other notable uses include the UNDP’s Human Development Index, which measures average achievement in three basic dimensions of human development – a long and healthy life, knowledge, and a decent standard of living – with the latter measured through PPP-based gross national income (GNI) per capita. The related Gender Development Index estimates a separate PPP-based GNI per capita for men and for women as part of its inputs. Furthermore, the OECD’s Better Life Index uses three PPP-based indicators: household net adjusted disposable income, household net wealth, and personal earnings. On a related note, WHO expresses many of its health expenditure metrics, such as government, private, and external expenditures, in PPP terms to enable cross-country analysis.
WEF’s Global Competitiveness Index uses GDP and the value of imports measured using PPPs in its tenth pillar on market size while the Travel and Tourism Competitiveness Index includes the ratio of a country’s PPP to the official market exchange rate in its price competitiveness measure. The World Bank also uses PPPs to facilitate comparisons of public service pay and wage bill data across countries. The Global Innovation Index published by Cornell University, Institut Européen d’Administration des Affaires (INSEAD), and the World Intellectual Property Organization (WIPO), provides data on innovation assisting countries in evaluating their innovation performance and making informed innovation policy considerations. Many of the index’s metrics are measured per unit of PPP-based GDP and additional inputs include the growth rate of PPP-based GDP per person employed, PPP-based GDP per unit of energy use, and domestic market scale as measured by PPP-based GDP. The Central Bank of West African States (BCEAO) and Bank of Central African States (BEAC), and Union Economique et Monétaire Ouest Africaine (UEMOA) use PPP-based GDP to monitor official market exchange rates, price competitiveness, economic convergence, and statistical harmonization in member states.
Other examples of using PPPs as spatial price deflators include cross-country comparisons of the value of social safety nets, unpaid care work, minimum wages, cost of broadband and information and communications technology (ICT) services, expenditure on research and development, the cost of violence and natural disasters, the cost of disease and potential savings through reduced child mortality, and better nutrition and other medical interventions.
PPPs are also used for the compilation of statistical indicators: international organizations use PPPs to obtain totals and averages for a group of economies such as a region or income group. PPP-based GDP and its components are aggregated across the economies in a group to obtain totals for the group. The shares of economies in these totals are used as weights when economic indicators, such as price indexes or growth rates, are combined to obtain averages for the group. Both the IMF and the OECD use PPP-based GDP and GDP aggregates to provide estimates of regional and world output and growth.
Additionally, the European Commission, the IMF, and the World Bank employ PPPs for administrative purposes. The European Commission uses the PPPs of its member states when allocating the structural funds intended to reduce economic disparities between and within member states. The principal indicator influencing the allocation is PPP-deflated intra-country regional GDP per capita. The IMF uses PPP-based GDP in its current quota formula. Quota subscriptions determine the maximum financial resources that member economies are obliged to provide the IMF, the amount of financing that members can obtain from the IMF, their share in a general allocation of Special Drawing Rights, and their voting power in IMF decisions. PPP-based GDP currently has a weight of 20 percent in the current quota formula, which reflects the deliberations44 and decision55 of the IMF Executive Board in 2008 that identified PPP-based GDP as a relevant way to reflect the relative volume of goods and services produced by economies. Similarly, the World Bank Group incorporates PPPs into its dynamic formula which provides the necessary anchor and a data-driven analysis for shareholding discussions reflecting the evolution of the global economy and countries’ contributions to the World Bank Group mission. The shareholding rights of the International Bank for Reconstruction and Development (IBRD) member countries are largely based on economic weight at the global level of which PPP-based GDP currently contributes 40 percent and market exchange rate-based GDP 60 percent.
Turning to the use made of the vast data collected by the Program, the Food Prices for Nutrition collaboration between the World Bank, Tufts University, and the International Food Policy Research Institute (IFPRI) uses ICP food price data to provide accurate metrics to monitor diet costs and affordability which subsequently inform agricultural and food systems interventions. These metrics have been used to inform the least costs of different food groups of nutrient-dense foods, of energy-adequate, nutrient-adequate, and healthy diets across the globe, as well as the burden of these costs on the global poor as presented in the annual State of Food Security and Nutrition reports published by FAO and others [3].
Another use of ICP data is the World Bank’s Worldwide Bureaucracy Indicators which uses data collected by the Program on the compensation of public sector employees to calculate pay compression ratios.
2.4History
The ICP has relied on the close collaboration of a number of agencies since its inception. The Program’s precursor – the International Comparison Project – was established in response to discussions within the United Nations Statistical Commission (UNSC) in 1965 about the inherent problems of market exchange rate-based comparisons of economic output. A project to investigate PPP-based comparisons using a small group of economies representative of different income levels, social systems, and geographic areas to test and assess methodology was launched in 1968 as a joint undertaking between the United Nations Statistical Office (UNSO) and the University of Pennsylvania, with funding and assistance provided by the Ford Foundation, the World Bank, the United States Agency for International Development, the United States-based Social Science Research Council, the United Kingdom, as well as by a grant from the Scandinavian economies. The UNSO was responsible for supervising the project while an advisory board was set up to provide technical advice.
A pilot study was conducted based on data collected in 1967 for six economies (Hungary, India, Japan, Kenya, the United Kingdom, and the United States). Data from another four economies (Colombia, France, Germany, and Italy) were added in 1970. Different sets of estimates, including multilateral comparisons between all ten economies for GDP and a range of expenditure components for 1970 were published in 1975. Since then, a further eight comparisons of final expenditure on GDP have been completed: 1973 (16 economies), 1975 (34 economies), 1980 (60 economies), 1985 (64 economies), 1993 (115 economies), 2005 (146 economies), 2011 (199 economies), and 2017 (176 economies). After the 1975 comparison, the ICP shifted from being a research project to being a regular operational component of the UNSO work program. It was also regionalized, whereby comparisons were organized by region and then combined to obtain a global comparison.
Following a major review of the ICP in 1997, the UNSC asked the World Bank to consult with stakeholders and propose a strategy to address deficiencies identified by the review. This included mobilizing funds from a variety of sources and providing complete and clearly written documentation on the ICP’s technical and procedural guidelines and standards. Such guidelines would allow economies to use, as far as possible, regular national statistical programs to obtain price and national accounts data for the ICP and linking participation in the ICP to national statistical capacity building.
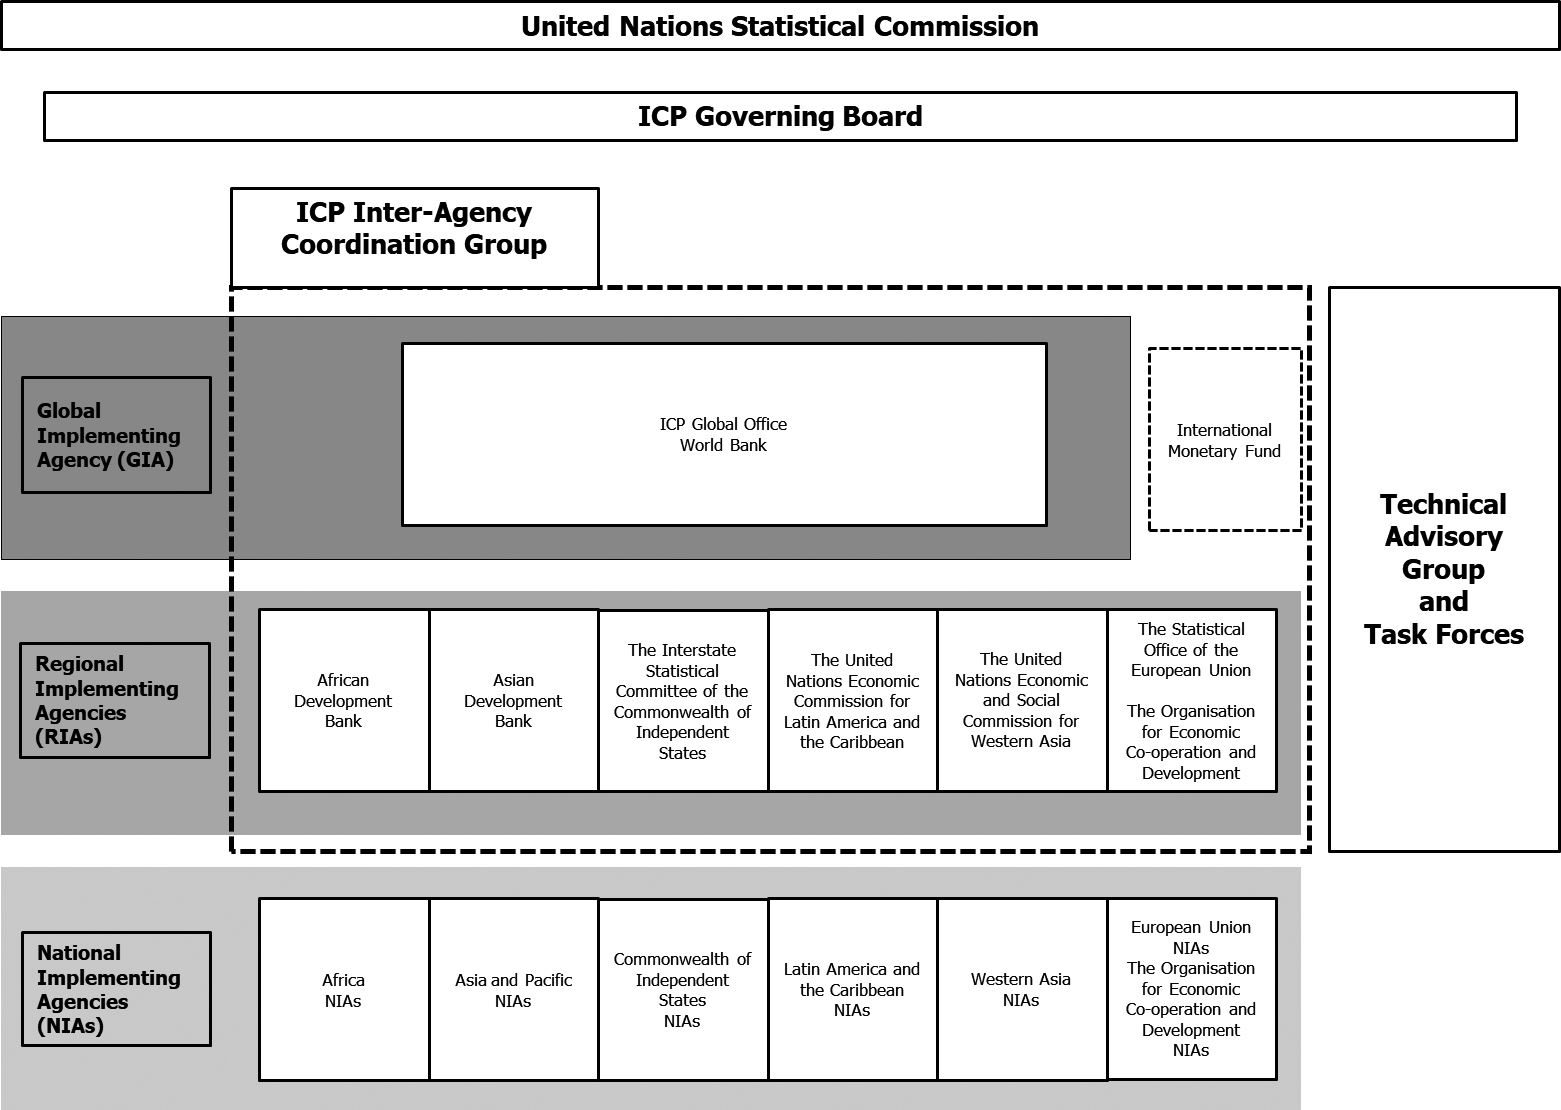
A governance structure was put in place that would provide effective management and coordination between the global center and the regions and between the regions and the participating economies. In doing so, it would ensure that each region produced results consistent with those of other regions and that regional results could be combined in a global comparison. The structure had several tiers: the UNSC, the Executive/Governing Board, the ICP Global Office, the Technical Advisory Group (TAG), the regional implementing agencies, and the national implementing agencies. This strengthened governance arrangement contributed significantly to the successful conclusion of the 2005 and 2011 comparisons and the timely publication of their results.
A review of the ICP 2011 cycle prompted the UNSC in 2016 to decree the continuation of the federated governance approach while recommending that it should be more country-driven, inclusive, participatory, and transparent, as well as lighter and adaptable to meet the needs of an evolving permanent exercise. At the same time, the UNSC made a number of key decisions regarding the future of the Program including:
• instituting the ICP as a permanent element of the global statistical work program, to be conducted at more frequent intervals;
• keeping the general methodology stable for the 2017 comparison cycle and developing a research agenda for future rolling benchmarks;
• exploring a closer alignment of the ICP and consumer price index (CPI) price surveys in order to reduce the burden on countries, and to enhance the quality of price statistics in general; and
• linking the ICP capacity building activities to efforts to enhance statistical capacity for monitoring the SDGs.
As a result of these decisions, the ICP Governing Board adopted an updated ICP governance framework in November 2016 outlining the roles and responsibilities of each of the participating bodies for the ICP 2017 cycle. This structure remains in place for the current 2021 cycle and is expanded upon in the next section, illustrating the cross-agency collaboration that is vital to the Program’s success. Further reading on the program’s history and past efforts across regions to produce PPPs are provided in Appendix A of the 2017 ICP report.66
Figure 1.
International Comparison Program governance structure.
3.Global governance
The overall mandate of the current ICP governance framework77 is to ensure that the global, regional, and national efforts to produce reliable PPP estimates and related measures of expenditures adhere to approved policies, protocols, methodologies, and quality assurance standards, and that the estimates are produced efficiently, in keeping with available resources.
The framework outlines the current governance structure (Fig. 1) and the roles and responsibilities of each of the governance bodies. Crucially, the top tiers consist primarily of national Chief Statisticians whose staff are charged with carrying out the ICP work in participating economies. In this way, national agencies both lead and implement the functions of the ICP, with assistance from agencies at the global and regional levels.
The roles of each governance body are elaborated upon below and describes how they make decisions, take actions, and move the Program forward over the course of an ICP cycle.
3.1United Nations Statistical Commission
The UNSC, consisting of Chief Statisticians from member states from around the world, is the ultimate stakeholder of the ICP and decides the frequency and operational modality of the Program. The Commission establishes the ICP Governing Board, ensuring adequate representation of countries and multilateral organizations, and selects the Global Implementing Agency. Furthermore, it may review and modify the governance structure and membership of the governing bodies every three years, or more frequently if needed. The Commission considers an annual report of ICP activities during its session held in March of each year, makes proposals and decisions on the Program’s modalities, and encourages countries to adopt the ICP into their national statistical schedules and find synergies with domestic programs such as consumer price indexes.
3.2 ICP Governing Board
The ICP Governing Board (GB) consists of Chief Statisticians or senior-level directors of statistics from a regionally-representative group of participating economies, as well from the five regional implementing agencies, Eurostat, OECD, the IMF, and the World Bank.88 Country representatives typically sit for one ICP cycle, and two members are invited to co-chair for that duration; for the current 2021 cycle Finland and South Africa are taking on this role. The Board is a strategic and policy-making body, meeting annually and more frequently, if necessary, with responsibility for setting the policies and protocols that govern the production of regional and global PPP estimates. It establishes the ICP Technical Advisory Group (TAG) and approves the technical research agenda and methodology for producing PPPs. Furthermore, the Board ensures that this production process follows the agreed policies, methodology, and timetables to secure the integrity of the estimates, and that a sustainable funding model supporting the frequency and operational modality of the Program is established. The Board is also tasked with demonstrating the value of the ICP to policy makers in order to ensure that the Program is included in the regular national statistical work and to increase national funding for the ICP, with ensuring that the Program responds to users’ needs, and with establishing an ICP Data Access Policy99 and ICP Revision Policy.1010
3.3Technical Advisory Group
The TAG is formed by the ICP Governing Board, and has a membership of leading academics, practitioners, former Chief Statisticians, and prominent users.1111 Members are typically eminent experts in the fields of index numbers, PPPs, price statistics, and national accounts, with knowledge of national statistical systems and capacity-building challenges across various regions. The current Chair is Nobel Laureate Sir Angus Deaton while Paul Schreyer, Director and Chief Statistician the OECD Statistics and Data Directorate, holds the Alternate Chair position. Members participate in their own independent capacity and not as representatives of any specific region or institution. The Group convenes annually and on an ad hoc basis as necessary, such as to discuss and approve the PPP estimates and ICP results before publication, and, most recently in late 2021, to discuss the effect of the COVID-19 pandemic on national statistical programs, price indexes and national accounts, and on ICP and PPP production. The TAG’s responsibilities are to assure users of the methodological soundness and overall quality of the PPP estimates; ensure transparency of the PPP estimation process; and support the establishment of a permanent and more frequent ICP. The TAG, in collaboration with the Inter-Agency Coordination Group (IACG), sets forth a technical research agenda to inform future ICP comparisons, for the Governing Board’s review and approval. The TAG forms Task Forces on specific topics and invites recognized experts on the practical application of index numbers, PPPs, price statistics, and national accounts to take part in them, as needed, to develop concrete proposals to address the various research agenda items.
3.4Inter-Agency Coordination Group
The IACG comprises the World Bank as the global implementing agency, the regional implementing agencies (RIAs) – which encompass the African Development Bank (AfDB),1212 the Asian Development Bank (ADB),1313 the Interstate Statistical Committee of the Commonwealth of Independent States (CIS-STAT),1414 the United Nations Economic Commission for Latin America and the Caribbean (UN-ECLAC),1515 and the United Nations Economic and Social Commission for Western Asia (UN-ESCWA)1616 – and Eurostat,1717 and the OECD.1818 The IMF is also a member of the Group as it is among the lead agencies with regards statistical capacity-building activities related to economies’ CPIs and national accounts.
The Group typically convenes twice a year and on an ad hoc basis when the need arises, with the Global Office taking the role of Chair as well as providing secretariat duties. The IACG decides on timetables and work plans across all regions for data collection, validation, calculation, and dissemination for each ICP cycle. To support the ICP’s objectives of comparability of results across all economies the Group develops common standards and protocols for the Program alongside operational guidelines and tools such as classifications, lists of items to be priced, and survey forms. It also provides the quality assurance standards that national and regional data and metadata must satisfy to be included in the global PPP estimates. The Group actively promotes and supports the integration of ICP and CPI production processes to decrease the burden on participating economies and regularly takes stock of existing capacity-building activities undertaken by the various agencies in the areas of prices and national accounts and develops and implements statistical capacity building activities related to the ICP. As noted above, the IACG works with the TAG to develop a technical research agenda on the methodological choices and implementation arrangements to inform future ICP comparisons.
3.5Implementing agencies
As the global implementing agency, the World Bank is responsible for establishing the ICP Global Office, which supports the ICP governance framework and its bodies and undertakes the coordination, implementation, and day-to-day management of the global exercise. As part of its remit the ICP Global Office drafts and implements common policies and procedures for data and metadata sharing between the implementing agencies and drafts operational guidelines and materials to support the conduct of the Program. It also provides technical support to the regions and participating economies on the implementation of standards, data validation, analysis, and computation of regional results. The Global Office assesses national and regional data and metadata submitted by the regions against the quality assurance standards agreed to by the IACG to determine their suitability for inclusion in the global PPP calculations. It also links the regional data and calculates, validates, and disseminates the global ICP results as per the agreed timetables. With regards to the release of results the Office implements the ICP results dissemination policy and manages relevant databases, ensuring that access to detailed ICP data and metadata is granted per the ICP data access policy. It also prepares the annual reports to the UNSC.
The five RIAs are responsible for coordinating and implementing the regional ICP comparisons and producing and disseminating regional ICP results. Alongside their commitments as part of the IACG the RIAs carry out day-to-day management of the regional programs, plan and implement the regional ICP activities in-line with the agreed global timetables, carry out regional capacity-building activities, and provide technical support to the countries on data and metadata collection and validation ensuring they meet the prescribed standards. The RIAs prepare and disseminate regional ICP results and transmit these to the Global Office as per the data access policy.1919
Eurostat and OECD undertake their own permanent PPP Programme within the countries under their responsibility and produce and disseminate its results on an annual basis. These results are linked to, and included in, the global ICP. As members of the governing bodies, they contribute to steering the ICP’s agenda and workplan, as well as the preparation of operational guidelines and materials.
The National Implementing Agencies (NIAs) within each participating economy are typically national statistical offices or central banks, with staff drawn from price statistics and national accounts divisions. NIAs are responsible for planning and implementing national ICP activities, including carrying out the price surveys and compiling the national account expenditure data necessary for estimating PPPs according to the agreed standards and protocols. They carry out quality assurance and share data and metadata with the regional agencies. NIA staff regularly participate in regional workshops and activities to discuss operational guidelines and materials, data and metadata quality, and preliminary and final regional results. Table 1 lists the 176 participating economies within each regional comparison for the ICP 2017 cycle.
Table 1
International Comparison Program 2017 cycle: Participating economies by region
| Africa: 50 economies |
| African Development Bank (AfDB) |
| Algeria; Angola; Benin; Botswana; Burkina Faso; Burundi; Cameroon; Cabo Verde; Central African Republic; Chad; the Comoros; the Republic of Congo; the Democratic Republic of Congo; Côte d’Ivoire; Djibouti; Arab Republic of Egypt; |
| Asia and the Pacific: 22 economies |
| Asian Development Bank (ADB) |
| Bangladesh; Bhutan; Brunei Darussalam; Cambodia; China; Fiji; Hong Kong SAR, China; India; Indonesia; Lao People’s Democratic Republic; Malaysia; the Maldives; Mongolia; Myanmar; Nepal; Pakistan; the Philippines; Singapore; Sri Lanka; Taiwan, China; Thailand; Vietnam. |
| Commonwealth of Independent States: 8 economies |
| Interstate Statistical Committee of the Commonwealth of Independent States (CIS-STAT) |
| Armenia; Azerbaijan; Belarus; Kazakhstan; Kyrgyz Republic; Moldova; Russian Federation; |
| Latin America and the Caribbean: 36 economies |
| United Nations Economic Commission for Latin America and the Caribbean (UN-ECLAC) |
| Argentina; Bolivia; Brazil; Dominican Republic; Ecuador; El Salvador; Guyana; Haiti; Honduras; Nicaragua; Panama; Paraguay; Peru; and Uruguay. Anguilla; Antigua and Barbuda; Aruba; The Bahamas; Barbados; Belize; Bermuda; Bonaire; Cayman Islands; Curaçao; Dominica; Grenada; Jamaica; Montserrat; St. Kitts and Nevis; St. Lucia; St. Vincent and the Grenadines; Sint Maarten; Suriname; Trinidad and Tobago; Turks and Caicos Islands; British Virgin Islands. |
| Western Asia: 12 economies |
| United Nations Economic and Social Commission for Western Asia (UN-ESCWA) |
| Bahrain; Arab Republic of Egypt; |
| Europe and OECD: 49 economies |
| Eurostat and OECD |
| Albania; Australia; Austria; Belgium; Bosnia and Herzegovina; Bulgaria; Canada; Chile; Colombia; Costa Rica; Croatia; Cyprus; Czech Republic; Denmark; Estonia; Finland; France; Germany; Greece; Hungary; Iceland; Ireland; Israel; Italy; Japan; the Republic of Korea; Latvia; Lithuania; Luxembourg; Malta; Mexico; Montenegro; the Netherlands; New Zealand; North Macedonia; Norway; Poland; Portugal; Romania; the Russian Federation; |
| Special participation: 3 economies |
| Georgia; the Islamic Republic of Iran; Ukraine. |
4.ICP partnerships in action
The ICP is a multi-faceted exercise, involving daily inter-agency interactions and statistical activities across the world. This section highlights examples of how the Program’s focus on coordination and collaboration addresses statistical capacity building, technology and tools, and knowledge sharing and finds innovative solutions across all regions and at the global center.
4.1Statistical capacity building
The collaborative nature of the ICP provides many opportunities for beneficial statistical capacity building in both participating and nonparticipating economies. Delivered by the RIAs, the ICP Global Office, and expert consultants, bespoke training has been made available to NIA staff on price statistics, national accounts, and data collection and validation methodologies through ICP workshops and in-country technical assistance. The 2020 ICP Annual Report2020 gives details, for example, of the nine regional and sub-regional workshops and twenty technical assistance meetings that were held in person over the year prior to the onset of the COVID-19 pandemic. These events have been successfully conducted mainly online since that time, with the virtual platform providing an opportunity for more staff to attend than previously.
Within the Africa region, for example, the AfBD uses the ICP as the main framework for its statistical capacity building strategy. AfDB collaborates with the United Nations Economic Commission for Africa Center for Statistics (UNECA), Afristat, the Common Market for Eastern and Southern Africa (COMESA), central banks, subregional organisations, and statistical training centers to deliver specific training and webinars on price data collection for the ICP and other surveys such as CPIs, and on national accounts expenditures and the calculation of cost-of-living indexes. As one of the recipients of capacity building in the region, Uganda’s national ICP team has articulated2121 the appreciation of many economies by noting that the opportunity to consult with, and learn from, price statisticians and national accounts experts from across the globe, and attendance at regional ICP meetings, has expanded the team’s technical skillset and knowledge in the areas of PPPs and their computation, price level indexes, and comparable measures of GDP. The team noted that this has helped towards achieving one element of United Nations Fundamental Principles of Official Statistics (Principle No. 10), which states that “Bilateral and Multilateral cooperation in statistics contributes to the improvement of systems of official statistics in all countries.” Furthermore, the quality of the Ugandan CPI has improved through their involvement with the ICP through increased product coverage, wider coverage of both outlet types and concrete outlets, the use of the international classification of goods and services, enhanced data collection techniques, and improved computation.
Similar sentiments2222 have been echoed by teams around the world, for example, those in Mexico, South Africa, China, India, Thailand, Austria, Indonesia, and Nepal, who also referenced improvements to national accounts compilation as a benefit of ICP collaboration.
In Western Asia, the ICP team at UN-ESCWA has enhanced the use of price statistics in the region by developing new statistical outputs under the umbrella of the ICP, adding to the knowledge and capacity of NIAs. First, the Harmonized Consumer Price Index and its computation methodology was developed as an integration of CPI and ICP processes. Pilot results were successfully computed and published for the time series extending from 2011 onwards for a group of six economies and collaborative work is now underway on the production of the index for all ESCWA member states. UN-ESCWA and the United Arab Emirates have collaborated on the production of subnational PPPs, which is now being extended to other economies in the region. Furthermore, UN-ESCWA moved to annual PPP production a few years ago, and therefore requires price data on an annual basis. To facilitate this, prices for items on both CPI and ICP household consumption lists are used with remaining items covered through extrapolation using detailed CPI data as part of CPI-ICP integration. For administrative surveys, such as government compensation, data are collected annually from administrative records. Private education and rentals data are also collected annually, as most economies have synergies between CPI items and ICP items for these surveys. Finally, for machinery and equipment and construction, economies have built partnerships with specialized companies to provide them with the required data. National Accounts expenditure data are also compiled on an annual basis using the ICP’s Model Report on Expenditure Statistics (MORES).
Economies in the region have provided feedback on the impact of the Program, with Saudi Arabia noting “program participation has a key role in enhancing the statistical capacity building associated with the calculation of ICP indicators, which helps countries to measure the evolution of their statistics in comparison with other participating countries.” Morocco identified “the 2017 ICP round (as) an opportunity to modernize national statistical prices and national accounts and to take full advantage of the international statistical capacity building program.” The ICP team in West Bank and Gaza said “ICP activities contributed to enhancing the experiences gained by the national team: for example, it increased efficiency in time and cost management, it established strong relationships with data providers, and it helped improve data quality of price surveys.” Lastly, Iraq noted that “PPPs are considered one of the major tools used in decision-making and in designing socioeconomic policies.”
A number of economies that do not fully participate in the ICP have benefitted from attending and observing ICP workshops and inclusion in regional outreach. UN-ESCWA’s technical assistance efforts led to the participation of Lebanon and Syria in the ICP 2021 cycle. Similarly, Uzbekistan participated on an experimental basis in the ICP 2017 cycle through CIS’s regional program and has joined as a full member for the 2021 cycle, while Turkmenistan continues to receive ICP operational materials and invitations to workshops from CIS-STAT. Cuba anticipates joining the ICP in coming years, as stated in the country’s Development Strategy for 2021 to 2025, and the economy currently participates as an observer in UN-ECLAC ICP activities. AfDB extends ICP capacity-building efforts to Eritrea, Somalia, South Sudan, and Libya. Lastly, Georgia and Ukraine participate in the ICP supported by Eurostat, while Iran joined the 2011 and 2017 cycles through special participation arrangements.
The PPP eLearning course “The Fundamentals of Purchasing Power Parities”2323 extends the reach of ICP statistical capacity building. The course was created by the ICP Global Office in collaboration with the RIAs who shared early drafts with potential students at regional workshops. It introduces the concepts, data requirements, methodology, uses, and applications of PPPs and provides a comprehensive overview of the ICP. Many NIAs use it to train staff and enhance understanding of the methodologies underlying the Program. For example, the National Bureau of Statistics of China has translated the course, launched the “Chinese Version of PPP Video Teaching Materials”, and actively organized and carried out education and training for ICP staff.
The ICP stakeholders work together to respond to new circumstances by applying best practice and knowledge. When the COVID-19 pandemic jeopardized statistical activities across the globe, the ICP Governing Board decided to postpone the ICP 2020 cycle to reference year 2021 in order to mitigate implementation risks to the Program. Nonetheless, NIAs reported ongoing disruptions to ICP processes due to outlet closure and restrictions on field collectors’ movements and were cognizant of the ramifications of the pandemic on price and expenditure trends. The ICP Global Office and RIAs, through the IACG, responded by releasing guidelines on collecting and validating price [4], expenditure [5], and private education [6] data during the COVID-19 pandemic to help guide countries in adapting to this new scenario while meeting ICP requirements. Additionally, the ICP metadata and data surveys have been updated to collect more information about the circumstances of price collection and cover COVID-19-specific items across the different regions.
Furthermore, two new methodological guides for NIAs were published in 2021. The first was a guide on integrating consumer price index processes with those of the ICP [7], authored by experts from Statistics South Africa and the University of Queensland, with case studies from India, Israel, South Africa, and the United Kingdom. The second was a guide on compiling subnational PPPs [8] authored by experts from the University of Florence and the University of Queensland, with case study contributions from Italy, the United Kingdom, the United States, and Vietnam.
4.2Technology, tools, and data sources
The ICP research agenda includes an item on “Exploring Innovations in Technology and Data Sources for PPP Measurement”.2424 This recognizes that the world is witnessing a major technological revolution, which is influencing both the way consumers purchase goods and services, and the availability of large-scale databases with information on prices and quantities of each transaction recorded at the point of sale. There is scope and need to modernize ICP processes beyond the traditional survey approach; availability of scanner data, the possibility of collecting prices through web-scraping, the use of portable devices that can record the location and record product characteristics at the time of price collection, and possibly crowdsourcing of price data collection offer a range of alternative sources that are being used or explored further. Research will focus on assessing quality of the prices from alternative sources using standard ICP data validation methods and comparing price levels and dynamics between CPI and ICP price collections with the alternative sources.
In terms of technology, a collaboration of Eurostat and its participating economies resulted in an information system designed to support the full life cycle of Eurostat PPP Programme. It encompasses an item list management tool, a price data entry tool, a validation tool, and a PPP calculation tool, alongside functionalities to reflect different data sources as well as other specificities. One of the most notable benefits of the system, alongside cost effectiveness and better data quality, is that it has improved the timeliness of the surveys due to the efficient collaboration of experts.
Two elements of this information system have been adapted for global ICP purposes. First, the item list management tool was modified to facilitate ICP surveys across all regions. It allows the RIAs and the Global Office to collaborate in an iterative way, through communication and the exchange of proposals, on the global core list of items to be surveyed. Second, the validation tool facilitates inter-regional validation interactions between the RIAs and the Global Office, through various analytical tables, views, and functionalities. These now global tools illustrate the benefits of ICP collaboration – adapting Eurostat’s bespoke approach to facilitate country-specific processes while supporting inter-agency coordination and management.
Other tools have been developed by ICP stakeholders to improve data quality in national accounts compilation, and in housing volume and housing rental data. Advanced data visualization software has also been used in meetings of the IACG and in regional validation workshops.
A regional example of collaboration on tools and technologies are those developed by the ADB ICP team in conjunction with regional NIAs which have strengthened the efficiency of ICP processes in the region. First, the ADB developed the ICP Asia Pacific Software Suite (ICP APSS) for the ICP 2011 cycle to effectively manage data quality in the region’s participating economies. NIAs utilize it for data entry and for data editing and validation checks for ICP price surveys of household items, construction, machinery and equipment, housing rental, and government compensation, thus allowing smooth management and cleaning of data prior to submission to the ADB. Second, the ADB and ICP teams in Vietnam, Fiji, and Mongolia are currently piloting a new Computer Assisted Personal Interview (CAPI) tool that streamlines price collection through the use of mobile tablets by field enumerators. Third, the ICP-CPI mapping tool used in the region guides the process of linking the CPI components with the ICP items and may be used for validation of trends of collected prices for the ICP and promotes the integration of CPI and ICP processes.
An additional example is the development by UN-ESCWA of web-scrapers to modernize data collection methods and ease the burden of field visits for ICP household consumption items and CPI items. This was done through a collaborative pilot exercise with the NIAs in Jordan, the Arab Republic of Egypt, Bahrain, and Kuwait.
4.3Sharing knowledge
Communication is key between the many stakeholders within the ICP partnership, and websites and web pages are maintained by agencies at the global, regional, and national levels to aid timely outreach and sharing of knowledge.
At the global level, the ICP website2525 on the World Bank platform disseminates comprehensive information on all aspects of the programs to both stakeholders and users, including data access and results analysis, governance, research, history, and outreach.
The ICP Asia and the Pacific website2626 provides a regional example of similar purpose; it serves as the region’s main online repository of publications, data customization and visualization, regional events, and detailed information resources. A separate landing page on the ADB website2727 provides information on the ICP basic concepts, uses of the ICP data, and downloadable publications on regional comparisons and statistical tables from the recent 2017 ICP cycle, as well as a blog2828 on results. In this way, ADB provides regional economies with advocacy material to help teams promote the use of ICP results to colleagues and policy makers and justify the importance of participating in the Program. A number of economies in the region also disseminate this ICP information through their implementing agency websites: these include Bhutan;2929 Cambodia;3030 Vietnam;3131 China;3232 Hong Kong SAR, China;3333 Singapore;3434 and Sri Lanka.3535
UN-ECLAC collaborates with partners in the Caribbean Community (CARICOM) to implement the regional program. They deliver information in Spanish and English both through their website3636 and at workshops and events, and the report on 2017 results for the region is published in both languages. Multilingual delivery of information is also necessary in the Africa region, covering both anglophone and francophone economies.
While the Eurostat-OECD PPP Programme releases results on an annual basis, its inclusion in the ICP provided an opportunity to coordinate the release of the Programme’s ICP 2017 results with those of the global results published by the World Bank on May 19, 2020. The Eurostat release package consisted of a press release about the results for the European Union,3737an article in the series “Statistics explained”3838 on PPPs in Europe and the world that included a comparison with the revised ICP 2011 results, and an updated page3939 on international PPPs on the Eurostat website. OECD published a news release4040 on the results for the OECD economies, as well as updated PPPs for selected non-OECD economies from its online database.4141
The periodical ICP Highlights newsletters4242 from the Global Office connect with over a thousand stakeholders and users and provides updates of national, regional, and global activities such as capacity building events, conferences, blogs, data releases, and analyses of results. Each newsletter also lists recent notable uses of PPPs and ICP data, providing ICP teams with material with which to showcase the value and necessity of the Program and its outputs to national policy makers and others. An occasional series in the newsletter presents the work of a particular NIA showcasing the collaborative nature of the ICP, with the teams in Finland,4343 Georgia,4444 India,4545 Saudi Arabia,4646 Uganda,4747 and Vietnam4848 highlighted to date. At the same time, national statistical offices highlight the ICP in their own outreach, with a 2022 Statistics Singapore newsletter4949 being a recent example.
The range of conferences and seminars hosted by various ICP stakeholders across the globe also demonstrates the collective ownership of the Program. CIS-STAT organized a plenary session on purchasing power parity issues at the Moscow 2019 conference “Experiences and Challenges in Measuring Income and Wealth in Eastern Europe and CIS Countries”5050 hosted by the International Association for Research in Income and Wealth (IARIW), in partnership with the Higher School of Economics University. The National Bureau of Statistics of China, through its China International Statistical Training Centre, hosted an ICP International Workshop5151 in 2019 at which around 100 participants gathered to discuss progress of the ICP 2017 cycle in the region, data validation, calculation of purchasing power parities, methodology of comparison-resistant-housing, construction, health and education data, PPPs and the International Poverty Line, and the development of the ICP in China. A seminar on “National Accounts for Latin America and the Caribbean, 2020: Economic Statistics for the Future” devoted a session to the ICP5252 with UN-ECLAC staff presenting the main results of the region’s ICP 2017 cycle and uses of PPPs.
5. Conclusion
Since its establishment in 1968, the ICP has expanded to cover all regions of the world and become one of the world’s largest statistical initiatives. Its main purpose is to produce a means of comparing economies through a common standard – realized through its main output of a set of PPPs. The Program is a great example of how collaboration and cooperation among agencies across the globe working within a governance framework can effectively produce a set of international statistics based on a common methodology and shared objectives and build statistical capacity in participating economies.
Notes
7 Ensure link goes to https://thedocs.worldbank.org/en/doc/255521487200449880-0050022017/original/ICPGB01DocGovernanceFrameworkFinal.pdf.
8 Ensure link goes to https://www.worldbank.org/en/programs/icp/brief/gb-membership.
9 Ensure link goes to https://thedocs.worldbank.org/en/doc/550841576791478325-0050022019/original/ICPDataAccessandArchivePolicyDecember2019.pdf.
11 Ensure link goes to https://www.worldbank.org/en/programs/icp/brief/tag-membership.
12 Ensure link goes to https://www.afdb.org/en/knowledge/statistics/statistical-capacity-building.
19 Ensure link goes to https://thedocs.worldbank.org/en/doc/550841576791478325-0050022019/original/ICPDataAccessandArchivePolicyDecember2019.pdf.
20 https://thedocs.worldbank.org/en/doc/269971592839604802-0050022020/original/ICPAnnualReport2020.pdf.
22 Ensure link goes to https://thedocs.worldbank.org/en/doc/935331519945019526-0050022018/original/ICP50PostersWEBICPImpactCountryPerspectives.pdf.
28 Ensure link goes to https://blogs.adb.org/blog/prices-matter-when-tracking-economic-development-and-recovery-after-pandemic.
29 Ensure link goes to https://www.nsb.gov.bt/publications/price-statistic/international-comparision-programme-2/.
32 Ensure link goes to http://www.stats.gov.cn/english/PressRelease/202005/t20200519_1746571.html.
33 Ensure link goes to https://www.censtatd.gov.hk/en/press_release_detail.html?id=4795.
34 Ensure link goes to https://www.singstat.gov.sg/-/media/files/publications/economy/ssn122-pg1-5.ashx.
35 http://www.statistics.gov.lk/Resource/refference/ICP-2017-Final%20Report_Results%20and%20Methodology.
49 Ensure links to https://www.singstat.gov.sg/-/media/files/publications/economy/ssn122-pg1-5.ashx.
References
[1] | Vogel F. Lessons learned about global statistical initiatives from the International Comparison Program. Statistical Journal of the IAOS. (2008) ; 25: (2008): 63–68. IOS Press. |
[2] | World Bank. Purchasing Power Parities for Policy Making: A Visual Guide to Using Data from the International Comparison Program. Washington, DC., World Bank. (2021) . https://openknowledge.worldbank.org/handle/10986/35736. |
[3] | FAO, IFAD, UNICEF, WFP and WHO. The State of Food Security and Nutrition in the World. Rome, FAO. (2022) . https://www.fao.org/publications/sofi. |
[4] | ICP Inter-Agency Coordination Group. Guidance Note: Meeting ICP Price Data Requirements During the COVID-19 Pandemic. Washington DC., World Bank. (2021) . Ensure links to https://thedocs.worldbank.org/en/doc/af6ad75071120c9ccfca6dd50675a270-0050022021/original/ICP-COVID19-Guidance-Note-Prices-2021-02-03.pdf. |
[5] | ICP Inter-Agency Coordination Group. Guidance Note: Meeting ICP National Accounts Expenditure Data Requirements during the COVID-19 Pandemic. Washington DC., World Bank. (2021) . Ensure this (and the text that continues on next page) links to https://thedocs.worldbank.org/en/doc/e9181d17a7f647ed38aecd81ae7adad8-0050022021/original/ICP-COVID19-Guidance-Note-National-Accounts.pdf. |
[6] | ICP Inter-Agency Coordination Group. Additional Guidance Note: Meeting ICP Data Requirements for the Private Education Survey during the COVID-19 Pandemic. Washington DC., World Bank. (2022) . Ensure links to https://thedocs.worldbank.org/en/doc/177ca30a02faafed0e7c6bf6bb5cc7b1-0050022022/original/Additional-Guidance-Note-Covid-19-Private-Education-2022-05-06.pdf. |
[7] | Kelly P, Prasada Rao DS. A Guide to the Integration of Consumer Price Index (CPI) and International Comparison Program(ICP) Production Activities. Washington DC., World Bank. (2021) . Ensure links to https://thedocs.worldbank.org/en/doc/2b29c1445d7fa006e5f4ca00087dbe36-0050022021/original/Guide-CPI-and-ICP.pdf. |
[8] | Biggeri L, Prasada Rao DS. A Guide to the Compilation of Subnational Purchasing Power Parities (PPPs). Washington DC., World Bank. (2021) . Ensure links to https://thedocs.worldbank.org/en/doc/5064f2288436664bc8f9811c8a5b8c55-0050022021/original/Guide-Subnational-PPPs.pdf. |


